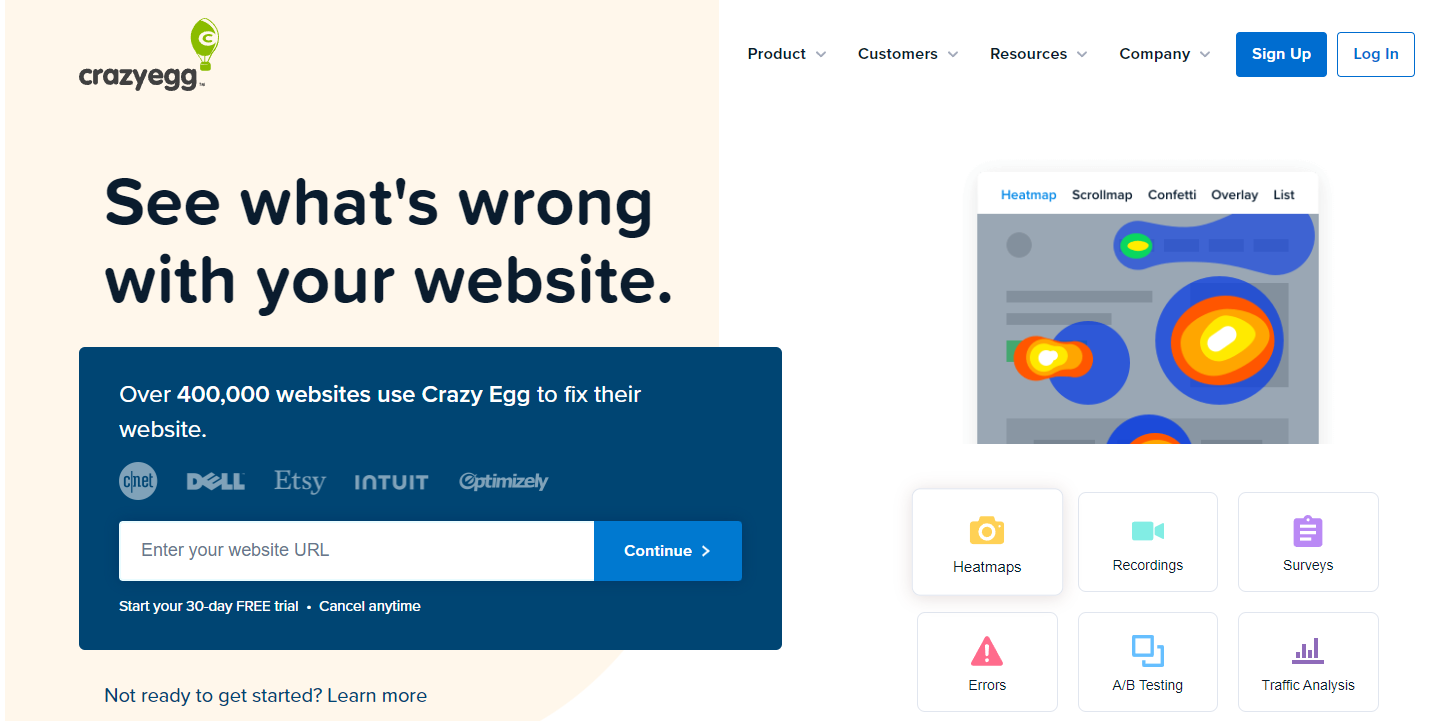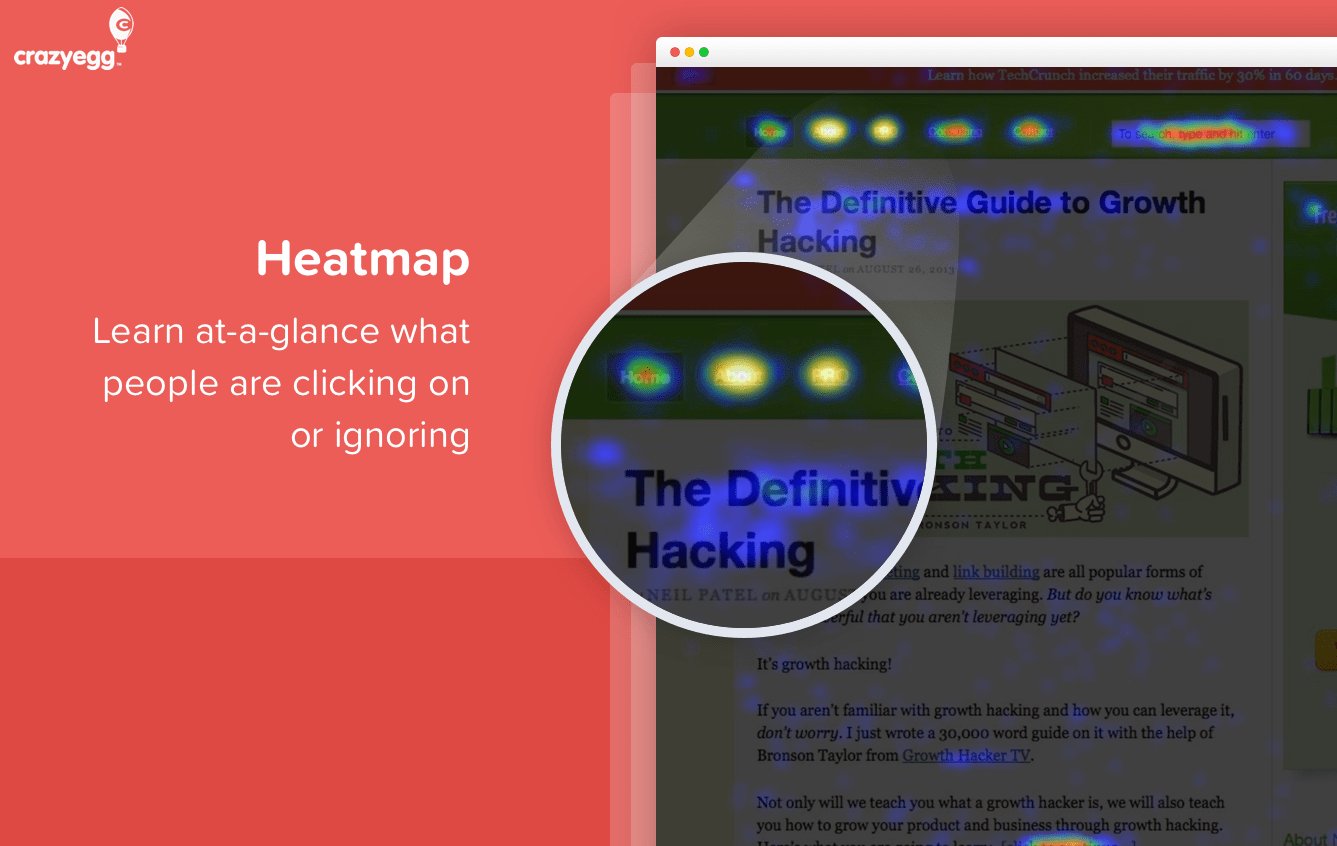
Crazy Egg is a popular website analytics platform that helps businesses track visitor behavior, spot issues in the user session, and improve their user experience and website performance.
However, users have reported some limitations and drawbacks.
Crazy Egg:
- Lacks usability testing features
- Lacks features tailored for native app analytics
- Only allows comparison of two snapshots in heatmaps
- Exports provide only static “screenshots” of data
- Offers strong visuals but lacks detailed analytical capabilities
Some users are also frustrated by the automatic enrollment into an annual subscription, which can be unclear during sign-up. These issues have led many customers to search for Crazy Egg alternatives.
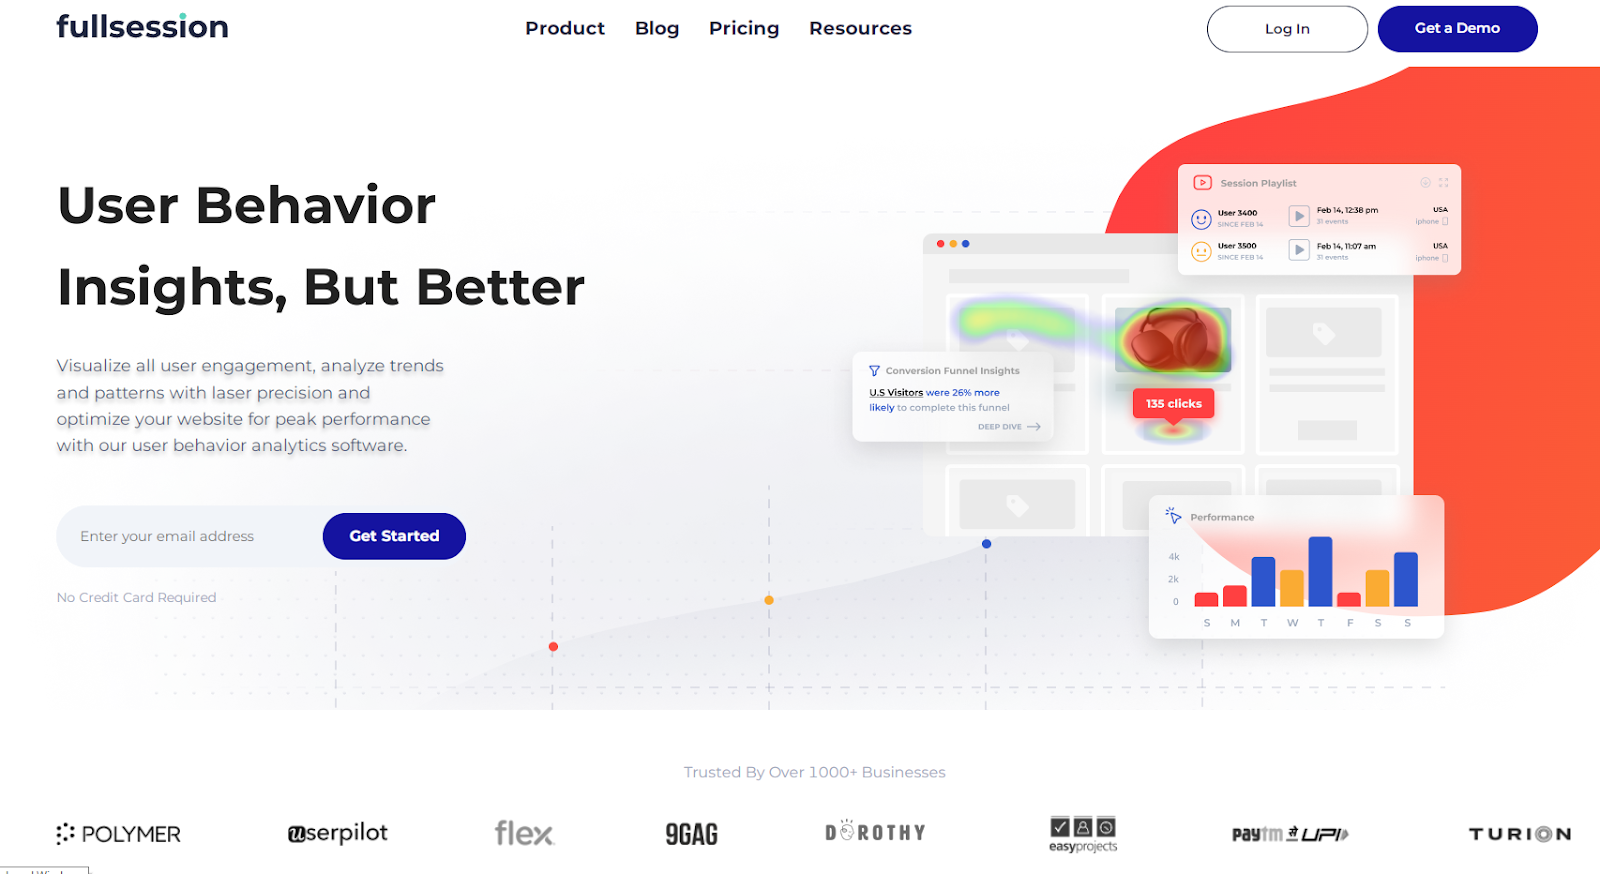
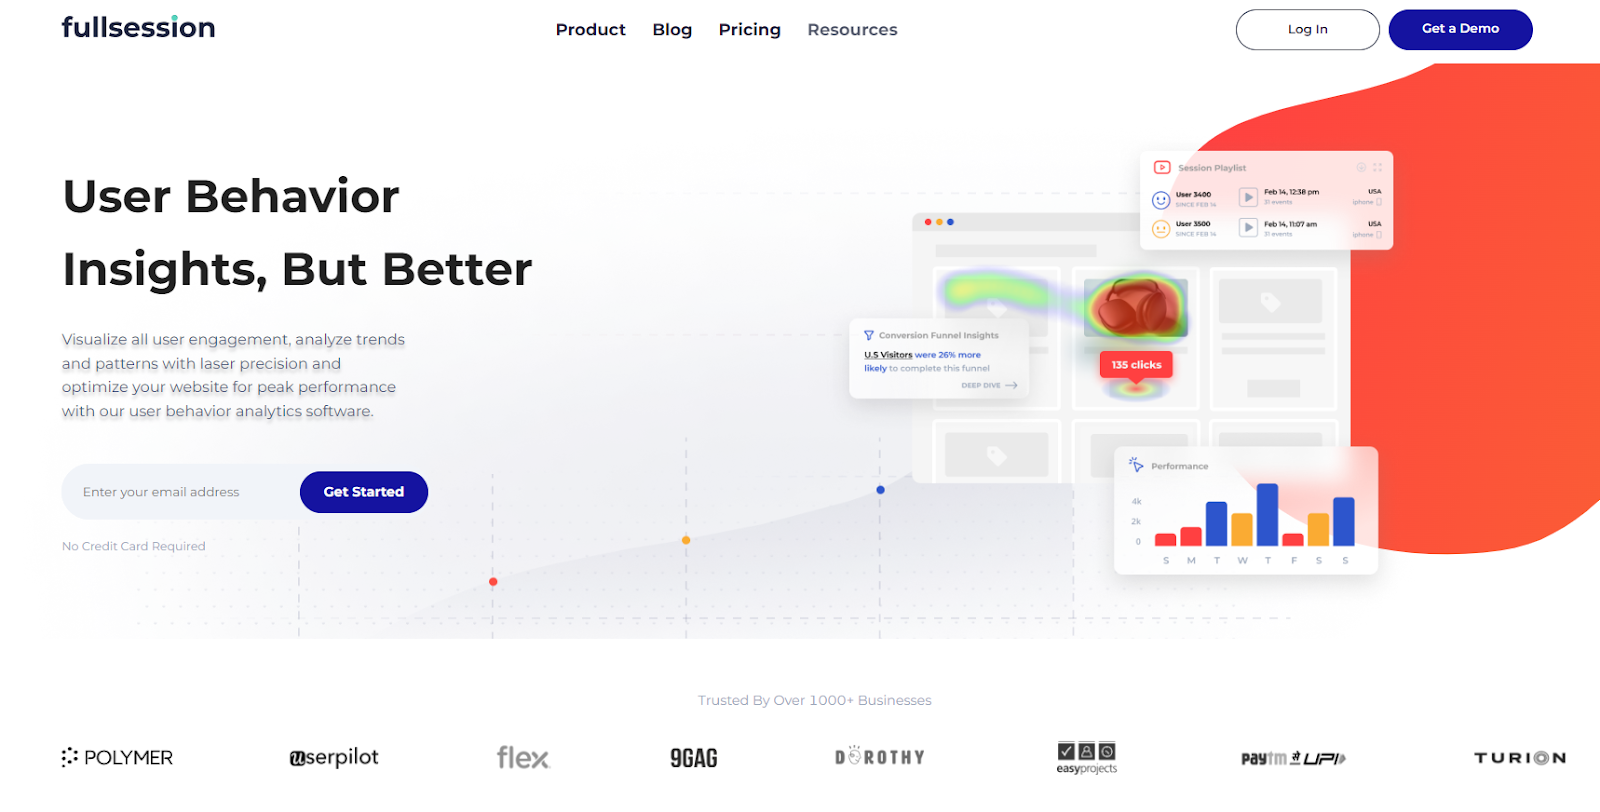
FullSession is one of the best Crazy Egg competitors. Our comprehensive user behavior analytics tools allow you to visualize all user engagement, analyze trends and patterns with laser precision and optimize your website for peak performance.
You can start a free trial or get a demo to learn more and experience the difference firsthand.
In this post, we’ll review the top five Crazy Egg competitors, enabling you to evaluate these best website analytics tools and determine which best aligns with your requirements and business goals.
The Top 5 Crazy Egg Competitors Right Now
After in-depth research, we have selected the following user behavior tools as the top five Crazy Egg competitors:
- FullSession (Get a demo)
- Google Analytics
- Kissmetrics
- LogRocket
- SiteSpect
We’ll evaluate all the tools based on features, integrations, customer support, pricing, pros, and cons.
1. FullSession
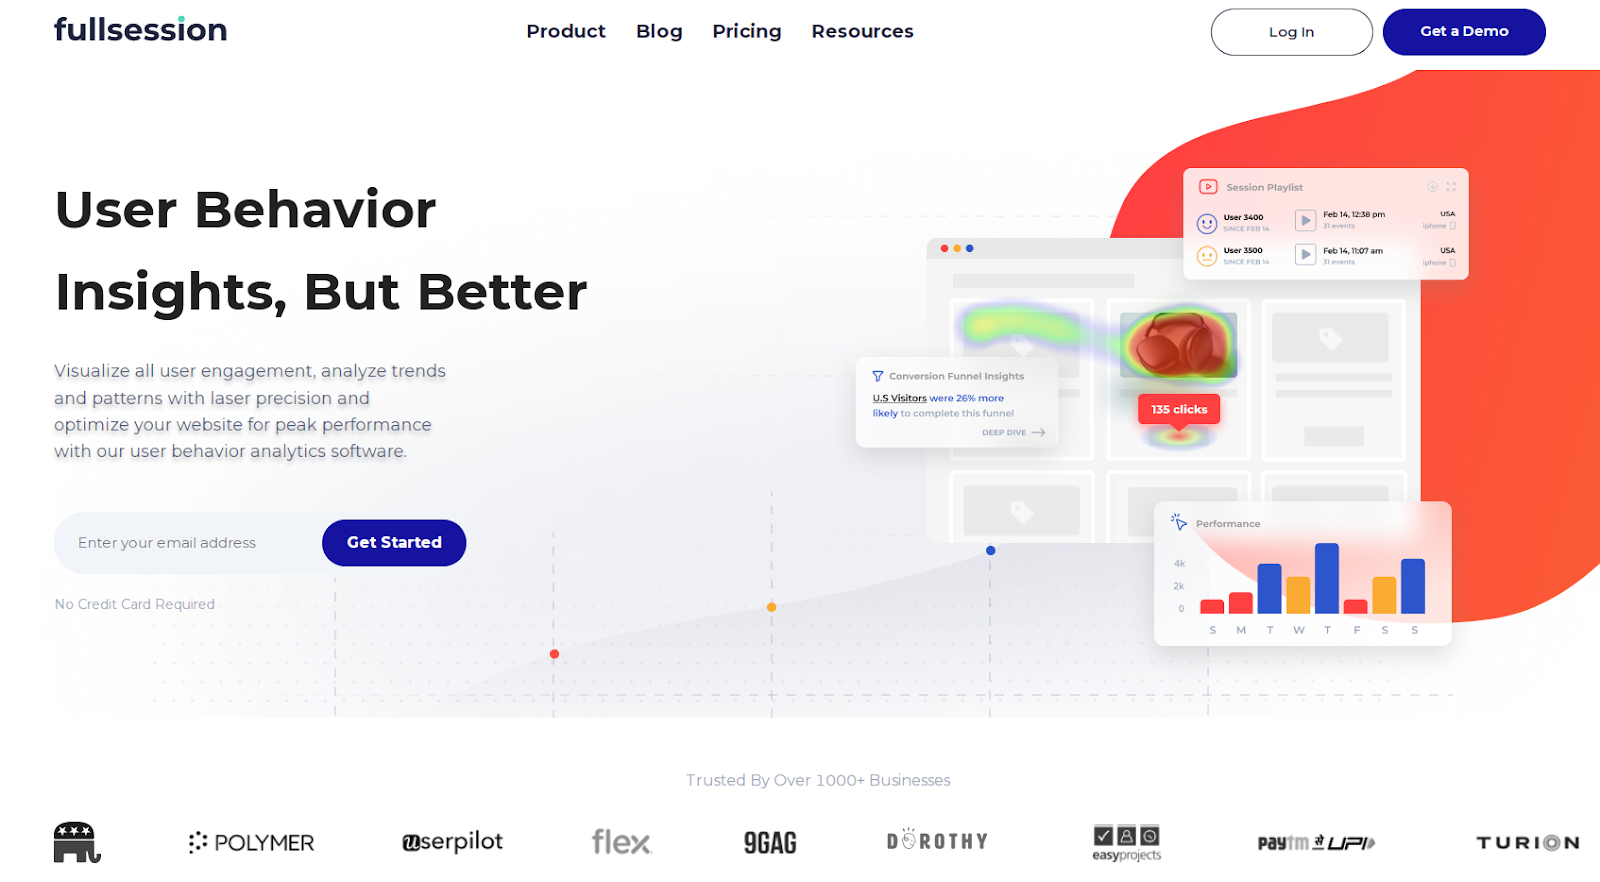
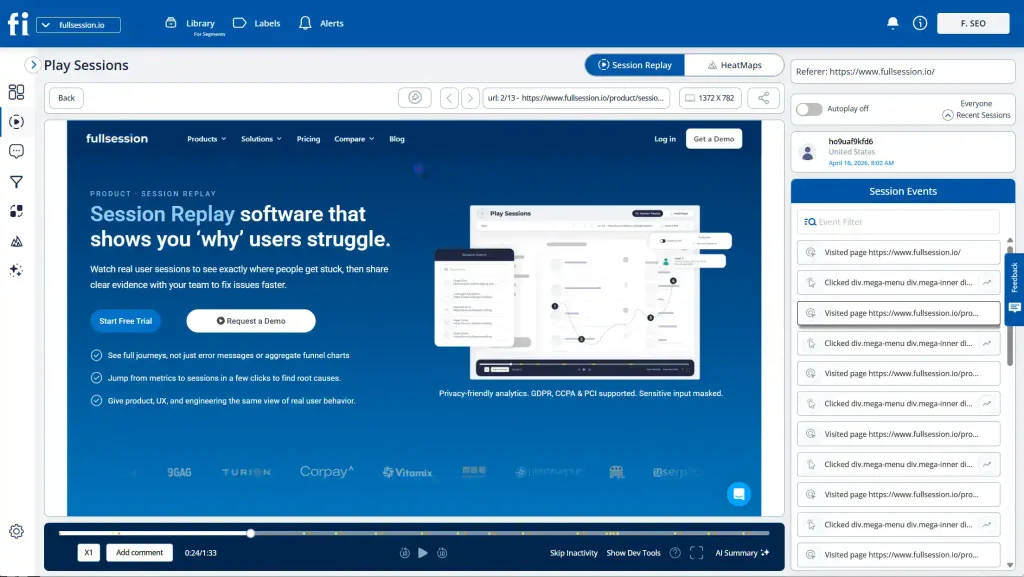
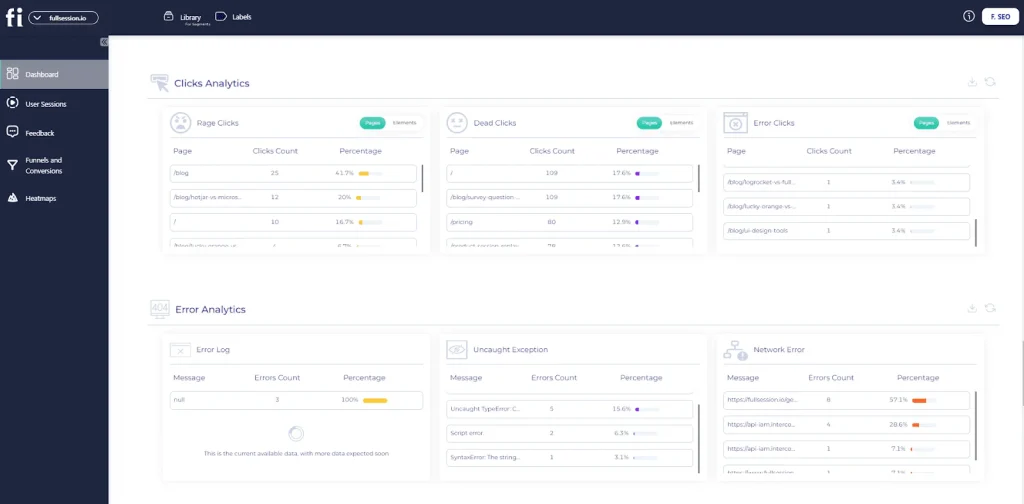
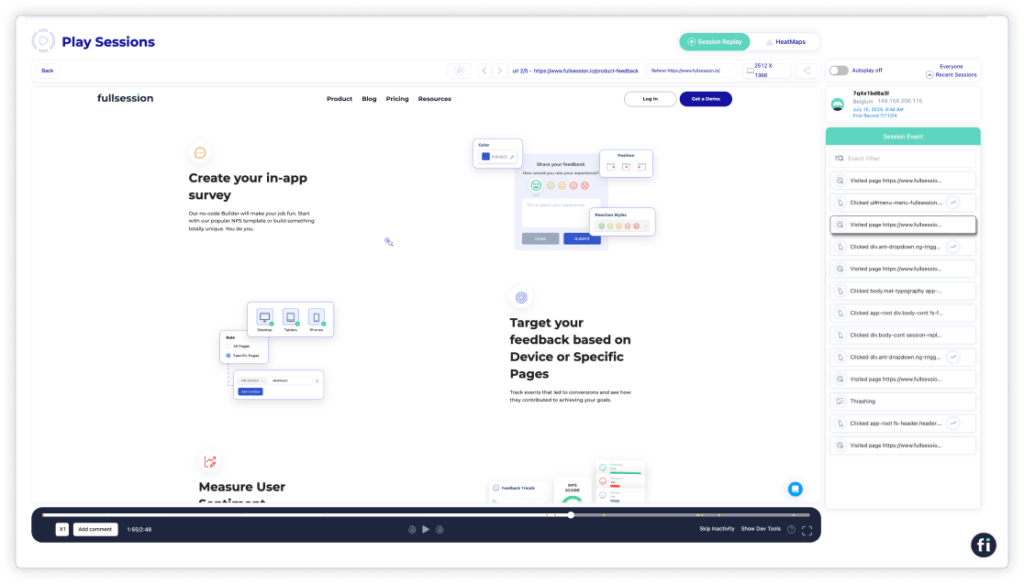
Get a 360-degree view of user behavior data with FullSession. Capture all website visitors’ interactions, analyze trends and patterns in their behavior and optimize your website experience, interface and performance.
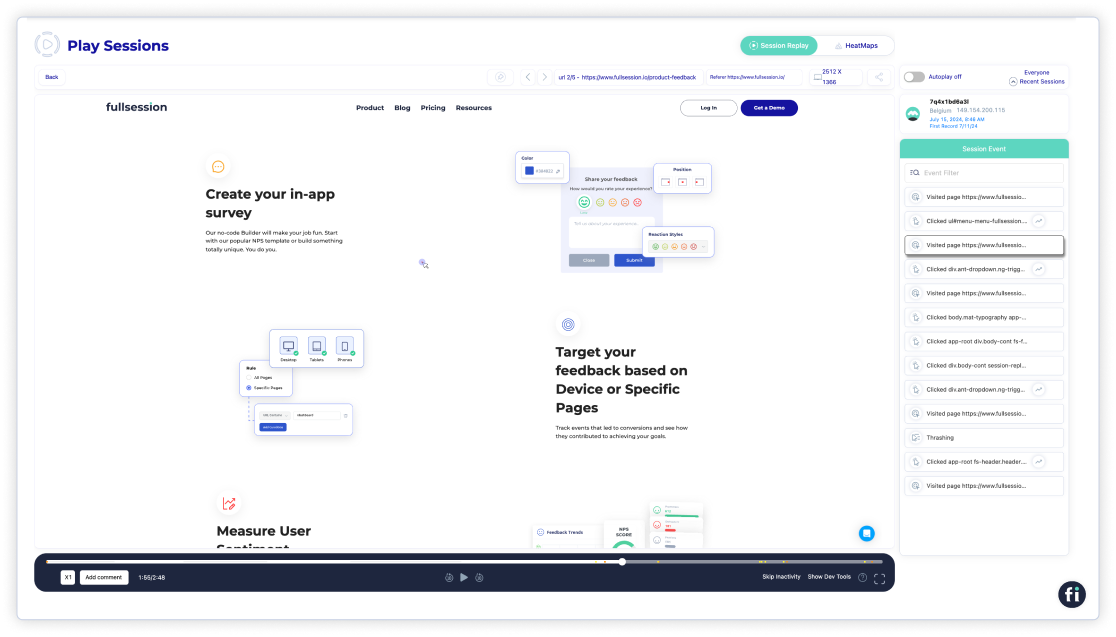
Move beyond stats and surveys and watch real-time user sessions. Analyze how users interact with your site and see every detail of their journey.
Identify inactivity areas, test different page elements, and validate design modifications.
Remove conversion barriers and optimize key touchpoints in your marketing and sales funnels.
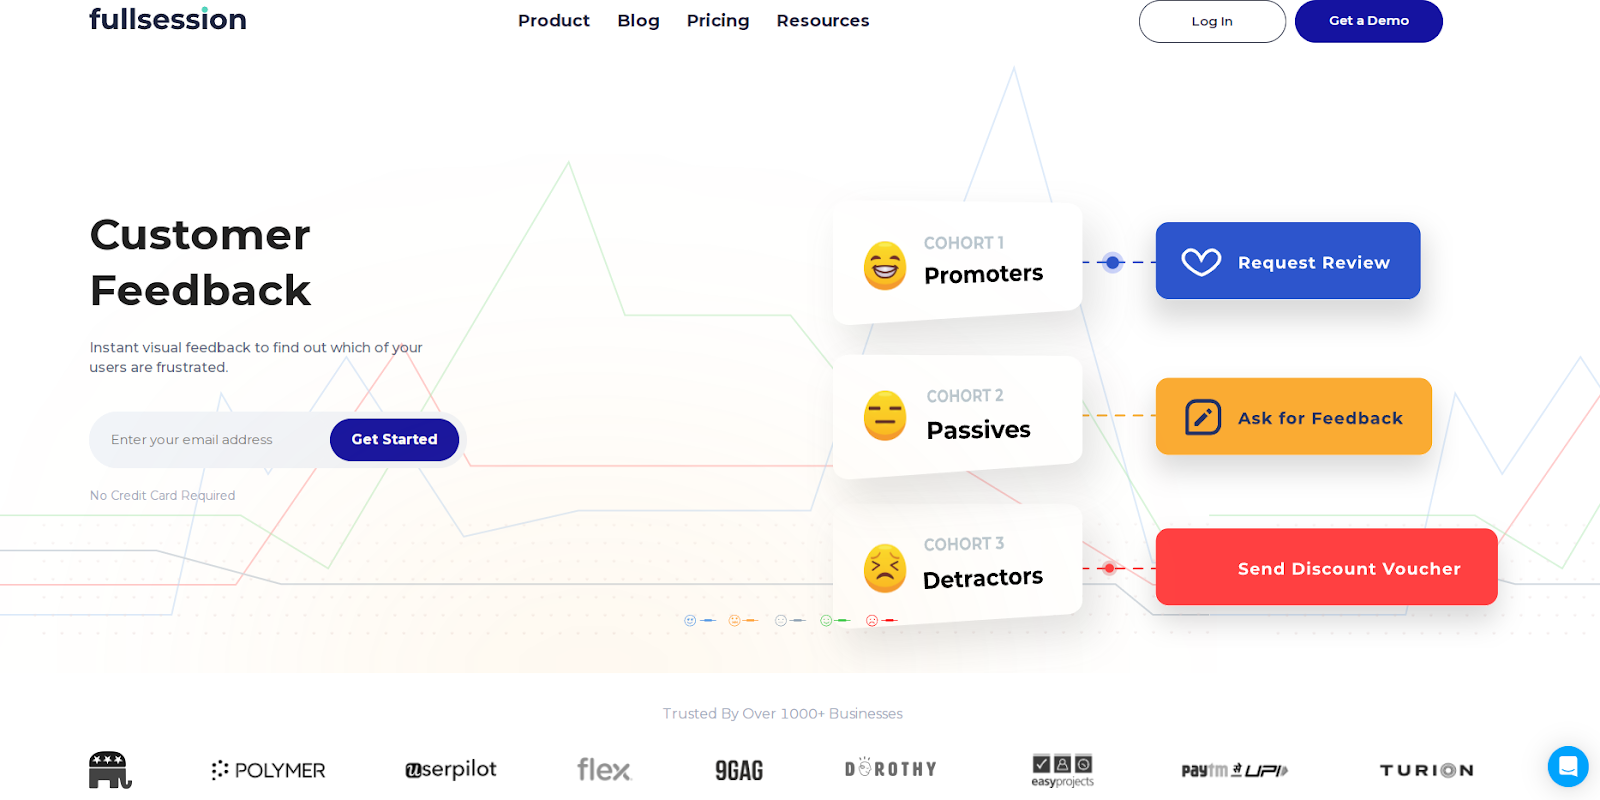
Get direct feedback from users to understand why they are frustrated and take action on recurring issues.
Trust FullSession for behavior analytics. We prioritize user privacy and data security by complying with GDPR, CCPA and PCI standards.
Start a Free Trial to Experience FullSession
Capture all user interactions, spot trends and patterns and drive improvements without compromising your website performance.
Best for
FullSession is the best UX analytics tool for:
- E-commerce businesses
- SaaS companies
- Digital marketers
- UX designers
- Data analysts
- Quality assurance teams
- Product development teams
- Customer support teams
- Customer experience professionals
Key features
- Advanced user and event segmentation: Categorize users by diverse criteria to see patterns and trends in their behavior. Analyze customer journeys to increase engagement and conversions.
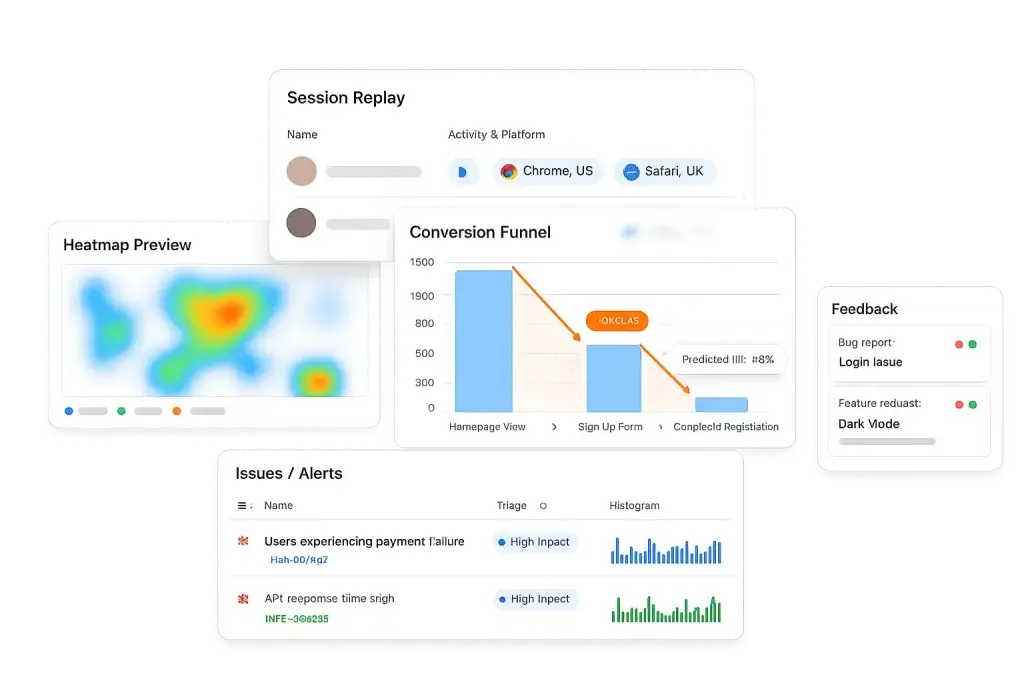
- Session replays: Record user interactions to reveal pain points and predict future behavior while excluding sensitive data from session recordings.
- Interactive heatmaps: Switch between mouse movement, click and scroll maps to see engagement hotspots, test page elements and measure task completion times without slowing down your site. Learn how to read a heatmap.
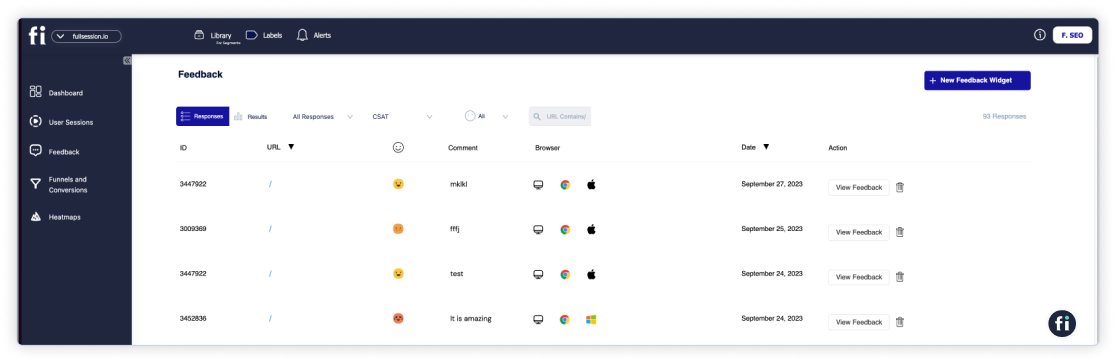
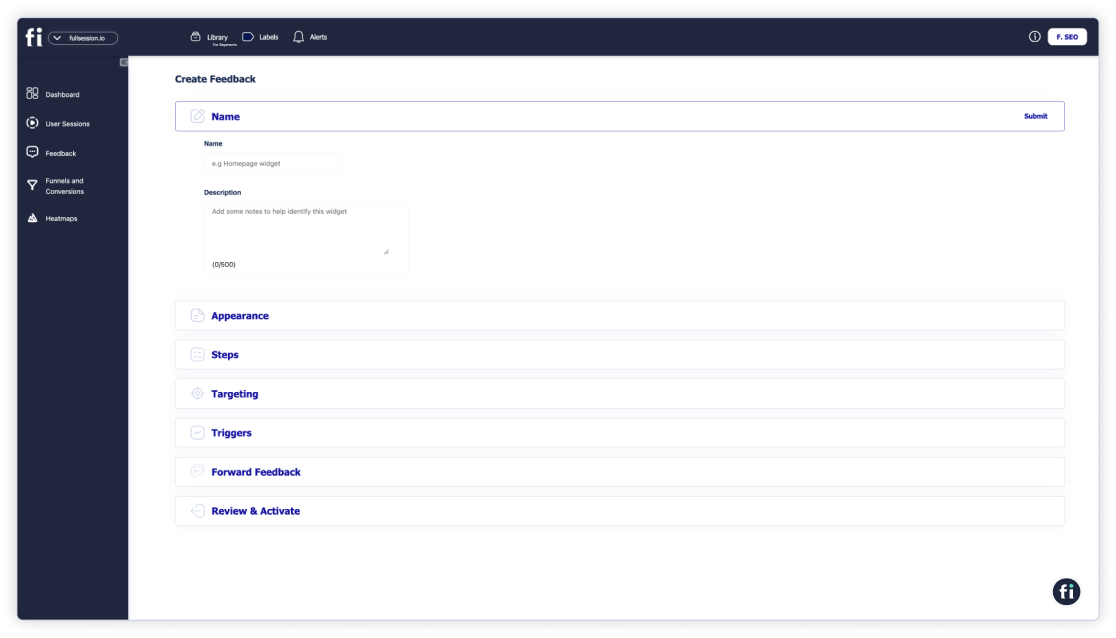
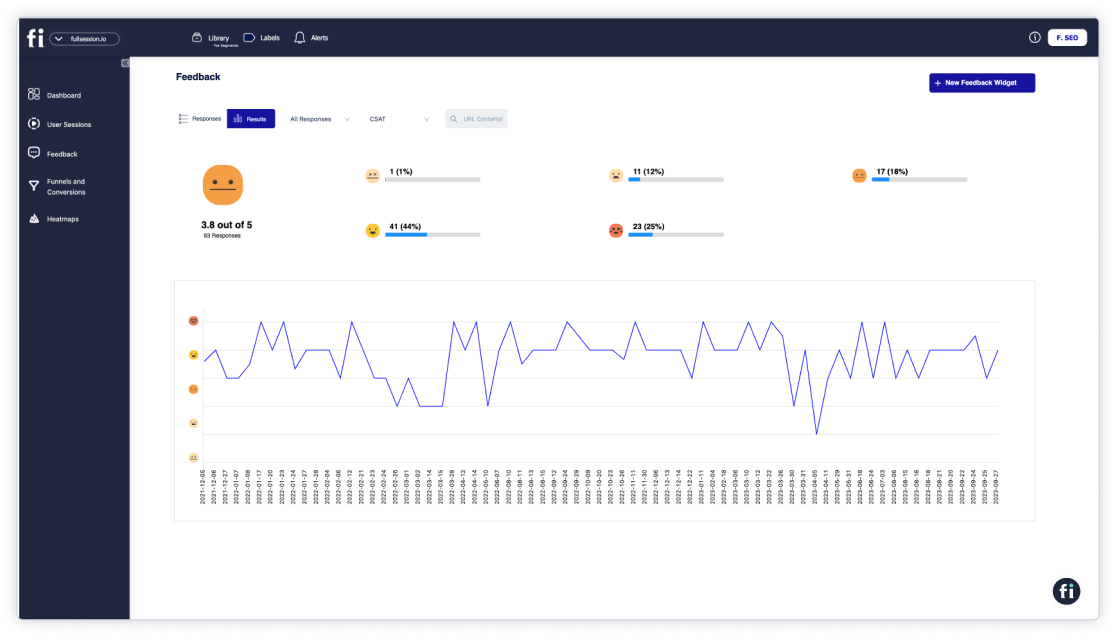
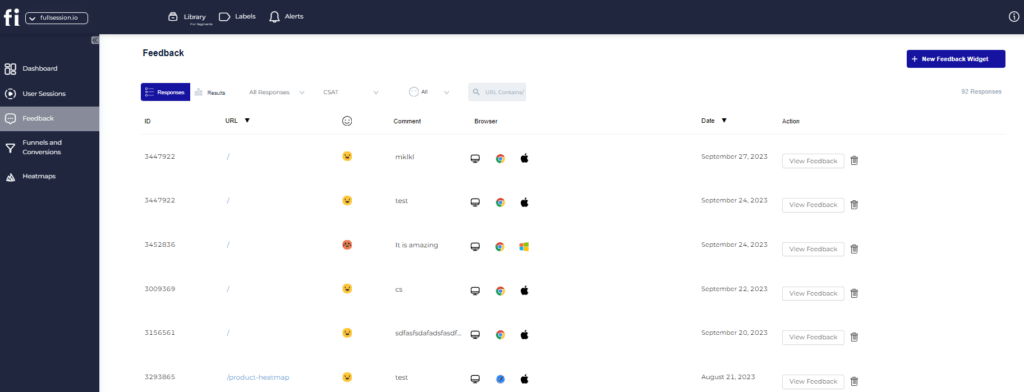
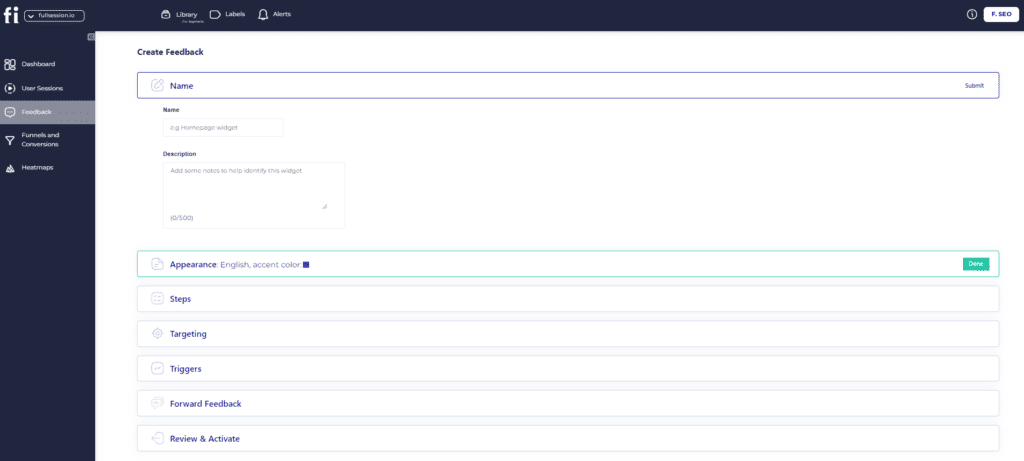
- Customer feedback forms and reports: Create website feedback forms to get customer feedback. Review session recordings to understand feedback context.
- Conversion and funnel analysis: Find patterns in user behavior to understand why users are abandoning your funnels. Visualize drop-offs and test design changes and pop ups to improve conversions.
- Error analysis: Automatically detect website issues like JavaScript errors and network problems. Analyze error data to troubleshoot and prevent damage to the customer experience.
Supported platforms
FullSession supports website tracking, progressive web applications (PWAs) and mobile websites.
Integrations
FullSession works with your entire tech stack. It integrates with open APIs, modern web hooks, and Zapier and also provides native integrations. It works best with Shopify, WordPress, Wix, and BigCommerce.
Customer support
FullSession provides live chat and email support. You can also visit the help center.
Pricing
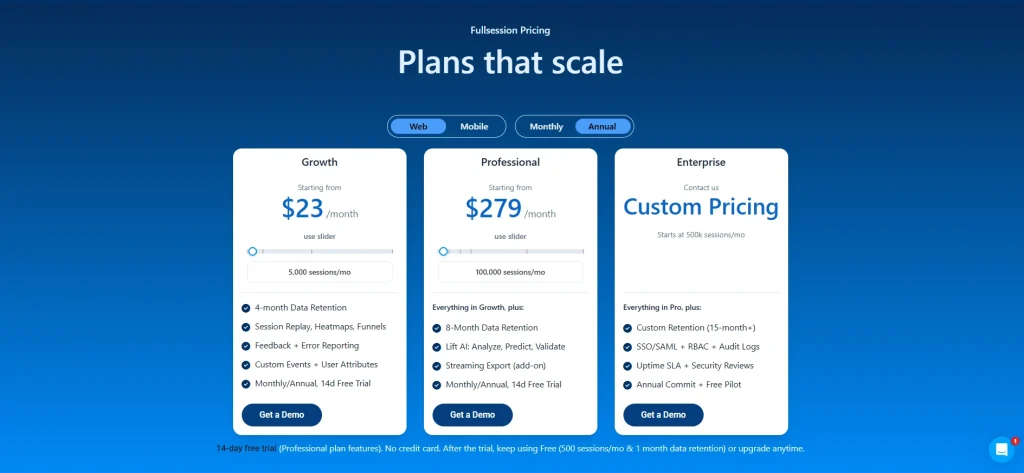
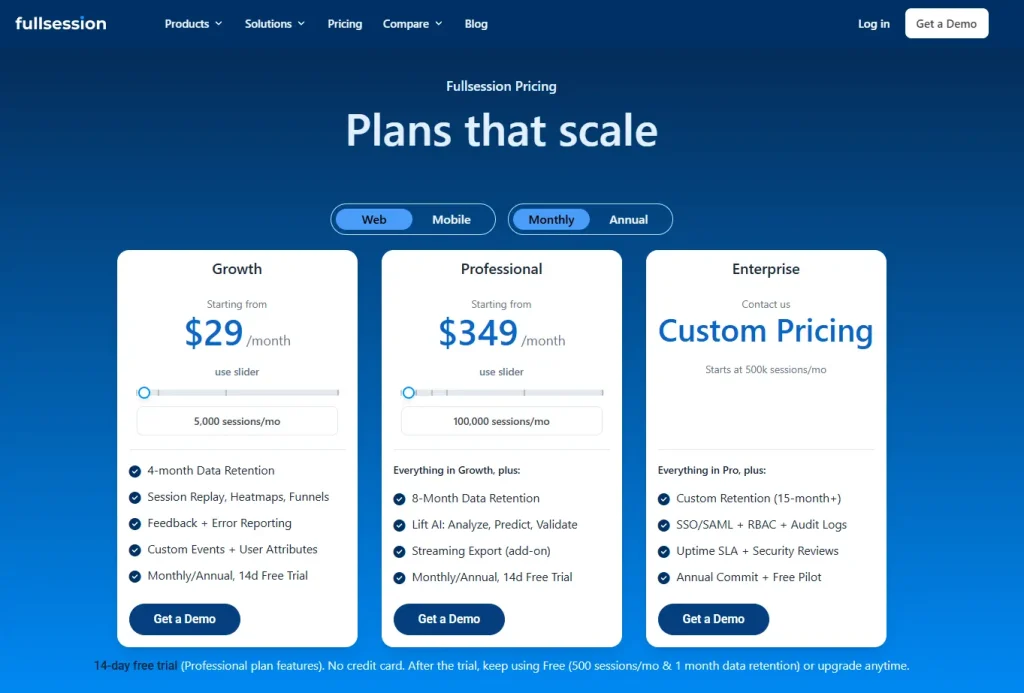
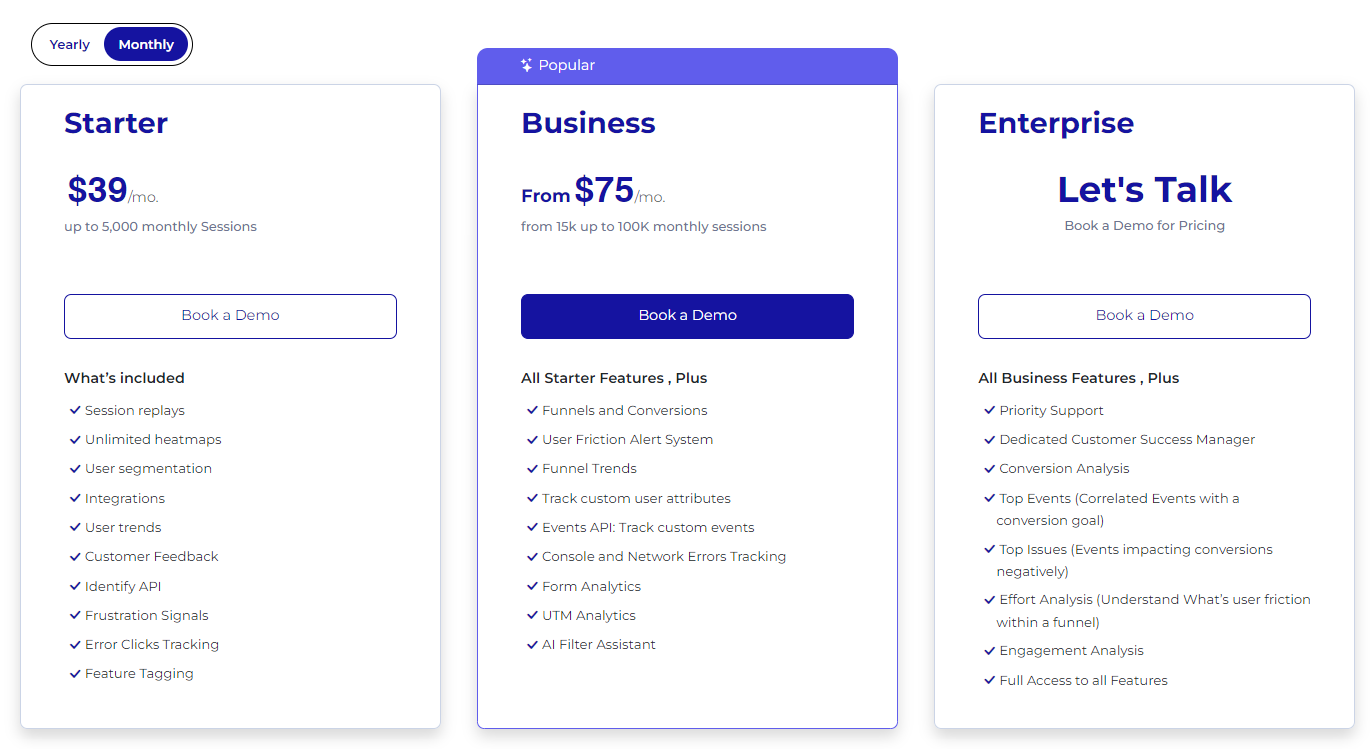
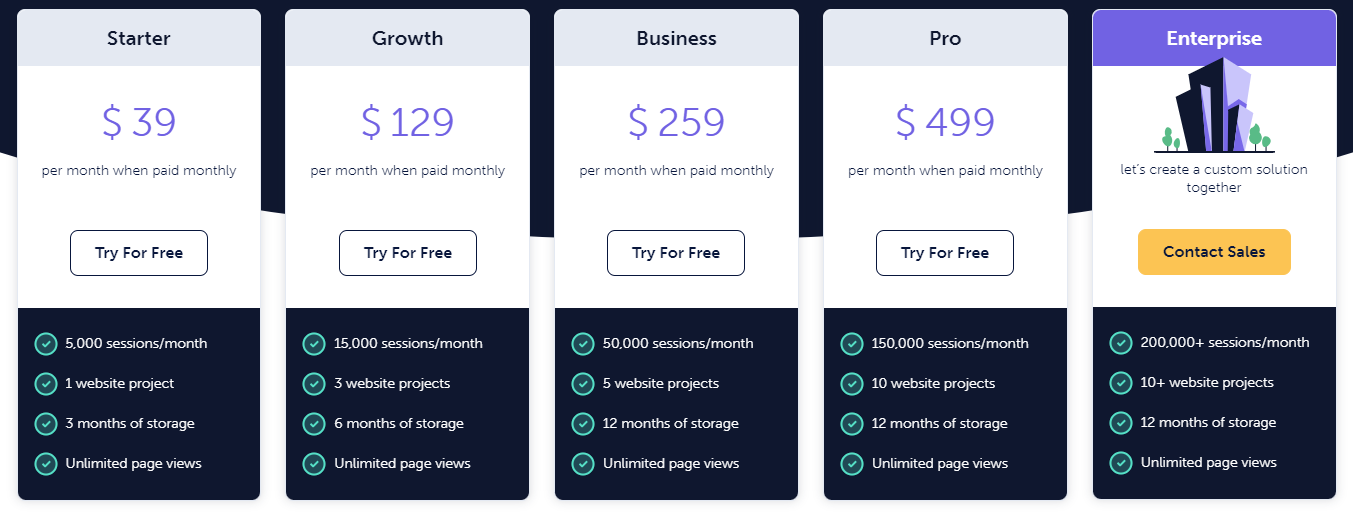
We offer a free trial and three pricing plans—Basic, Professional and Enterprise— to suit businesses of all sizes, from startups to large corporations.
This flexible structure means you can start with a plan that fits your current needs and scale up as you grow, so you only pay for what you use.
The entry-level paid plan includes all the essentials, unlimited heatmaps and session recording for up to 5,000 monthly visits for just $39 per month. You can use advanced analytics without breaking the bank.
We also offer 20% off all plans for annual billing.
Our platform integrates with popular e-commerce and content management systems like Shopify, WordPress, Wix and BigCommerce. You can get up and running without any extra setup costs.
For more info, check out our Pricing page.
Pros
- Track dynamic elements in real time for precise user insights
- Accelerate heatmap processing with zero impact on site speed
- Protect user privacy by excluding sensitive data recording
- Manage extensive data sets effectively and quickly reveal key insights
- Limit user behavior tracking to your site, preventing data misuse
- Facilitate cross-team collaboration and unify team efforts on one platform
Cons
- FullSession doesn’t work with native mobile apps
Visualize, Analyze, and Optimize with FullSession
See how to transform user data into actionable insights for peak website performance.
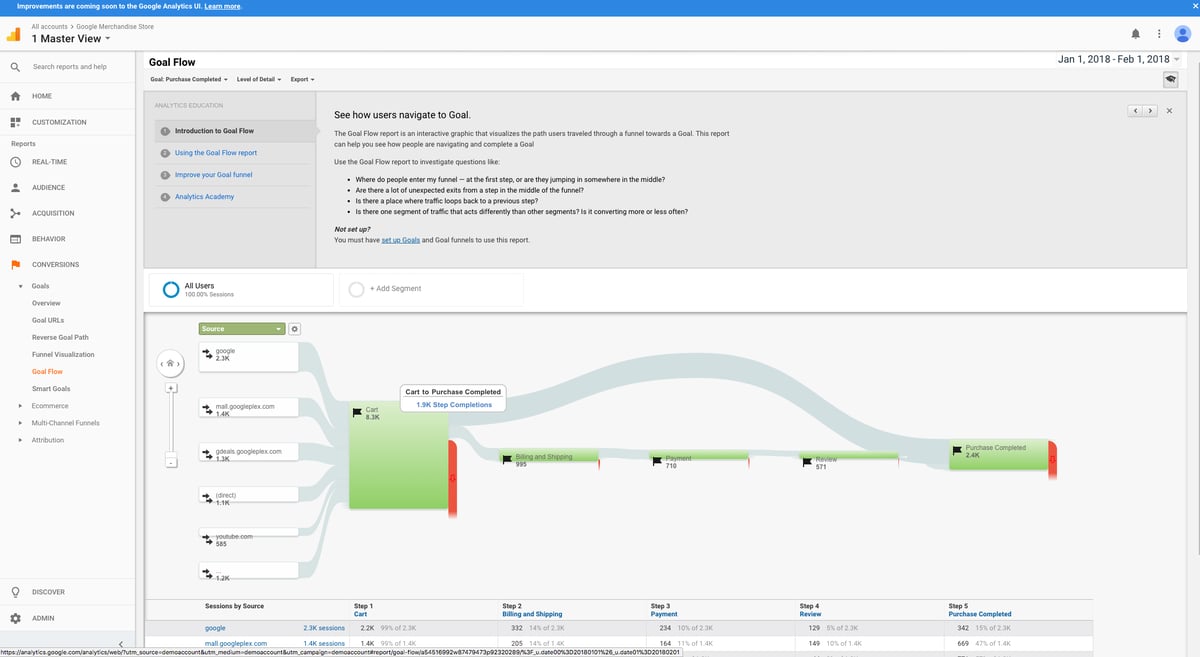
2. Google Analytics
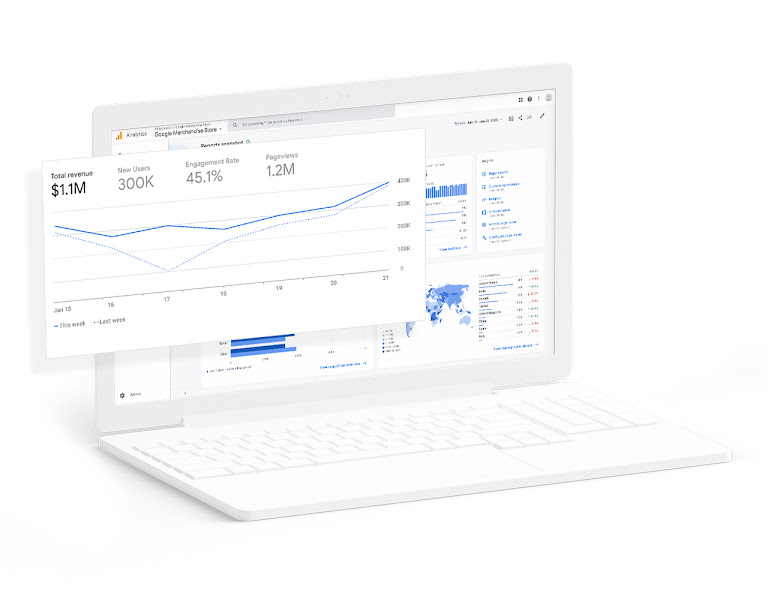
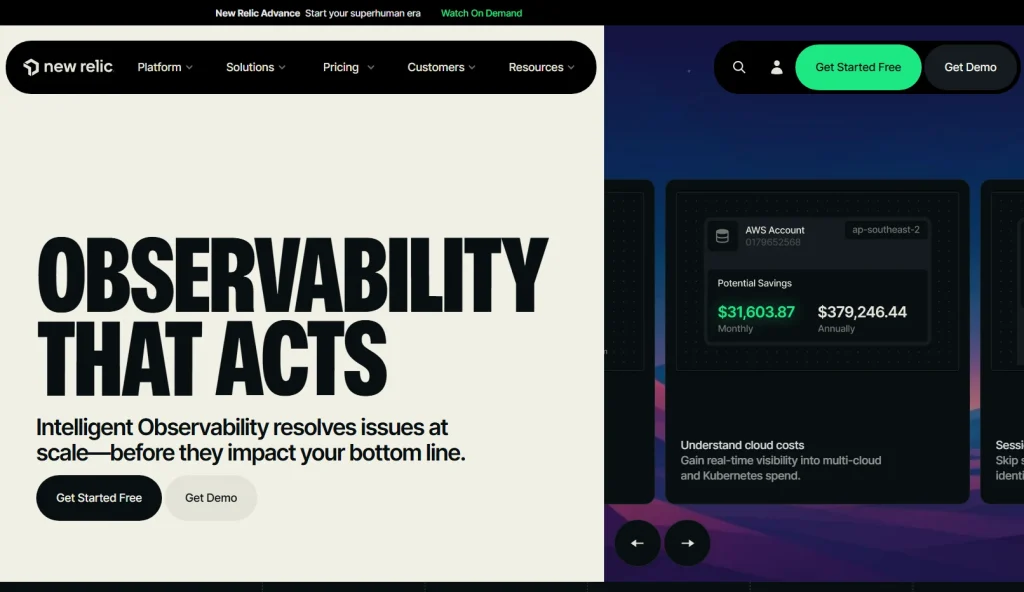
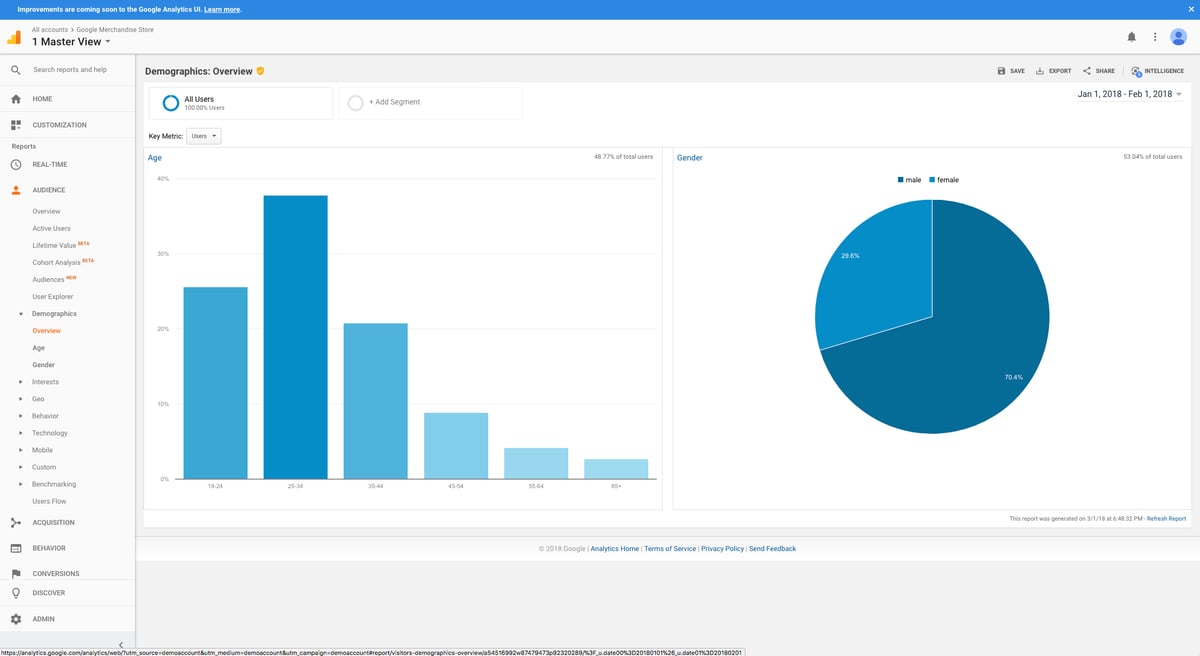
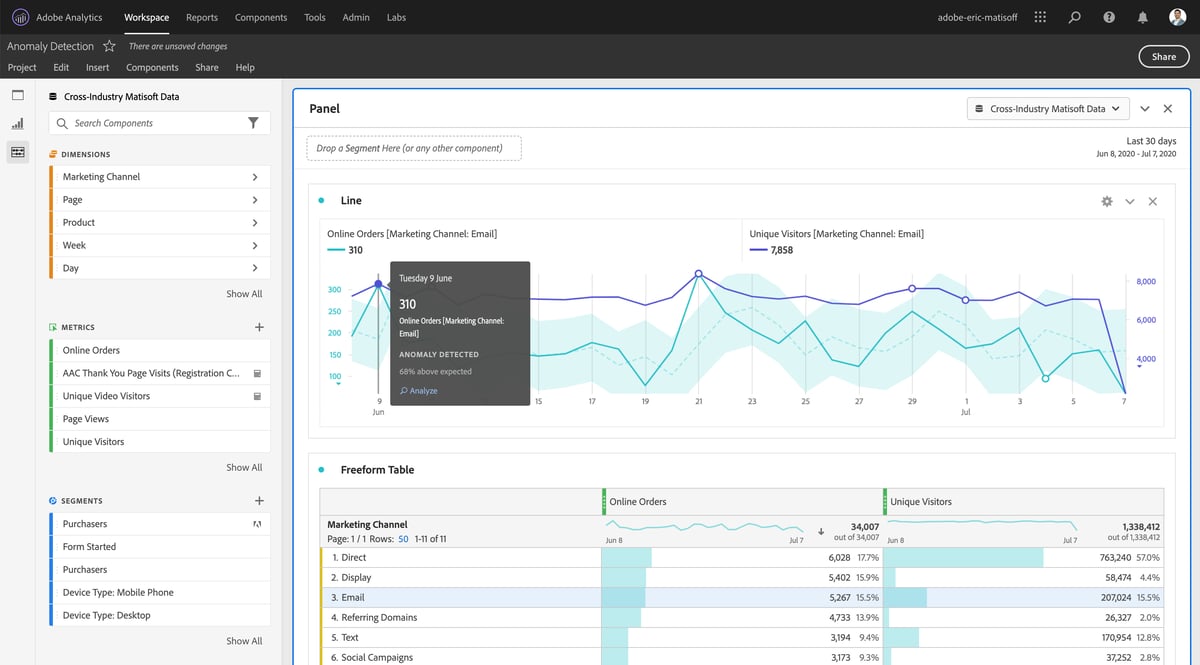
Google Analytics is a free tool for web and app analytics offered by Google. It helps you track and report website traffic, user engagement, and app performance.
The latest version, GA4, provides improved capabilities for understanding user interactions across platforms.
Learn more:
Best for
Google Analytics is a good option for marketers, online businesses, developers and business intelligence professionals.
Key features
- Event tracking: GA4 uses an event-based model to track user interactions more flexibly than previous versions.
- Cross-platform tracking: Enables businesses to analyze user journeys across web and mobile platforms.
- Audience segmentation: Allows for creating custom audiences based on user behavior and demographics.
- Predictive insights: Uses machine learning to forecast future user actions and trends.
Supported platforms
Google Analytics supports web and mobile platforms.
Integrations
You can integrate Google Analytics with Google Ads, BigQuery, Google Tag Manager and other Google marketing tools or third-party apps like WordPress, Marketo, Shopify, ZenDesk, and CallRail.
Customer support
Google Analytics provides support via email, knowledge base, FAQs, and chat.
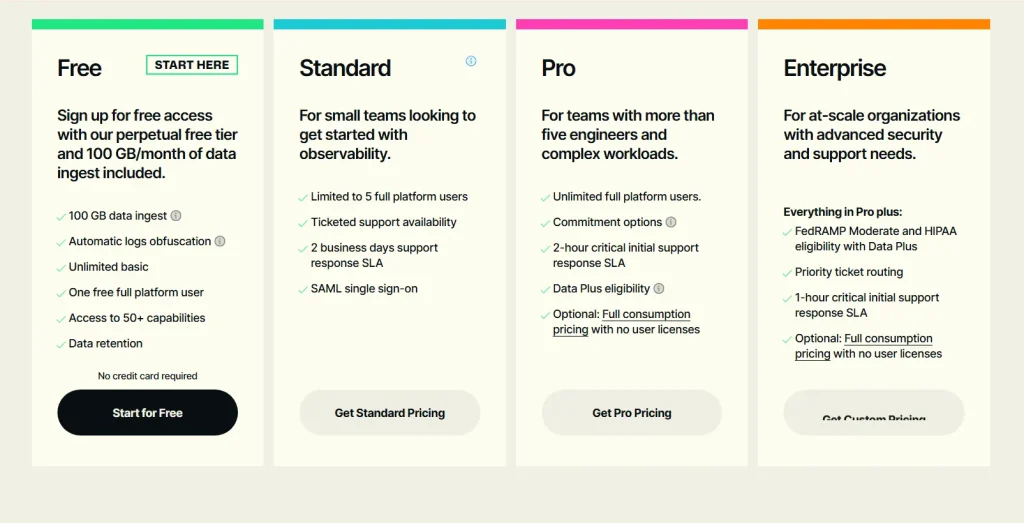
Pricing
Google Analytics is free for most users. However, the premium version, Google Analytics 360, offers advanced enterprise features at a cost that differs based on specific business needs.
It starts at $12,500/month or $150,000/year.
This paid version provides advanced features like attribution modeling, augmented analytics, customizable reports, and more.
Pros
- The standard version is free to use
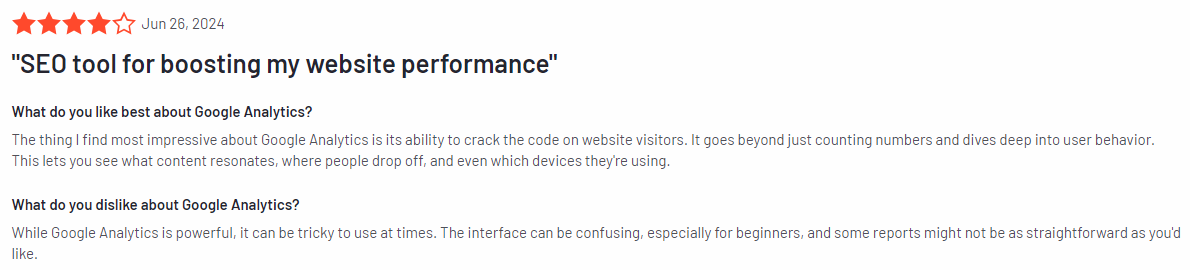
- Provides detailed insights into user behavior
- An intuitive dashboard makes data analysis accessible even for beginners.
- Works seamlessly with other Google products and third-party tools
Cons
- Large datasets may result in sampled data, affecting accuracy
- The wealth of features can be overwhelming for beginners
- Increasing regulations around data privacy may limit tracking capabilities in the future
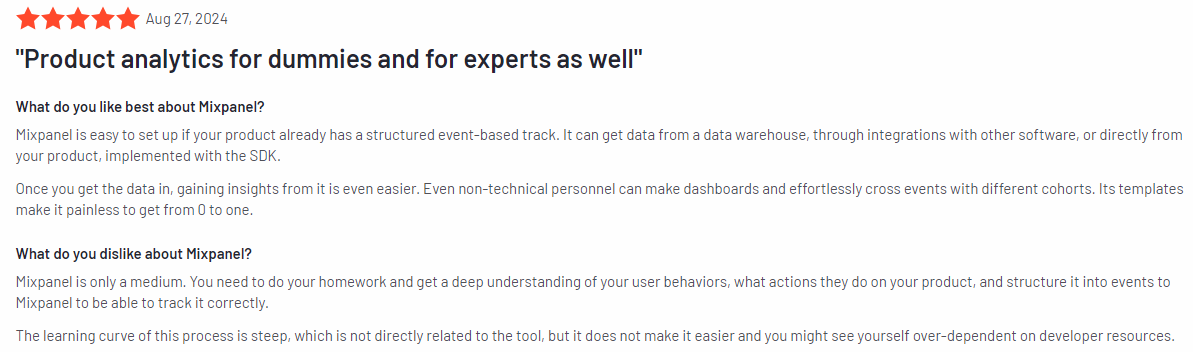
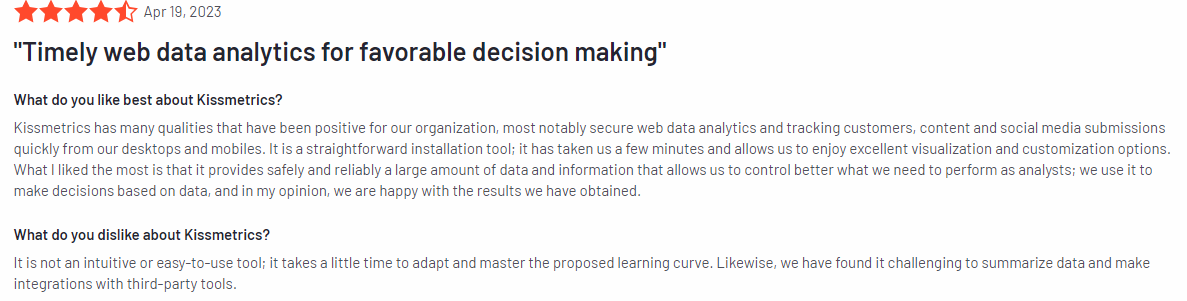
3. Kissmetrics
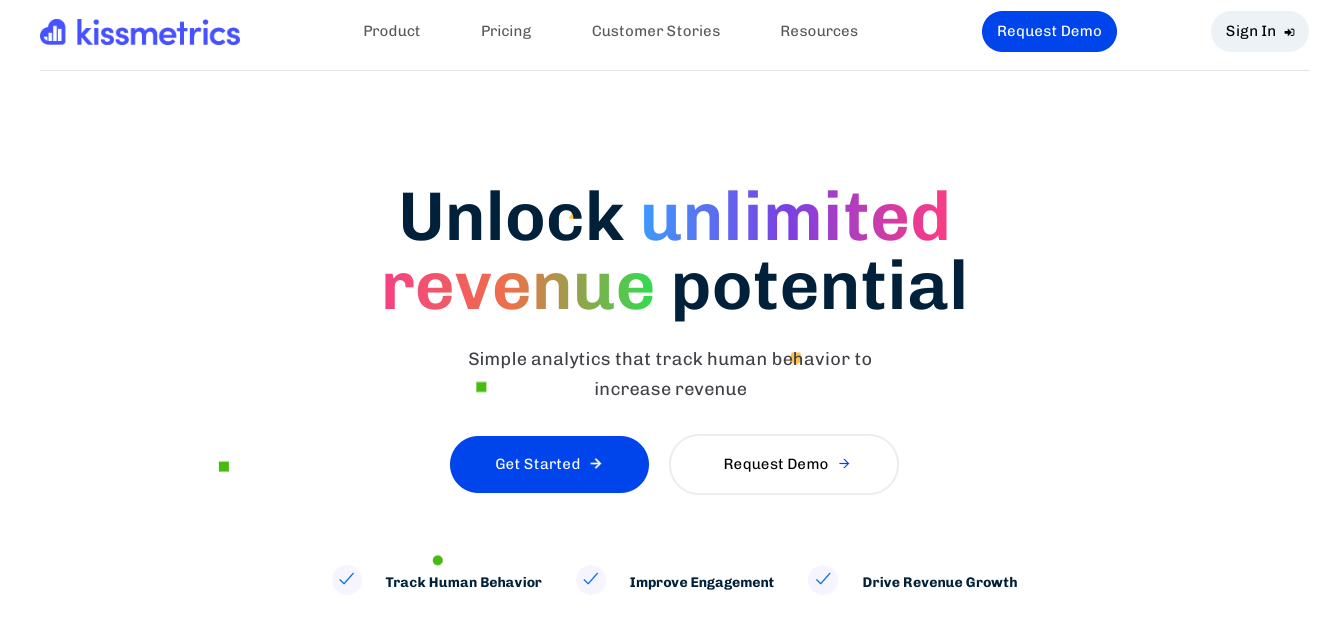
Kissmetrics is a web and mobile event tracking tool that helps you understand user behavior and optimize your marketing strategies. It tracks individual customer journeys across multiple touchpoints so you can find bottlenecks, reduce churn and increase revenue.
Best for
Kissmetrics is good for ecommerce businesses, SaaS companies and marketing teams.
Key features
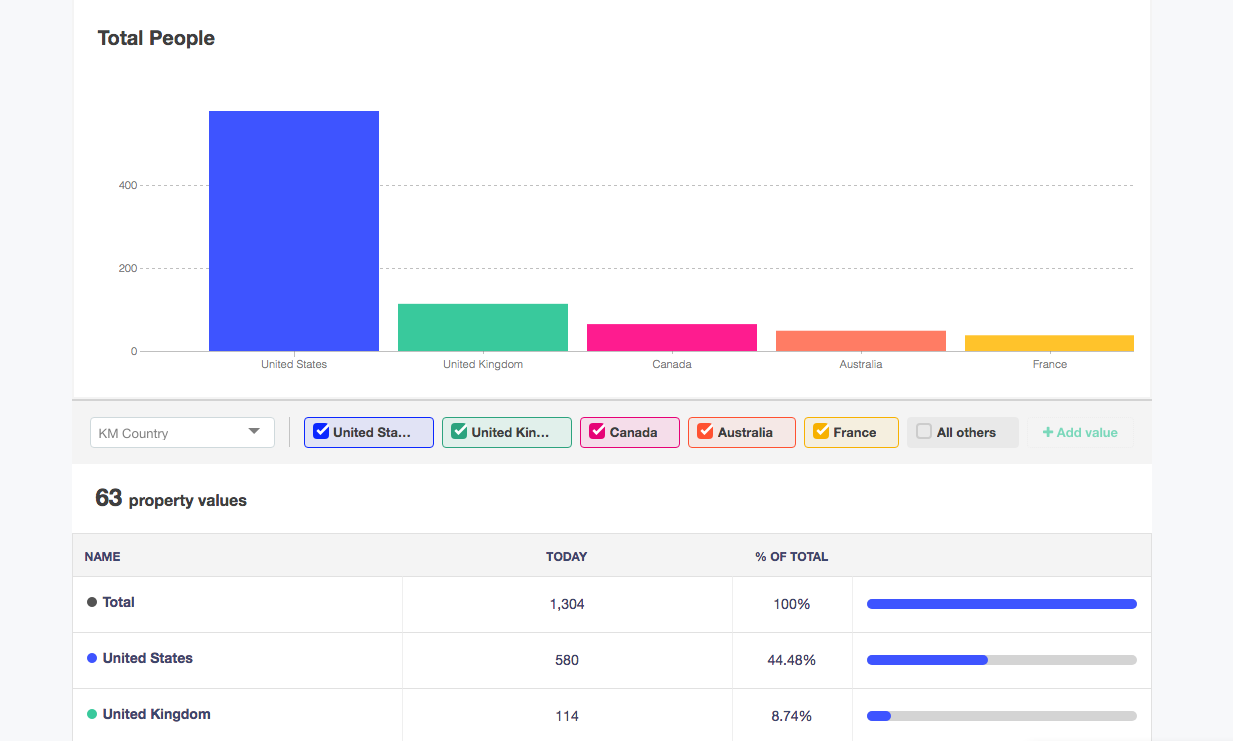
- Behavior tracking: Tracks individual user actions to show their journey.
- Funnel analysis: Tracks the entire customer journey from discovery to conversion.
- Cohort reports: Shows user behavior over time to find trends and engagement levels.
- A/B testing: Tests different designs and flows for best performance.
- Data privacy: Customer data is protected throughout the analytics process.
Supported platforms
Kissmetrics supports web and mobile applications.
Integrations
You can connect Kissmetrics with most email marketing tools, CRM systems and ecommerce platforms such as Shopify, Marketo, HubSpot, Salesforce, and MailChimp.
Customer support
Kissmetrics provides support via personalized onboarding for new customers, online documentation and guides, and live real-time chat.
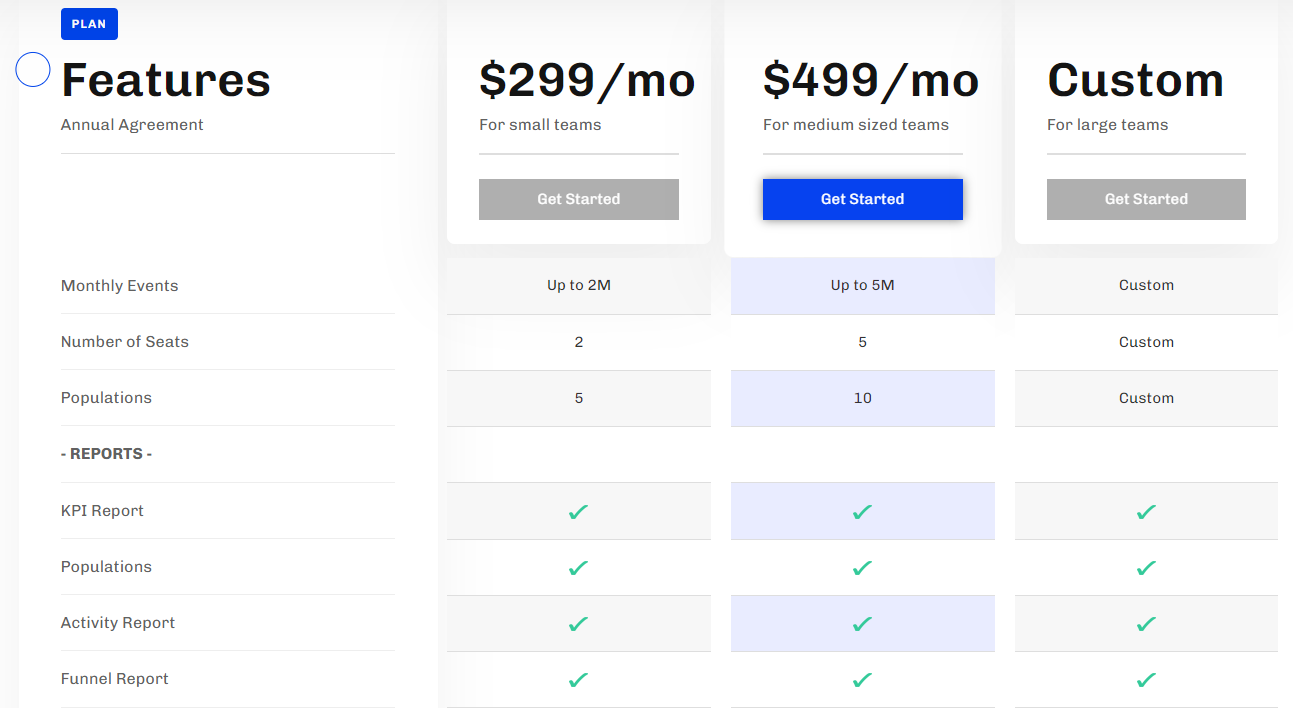
Pricing
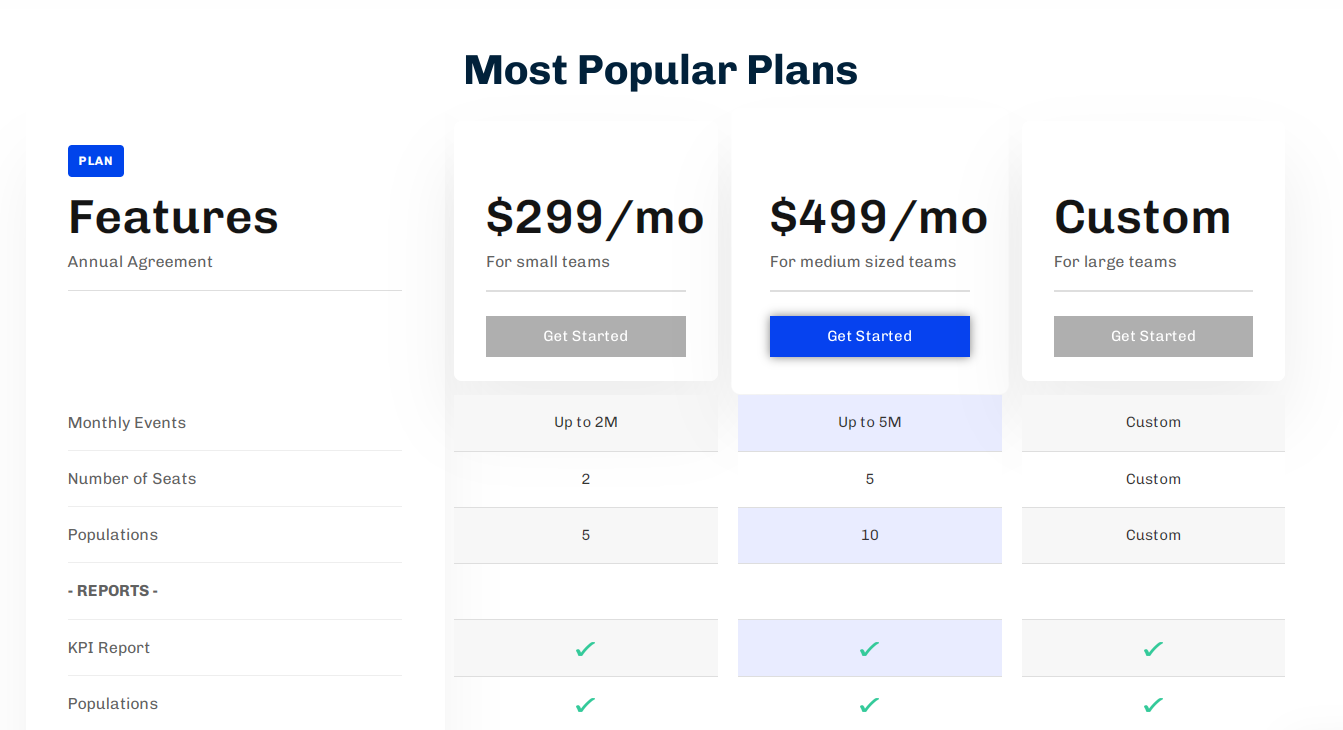
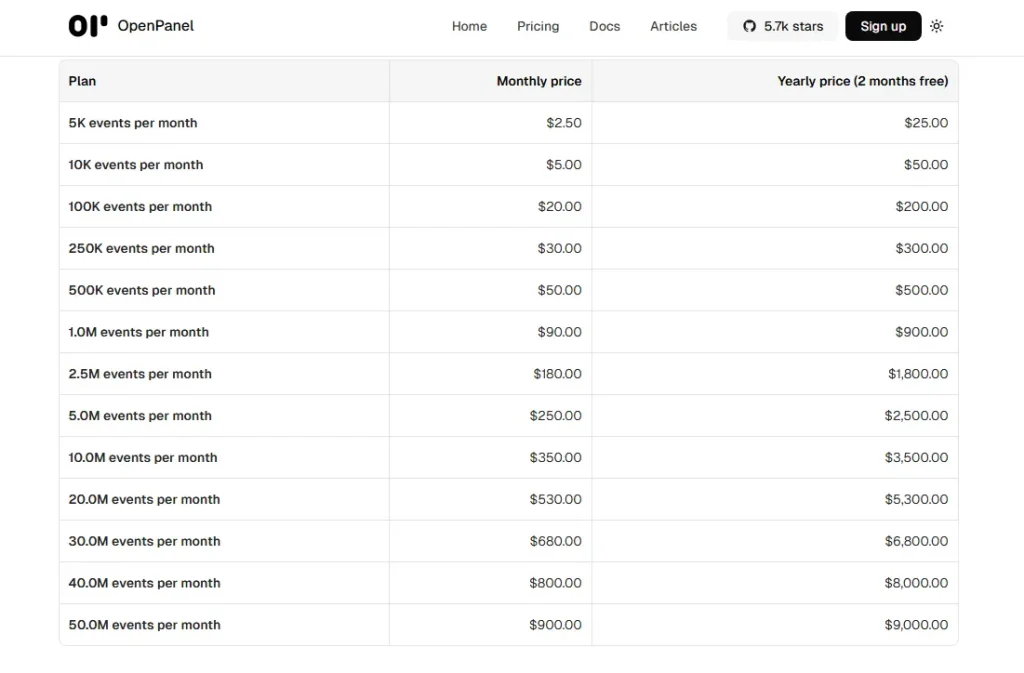
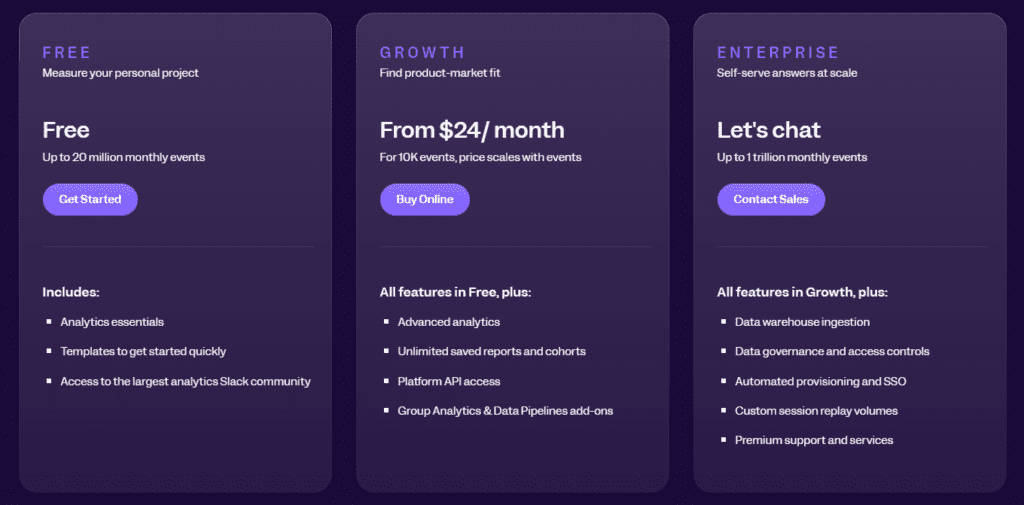
Kissmetrics has simple pricing based on monthly events, seats and features. The entry plan for small teams starts at $299/month and includes up to 2M monthly events, two seats and five populations.

You can also create a limited plan by choosing the number of monthly events you want to track and selecting the monthly or annual billing.
Pros
- Focuses on individual user behavior, not aggregate data
- Gives clear recommendations to improve marketing initiatives
- Easy-to-read dashboard
- The support team is responsive
Cons
- May offer shorter free trials than competitors
- Advanced features can be complex to learn
- Costs can skyrocket as event tracking increases
4. LogRocket
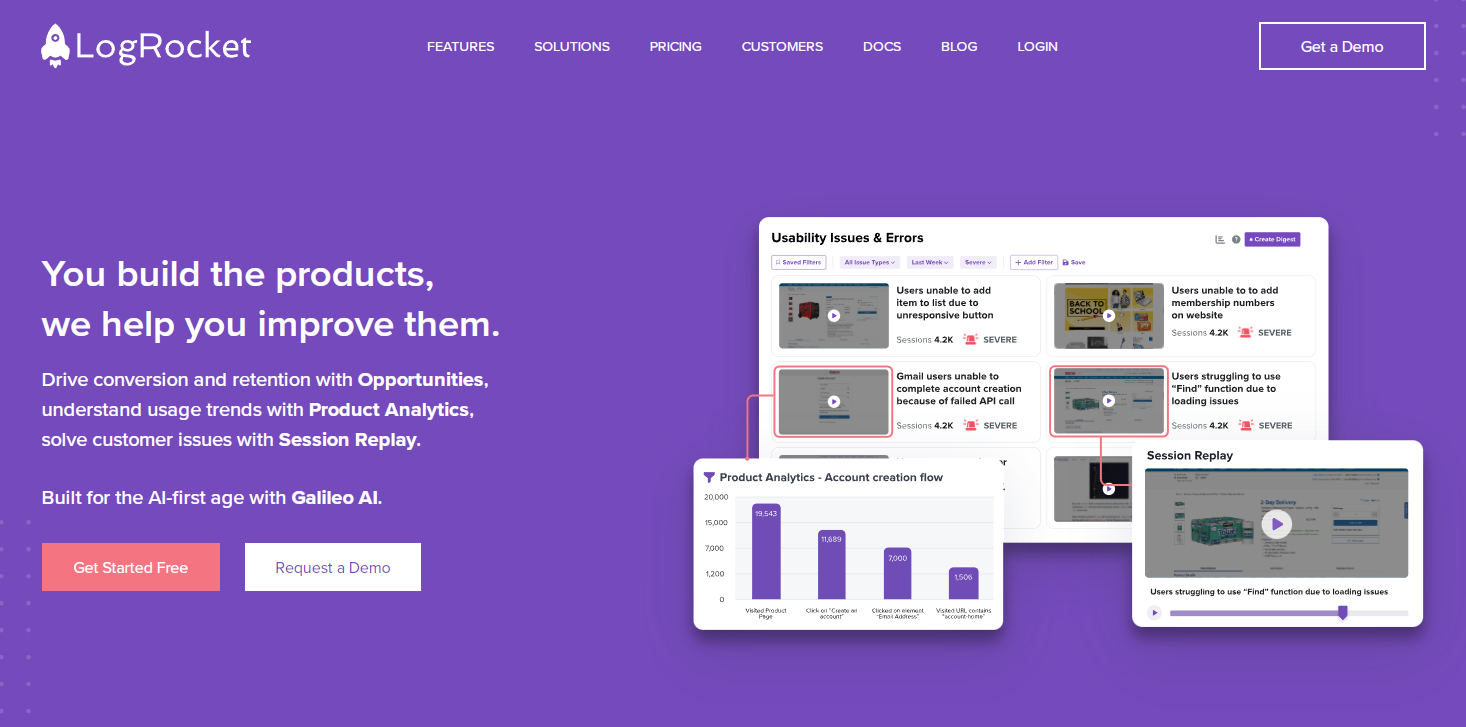
LogRocket is an advanced analytics and session replay tool that helps improve user experience by identifying technical and UX issues within web and mobile applications.
Using AI technology, LogRocket provides insights into user behavior, allowing you to understand your customers’ challenges and improve product performance.
Learn more: LogRocket competitors.
Best for
LogRocket is suited for software development teams, product managers, UX/UI designers, and customer support teams.
Key features
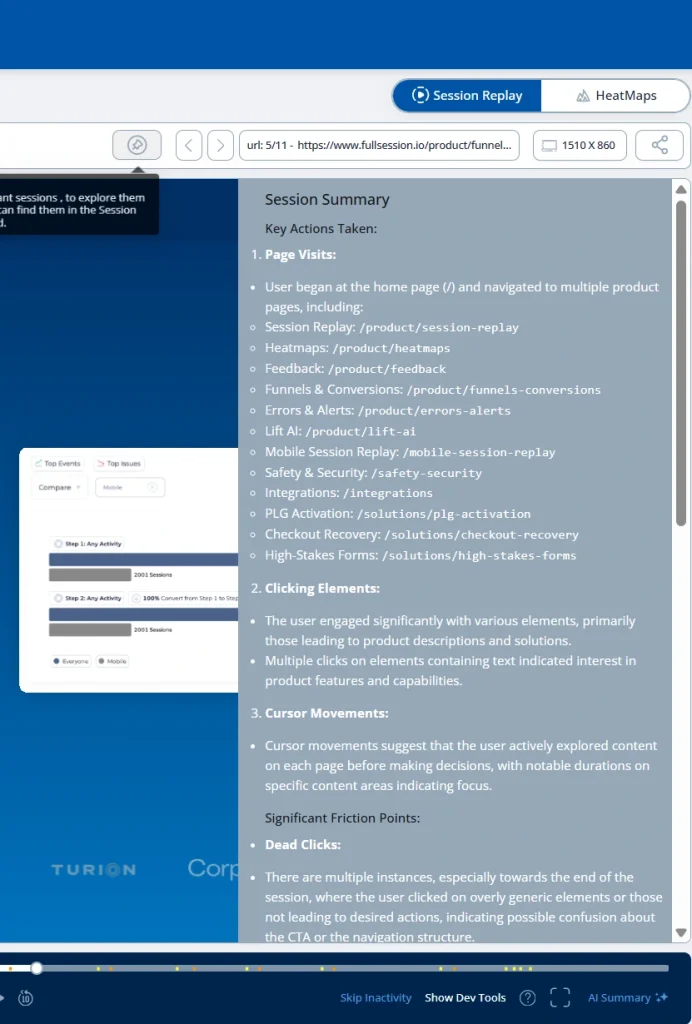
- Session replay: Capture detailed replays of user sessions, including DOM playback, console logs, network logs, and performance data.
- Product analytics: Track conversion funnels, path analysis, and time series trends to understand user engagement.
- AI issues detection: Use Galileo AI to proactively identify high-impact technical and UX issues affecting conversion rates.
- Error tracking: Monitor frequent errors, network failures, and crashes to prioritize fixes.
- UX Analytics: Get heat maps, click maps, and scroll maps to analyze user interactions on key pages.
Supported platforms
LogRocket supports diverse web and mobile platforms, making it versatile for various development environments.
Integrations
LogRocket integrates with customer support, marketing and development tools like Slack, Intercom, Segment, Google Analytics, Drift, Trello, Optimizely, and ZenDesk.
Customer support
You can reach out for support via email and live chat or check the comprehensive guides and FAQs.
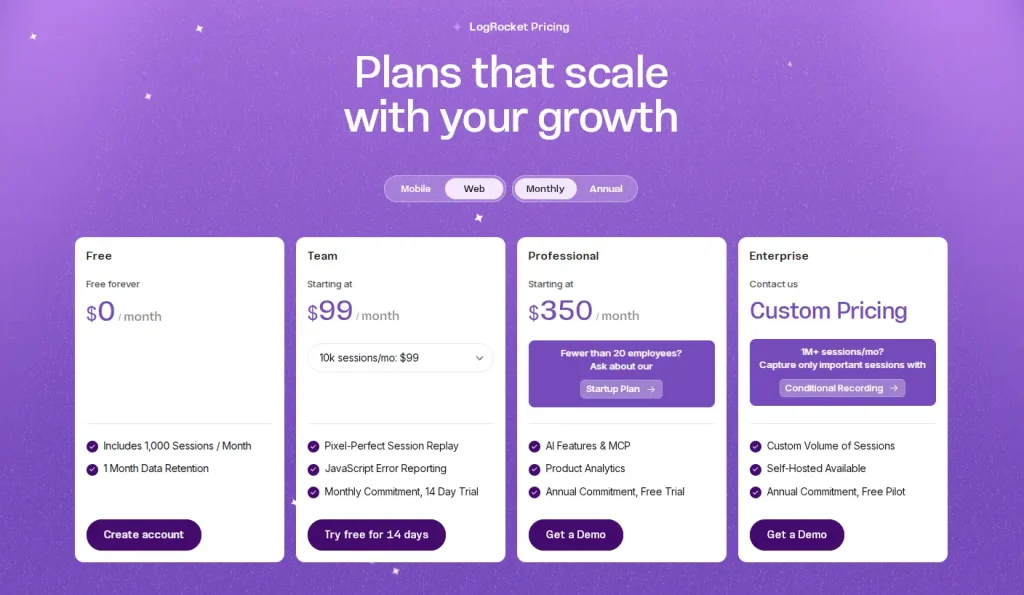
Pricing
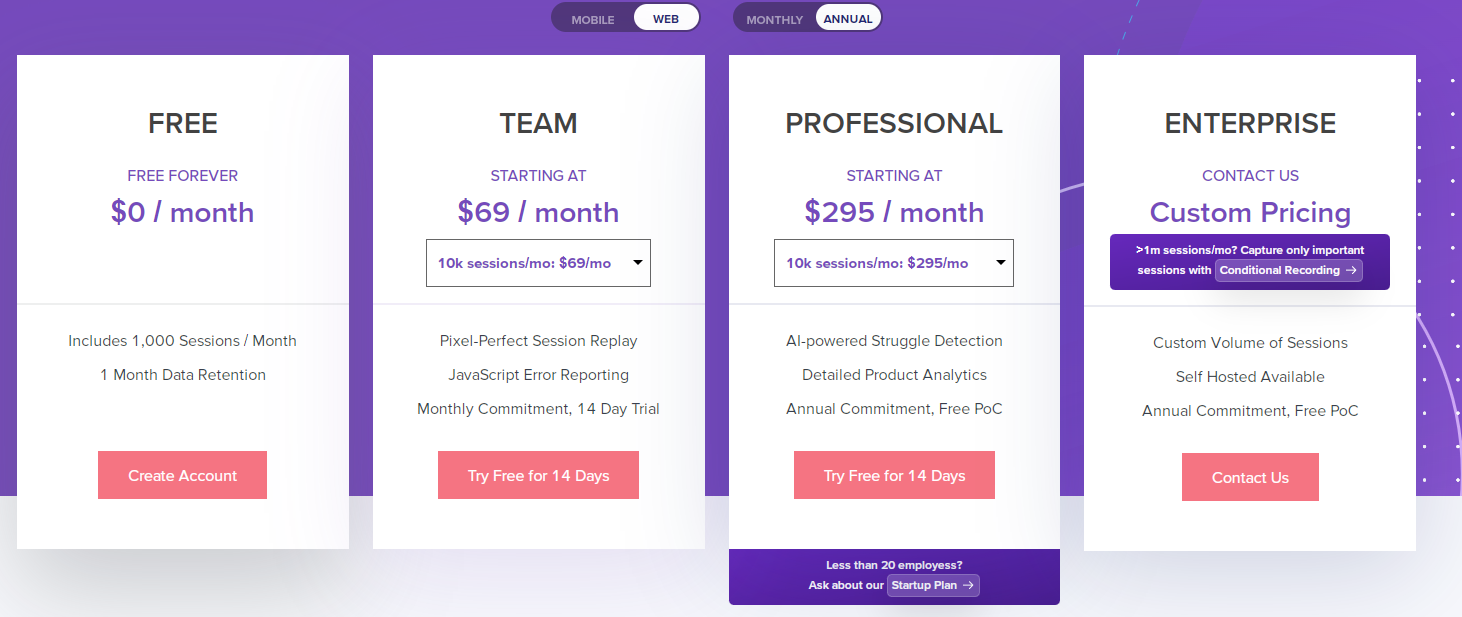
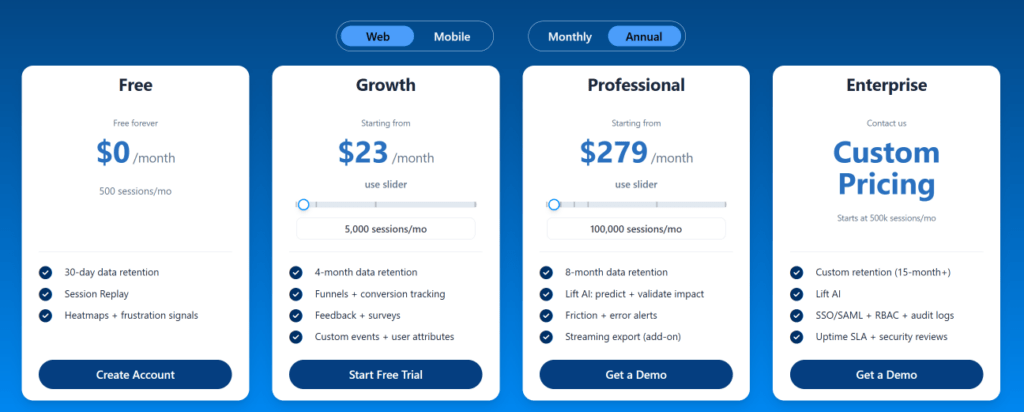
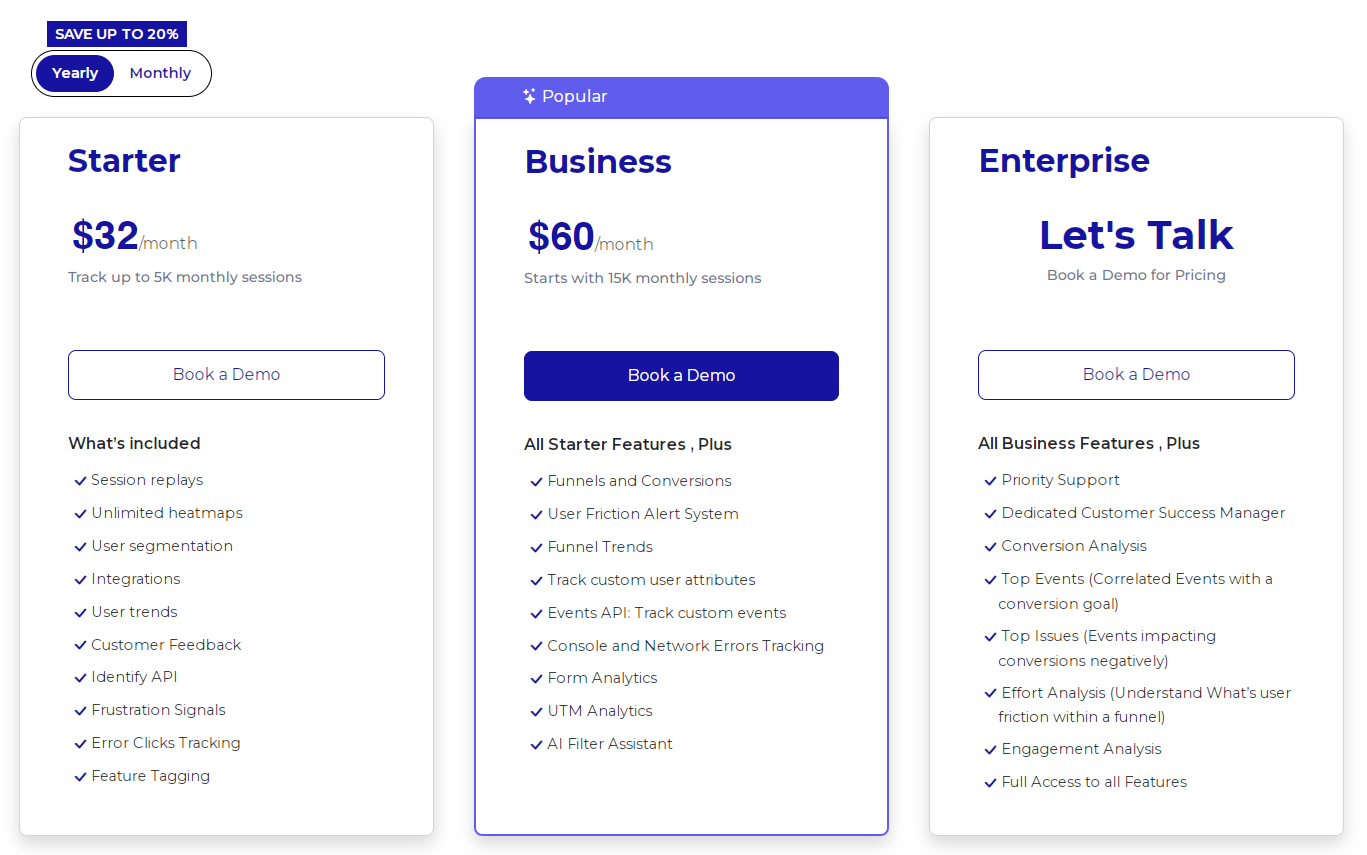
LogRocket provides a free plan and a 14-day free trial for its premium pricing tiers. It offers three paid plans for web and mobile analytics. The Team plan starts at $69/month and lets you track up to 10,000 monthly sessions.
Pros
- Provides deep analytics that helps identify both technical issues and UX problems
- An easy-to-navigate dashboard that displays critical metrics
- Automates the detection of issues with AI, saving time for teams
Cons
- The pricing may be high for startups or small teams with limited budgets
- New users may require some time to fully use all features effectively
5. SiteSpect
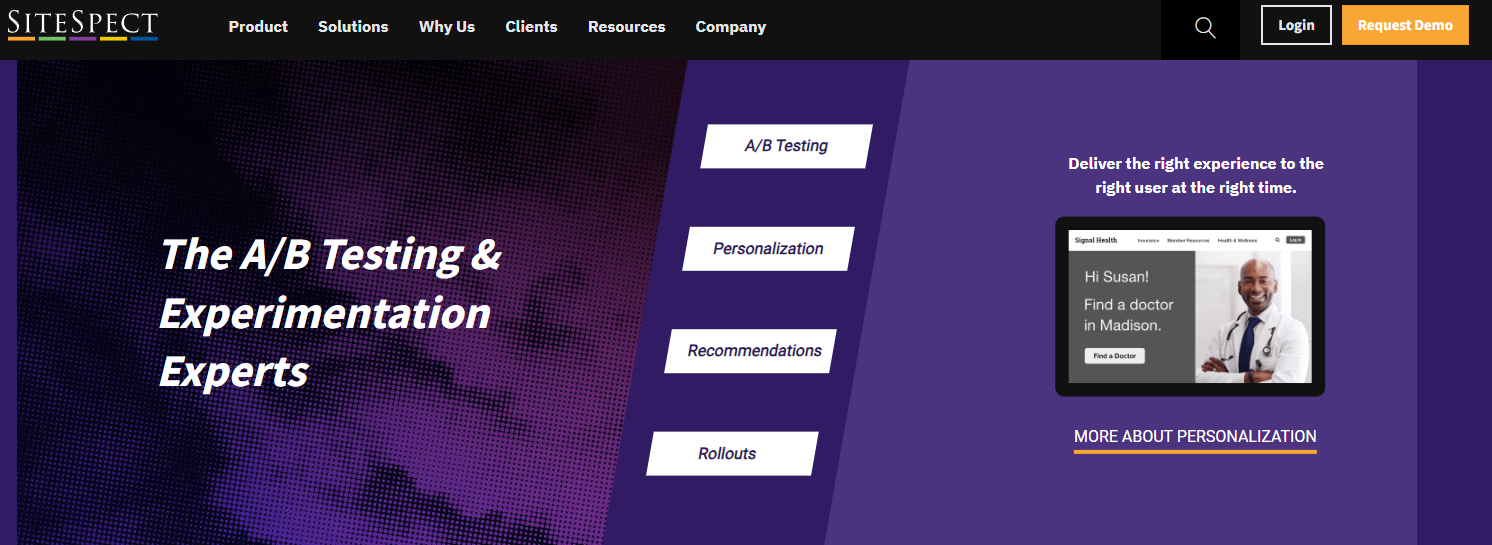
SiteSpect is an A/B testing and experimentation platform that helps you optimize digital experiences across various channels, including websites, mobile apps, and kiosks.
With a focus on improving customer engagement and driving conversions, SiteSpect provides tools for testing, personalization, and performance optimization, helping you enhance your online presence.
If you are comparing broader experimentation platforms beyond Crazy Egg and SiteSpect, this guide to VWO alternatives can help you evaluate more testing-focused options.
Best for
SiteSpect is suited for product managers, marketing teams, ecommerce businesses and enterprise-level organizations that want to run AB tests and optimize a web or mobile app.
Key features
- A/B testing: Conduct experiments to compare different versions of web pages or app interfaces to determine which performs better
- Personalization: Tailor user experiences based on behavior and preferences to increase engagement
- API digital transformation engine: Optimize across complex application ecosystems, including IoT devices and OTT platforms
- Visual editor: Make changes without needing extensive coding knowledge
- Comprehensive analytics: Collect reliable data free from bots to inform decision-making
Supported platforms
SiteSpect supports different platforms, including web and mobile apps and kiosks and OTT devices.
Integrations
SiteSpect connects with third-party platforms like Azure, AWS, Segment, Tableau, and IBM analytics.
Customer support
You can get support via email, documentation and resources and training programs for new users.
Pricing
SiteSpect has no pricing information on its website, so you’d have to contact sales for a quote.
Pros
- Fast performance
- Comprehensive testing capabilities
- Strong focus on security and stability
Cons
- Lack of publicly available pricing information
- A learning curve for new users unfamiliar with A/B testing methodologies
Crazy Egg Competitors: A Short Overview
So far, we have explained the core features and characteristics of the top five Crazy Egg alternatives. In this section, we will provide a summary so you can quickly make your decision. Check our table below to compare Crazy Egg competitors.
| Features | FullSession | Google Analytics | Kissmetrics | LogRocket | SiteSpect |
| Real-time Session recording | ✔ | ✘ | ✘ | ✔ | ✘ |
| Advanced funnel analysis | ✔ | ✘ | ✔ | ✘ | ✔ |
| Conversion tracking | ✔ | ✔ | ✔ | ✔ | ✔ |
| Behavioral analytics | ✔ | ✔ | ✔ | ✔ | ✔ |
| Customer segmentation | ✔ | ✔ | ✔ | ✔ | ✔ |
| A/B testing | ✘ | ✘ | ✘ | ✘ | ✔ |
| Customer journey mapping | ✔ | ✔ | ✔ | ✘ | ✘ |
| Dynamic heatmaps | ✔ | ✘ | ✘ | ✘ | ✘ |
| Customer feedback and forms | ✔ | ✘ | ✘ | ✘ | ✘ |
| Survey responses | Unlimited | Limited | Limited | Limited | Limited |
| Free trial | ✔ | ✔ | ✔ | ✔ | ✔ |
| Free version | ✘ | ✔ | ✔ | ✔ | ✔ |
| Pricing | Starts at $39 per month | Starts at $12,500/month | Starts at $299/month | Starts at $69/month | NA |
Crazy Egg Competitors: The Verdict

After reviewing all the options, FullSession is the top Crazy Egg competitor. Our conclusion is based on several key factors that make FullSession better in terms of functionality, performance, and user insights.
- Complete analytics: FullSession has a full suite of user behavior tools, including interactive heatmaps, session recordings and replays, website feedback forms, conversion and funnel analysis and error tracking. This gives a more complete picture of user interactions than Crazy Egg’s limited feature set.
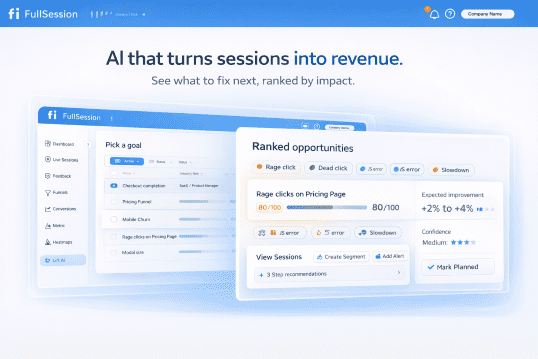
- Real-time data processing: FullSession shows live heatmap tracking to see how users interact with dynamic page elements in real-time. This means faster data processing and faster user behavior analysis.
- Zero performance impact: Unlike many others, FullSession doesn’t slow down your website. It’s optimized for speed and responsiveness so your users have a smooth experience.
- Ethical data collection: FullSession is non-intrusive. We don’t track users across the internet or use data for behavioral advertising, so users trust us completely.
- Seamless integration: FullSession integrates seamlessly with popular platforms like Shopify, WordPress and BigCommerce so you can get up and running without any extra complexity.
- Competitive pricing: FullSession has a more competitive pricing model with the lowest-paid plan including all the features at an affordable price of $39 per month and 20% off all plans for annual billing.
- Advanced data filtering and segmentation: FullSession is excellent at data analysis, and it helps you quickly process large volumes of session data and make faster decisions.
- Advanced security and privacy measures: FullSession puts user security first by not capturing sensitive information, reducing the risk of unauthorized access or data misuse.
Crazy Egg is good. But if you’re looking for a complete, user-friendly, privacy-focused solution that doesn’t compromise on features or performance, FullSession is the way to go.
Start a free trial or get a demo to learn more.
FAQs About Crazy Egg Alternatives
Let’s answer the most common questions about the Crazy Egg alternatives.
What is Crazy Egg?
Crazy Egg is a web analytics software that enables businesses to analyze user journey, traffic sources and customer behavior via a website heatmap tool, snapshots, A/B testing, and session recording among other tools used.
This analytics solution tool helps organizations better understand the customer journey, spot errors impacting conversions, target audience, and get a more precise picture of how various marketing channels perform.
How does Crazy Egg work?
You can start using Crazy Egg to monitor your website performance by adding its code snippet to your website. After that, the software begins to track individual landing pages of your website, showing how customers interact with various elements on your web pages.
For instance, you can use its heat map and snapshot tool to see where users click, the CTAs they don’t click and the elements that boost conversions. Crazy Egg also offers form analytics to analyze user interactions with forms, helping you understand how users engage with forms and identify areas where they drop off or struggle.
Apart from that, Crazy Egg provides session recording tools that can help you visualize how web visitors navigate your site. You can identify where users are coming from and where they get stuck, so you can make changes to improve your site performance.
Crazy Egg also lets you perform split testing with its AB testing tool.
What are Crazy Egg pros?
It is easy to set up and presents user actions in a simplified way. The software helps you spot where visitors and users experience issues on your site so you can improve the UX.
What are Crazy Egg cons?
While the software helps you spot various issues, it doesn’t provide a precise explanation of individual users’ actions. It comes with high pricing.
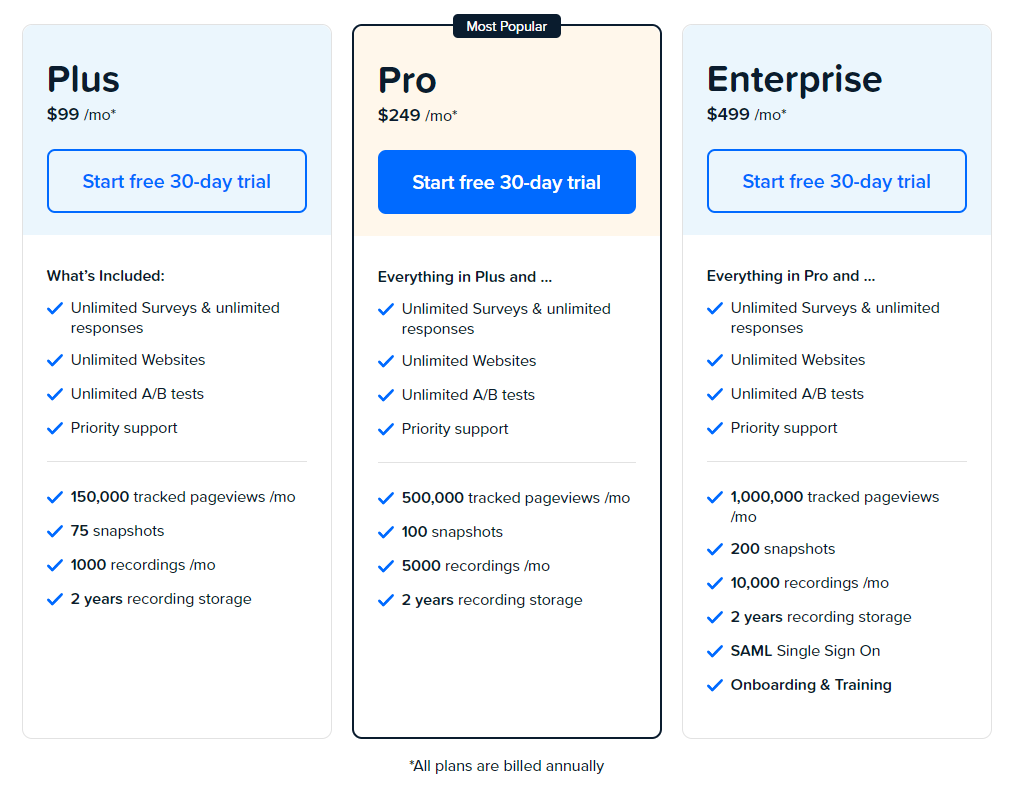
What is Crazy Egg pricing?
Crazy Egg provides three pricing plans. However, prices are not publicly available.
Does Crazy Egg work on mobile apps?
No, Crazy Egg doesn’t work on mobile apps.
What is a Crazy Egg snapshot?
A Crazy Egg snapshot helps you track individual pages on your website. It lets you visualize how people interact with your web content, so you can learn what’s working or where to make improvements.
Which is better: Optimizely or Crazy Egg?
The choice between Optimizely and Crazy Egg depends on your needs, but here’s a general comparison.
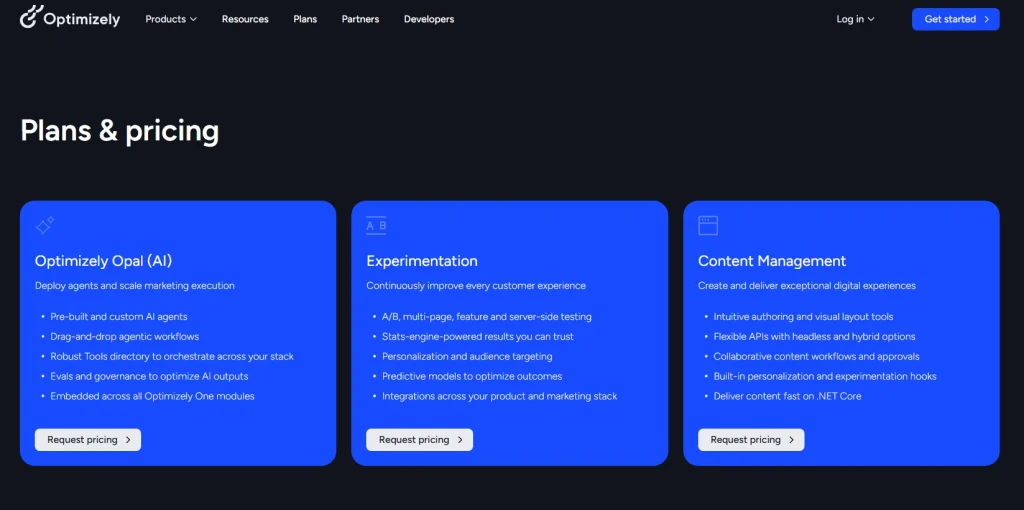
Optimizely is more robust for large-scale A/B testing and personalization. It offers more advanced features for experimentation and is often preferred by larger enterprises.
Crazy Egg is more user-friendly and focuses on heat maps and visual analytics. It’s often favored by smaller businesses and those new to website optimization.
Does Crazy Egg integrate with Google Analytics?
Yes, Crazy Egg does integrate with Google Analytics. It allows users to combine Crazy Egg’s visual data with Google Analytics’ quantitative data for more comprehensive insights into website performance and user behavior.
What is the point of Crazy Egg?
Crazy Egg is a website optimisation tool that helps businesses understand and improve user behavior on their websites.
Its main purpose is to show you visual insights into how visitors interact with your web pages through heatmaps, scroll maps and click reports.
By visualizing user engagement, Crazy Egg allows website owners and marketers to find usability issues, optimize conversions, A/B tests and see user journeys.
This data-driven approach means businesses can make informed decisions about layout, content placement and overall user experience, ultimately increasing engagement and conversions.
In short, Crazy Egg is an analytics tool for businesses that want to improve their online presence and website performance based on real user behavior.
Mohamed oversees operations and finance at FullSession and has contributed to the company’s UX analytics knowledge base.