Digital experience analytics gives you the tools to track, measure and improve users’ engagement with your digital platforms.
It lets you collect and analyze user data from websites or apps, combining behavioral data with technical metrics to give you a complete view of the customer journey across various digital touchpoints.
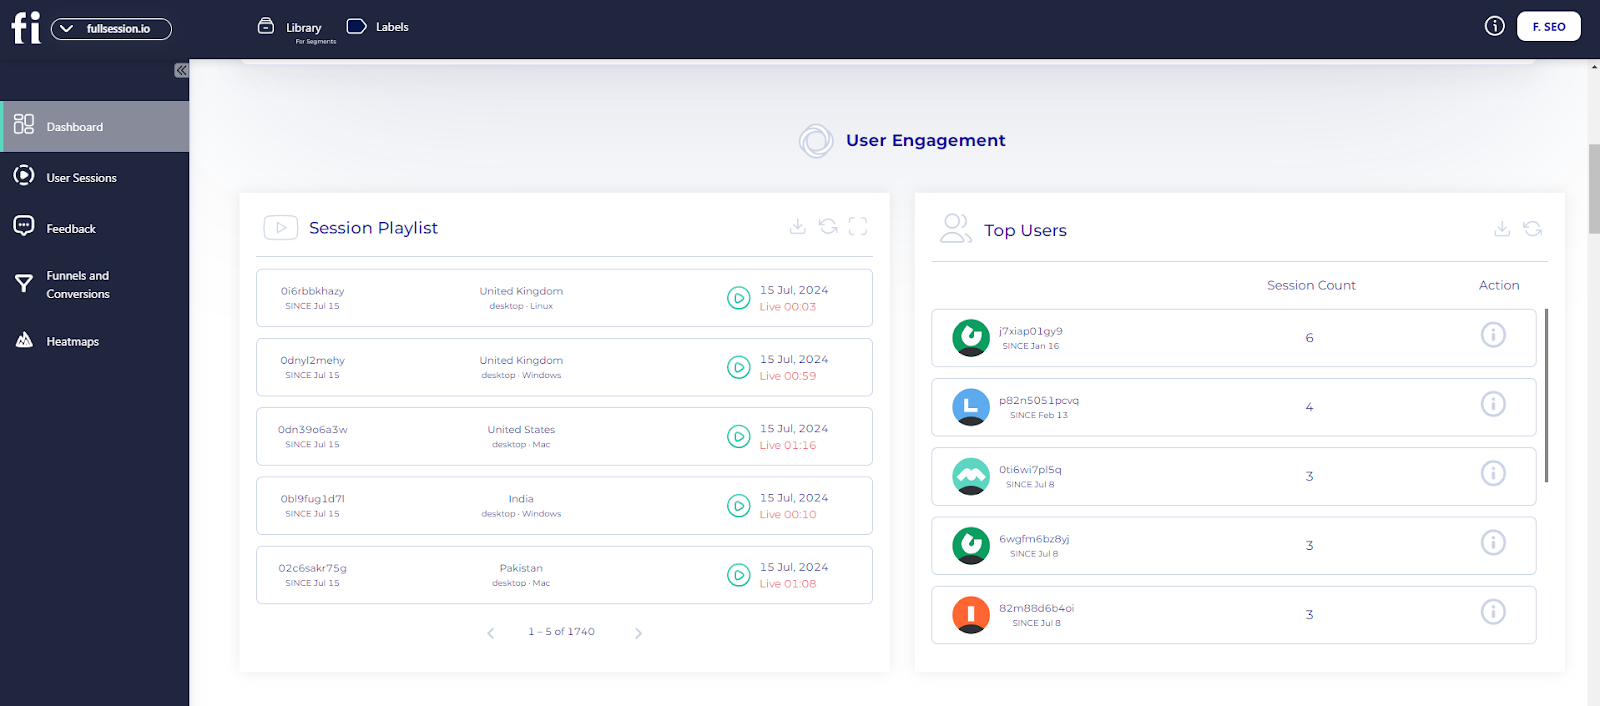
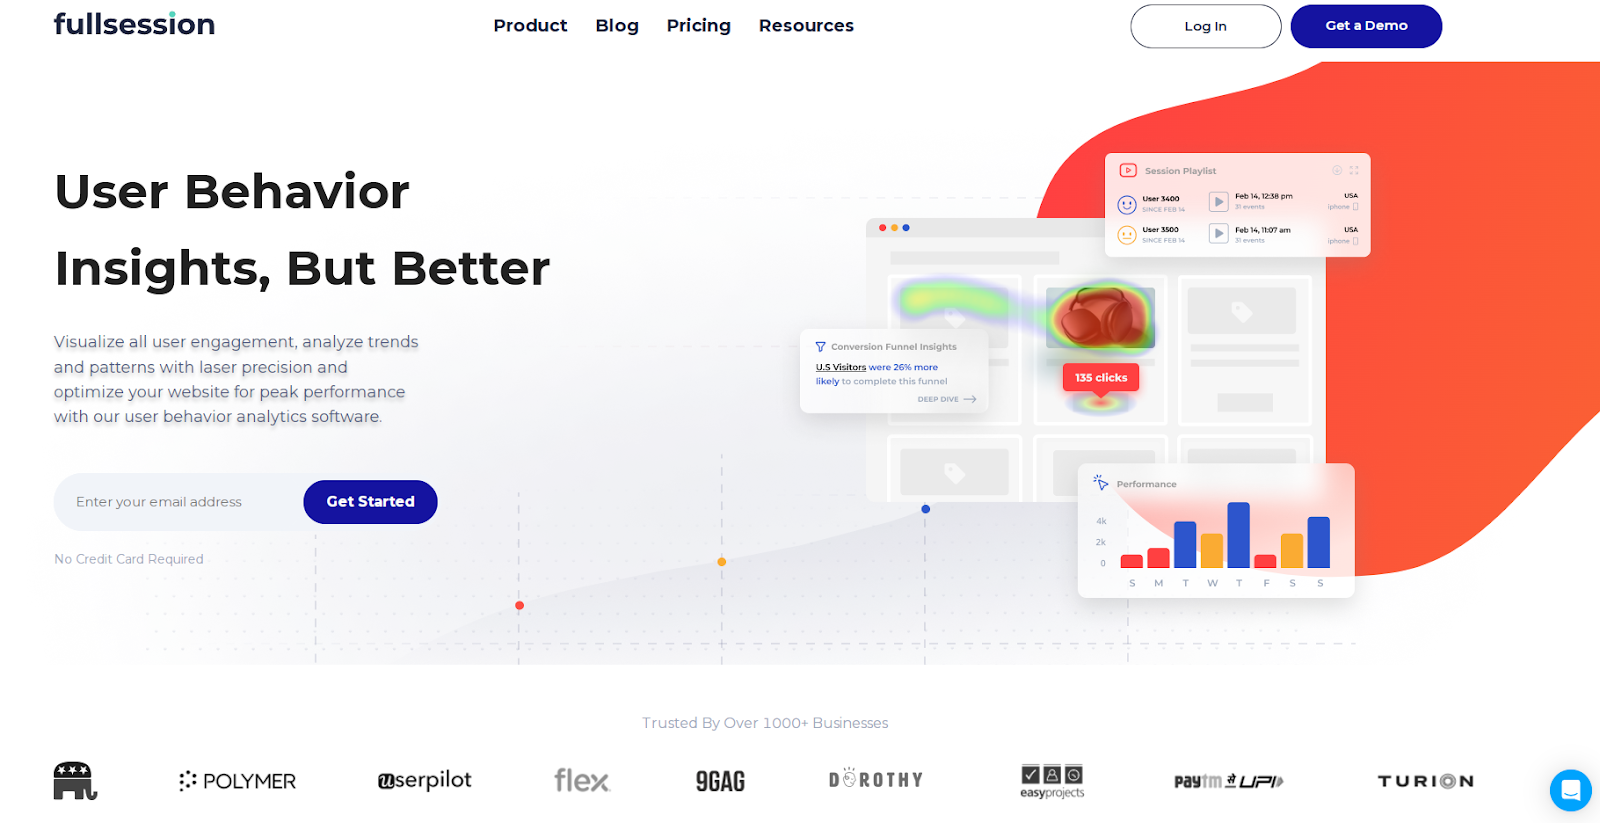
The best digital analytics tools help you change the user experience, retain more customers and drive business results. Take FullSession as an example.
It lets you visualize all user engagement, analyze trends and patterns with laser precision and optimize your website for peak performance.
You can start a free trial or get a demo to learn more.
Whether new to digital experience analytics or looking to improve your approach, this article will cover the basics and give you a blueprint to create an optimal user journey and increase customer satisfaction.
What is Digital Experience Analytics?
Digital experience analytics helps you track users’ interactions with your digital platforms, websites and mobile apps.
You can better understand user behavior by collecting and analyzing qualitative and quantitative data that offers objective insights through user session tracking.
For example, tools like Google Analytics can be key in measuring conversion rates and tracking user progression through funnels, providing a detailed overview of user engagement metrics.
Digital analytics tools will help you make your business more agile while giving customers a seamless and satisfying digital experience.
Analyze User Behavior With FullSession
Capture all user interactions, spot trends and patterns and drive improvements without compromising your website performance.
Why Digital Experience Analytics Matters for Businesses
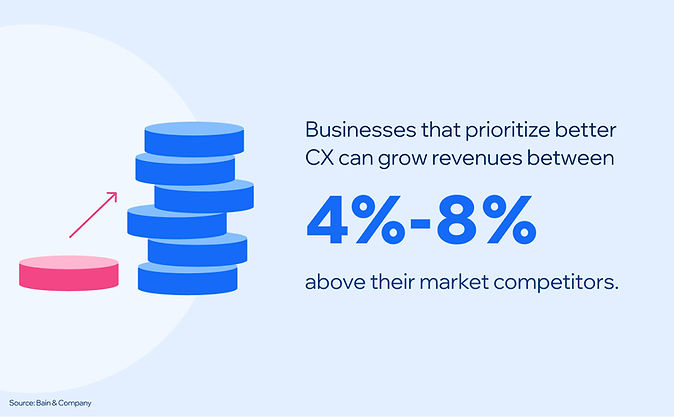
Image source: WiserNotify
Digital experience analytics is key for understanding your customers and driving business success. Here’s why:
- Insight into user behavior and preferences: By analyzing user behavior on your website and apps, you can gain insights into their preferences and tailor user experiences to meet your customers’ needs.
- Optimized marketing strategies: Marketing strategies are built on data. Advanced analytics lets you see which marketing campaigns drive traffic and engagement. It will allow you to optimize your strategy and improve conversion rates.
- Increased Customer Lifetime Value (CLV): When you understand and meet customer needs, they are more likely to come back and increase their lifetime value for your business. Happy customers become loyal customers.
- Competitive advantage: The insights from the data can inform decisions, improve digital interactions and drive sales and customer retention. A better user experience will differentiate your brand from the competition.
Customer understanding is key to your business strategy. When you know what your customers want, you can serve them better and drive growth for your business.
How to Use FullSession for Digital Experience Analytics
Imagine enjoying all these benefits with a single, comprehensive user behavior analytics software.
What if you could seamlessly capture all user interactions, visualize trends and patterns, analyze user behavior, and optimize site performance from one intuitive platform?
Using FullSession for digital experience analytics makes this possible. FullSession offers a robust feature set and provides accurate insights to help you improve user experience and increase conversions.
You can start a free trial or get a demo to learn more.
Let’s explore the key components.
Session recordings and replays
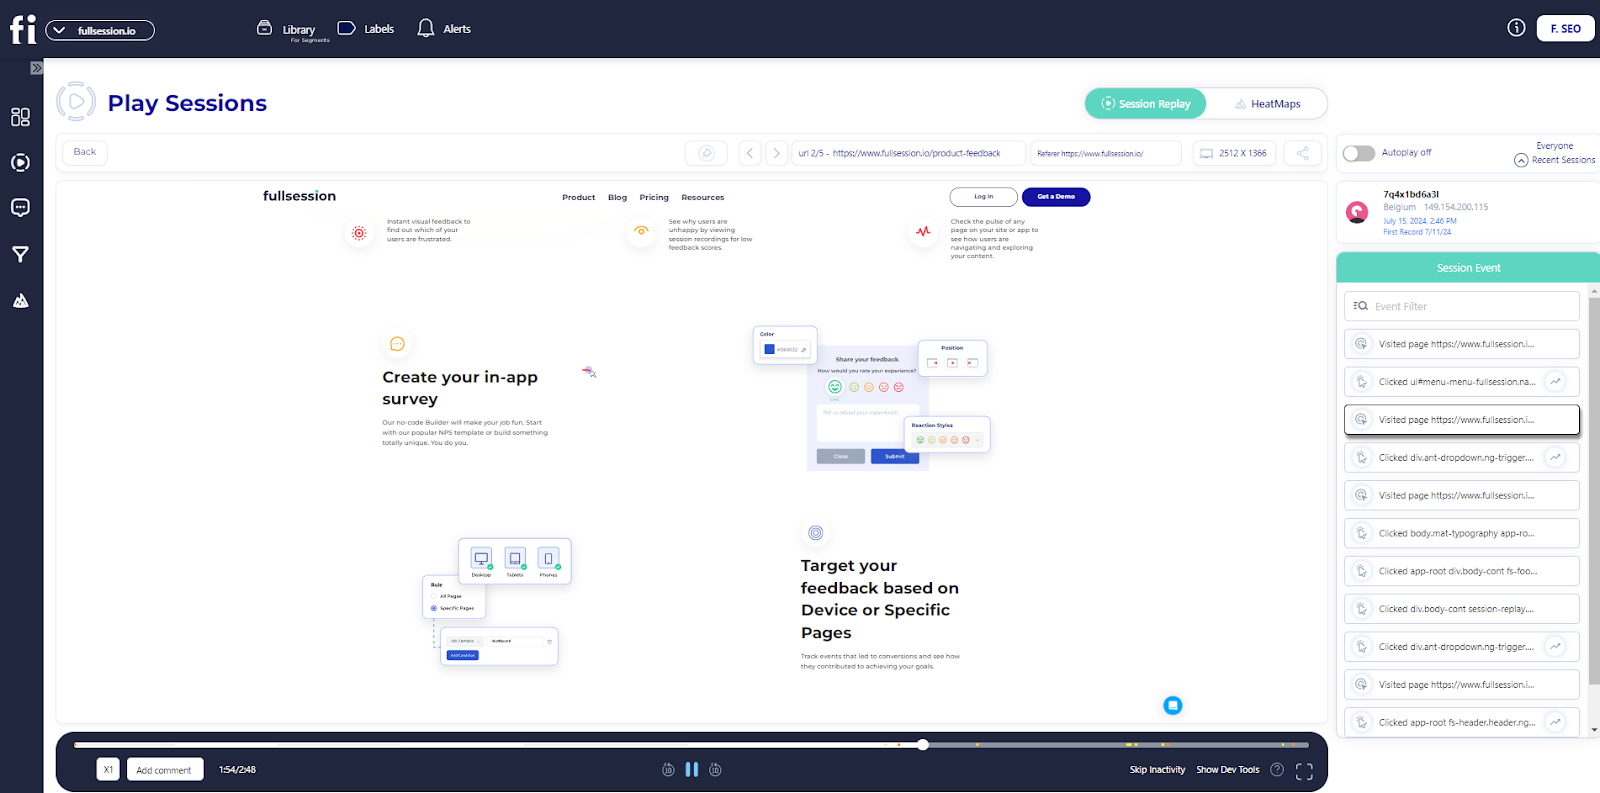
Session recordings and replays allow you to watch real-time user interactions with your website. You can see mouse movements, clicks and navigation patterns by analyzing these recordings.
Session recording and replay tools let you revisit these interactions to the smallest detail to fully understand user experience and behavior. You can identify where users get stuck or confused.
Observing what happens during these sessions helps you pinpoint the exact problem areas affecting conversions so you can fix them and improve your results.
Interactive website heatmaps
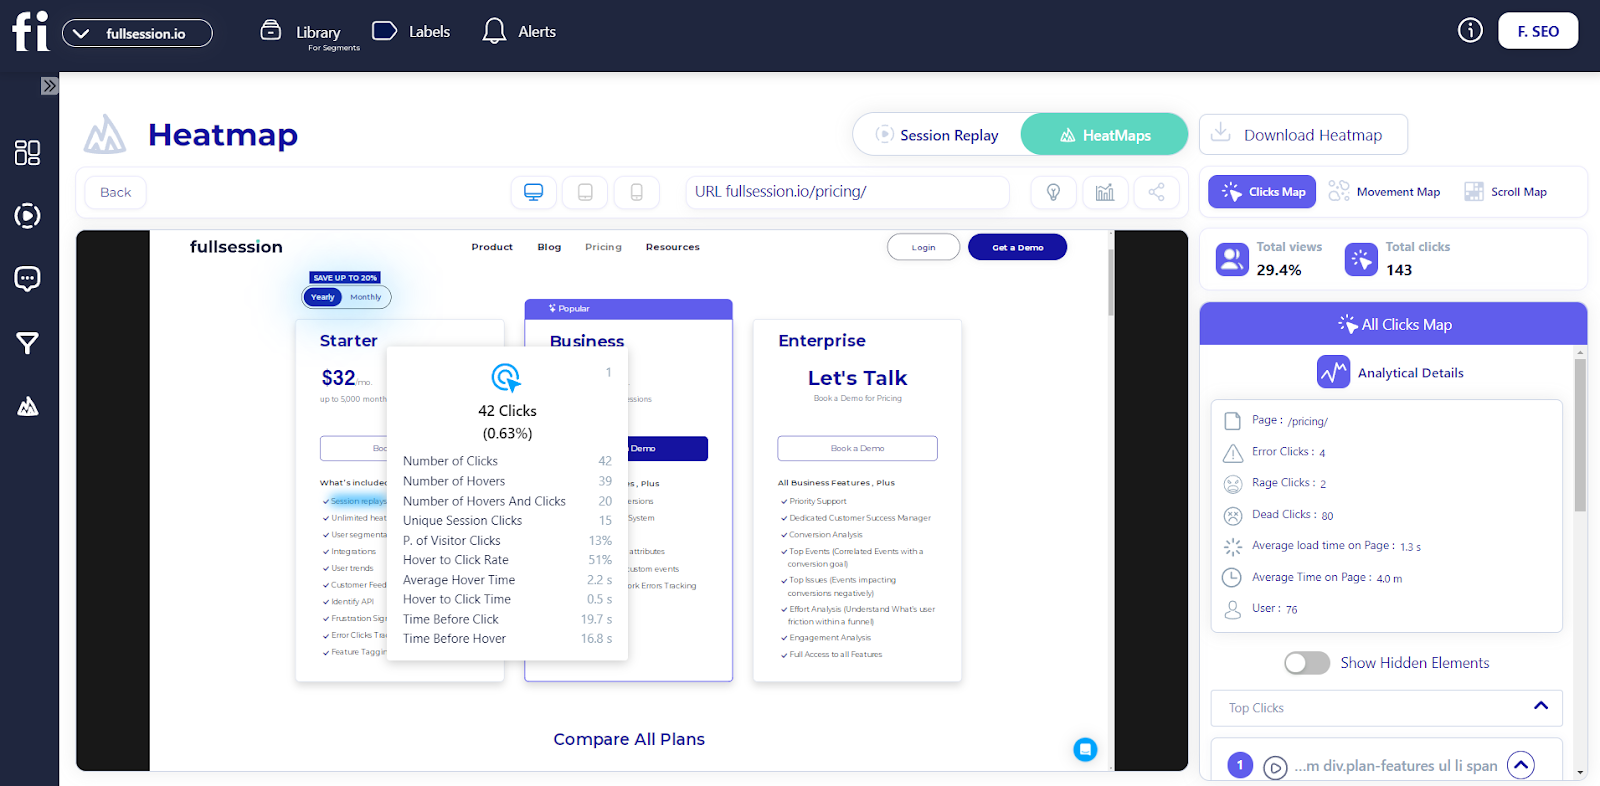
Website heatmap tools visually show user interactions on your web pages. They highlight where users are clicking, hovering and scrolling the most.
By using FullSession’s click, scroll and mouse heatmaps, you can see dead zones where interaction is lacking. It helps you test new page elements or validate design changes to improve user engagement and experience.
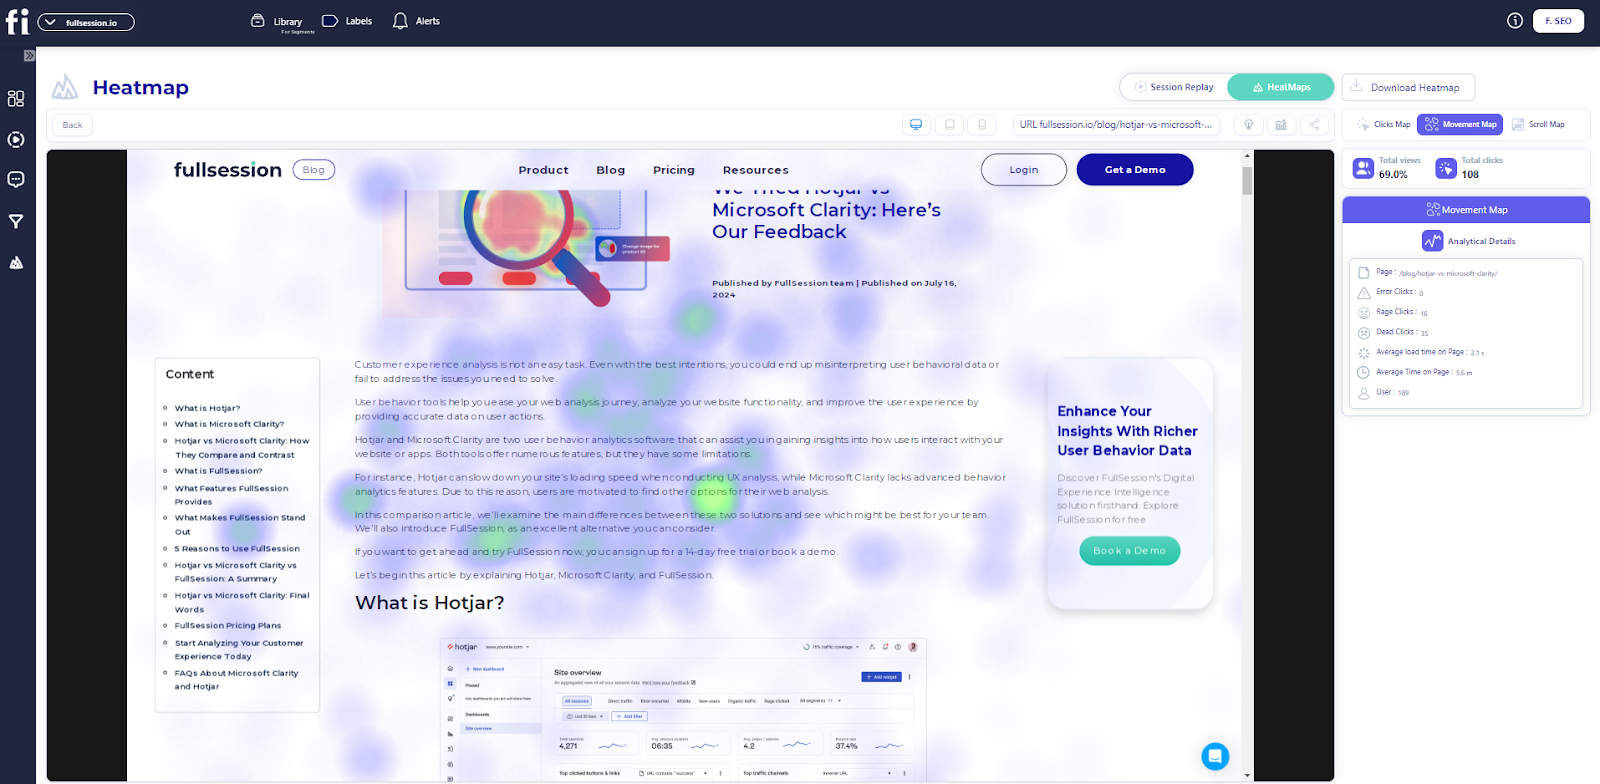
UX heatmap tools show you which parts of a page are getting the most attention and which are being ignored. They help you optimize your site’s visual hierarchy and focus user attention where you want it the most.
Visualize, Analyze, and Optimize with FullSession
See how to transform user data into actionable insights for peak website performance.
Conversion funnel analysis
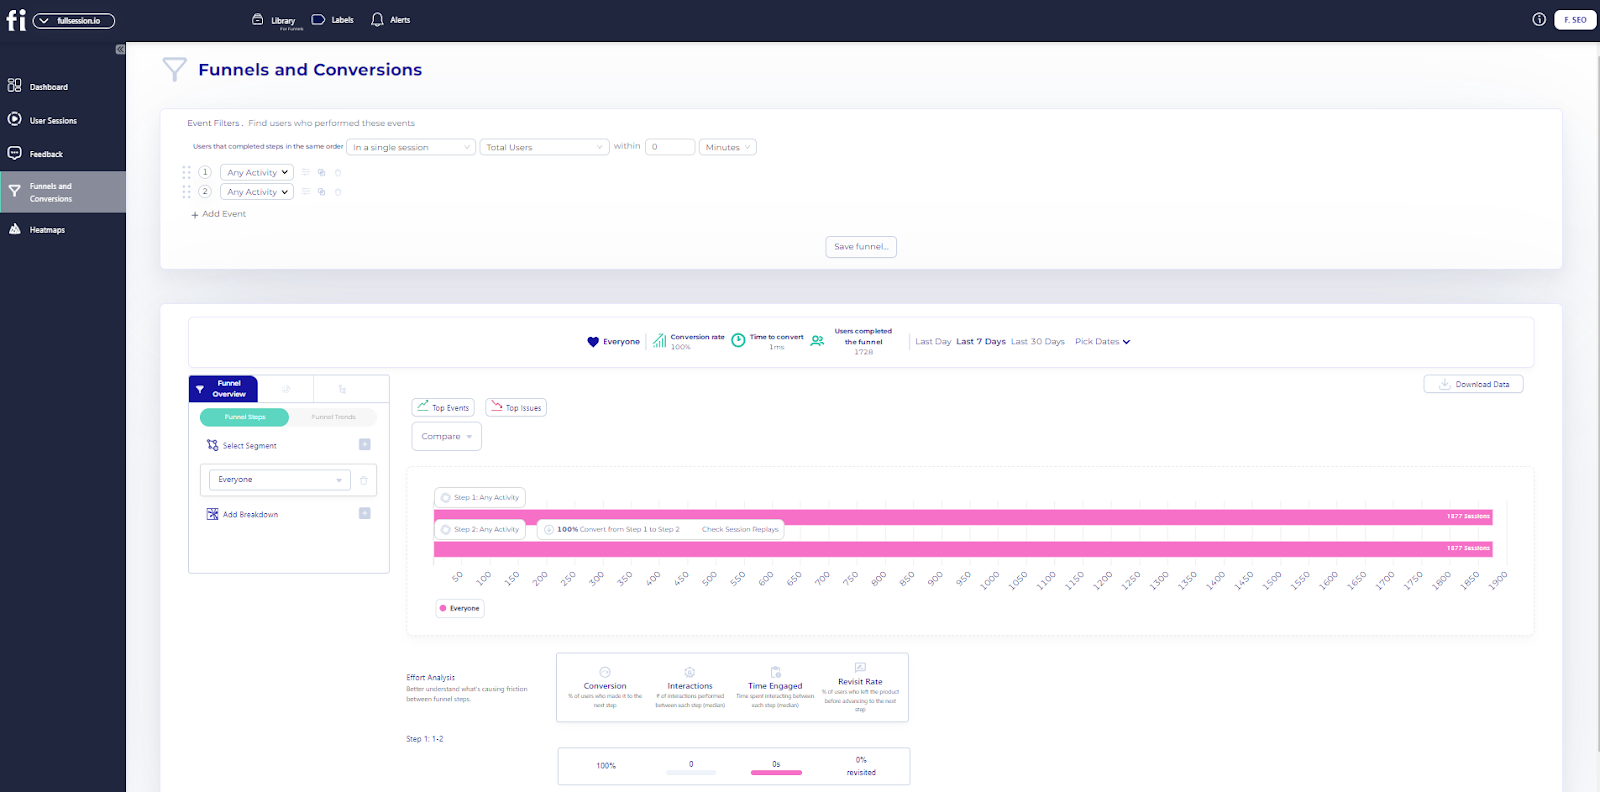
Conversion funnel analysis is key to understanding how users move through your sales process. FullSession allows you to track each step in your funnels. By seeing where users drop off, you can remove conversion blockers preventing users from taking desired actions.
It helps you optimize key touchpoints and the entire journey from initial interest to final purchase. You can make specific changes to increase conversion rates and user satisfaction along the funnel by identifying and optimizing problem areas.
Website feedback tools
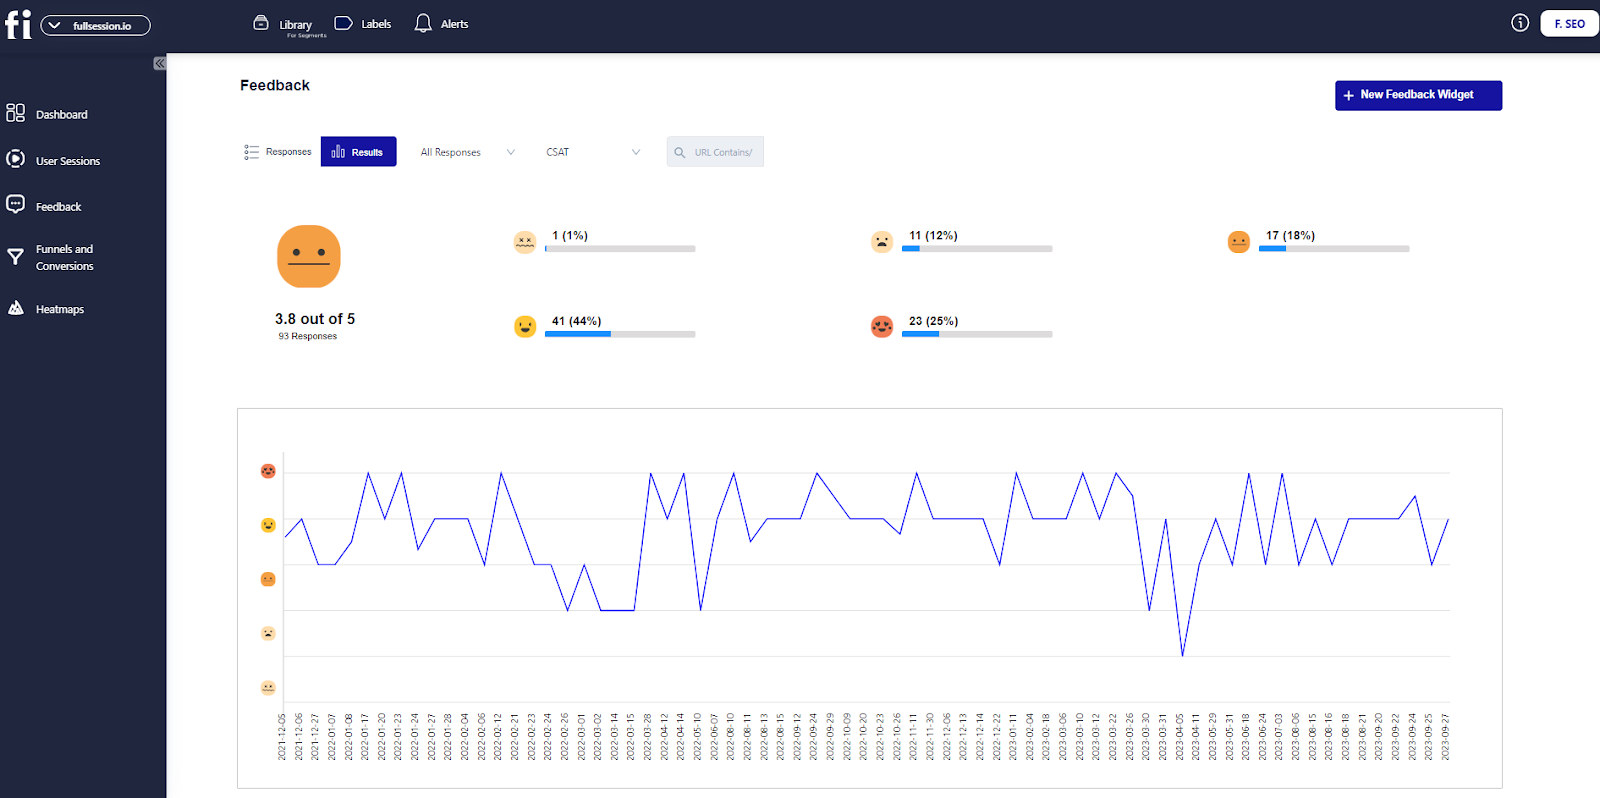
Website feedback tools allow you to reach your users directly to get feedback on their experience. You can learn what users expect and where to improve. Customer feedback tools give practical insights to increase user satisfaction and engagement.
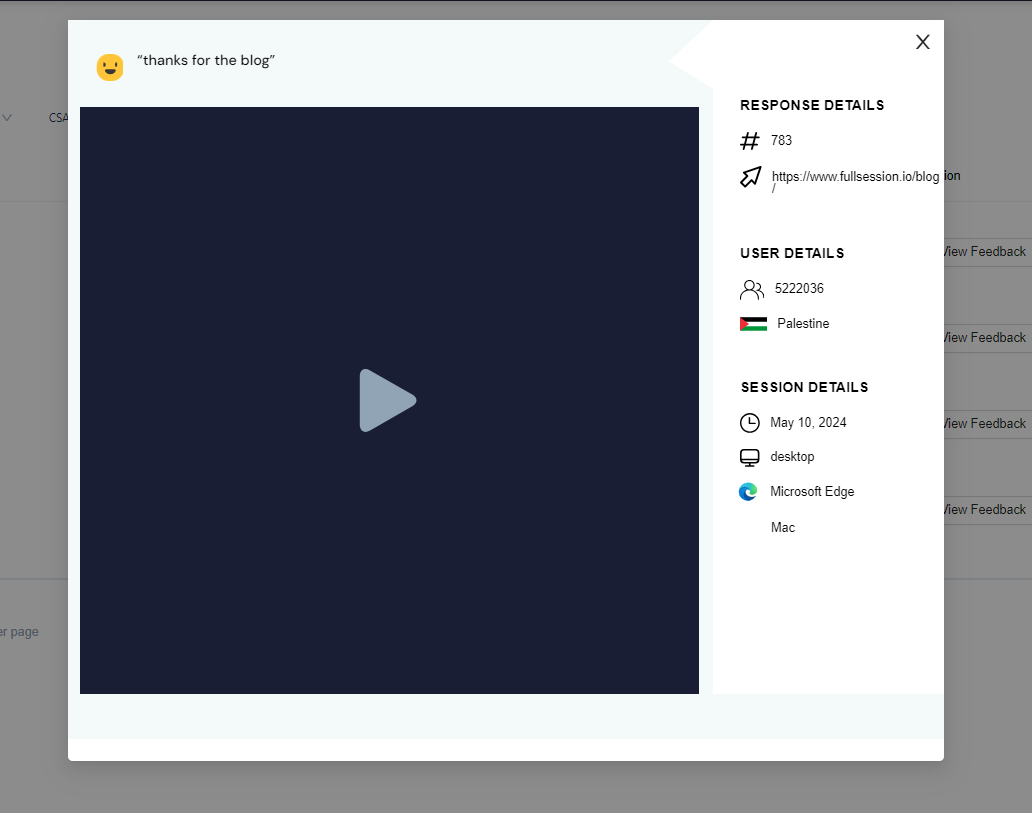
FullSession’s feedback mechanisms allow you to act on user input, improve the site interface, usability and performance, and ensure it meets user needs.
With customer feedback collection tools, you can make strategic changes to increase user retention and develop a more engaging online presence.
Error tracking
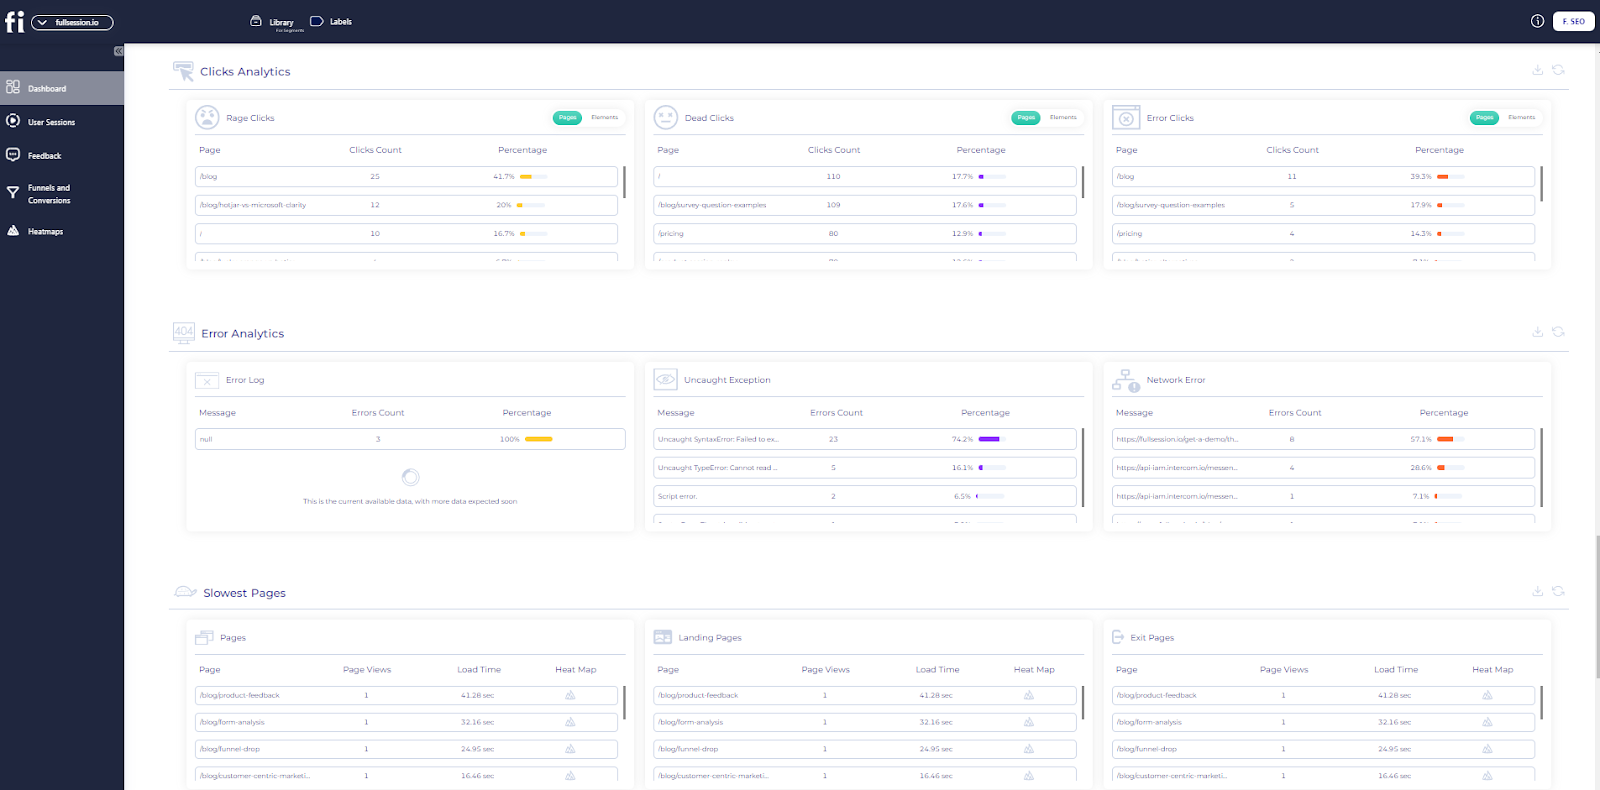
Error tracking is key to a smooth user experience. FullSession has tools to monitor and track website issues users are encountering on your site. By knowing these cases, you can fix them quickly to prevent a negative impact on user experience.
Tracking errors will show you technical glitches and areas that need improvement so users can interact seamlessly. Fixing errors fast can reduce frustration and improve overall satisfaction, leading to better retention and conversion rates.
Turn User Behavior into Growth Opportunities
Learn how to visualize, analyze, and optimize your site with FullSession.
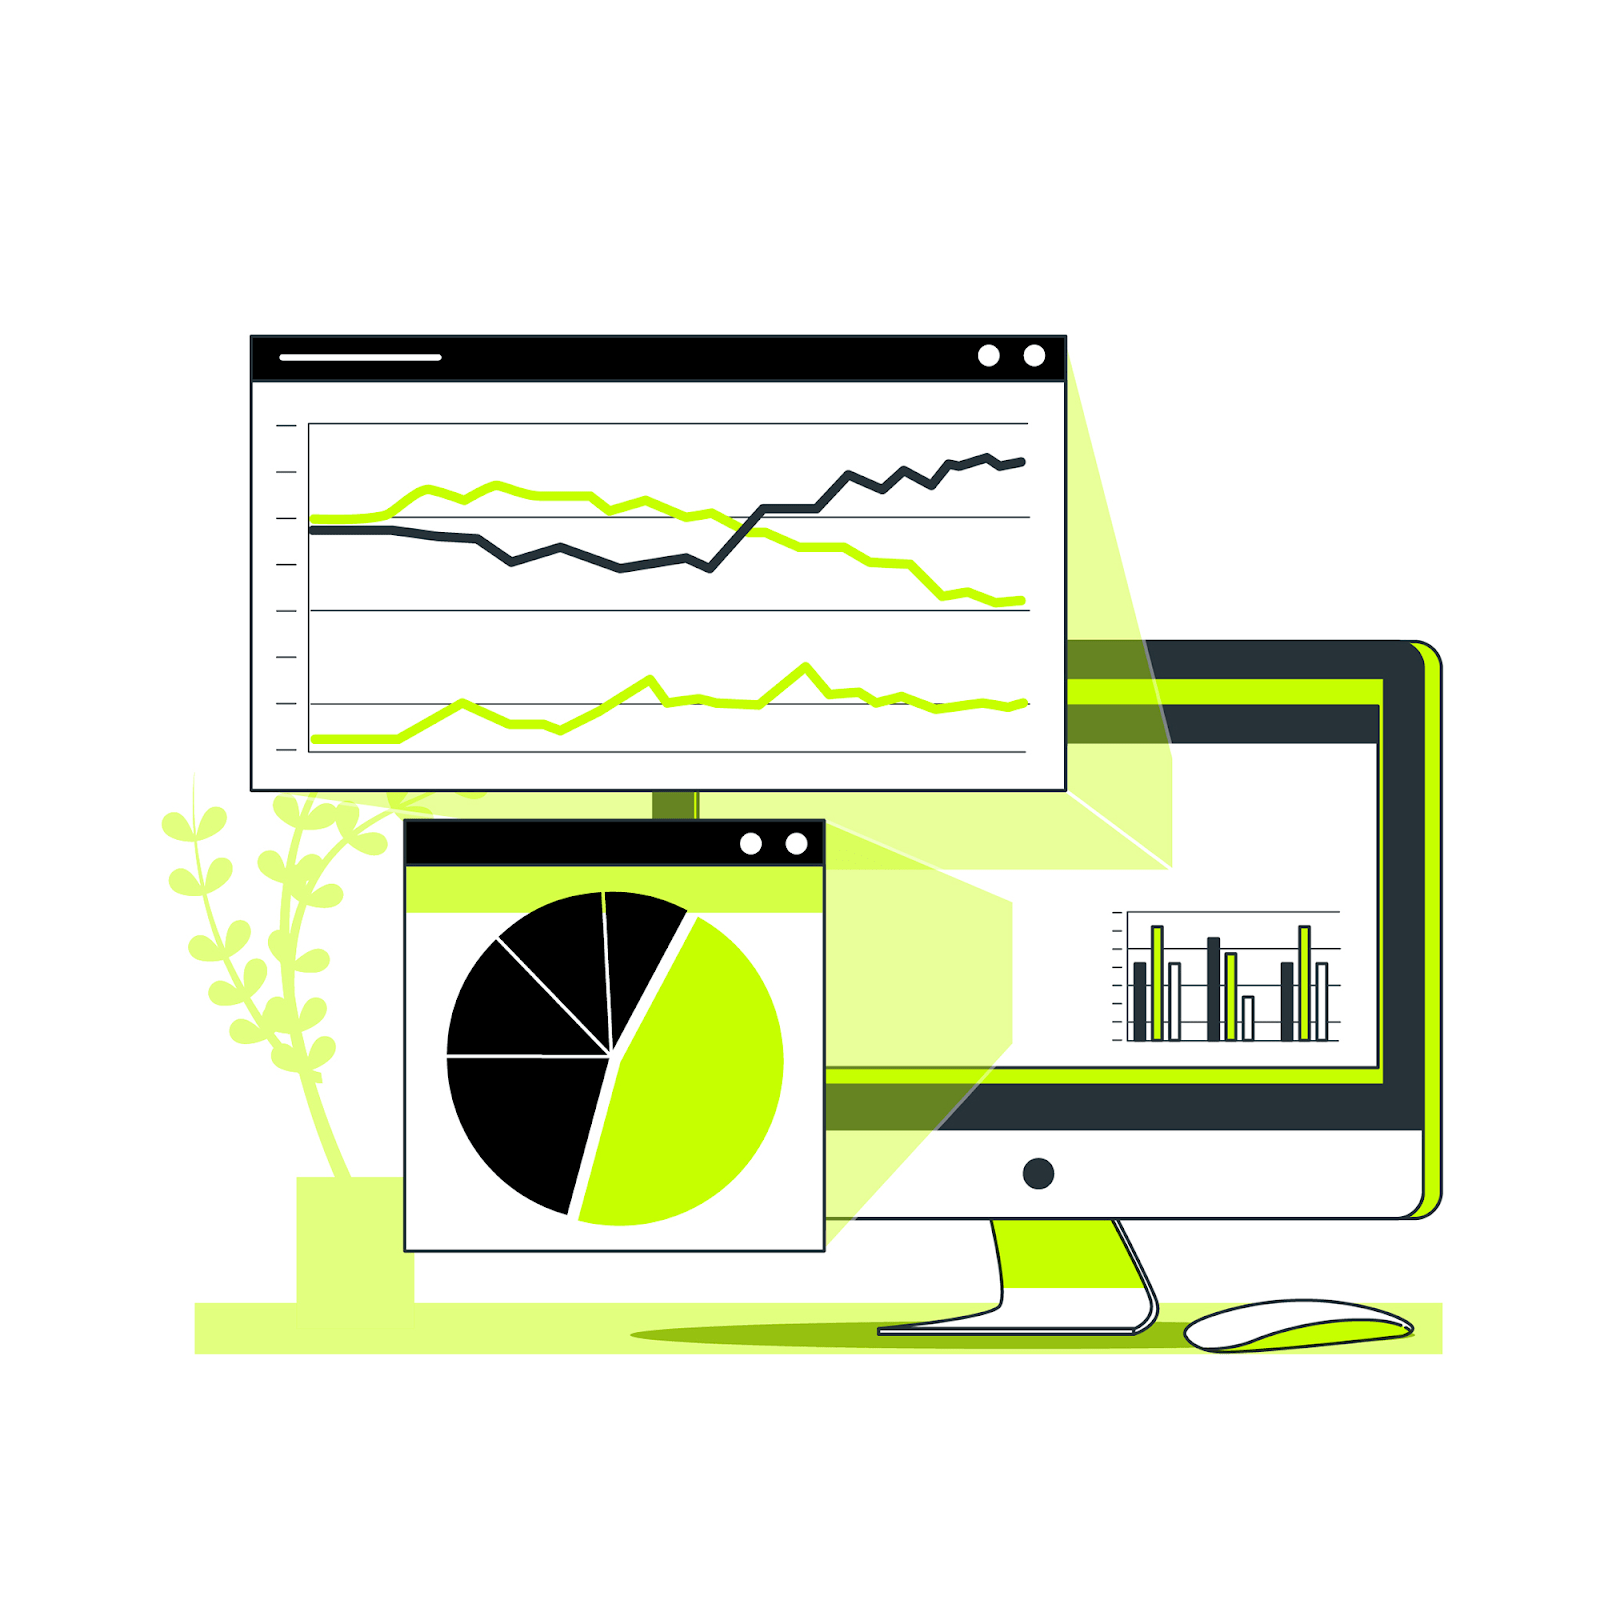
Key Components of Digital Experience Analytics

Image source: Freepik
Digital experience analytics has several key components that give you total visibility into user behavior and interactions on digital channels. Here are the main ones.
Real-time data
Real-time analytics lets you observe and analyze user behavior as it happens. It helps you spot and respond to issues, understand user behavior in the moment and make changes to the user experience on the fly.
User segmentation
User segmentation involves grouping users into segments based on demographics, behavior or purchase history. It lets you conduct a deeper analysis and create personalized marketing strategies to ensure different user segments get the right experience.
Cohort analysis
Cohort analysis looks at the behavior and performance of specific user groups over time. This component helps you understand how different cohorts behave, find trends and measure the impact of changes or updates on user retention and engagement.
Funnel analysis
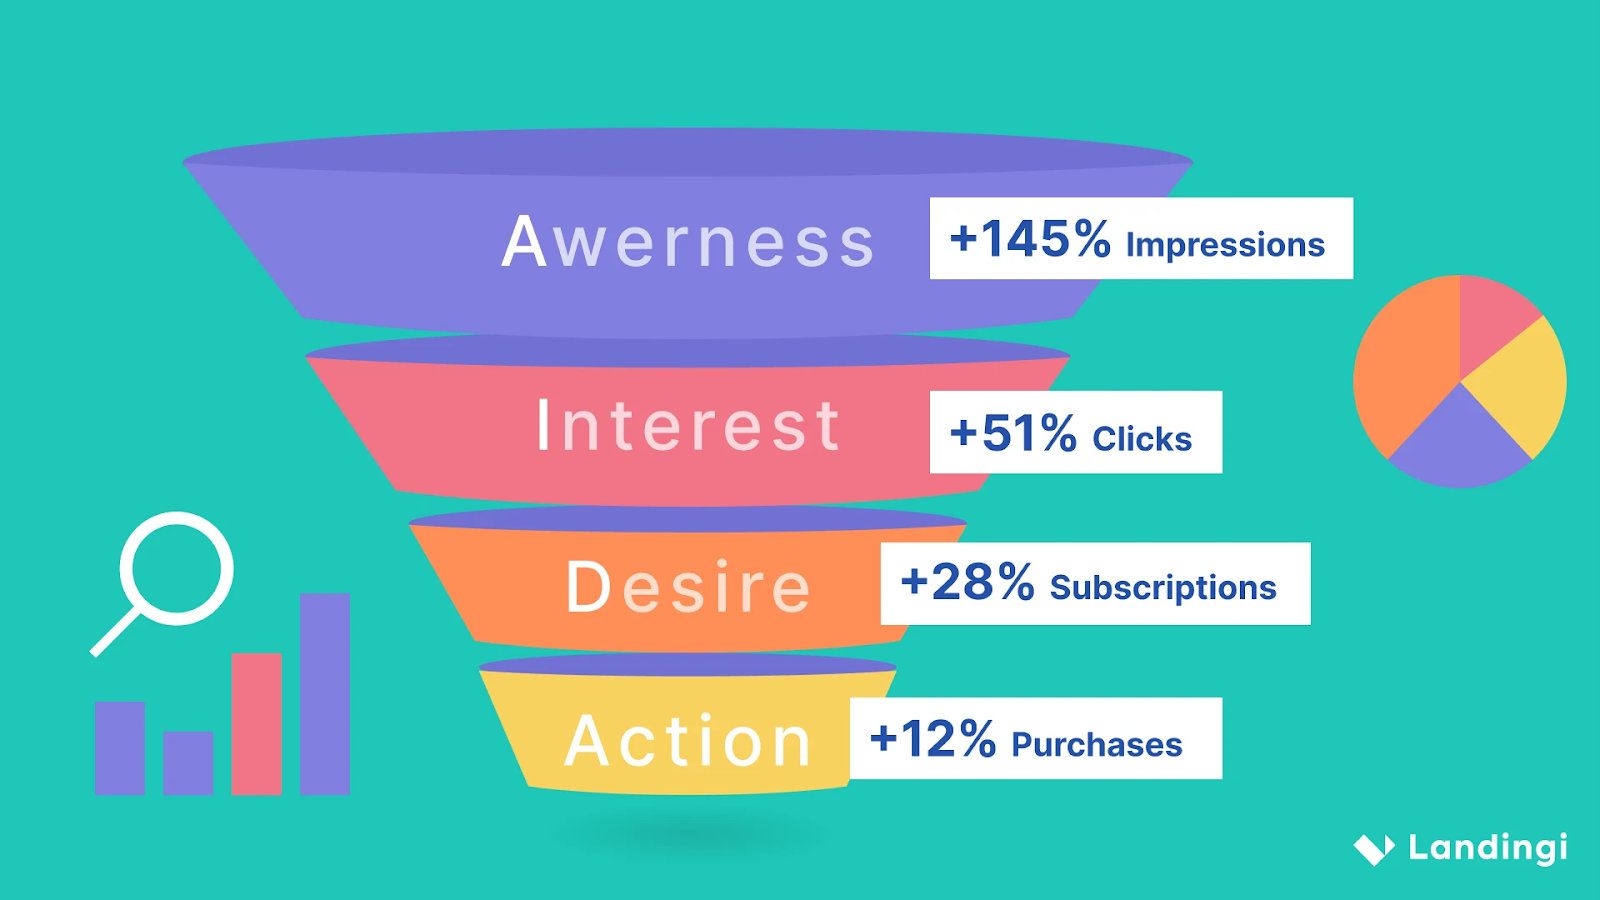
Image source: Landingi
Funnel analysis follows users’ steps to complete a specific goal, like making a purchase or signing up for a service. By examining each step of the conversion funnel, you can see where users drop off and implement changes to reduce friction and increase conversion rates.
A/B testing and experimentation
A/B testing and experimentation involve comparing two web pages or app feature versions to see which performs better. It lets you test hypotheses and make data-driven decisions to improve the user experience and get better outcomes.
Feedback and surveys
Getting direct feedback from users through surveys and website feedback forms gives you qualitative insights into their experience and satisfaction. It adds to the quantitative data and helps you better understand user needs and wants.
Performance metrics and KPIs
Performance metrics and KPIs measure the results of your digital assets. Metrics like page load time, bounce rate and user retention rate give you a snapshot of your platform and show you where to improve.
With these components of digital experience analytics tools, you can get total visibility of your user experience, make decisions, and continuously optimize your digital platforms for better user engagement and satisfaction.
Digital Experience Analytics for User Behavior Analysis

Image source: Freepik
Digital experience analytics gathers extensive data points from different sources to inform understanding of user behavior. The right user behavior tools help teams turn these insights into clearer decisions about clicks, drop-offs, friction points, and customer journeys. It is key for shaping digital experiences as it influences content and design decisions.
Here are practical examples:
- Identify navigation patterns: Analytics can reveal how users move through a site. If users frequently leave before reaching the checkout, this indicates a potential issue in the purchase process. Streamlining navigation or simplifying the checkout process can address this.
- Detect content engagement: Tools like heatmaps show which parts of a page users interact with most. If a section consistently grabs attention, create more content around that topic. If users skip sections, consider revising or removing that content.
- Monitor interactive elements: You can track interactions with forms, buttons, and sliders. If users abandon forms halfway, it might be too long or confusing. Test shorter forms or provide more precise instructions to improve completion rates.
- Analyze scroll depth: Understand how far users scroll before leaving. If users don’t reach the bottom of important pages, reorganize content to ensure key information appears earlier.
- Segment user behavior: Analyze behavior by different user groups. New visitors might need a guided tour, while returning visitors might appreciate quick access to frequently visited pages.
- Track conversion funnels: Identify where users drop off in the conversion process. If many abandon at the payment stage, it could indicate issues with the payment gateway or lack of options.
- Record sessions: Playback individual user sessions to reveal unexpected customer behavior, such as confusion over navigation. Use these insights to make targeted improvements.
Qualitative data offers contextual insights into user experiences, including motivations and frustrations, complementing quantitative data to provide a comprehensive understanding of user behavior.
This proactive approach improves user experience, boosts engagement, and drives business growth.
Digital Experience Analytics for Customer Journey Mapping
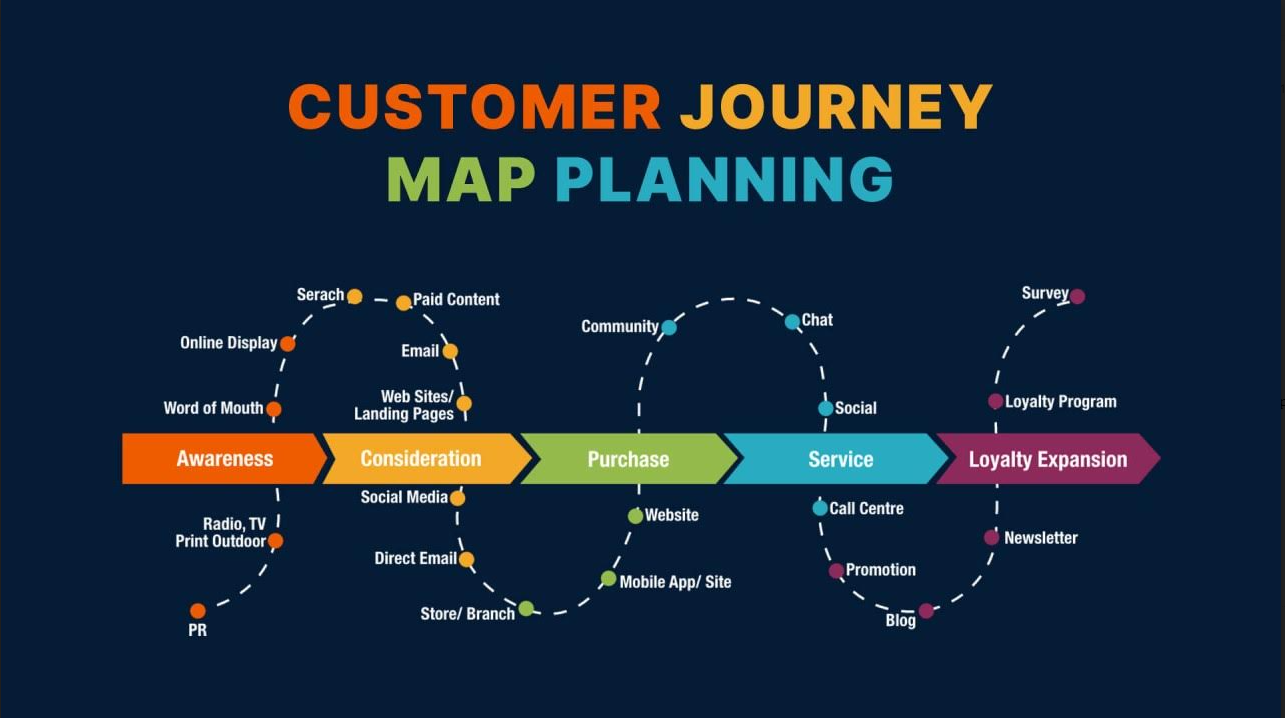
Image source: Finances Online
Digital experience analytics is key for customer journey mapping. It shows the entire customer decision-making process so you can identify high-value touchpoints and digital weak points to optimize user interactions.
Here are some use case examples:
- Create detailed customer journey maps: Customer journey mapping tools cover stages such as Awareness, Consideration, Purchase, Retention and Advocacy. These maps give you a 360-degree view of the customer experience, capturing actions, thoughts and emotions at each stage.
- Collect data from multiple sources: Getting insights from surveys, interviews and analytics is key to journey mapping. This data helps you understand user behavior, motivations, and pain points to create accurate and impactful journey maps.
- Spot pain points and opportunities: The main goal of user journey mapping is to spot pain points and opportunities. Digital experience analytics helps you see where users hit friction or drop off so you can fix these problems and improve the overall experience.
- Visualize the customer journey: Maps can include columns and rows for each stage. For example, the Awareness stage might include touchpoints like social media ads and blog posts, and the Purchase stage might cover the checkout process and payment options.
- Break down each stage: Each stage of the customer journey map outlines the touchpoints, actions, thoughts, emotions, pain points and opportunities. For example, during the Consideration stage, users might compare products and read reviews and feel excitement and uncertainty. Knowing these emotions can help you tailor content and interactions to ease concerns and build trust.
- Ensure cross-channel consistency: By mapping the customer journey, you can ensure consistency across all online and offline touchpoints, so your messaging and branding stay on track.
With these aspects of digital experience analytics, you can create more effective and engaging customer journeys. It will improve user satisfaction and engagement and drive higher conversion rates and long-term loyalty.
Digital Experience Analytics for Conversion Rate Optimization
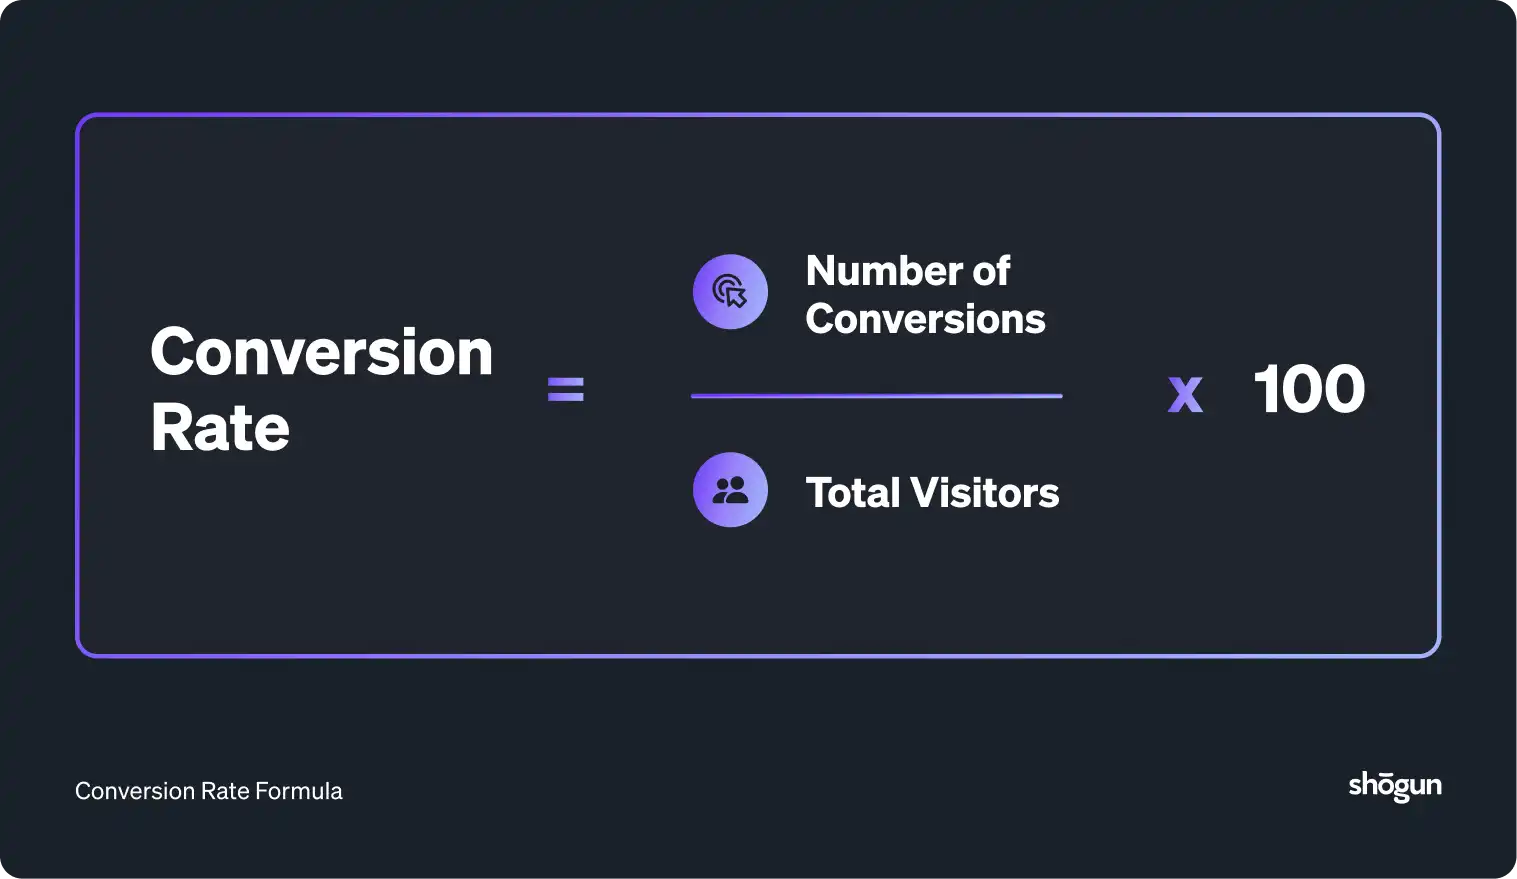
Image source: Shogun
Increasing conversion rates boosts immediate revenue and overall business performance. Here’s how to use digital experience analytics for conversion rate optimization:
- Personalize user experiences: Personalised content based on user behavior increases conversion rates. For example, personalized product recommendations or targeted email campaigns can get users to take the desired action, like buying or signing up for a service.
- Start A/B testing: Experiment with various elements of your website or app, such as headlines, images, CTAs and layouts. Clear call-to-action buttons increase the likelihood of conversions. Compare different versions and see which performs better to implement the winning variation to improve user experience and conversion.
- Optimize landing pages: Analytics will show how users interact with your landing pages to spot areas for improvement. For example, if users are bailing out of the page quickly, it might be because the content isn’t engaging or the CTA is unclear. Optimizing landing page elements based on this data helps improve user engagement and drive higher conversion rates.
- Simplify the checkout: See issues like complicated forms, limited payment options or slow page load times. Simplify the checkout and fix these points for a smoother user experience and higher conversion rates.
- Improve mobile experience: With users accessing your website on mobile devices, mobile optimization is key to CRO. Optimize page load times, simplify navigation, and ensure forms and buttons are accessible on smaller screens.
- Increase page load speed: Slow page load times can have a big impact on user experience and conversion rates. Monitor pages with high load times and what’s causing the delay. Optimize images, use browser caching and minimize JavaScript to keep users engaged and more likely to convert.
This proactive approach will improve user satisfaction and engagement and drive overall business performance by turning more visitors into customers.
Overcoming Challenges in Digital Experience Analytics
Digital experience analytics is useful but challenging to implement. Here are the three biggest issues and how to overcome them.
Data integration complexity
Combining data from multiple sources is complex. Different platforms use different formats and metrics, so it takes much work to get a single view.
To overcome this, invest in an analytics tool that supports data integration. FullSession, for example, combines data from multiple touchpoints to give you a single view of user behavior.
Data overload
With so much data, it’s hard to know what to focus on and what’s important. It can lead to analysis paralysis, blocking your actions.
FullSession solves this by providing intuitive dashboards and customizable reports that highlight key metrics and trends so you can focus on actionable insights and drive meaningful change.
Data accuracy
Tracking errors, inconsistent data collection methods and technical glitches can compromise data integrity. Regular audits and trustworthy analytics software like FullSession can help maintain data accuracy.
FullSession’s advanced tracking capabilities ensure precise data collection, minimize errors, and give reliable insights.
Privacy and compliance
Non-compliance can result in big fines and damage to your reputation. FullSession is designed with privacy and compliance in mind and respects PCI, GDPR and CCPA standards.
You can be sure your data practices are secure and compliant and enjoy using the power of analytics for your website optimization efforts.
By tackling these challenges, you can get the most out of digital experience analytics and improve user experiences and growth.
Best Practices for Digital Experience Analytics

Image source: Freepik
To get the most out of digital experience analytics, focus on clear goals, whether improving customer satisfaction or increasing your Net Promoter Score.
Use data to test hypotheses. It means testing your ideas with real user interaction and making decisions based on what you find. It will help you discover the biggest areas to improve.
Consider setting up feedback loops with your users. Listen to their experiences to build trust. A trusted platform like FullSession will encourage users to share their thoughts and give you the most useful data to work with.
Create dashboards that show key metrics. These will help you track changes over time and spot trends. Easy-to-read charts will help your team quickly understand the current state of user experience.
Don’t forget about user journeys. Analyze user paths to see what’s working and what’s not on your site. It will help you improve customer experiences by fixing the pain points in their journey.
Review your analytics tools and strategies regularly. Make sure they align with your business goals and user needs. If your current platform feels too complex, expensive, or limited for your workflow, comparing Contentsquare alternatives can help you evaluate other options for behavioral analytics, journey mapping, and conversion optimization.
Conclusion About Digital Experience Analytics
Digital experience analytics is the key to managing and improving your website.
You can optimize the user journey, ensuring smoother navigation and better overall satisfaction. By addressing stumbling blocks, you can create a more seamless experience.
You can identify trends and patterns in user behavior, leading to informed decisions about design and content updates and aligning them with user expectations.
By reviewing your analytics regularly, you keep your strategies current. As user preferences change, analytics helps you stay ahead of the curve.
Using digital experience analytics tools and insights, you keep your site user-centric and efficient. It means deeper engagement with your audience and more repeat visits and loyalty.
Ready to upgrade your digital experience and boost your conversions? Discover the power of FullSession. Sign up today or request a demo to start transforming your website with actionable insights and seamless user interactions!
FAQs About Digital Experience Analytics
Let’s answer the most common questions about digital experience analytics.
What is digital experience analytics?
Digital experience analytics (DEA) refers to collecting, analyzing, and interpreting data on user interactions with digital platforms such as websites and mobile apps. The goal is to understand user behavior, optimize user experiences, and improve overall business performance.
What does a digital experience analyst do?
A digital experience analyst monitors and analyzes user interactions on digital platforms. They use platforms like FullSession to gather data, identify trends, and provide actionable insights. Their work helps improve user experience, drive conversions, and inform strategic decisions.
What do you mean by digital analytics?
Digital analytics involves measuring, collecting, analyzing, and reporting data from digital channels. It includes websites, social media, and mobile apps. The goal is to understand user behavior, optimize digital strategies, and achieve business objectives.
What are the four types of digital analytics?
The four types of digital analytics are:
- Descriptive analytics: Provides insights into what has happened by analyzing historical data.
- Diagnostic analytics: Explains why something happened by identifying patterns and correlations in the data.
- Predictive analytics: Uses statistical models and machine learning to forecast future outcomes based on historical data.
- Prescriptive analytics: Recommends actions to achieve desired outcomes by analyzing data and predicting future trends.
Mohamed oversees operations and finance at FullSession and has contributed to the company’s UX analytics knowledge base.