You can track hundreds of user interactions and still miss the reason users leave a funnel. That’s the real problem event tracking tools should solve.
Event tracking tools record specific user interactions as timestamped event data. A click, form submission, file download, purchase, app event, or error becomes a named event with a user ID, timestamp, and event properties. This gives product, UX, marketing, and engineering teams more detail than traditional web analytics alone.
This guide compares the best event tracking tools for product analytics, UX analytics, website traffic, mobile apps, customer data pipelines, and session replay workflows. You’ll also learn how event tracking works, how many events to track, and how to pick the right tracking tool for your team.
Key Takeaway
- FullSession is best for product, UX, and growth teams that need event tracking, session replays, funnels, heatmaps, and user feedback in one workspace.
- Google Analytics 4 is a practical option for free event tracking, web analytics, and Google Ads attribution.
- Mixpanel is strong for SaaS teams that need funnel analysis, cohort analysis, and user segmentation based on event data.
- Amplitude is useful for larger product and growth teams that need behavioral analytics, experimentation, and cross-platform tracking.
- Heap is helpful for teams that want automatic tracking and retrospective event analysis without planning every event before launch.
- FullStory suits enterprise teams that need searchable user behavior data, session replay, and digital experience insights at scale.
- Hotjar works well for marketing, UX, and CRO teams that need simple heatmaps, session recordings, and user feedback tools.
- Segment is useful for data and engineering teams that need to collect events once and route event data to analytics tools, CRMs, and data warehouses.
- PostHog is a strong fit for engineering-led teams that want open-source product analytics, feature flags, A/B testing, and self-hosting options.
- Countly is useful for mobile-first or regulated teams that need event tracking, push notifications, and private-cloud or on-premise deployment options.
FullSession suits teams that don’t want event data sitting separately from the user experience behind it. It connects tracking events, funnel drop-offs, session replays, heatmaps, feedback, and friction insights in one workflow.
See how event tracking and session replay work together.
What Is an Event Tracking System?
An event tracking system is an analytics tool that records user actions as named, timestamped data points. Each time a user performs a qualifying action, the system logs the event name, timestamp, user ID, and event properties that describe the context.
A button_clicked event, for example, may include button_label=’Sign Up’, page_url=’/pricing’, and plan_type=’Pro’. Those properties turn raw event data into relevant data your team can segment, filter, and use for data-driven decisions.
How does event tracking work?
Event collection happens through four main methods:
- SDKs (software development kits): The most common approach for web and mobile apps.
- Browser tags: Lightweight scripts that fire events directly in the browser.
- Server-side tracking: Events sent from your server rather than the user’s browser, useful for accuracy and privacy.
- Google Tag Manager: Let’s marketers and CRO teams collect events on a web page without asking developers to change the source code.
Automatic vs. manual event tracking
Automatic tracking captures common visitor interactions such as clicks, scrolls, form submissions, and file downloads with little setup. Manual event tracking requires teams to define and instrument specific user interactions, giving more control over what data is collected and how each custom event is named.
What good event tracking looks like
Tracking events consistently helps teams see how users interact with a product, how they navigate between key screens, and where data from each action becomes useful.
Relevant event tracking connects user event data to a clear business question. Collecting events without that connection just creates storage noise. Most modern event tracking platforms support cross-platform tracking across web and mobile apps. For more on how session recordings support this workflow, see our breakdown of session recording and replay.
Event Tracking vs Traditional Web Analytics
Traditional web analytics explains traffic and acquisition. Event tracking explains user behavior at the interaction level.
The two can work together, but they answer different questions. Event tracking adds interaction-based data for product, UX, and conversion decisions.
| Dimension | Traditional Web Analytics | Event Tracking |
| Main unit | Sessions, users, and page views | Individual user interactions and app events |
| Data captured | URLs, traffic sources, device data, and time on page | Clicks, form submissions, purchases, errors, file downloads, and custom events |
| Granularity | Mostly aggregated website traffic reports | User-level sequences and interaction-based data |
| Best use | Channel reporting and acquisition analysis | Funnel analysis, feature adoption, user segmentation, and product decisions |
| Platform coverage | Primarily web analytics | Web and mobile apps, server-side events, and data warehouse pipelines |
How We Selected These Event Tracking Tools
Each platform was evaluated against a consistent set of criteria, making the comparison easier to scan.
- Feature depth: custom event support, automatic tracking, funnel tracking, user segmentation, and session replay.
- Ease of setup: SDKs, Google Tag Manager support, no-code options, and documentation quality.
- Platform coverage: support for web and mobile apps, server-side data collection, and cross-platform tracking.
- Data workflow: CDP support, routing event data, data warehouse sync, and governance controls.
- Buyer fit: coverage for marketers, product teams, UX teams, engineering teams, and enterprise data teams.
- Pricing clarity: availability of free plans, starting prices, usage-based models, and custom enterprise pricing where available.
Best Event Tracking Tools at a Glance
Use this table to shortlist tools by use case, tracking method, session replay support, and pricing model before reading the full reviews.
| Tool | G2 Rating | Best For | Top Feature | Starting Price |
| FullSession | 5.0 | E-commerce, product and UX teams that need event data plus session replay in one workspace | Lift AI with session replays linked directly to events | Free plan; paid from $23/mo annually |
| Google Analytics 4 | 4.5 | Marketers needing free web analytics and Google Ads integration | Automatic event tracking | Free; GA 360 custom pricing |
| Mixpanel | 4.5 | SaaS product teams needing funnel analysis and retention tracking | Cohort and funnel analysis | Free plan; paid pricing is event-based |
| Amplitude | 4.5 | Mid-market to enterprise growth teams | Behavioral cohort analysis and A/B testing | Free plan; Plus from $61/mo monthly |
| Heap | 4.4 | Teams needing retroactive event analysis | Retroactive autocapture | Free plan; paid plans custom-priced |
| FullStory | 4.5 | Enterprise UX teams need searchable behavioral data at scale | DX Data autocapture with session replay | Custom pricing |
| Hotjar | 4.3 | CRO and marketing teams need visual behavior data | Heatmaps and session recordings | Free plan; Growth from $49/mo monthly |
| Segment | 4.5 | Data teams routing event pipelines across tools | Event routing to 400+ integrations | Free to 1,000 MTUs/mo; Team from $120/mo |
| PostHog | 4.5 | Engineering-led teams want open-source control | Self-hosted all-in-one suite with feature flags | Free plan; usage-based pricing after limits |
| Countly | 4.2 | Regulated industries need mobile and web tracking | Self-hosted mobile event tracking | Lite plan free; Flex paid from $40/mo; Enterprise custom |
10 Event Tracking Tools for Product, UX, and Website Analytics
These reviews cover the best event tracking tools for analyzing user behavior, improving funnels, and connecting event data with session recordings, heatmaps, user feedback, and product analytics.
1. FullSession
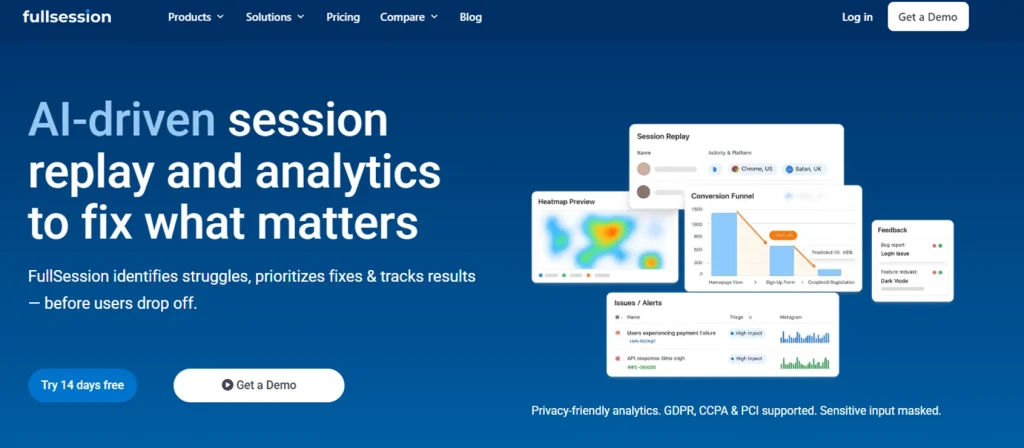
FullSession is a user behavior analytics platform that integrates event data, session replays, funnels, heatmaps, feedback, and error signals into a single workspace. It helps teams move from “what happened” to “why it happened” without switching between separate event analytics and replay tools.
Lift AI adds a prioritization layer on top of that data. It analyzes behavior patterns and error signals to identify the highest-impact fixes, ranked by estimated revenue impact, so your team can work on what matters most instead of debating where to start.
On the privacy side, FullSession is built for compliance from the ground up. It supports GDPR, PCI and CCPA requirements, gives teams control over data masking and user consent and captures only the behavioral data you define. Sensitive input fields are not recorded by default.
Best for
Product, UX, SaaS, and ecommerce teams that need event tracking, session recordings, funnel analysis, and friction insights connected at the event level.
Key features
- Session replays linked to events: Jump straight from a funnel step, error, click, or feedback submission to the exact session behind it. No more guessing what happened.
- Funnels and conversions: Build no-code funnel tracking reports, watch the sessions behind every drop-off, and prioritize the fixes that actually lift conversion.
- Heatmaps: See where users click, scroll, and engage on key pages to understand user interest, ignored elements, and layout friction.
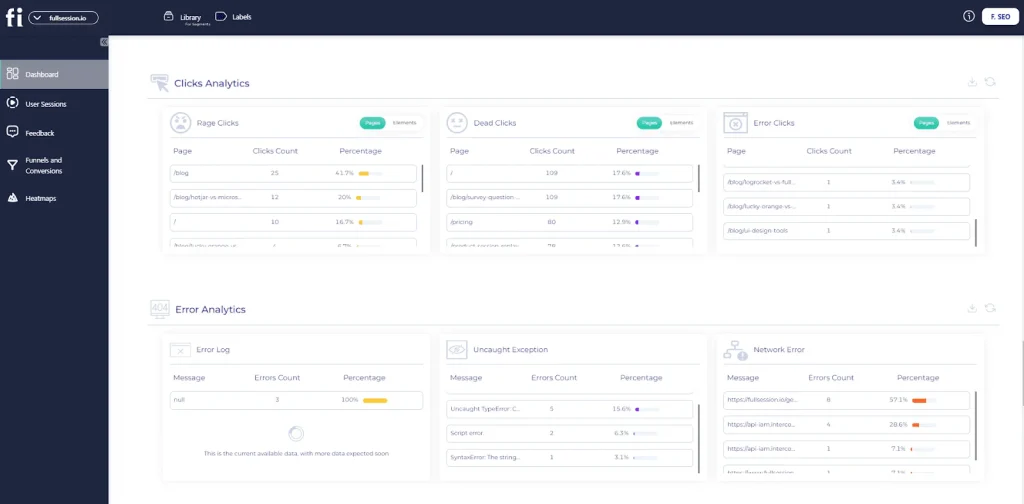
- Errors and alerts: See JavaScript errors, rage clicks, dead clicks, and broken interactive elements in real time, with full replay and network context.
- Custom event tracking: Track important user actions as named events and filter reports by event properties for cleaner product and UX analysis.
- User feedback: Collect in-page feedback and connect it to the session recording, helping teams compare what users say with what they actually did.
- Lift AI: Rank friction points by predicted business impact, so your team fixes what moves outcomes instead of reviewing sessions one by one.
Pricing
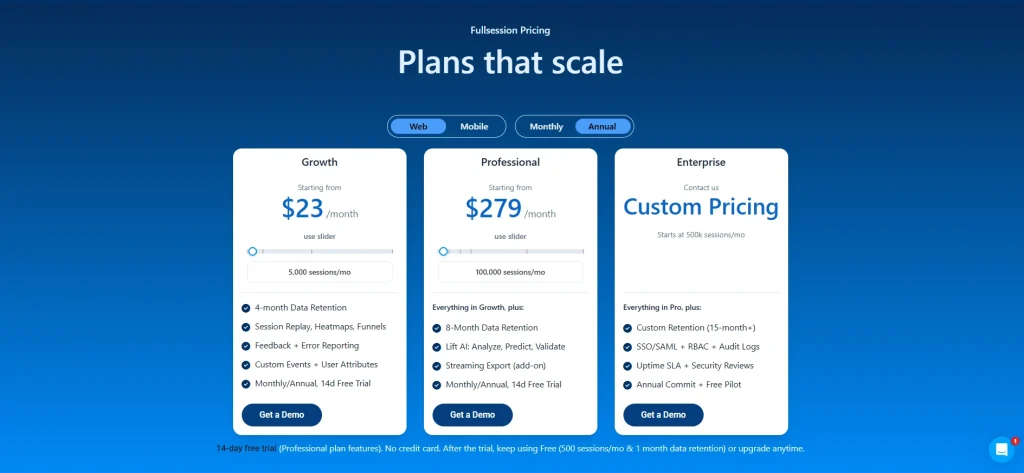
The Free plan covers 500 sessions per month, 1-month retention, 2 seats, and 1 domain for testing basic behavior tracking.
Growth starts at $23 per month billed annually for 5,000 sessions per month, with session replay, heatmaps, funnels, feedback, error reporting, custom events, and user attributes.
Professional starts at $279 per month, billed annually for 100,000 sessions per month. It adds longer retention, Lift AI, and deeper analysis for teams that need more from their event tracking workflows.
See Event Tracking and Session Replay Working Together
No setup complexity. No switching tools. See it live in 30 minutes.
2. Google Analytics 4
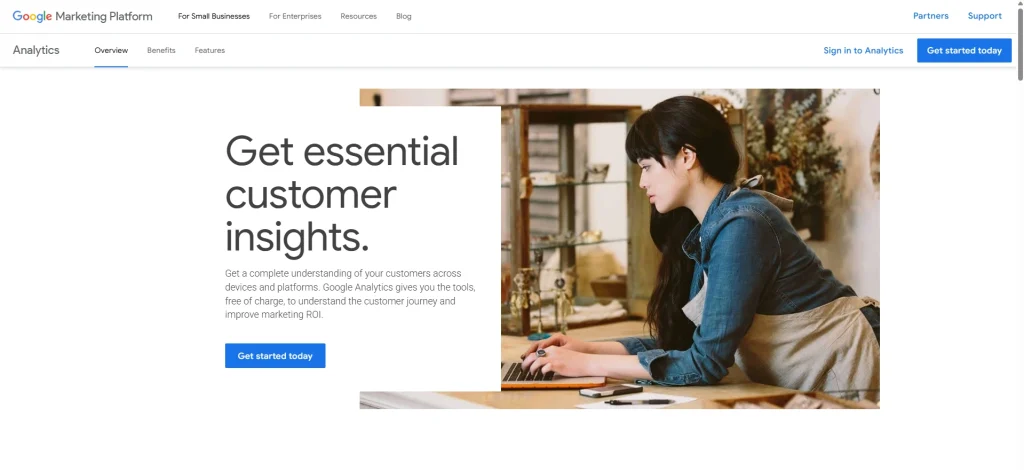
Google Analytics 4 (GA4) is Google’s event-based analytics platform for tracking user behavior across websites and apps.. It treats page views, clicks, scrolls, purchases, and other user actions as events, which makes it a practical starting point for free event tracking and advertising attribution.
Read our comparisons to learn more:
Best for
Website owners, marketers, and growth teams that need free web analytics, basic event collection, and Google Ads integration.
Key features
- Automatic event tracking: Capture page views, scrolls, outbound clicks, site search, video engagement, and file downloads when enhanced measurement is on.
- Custom events via Google Tag Manager: Create events for CTA clicks, form submissions, and other relevant interactions without changing source code.
- Exploration reports: Build funnel analysis, path exploration, and segment reports around key events.
- Cross-platform tracking: Combine web and mobile app data in one property.
- Google Ads integration: Send conversion events into paid media workflows for campaign tuning.
Pricing
GA4 standard is free. Google Analytics 360 is the enterprise version and starts around $50,000/year.
3. Mixpanel
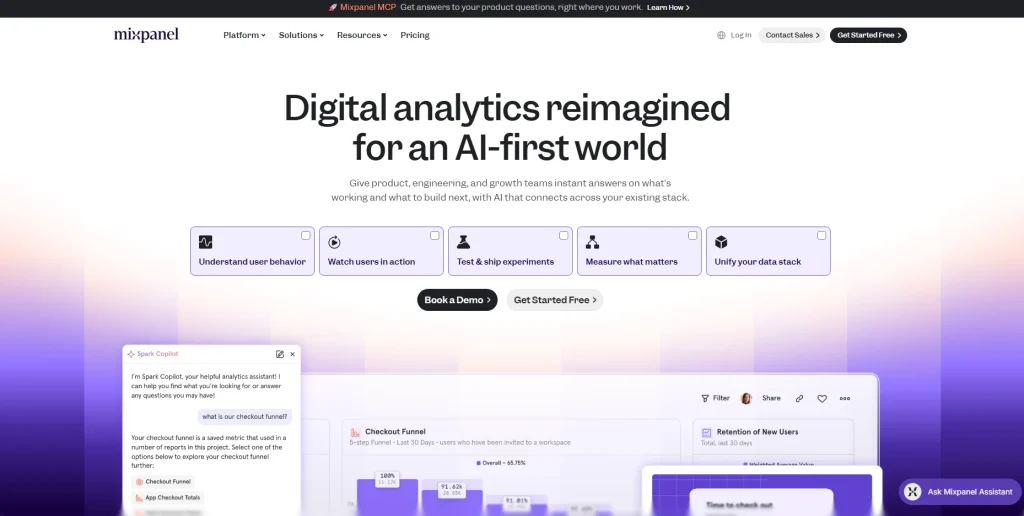
Mixpanel is a product analytics platform built around event tracking, funnel analysis, retention reports, and cohort analysis. It helps SaaS teams understand user journeys, compare segments, and measure user engagement with features over time.
Learn more:
Best for
SaaS product teams that need detailed funnel tracking, retention analysis, and user segmentation without building a custom analytics stack.
Key features
- Event and funnel analysis: Build funnels from any event sequence and measure conversion rates, drop-off, and time to convert.
- Cohort analysis: Group users by event behavior, event properties, plan type, or lifecycle stage.
- Session replays: Review recordings alongside event analysis where available in the plan.
- Autocapture and SDK tracking: Use automatic tracking for common web interactions or manual event tracking for specific user interactions.
- Data warehouse integrations: Sync tracking data to destinations such as Snowflake and BigQuery for deeper analysis.
Pricing
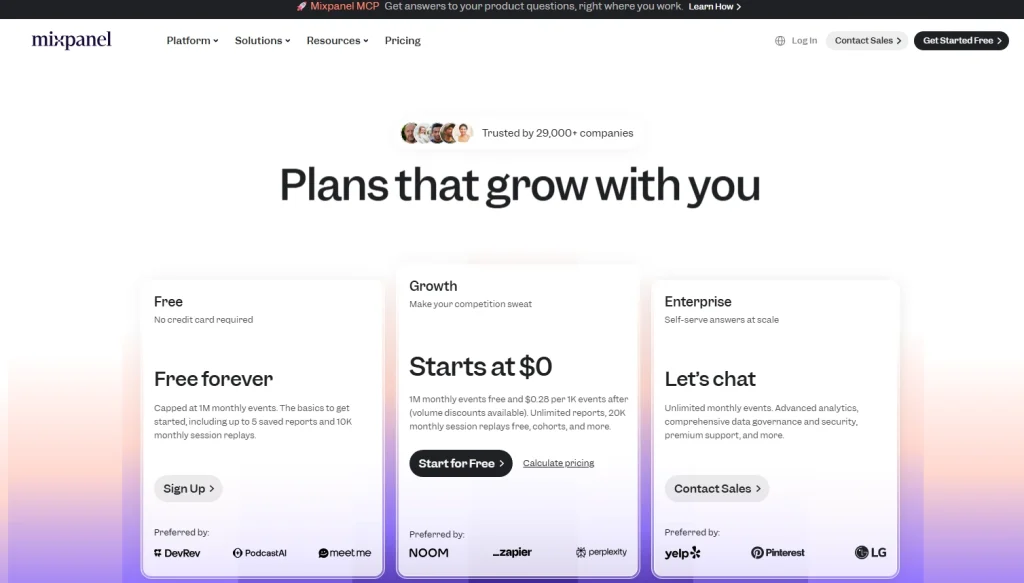
Mixpanel offers a Free plan. Paid Growth pricing is event-based and scales with monthly event volume. Enterprise plans use custom pricing.
4. Amplitude
Amplitude is a digital analytics platform for product and growth teams that need behavioral analytics, journey analysis, experimentation, and event governance. It is built for teams that want to connect product usage analytics with growth decisions.
- Compare Google Analytics vs Amplitude
- Explore Amplitude alternatives
Best for
Mid-market and enterprise product teams that need deep behavioral analytics, A/B testing, and governance for event data.
Key features
- Behavioral cohort analysis: Create cohorts from event sequences, properties, and user actions.
- Funnel and path analysis: Find where users drop from onboarding, activation, checkout, or feature adoption flows.
- Experimentation: Tie A/B test outcomes to key events and user behavior metrics.
- Cross-platform tracking: Use SDKs for web, iOS, Android, and server-side event collection.
- Data governance: Manage event names, schemas, and tracking plans to cut noisy or duplicate events.
Pricing
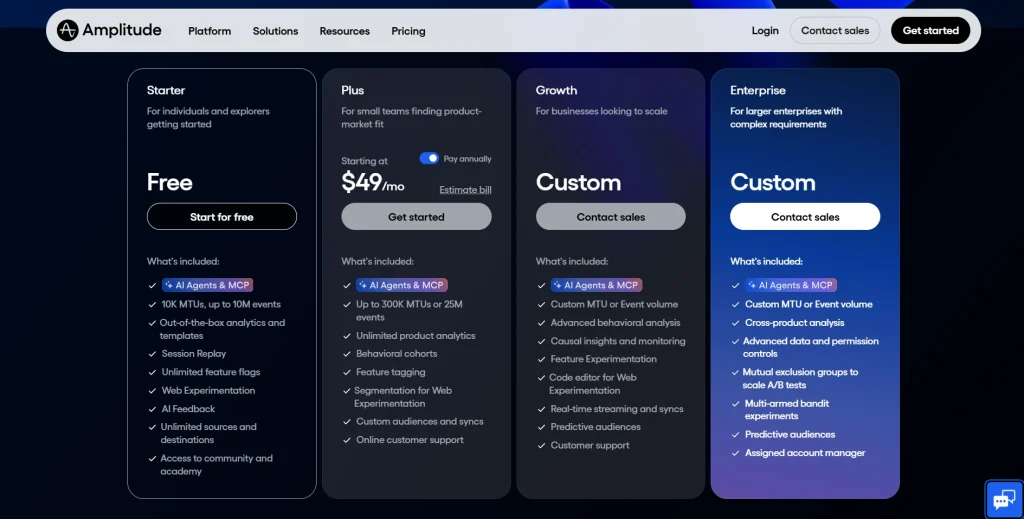
Amplitude offers a Free Starter plan. Plus starts at $61 per month when paid monthly. Growth and Enterprise plans use custom pricing.
5. Heap
Heap is an autocapture analytics platform that records visitor interactions automatically after installation. Teams can define events after data is collected, enabling retroactive analysis when not all tracking needs are known upfront.
Read our guide on Heap alternatives to learn more.
Best for
Product teams that want automatic tracking and retroactive event definition with less upfront instrumentation.
Key features
- Retroactive autocapture: Capture clicks, taps, inputs, page views, and other interactions before events are formally named.
- Funnel analysis: Build funnels from retroactively defined events and compare drop-off by user segment.
- Journey analysis: Map user journeys to see which paths lead to conversion or abandonment.
- Session replay: Watch user sessions behind funnel steps and friction points.
- CRM and CDP integrations: Connect behavioral data with tools such as Salesforce, HubSpot, and Segment.
Pricing
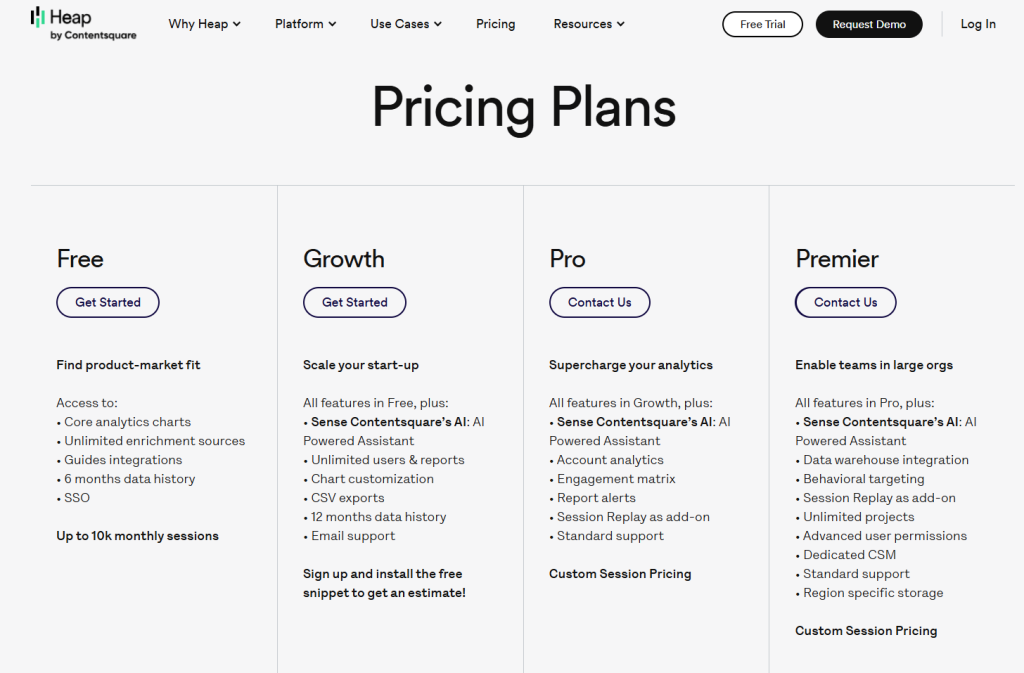
Heap offers a Free plan. Paid Growth, Pro, and Premier plans are based on session volume and use custom pricing.
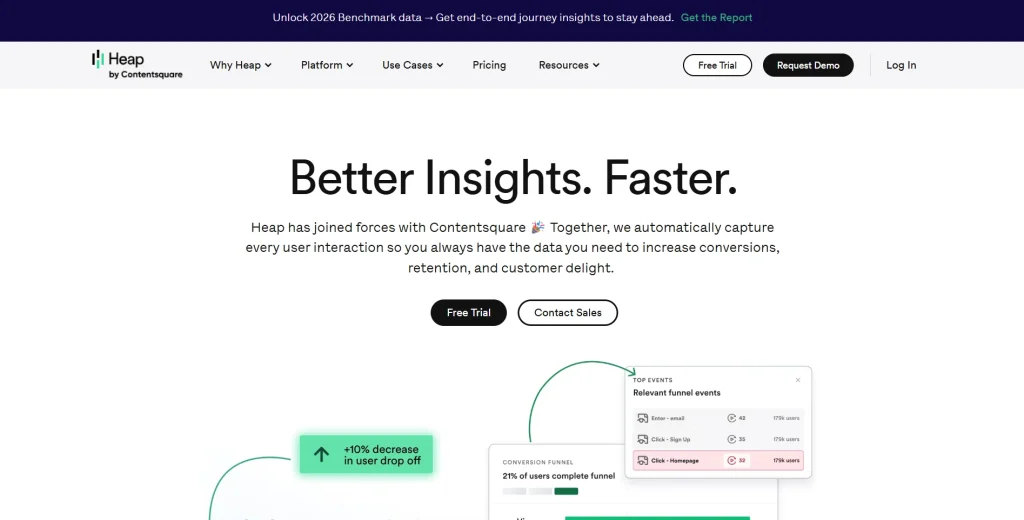
6. FullStory
FullStory is a digital experience intelligence platform that autocaptures behavioral data and makes sessions searchable. It’s designed for teams that need to find patterns in large volumes of user interactions and connect those patterns to session replay.
- See how FullSession compares to FullStory.
- Check out FullStory competitors to learn more.
- Read more about LogRocket vs FullStory.
- Learn more about Hotjar vs FullStory.
Best for
Enterprise UX, product, support, and engineering teams that need searchable session replay and behavioral analytics at scale.
Key features
- Autocapture through DX Data: Collect detailed visitor interactions automatically without predefining every event.
- Behavioral search: Search for clicks, errors, rage clicks, dead clicks, and other patterns across sessions.
- Funnels and paths: Analyze conversion flows and locate steps where users drop off.
- Friction detection: See rage clicks, dead clicks, and JavaScript errors as signals of poor user experiences.
- Heatmaps: Use aggregated click and scroll behavior to gauge user interest on key pages.
Pricing
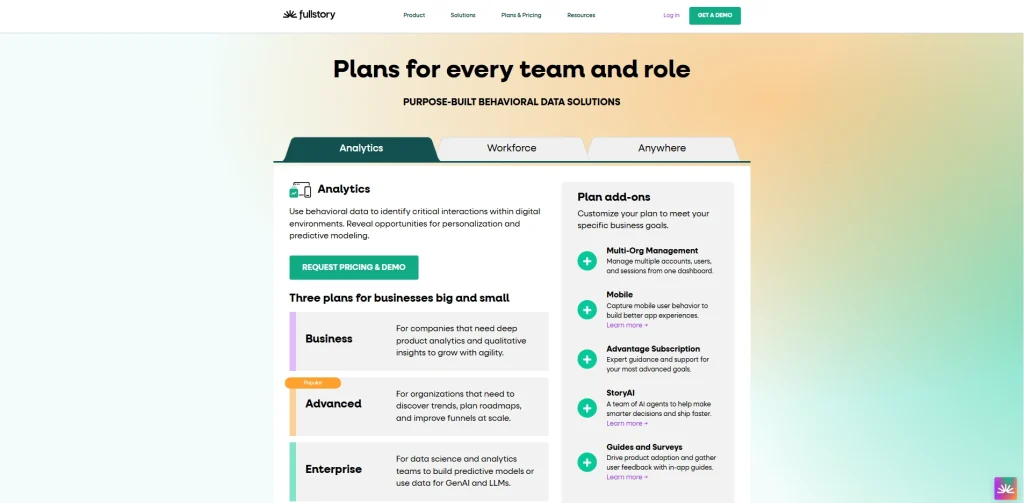
FullStory offers a free plan with 30,000 monthly sessions. Business, Advanced, and Enterprise plans use custom pricing through a demo or sales request.
7. Hotjar
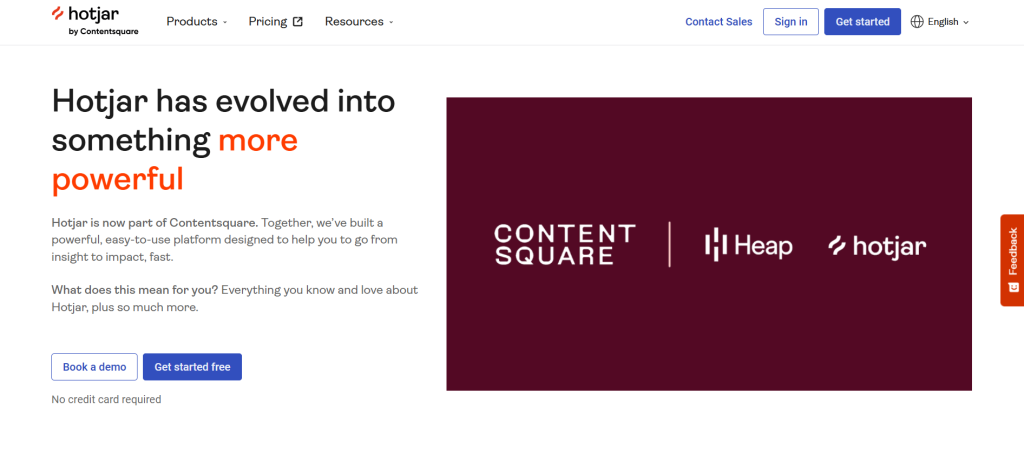
Hotjar is a behavior analytics and user feedback platform focused on heatmaps, session recordings, surveys, and feedback widgets. It’s simple to set up and works well when teams need visual behavior data more than complex event schemas.
- Read our in-depth Hotjar review
- See how Hotjar impacts website performance
- Check the FullSession vs Hotjar feature breakdown
- Learn more about Hotjar alternatives
Best for
Marketing, UX, and CRO teams that need heatmaps, session recordings, and user feedback without heavy technical setup.
Key features
- Heatmaps: Show where users click, scroll, and move on important pages.
- Session recordings: Replay visitor interactions to see where users hesitate, miss interactive elements, or abandon flows.
- Feedback widgets: Collect user feedback at specific moments in the journey.
- Funnels: Track user drop-off across selected pages or journey steps in supported plans.
- Events API: Trigger recordings, filters, and surveys from custom event activity.
Pricing
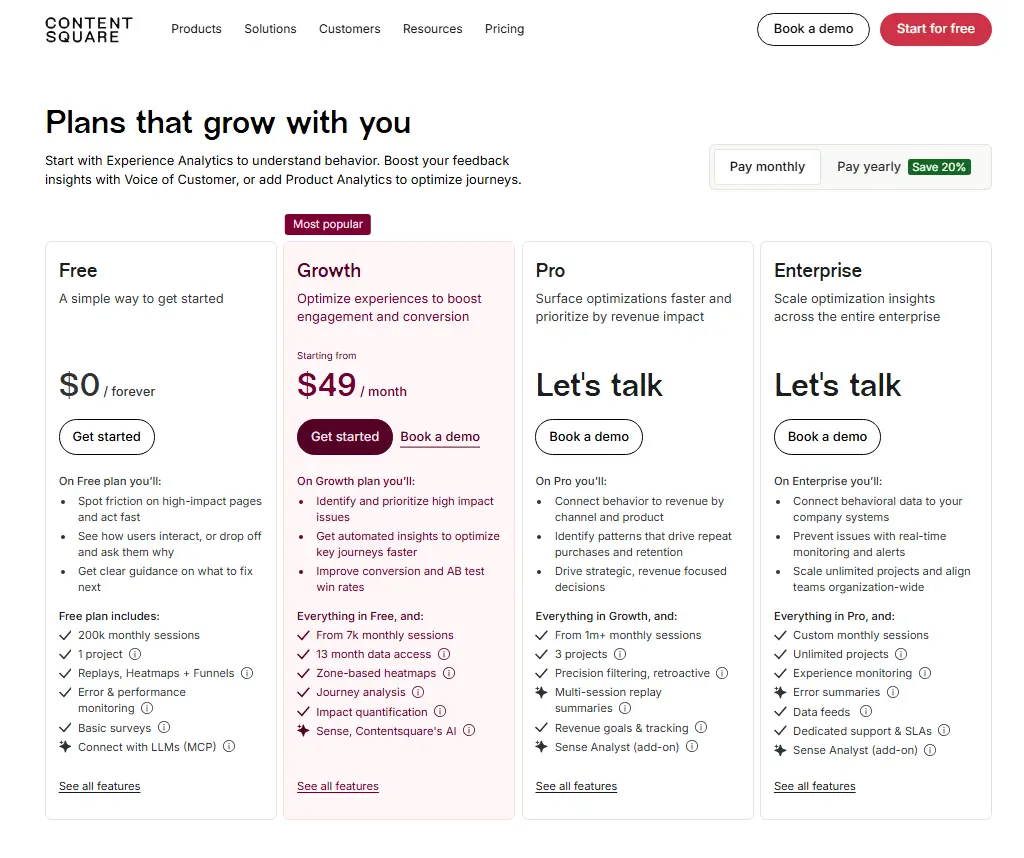
Hotjar, now part of Contentsquare, offers a Free plan. The monthly Growth plan starts at $49 per month. Pro and Enterprise plans use custom pricing.
8. Segment
Segment, a Twilio company, is a customer data platform for collecting, standardizing, and routing event data. It isn’t mainly a reporting tool. It’s the pipeline layer that helps teams collect events once and send the same tracking data to analytics tools, CRMs, email platforms, and data warehouse destinations.
Best for
Data and engineering teams that need consistent event collection and routing event data across a multi-tool stack.
Key features
- Event collection via SDKs: Collect events from web, iOS, Android, server-side systems, and other digital platforms.
- 400+ destinations: Route event data to product analytics platforms, marketing tools, CRMs, and warehouses.
- Identity resolution: Connect anonymous and known users across sessions and devices.
- Warehouse sync: Send raw event data to Snowflake, BigQuery, Redshift, and other data storage systems.
- Governance controls: Block, transform, or standardize event properties before data reaches downstream tools.
Pricing
A free developer tier is available. The Team plan is typically priced at about $120 per month for higher usage limits and additional features.
9. PostHog
PostHog is an open-source product analytics platform that combines event tracking, session replay, feature flags, A/B testing, surveys, data pipelines, and data warehouse features. It’s popular with engineering-led teams that want control over infrastructure and data collection.
Discover a better PostHog alternative.
Best for
Startups and engineering-led product teams that want open-source analytics, self-hosting options, and usage-based pricing.
Key features
- Autocapture and custom events: Track common user actions automatically or define specific custom events through SDKs.
- Session replay: Watch user sessions alongside event timelines and funnel reports.
- Feature flags and experiments: Roll out features to selected user segmentation groups and measure results with event data.
- Funnel and retention analysis: Analyze activation, conversion, and repeat usage using product events.
- Self-hosting and pipelines: Control data storage, sync product data, and route events through data pipelines.
Pricing
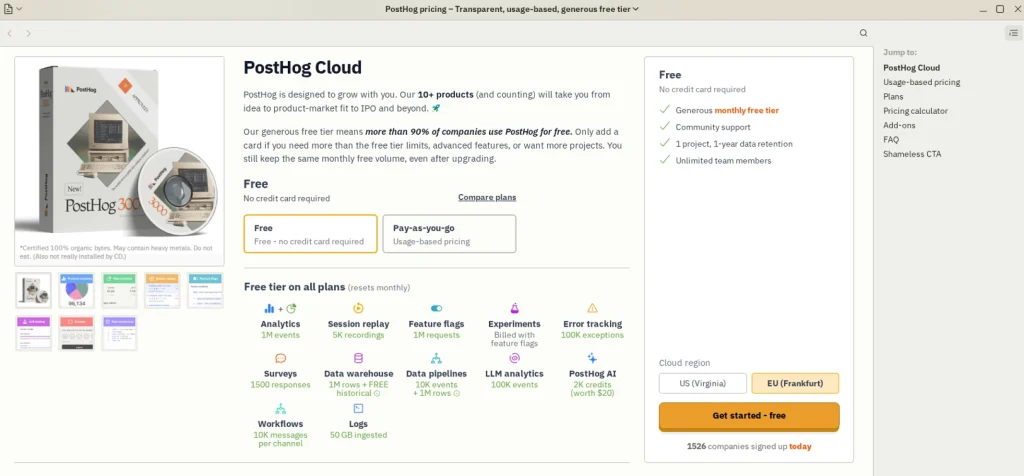
PostHog offers a Free plan with monthly limits, including 1 million product analytics events and 5,000 session recordings. Paid pricing is usage-based and starts after the free tier.
10. Countly
Countly is a privacy-focused product analytics and customer engagement platform for mobile, web, desktop, and connected devices. It supports cloud, private cloud, and self-hosted deployments, which helps teams with strict data residency or compliance needs.
Best for
Product and engineering teams in regulated industries that need mobile event tracking, private deployments, and data ownership.
Key features
- Mobile and web event tracking: Use SDKs to collect app events, web events, and custom event data across multiple platforms.
- Push notifications: Send targeted messages based on user behavior, app events, or segments.
- User segmentation: Group users by event behavior, device data, location, or custom properties.
- Funnels and retention: Track how users move through key flows and return after activation.
- Self-hosted and private cloud deployment: Keep data in controlled environments for privacy and compliance requirements.
Pricing
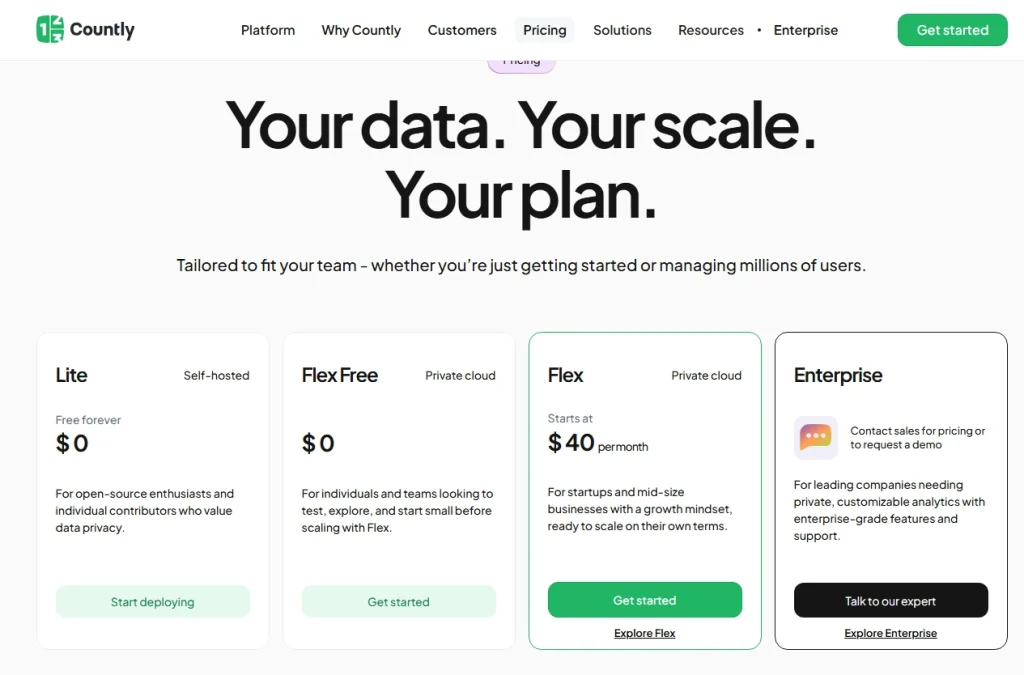
Countly offers a free Lite plan. Flex starts free for up to 500 MAUs, and paid Flex starts at $40 per month. Enterprise uses custom pricing.
Which Option Is Right for You?
The right tool depends on what you need to do with event data. Use this table as a practical starting point.
| If you are… | Your priority is… | Start with… | Why |
| A website marketer | Free event tracking, key events, and Google Ads attribution | Google Analytics 4 | It covers basic analytics, event tracking, conversion reporting, and campaign attribution at no software cost. |
| A SaaS product team | Funnel analysis with session replay context | FullSession or Mixpanel | FullSession connects events to session recordings. Mixpanel is strong for cohorts and funnel analysis. |
| A UX researcher | Session recordings, heatmaps, and user feedback | FullSession or Hotjar | Both support visual behavior analysis. FullSession adds event-level replay context for deeper investigation. |
| An engineering-led team | Open-source control and self-hosting | PostHog | It combines product analytics, feature flags, session replay, and self-hosting with developer control. |
| A data team | Routing event data across many tools | Segment | It standardizes event collection and routes event data to analytics tools, CRMs, and data warehouses. |
| A regulated product team | Private cloud or on-premise deployment | Countly | It supports privacy-focused mobile and web event tracking with deployment control. |
If you are also comparing product adoption platforms, review these Pendo alternatives for event tracking before shortlisting tools for SaaS onboarding, feature adoption, and behavioral analytics.
Why Choose FullSession for Event Tracking and Session Replay
Most event tracking tools stop at the metric. They tell you how many users clicked, where a funnel dropped, or how many events fired. That’s useful, but it doesn’t tell you why the drop happened or what to fix first.
FullSession closes that gap by connecting every event to the session replay, heatmap, funnel, error, and feedback context behind it. You don’t just see that something went wrong. You see exactly what the user experienced when it did.
From event to explanation in one workflow
When a funnel report shows a drop, the next step is usually a separate tool, a support ticket, or a guess. FullSession lets product, growth, and engineering teams move from a metric directly to the session behind it.
A user who hesitated on a pricing page, missed a CTA, or hit a broken interaction is visible in replay, not buried in logs.
Errors caught before users report them
FullSession’s errors and alerts feature monitors frontend and backend errors in real time. When a spike hits a revenue-critical flow like checkout or onboarding, your team gets an alert before tickets pile up.
Every error links directly to the session replay behind it, so engineers see what the user was doing when it broke, including console output and network context, without needing to reproduce the issue from scratch.
Errors are also prioritized by impact. You can see which issues affect the most users, which flows they hit, and how they correlate with drop-offs across your funnels.
That means your team fixes what matters most instead of working through a flat error list.
All five tools are working together
The value of FullSession isn’t any single feature. It’s how the features connect:
- Custom event tracking: Capture named user actions and filter by event properties to segment any cohort.
- Session replay linked to events: Jump from a funnel step, error, or custom event directly into the related session recording.
- Heatmaps: See where users click, scroll, and focus attention on the pages that matter most.
- Funnels and conversions: Measure drop-off at every step and review the recordings behind abandoned or completed flows.
- In-app feedback: Collect user responses linked to the replay and event context around each submission, so feedback never lacks context.
Lift AI sits across all of this. It scans behavior patterns, error signals, and funnel data to rank friction points by estimated revenue impact, so your team has a prioritized fix list rather than a pile of sessions to review manually.
Built for teams that need to move fast
FullSession is designed for product, growth, and engineering teams that can’t afford to lose time switching between tools or guessing at root causes.
Quantitative event data and qualitative replay context live in the same workspace. Errors route to the right team with enough context to act immediately. Feedback ties back to the session where it was submitted.
The result is a shorter path from “something is wrong” to “here is what to fix and why.”
Stop Letting Users Find Your Errors First
See exactly where events break, funnels drop, and users struggle before it costs you revenue.
Event Data, Event Properties, and Custom Events Explained
Event data is the record of what happened. A useful event usually has four parts: event name, timestamp, user ID, and event properties.
Event properties provide the context. A click event alone tells you that clicks happened. A click event with button text, page URL, plan type, device type, and campaign source tells you which users clicked, where they clicked, and why the action may matter.
Custom events are user-defined events beyond default autocapture. Examples include report_exported, onboarding_step_completed, feature_activated, checkout_error_seen, or trial_upgraded.
These events need manual tracking through an SDK or Google Tag Manager. They usually give the clearest signal of product value.
The rule is simple. Without event properties, event data is mostly a count. With properties, teams can segment users, compare journeys, find friction points, and make better decisions.
How Many Events Should You Track?
Track fewer events than you think you need at first. Event sprawl makes dashboards hard to trust, especially when different teams name similar actions in different ways.
A practical starting point is the Core 10 framework. Define the 10 most important user actions before expanding your schema. Every additional event should answer a question your team would act on.
| Event Category | What It Measures | Examples |
| Activation events | First actions that show a user has reached early product value | first_report_created, integration_connected, workspace_invited |
| Engagement events | Repeat actions that show users continue to engage with the product | dashboard_viewed, feature_used_weekly, saved_filter_created |
| Conversion events | Revenue, lead, or goal completion actions | trial_upgraded, demo_requested, checkout_completed |
| Friction events | Signals that users are blocked, confused, or dropping off | rage_click, javascript_error, checkout_error_seen, form_abandoned |
The test is simple. If you can’t explain what decision you would make from an event, don’t track it yet.
Integrations: Google Analytics 4, CDPs, and Data Pipelines
Event tracking tools rarely work alone. The best setup depends on where the collected data needs to go after the event fires.
Google Analytics 4 often works as the web analytics anchor for teams that rely on Google Ads, Looker Studio, and BigQuery. Google Tag Manager can fire custom events into GA4 and other platforms from the same tagging layer.
Customer data platforms such as Segment act as the routing layer. Teams collect events once through a CDP and send them to product analytics tools, CRMs, email platforms, advertising tools, and data warehouse destinations.
Data warehouse sync helps when teams need SQL-based analysis, retention modeling, or joins with revenue, support, and CRM data. Mixpanel, Amplitude, PostHog, Segment, and other platforms support data warehouse workflows in different ways.
| Tool | Useful Integrations |
| FullSession | Segment, HubSpot, Intercom, Jira, Slack, Google Analytics |
| Google Analytics 4 | Google Ads, BigQuery, Looker Studio, Google Tag Manager |
| Mixpanel | Segment, Snowflake, BigQuery, HubSpot, Salesforce |
| Amplitude | Segment, Snowflake, BigQuery, Salesforce, Braze |
| Heap | Segment, Salesforce, HubSpot, Google Cloud, Optimizely |
| FullStory | Segment, Google Analytics, Jira, Slack, Salesforce, Datadog |
| Hotjar | Google Analytics, HubSpot, Slack, Zapier, Optimizely |
| Segment | 400+ destinations, including analytics tools, CRMs, data warehouses, and marketing platforms |
| PostHog | Segment, Snowflake, BigQuery, Sentry, Zapier, data pipelines |
| Countly | Slack, Jira, Google Analytics, Firebase, custom webhooks, data exports |
Best Practices for Event Tracking and Data Governance
Clean tracking data needs rules. These practices keep your event schema useful as your product grows.
- Use a naming convention from day one. Choose snake_case or camelCase and use an object-action format such as button_clicked, form_submitted, or report_exported.
- Maintain a tracking plan. Document each event name, event properties, owner, source, destination, and business question.
- Avoid collecting personal data in properties. Don’t place names, email addresses, phone numbers, or sensitive identifiers inside event properties unless your legal and privacy teams approve the process.
- Test in staging before production. Use debug modes, event inspectors, or live views to confirm events fire correctly before data reaches dashboards.
- Audit events quarterly. Remove unused events, merge duplicates, and clean up tracking data that no longer supports reporting or decisions.
Conclusion About Event Tracking Tools
The best event tracking tools do more than count events. They help teams understand user behavior, improve user experiences, increase user engagement, and make better product decisions from relevant data.
GA4 is a strong free starting point for website analytics. Mixpanel and Amplitude are better fits for product analytics and cohort work.
Segment is best when the main problem is routing event data across a larger stack. PostHog and Countly are strong choices when ownership, self-hosting, or privacy control matters.
FullSession is the strongest fit when your team needs event tracking, session replays, funnels, feedback, and friction insights in one workflow. It helps teams see not only that users drop, but what happened in the session before they dropped.
See How It All Connects in Practice
Watch event tracking, session replay, and friction insights working together in a live session.
FAQs About Event Tracking Tools
What is the difference between event tracking and page view tracking?
Page view tracking counts URL loads. Event tracking records specific user interactions within a page or app, such as clicks, form submissions, file downloads, purchases, and errors.
Page views show where users went. Events show what users did there.
What events should I track on my website?
Start with actions tied to conversion goals and key user journeys. Useful examples include CTA clicks, form submissions, sign-up completions, feature activations, checkout steps, file downloads, and error interactions.
Don’t track everything. Track only events that support a real decision.
Is Google Analytics 4 an event tracking tool?
Yes. Google Analytics 4 uses an event-based data model.
Page views, scrolls, clicks, and purchases are all handled as events. GA4 supports automatic event tracking and custom events through Google Tag Manager.
What is the difference between autocapture and manual event tracking?
Autocapture records common interactions automatically. Manual event tracking requires teams to define and instrument each event.
Autocapture is faster to start. Manual tracking gives teams more control over event names, event properties, and collected data.
How many events can I track in a free analytics tool?
It depends on the platform. GA4 standard is free for most teams. Mixpanel offers a free plan for up to 1 million monthly events. PostHog includes 1 million analytics events in its free monthly tier. Amplitude offers a free Starter plan with usage limits.
FullSession’s free plan includes 500 sessions per month with full access to event tracking, session replay, and funnel analysis. Check current pricing pages before finalizing a tool.
Can I use multiple event tracking tools together?
Yes. Many teams use a customer data platform like Segment to collect events once and route them to multiple tools, including a product analytics platform, data warehouse, CRM, and session replay tool.
FullSession fits naturally into this setup. It connects event data to session replays, heatmaps, and funnel analysis in one workspace, so you get behavioral context without adding another layer to your stack.
This cuts duplicate instrumentation and keeps tracking data more consistent.

Roman Mohren is CEO of FullSession, a privacy-first UX analytics platform offering session replay, interactive heatmaps, conversion funnels, error insights, and in-app feedback. He directly leads Product, Sales, and Customer Success, owning the full customer journey from first touch to long-term outcomes. With 25+ years in B2B SaaS, spanning venture- and PE-backed startups, public software companies, and his own ventures, Roman has built and scaled revenue teams, designed go-to-market systems, and led organizations through every growth stage from first dollar to eight-figure ARR. He writes from hands-on operator experience about UX diagnosis, conversion optimization, user onboarding, and turning behavioral data into measurable business impact.