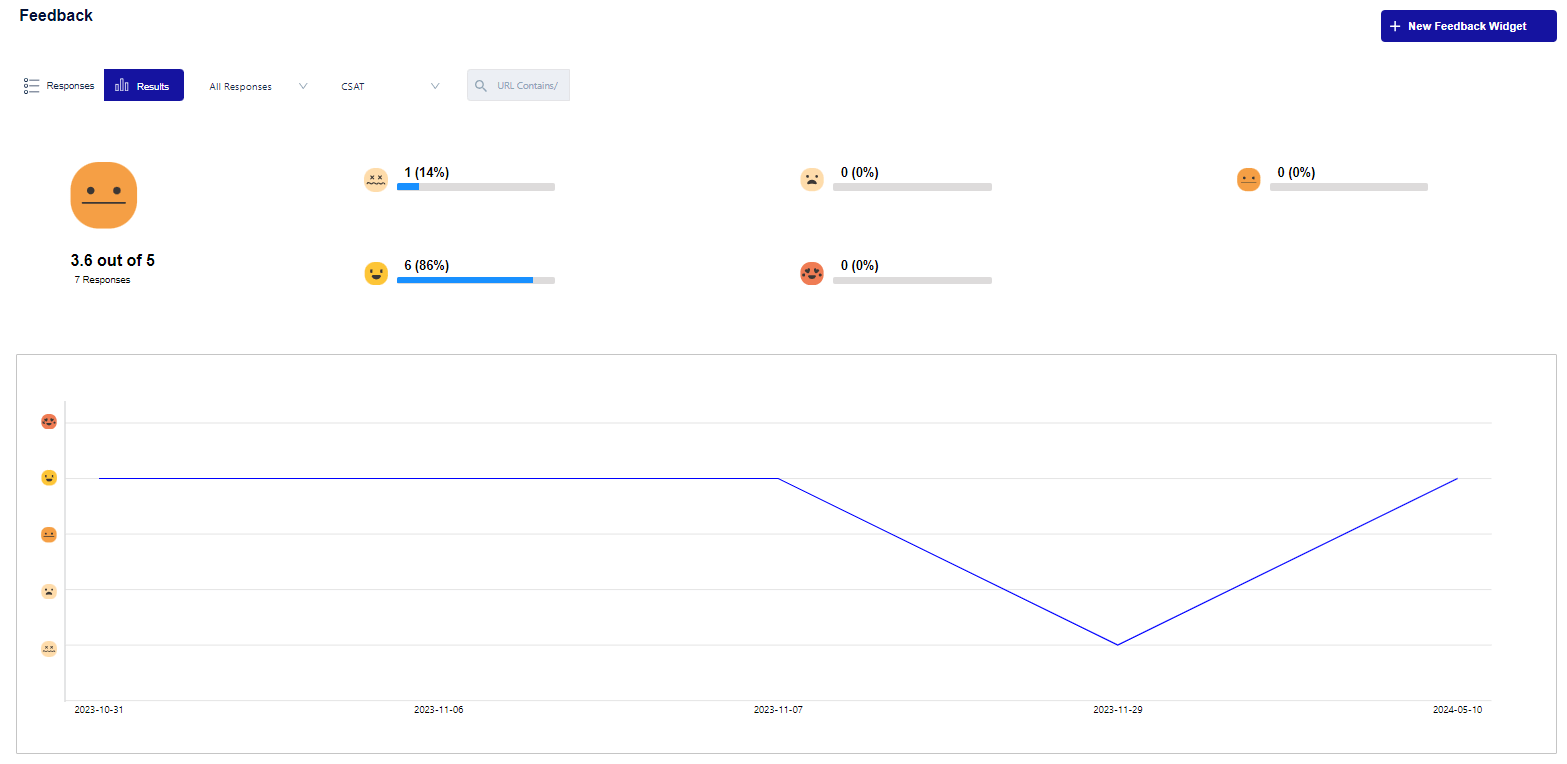
There are nearly two billion websites nowadays and around five billion active internet users around the globe. If you have an online business, people worldwide visit your website 24/7.
It’s not easy to stand out from the crowd in such a vast ocean of easily accessible information. Anonymous raw data collection is no longer enough to understand how your website performs. You need to be aware of potential friction points throughout the customer journey to ensure customer satisfaction.
To make improvements, you need to ask your customers what they struggle with. Combine this feedback with your data on user behavior, and you’ll get an excellent source of information to optimize your product or service.
With FullSession user behavior analytics software, you can track customer engagement data, identify trends and bottlenecks in their journey, and spot page elements causing user frustration. It helps you resolve issues and boost user experience quickly.
In this article, we’ll discuss how to use FullSession to collect customer feedback through website feedback forms and understand user sentiment with detailed feedback reports.
Before we discuss this in more detail, let’s explain the customer feedback report and how it can benefit your business.
What Is a Customer Feedback Report?
A customer feedback report presents the key findings of customer feedback analysis. It shows what your customers say or how they feel about your products or services.
These reports allow you to set product development priorities.
Stakeholders benefiting from a customer feedback report:
- Business leaders: Identify new priorities and set objectives.
- Product developers: Highlight valuable product features or the need for new ones.
- Designers (Product & UX): Spot obstacles in the customer journey.
- Developers (Front-end & Back-end): Identify bugs, instability, or security issues.
- Marketing team: Discover new market opportunities.
You need proper customer feedback tools like FullSession and a good plan to gauge customer satisfaction and improve the customer experience.
First, you must collect customer feedback. Second, you must conduct a feedback analysis. This requires combining the feedback with quantitative data on user behavior. Then, you must convert everything to numbers that point to valuable conclusions.
Start a Free Trial to Experience FullSession
Learn how our customer feedback tools help you identify recurring issues and user needs.
Why Is It Important to Get Feedback From Customers?
The universal answer sounds simple. Companies need to know what value their customers get from their products or services. We are talking about the customer perspective and not what the product managers think.
Customer feedback shows how much your product offering matches the clients’ needs and expectations.
Digital channels eliminate personal interactions that would happen in an offline setting. That’s why you need multiple data sources to evaluate customer satisfaction.
Here are the most common sources of customer feedback that digital product owners can use:
- Customer feedback surveys
- NPS surveys
- Customer satisfaction surveys
- Product reviews–on social media, on-site, app stores, etc.
- Customer support tickets
- Logs from the live chats
- CRM data filled in by account managers
Remember that this customer feedback data comes from various sources, so it’s important to consider the context to understand its significance.
For example, customer service teams gather real-time insights that show the problems customers face and how they feel in the moment. On the other hand, post-purchase surveys depend on customers remembering their experiences.
While these details matter, the most important thing is to start by collecting feedback. First, get a good sample of data, and then measure customer satisfaction in your report.
Why Is It Important to Measure Customer Satisfaction?
Customer satisfaction is an excellent indicator of the customer experience (CX) you provide. In a survey by Gartner, 81% of respondents said they expected future competition to be based primarily on customer experience.
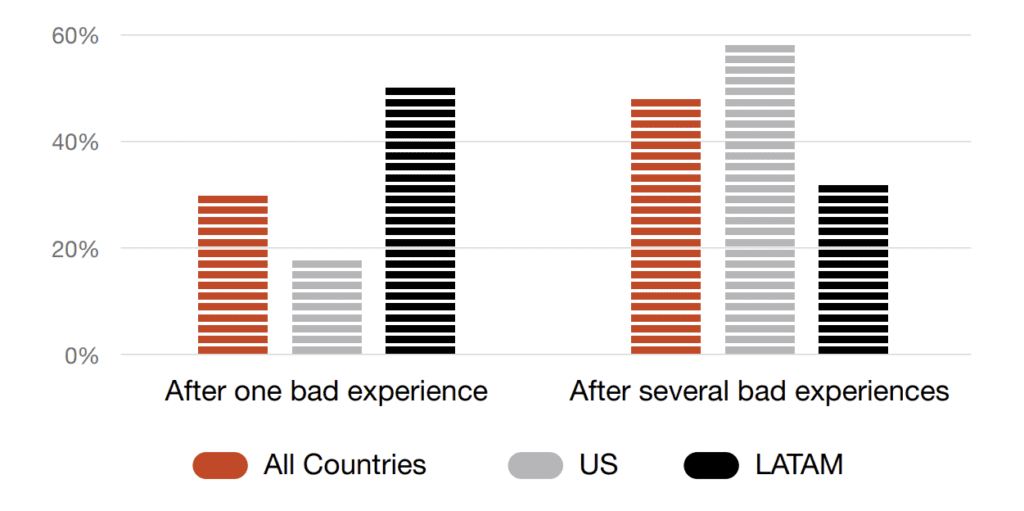
Image source: PWC
Another survey by PWC indicated that 73% of all people consider customer experience when making purchase decisions. More than half (59%) of US respondents said they would ignore a brand after several bad experiences. One bad experience is enough for 17% of the clients to walk away permanently.
Measuring customer satisfaction will allow you to draw a clear picture and spot areas for improvement that can save you money in the long run. Here’s how improved customer satisfaction helps you stay ahead of the competition:
- Improved brand loyalty and customer retention
- High customer satisfaction means repeat business
- Lower acquisition costs
- Lower price pressure
- A catalyst for product improvements
- Word-of-mouth promotion
Each point in this list is important enough by itself. That’s why all businesses should collect and analyze customer feedback and use data to measure customer satisfaction. Let’s discuss the advantages of high customer satisfaction.
Improved customer retention
It costs more to get new clients than to keep the current ones. That’s why you should consider all aspects of the customer experience carefully. Don’t stop sending feedback requests after the first customer feedback survey.
For example, you can use confirmation emails to gather feedback after every online purchase. This will not be too much work because every purchase is a different experience, even for loyal customers.
Remember that collecting and analyzing customer feedback are continuous processes. To ensure business growth, you must know what your clients think at all times. You can’t afford the assumption that the experience will stay the same if everything is fine now.
Ensured long-term business success
A loyal core customer base is critical for future-proofing your business. Satisfied customers can be significant when a company is going through tough times.
They are cheaper to retain, and you can rely on their purchases when you can’t afford aggressive spending on new customer acquisition.
Lower acquisition costs
Acquiring new customers costs a lot, especially in industries with fierce competition based on product features and price. This is also true for mature markets with well-known competing brands, each with a solid customer base. That’s why you should always explore opportunities to improve customer satisfaction.
Other costs would go down when your customers are satisfied. A great example is the cost of providing customer support. More support tickets mean you need more people to handle them.
Also, when the customer contacts the support team, it’s too late, and the experience is already not optimal. Your clients end up dealing with issues instead of enjoying the experience. Why go down this spiral when you can ensure excellent customer satisfaction ahead of time?
Lower price pressure
Satisfied customers are less likely to venture into the unknown when they can rely on a familiar experience with your product or service. Your happy customers will always prefer to stay in this comfort zone unless something disrupts it.
A slight price difference won’t be a deal-breaker for your loyal customers. It’s not worth the effort to go out there for just a few cents less.
Keep in mind that this is valid for products and services with similar value. If your competition is constantly innovating and adding more value, they may be able to convert even people with positive customer sentiment about your brand.
Continuous product improvements
Customer satisfaction, or the lack of it, is a primary driver for innovation. When your clients look for specific features, you must consider them, especially when the competition is restless.
You can conduct keyword analysis to see what customers mention over and over in the feedback or perhaps manual analysis to look for clues on what to improve.
Loyalty is good for customer retention, but it can’t compensate for value disparity. If you lag in product improvements for too long, someone will steal your customers. Industries with high innovation rates are a great example of how being first is always better.
Word-of-mouth promotion
Satisfied customers feel good about their purchases. Their positive experience makes them eager to promote the products and services they buy. They can enthusiastically explain what features and qualities they like and why.
Word-of-mouth marketing is a priceless addition to your marketing effort. People will believe your happy customers because the feedback is genuine. That’s why word-of-mouth marketing is so influential. It raises the NPS and customer satisfaction score and turns your clients into a marketing force.
The Benefits of a Customer Feedback Report
The customer feedback report is an insightful study of customer feedback. It explains how and why your customers are satisfied or dissatisfied and helps you understand customer satisfaction in the context of consumer behavior.
The customer feedback report is more than just numbers. You need to analyze the data you gather. It shows which steps and factors in the customer journey affect the experience.
We identified five main benefits of the customer feedback report:
- Importance to all stakeholders
- Points out competitive advantages
- Points out areas for improvement
- Gives actionable insights
- Assists in goal setting and priorities
A good customer feedback report is conclusive and shows facts and dependencies that you didn’t know before. It adds more knowledge about your customer behavior and allows you to better understand your clients’ needs.
Here are some additional comments about each of the listed benefits.
Importance to all stakeholders
The customer feedback report can benefit various teams and individuals in a company. It’s not only for top-level executives but also for other managers and supervisors. The key findings can enable decision-making across all levels of the organization.
Also, the customer feedback report can suggest actions in any aspect of the customer experience. Depending on the insights, it can aid marketing professionals, product designers, product owners, tech teams, or support teams.
Points out competitive advantages
Everyone loves and celebrates positive customer feedback.
Businesses don’t collect feedback only to know what they are doing wrong. Your customers can also tell you what you are doing right. You gain valuable insights about your competitive advantages. This knowledge can guide your marketing, sales, or product development efforts.
Points out weaknesses
Customer responses in the customer feedback report can show weaknesses that require immediate attention. These could be product or service flaws that directly cause customer dissatisfaction.
Disadvantages can also relate to how you promote and position your product. Setting unrealistic expectations can affect the experience of an otherwise good product of decent value.
Gives actionable insights
If the findings of the customer feedback report confirm what you already know, then the customer insights are non-actionable. If you are already doing what’s necessary for improvement, no further action is needed.
An actionable customer insight points to meaningful positive change that you need to work for. A helpful customer feedback report shows what you don’t know and suggests how to apply this new knowledge.
Assists in goal setting and priorities
The key findings in a customer feedback report can motivate managers to rethink their priorities. It depends on how urgent the required action is and the dangers of not taking it.
Priorities can often move up or down the list because of new information.
Boost Customer Satisfaction and Experience
Learn how our customer feedback tools help you identify recurring issues and user needs.
How to Collect Customer Feedback With FullSession
FullSession is a user behavior analytics software that allows advanced tracking of user behavior. Our tracking code is lightweight and won’t slow down your site. Itrecords website visitor sessions and highlights significant events and interactions you can watch duringsession replays.
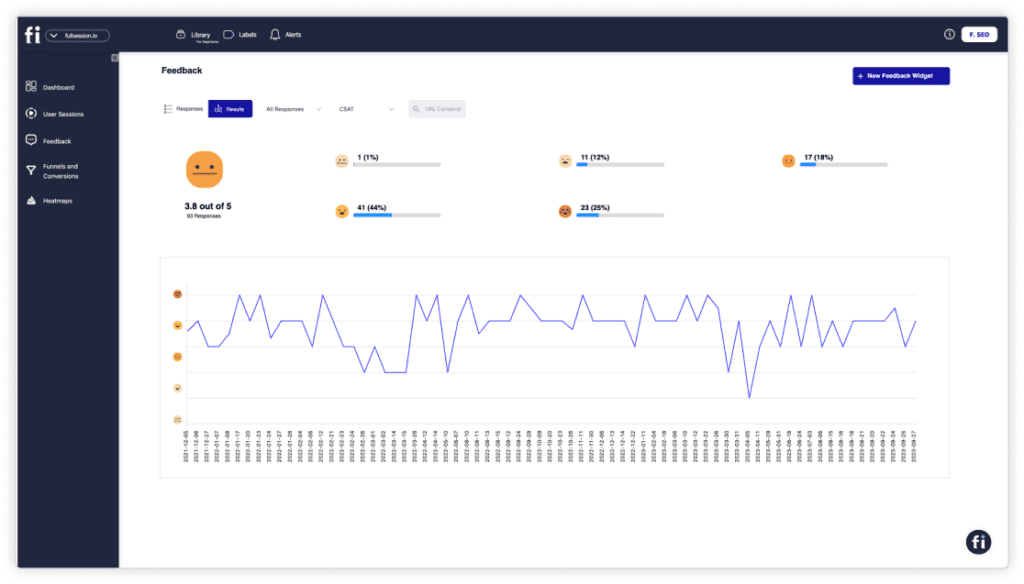
FullSession offers two main ways to collect feedback from your website visitors. The first one is the website feedback form. It allows you to ask directly how your customers feel while browsing, offers real-time feedback collection, and is easy to create from your FullSession account.
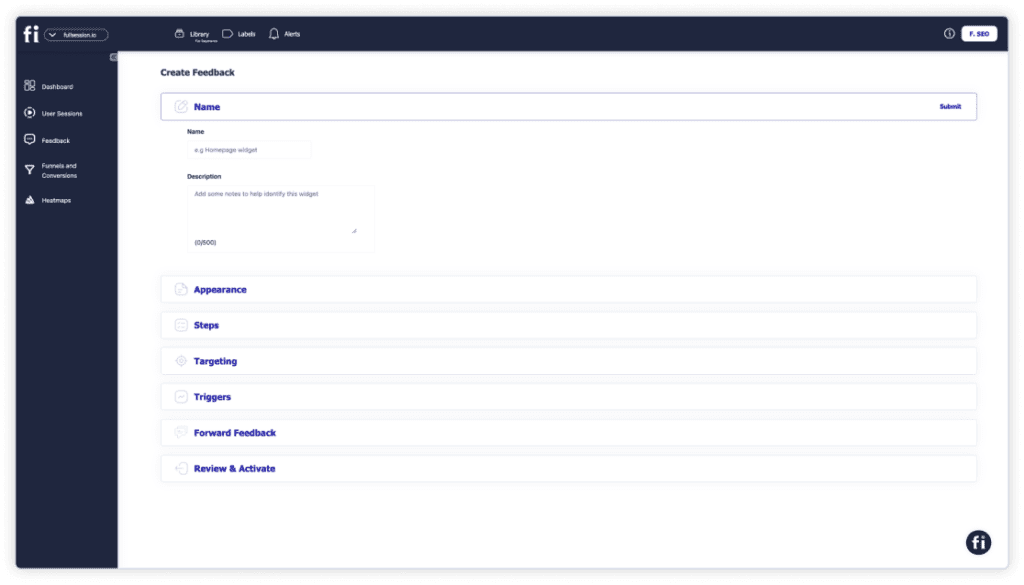
You can customize the form’s appearance and define the questions your users must answer to complete the satisfaction survey. Set the form language (English, French, or Arabic), position the form on the page, and see the desktop or mobile preview.
You can install the customer feedback form on all website pages or only on selected ones. Targeting by device type is also available.
The second way to collect customer feedback is to track user behavior in real time. With good observation and analysis, you will learn what your users do and where they struggle.
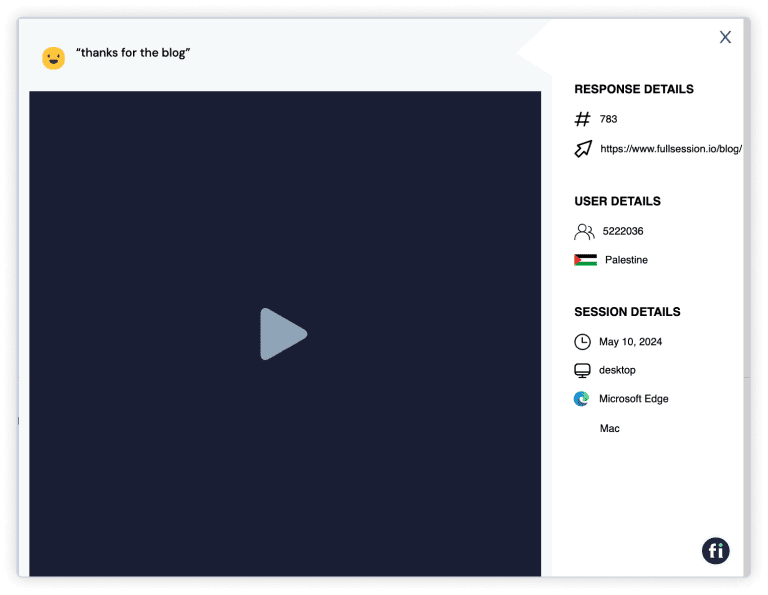
If a negative comment raises a flag, replay the browsing session for this user. See what actually happened and how the visitor interacted with your content. Look for critical events like error clicks and anger clicks with interactive heatmaps. Anything that shows the source of the frustration will help you understand the reasons for negative feedback.
Also, you can use FullSession heatmaps to learn where on the screen the users are looking at the most. It shows what content or feature grabs more attention and has more interactions. Then you can match this information with the user action events you get from the session replay.
The two methods complement each other and work well together. Combine direct customer feedback with behavioral insights to make better conclusions and filter valuable data from the noise.
FullSession Customer Feedback Report Example
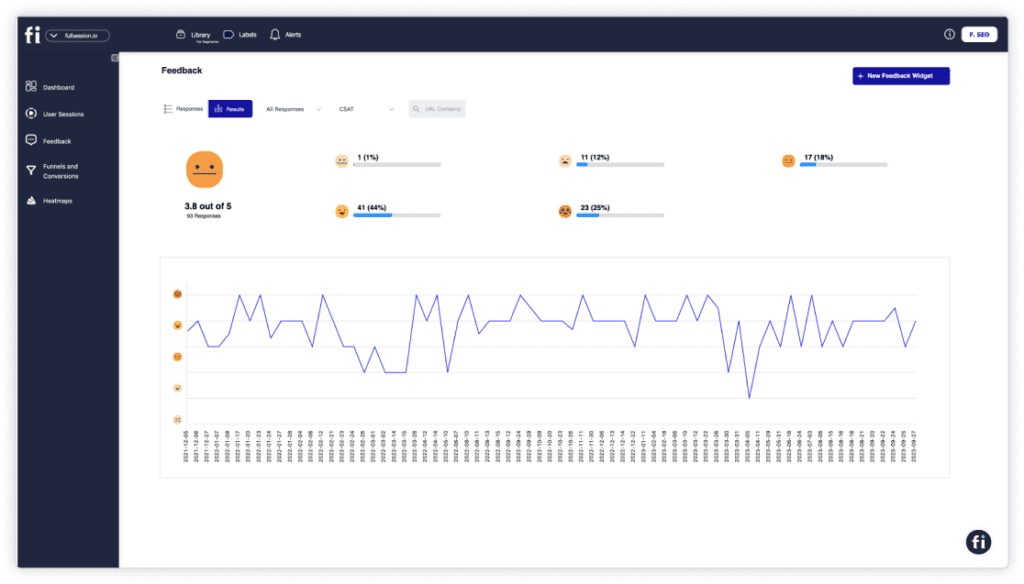
The FullSession customer feedback report has two main sections – the report results and the list of feedback submissions.
FullSession can categorize feedback and summarize the results. You can see how many users are happy with the experience, neutral, or unhappy. You can click on any response type to see all submissions from your feedback channels.
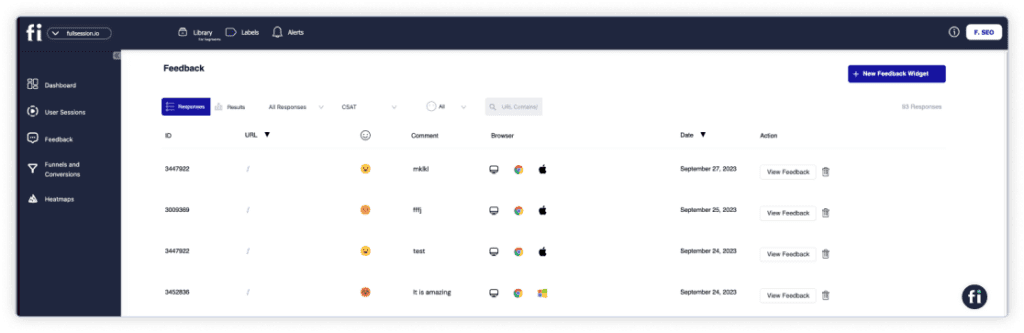
The list contains all answers and also shows additional user comments. Here, you can see the user’s device type, operating system, browser, and the page where the user submitted the form. Click on any line item to see more details and replay the recorded browsing session.
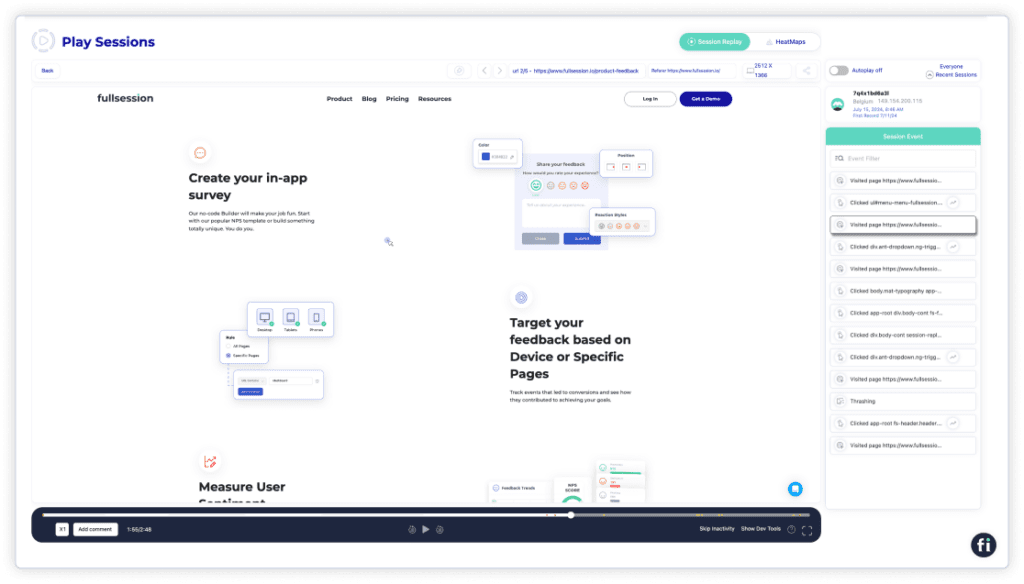
This will help you track the user’s interactions on the page and learn more about their behavior and experience right before the feedback submission.
How to Analyze a Customer Feedback Report With FullSession
To analyze customer feedback, we recommend starting with an overview and then going deeper into the response types you are interested in. It will allow you to get a sense of the overall customer sentiment. Then you can investigate the answers from each response category, e.g., like, dislike, or neutral.
Pay attention to users who took the time to submit additional comments, especially if they are longer than one sentence. Replay the browsing sessions to analyze customer feedback manually. See what happened and spot any friction points or mishaps that affected the experience. Use the event tracker to speed up the replay and focus on the events that matter.
Also, match this knowledge with the info from the FullSession heatmap tool. It will show what content and features grab the users’ attention and what they ignore.
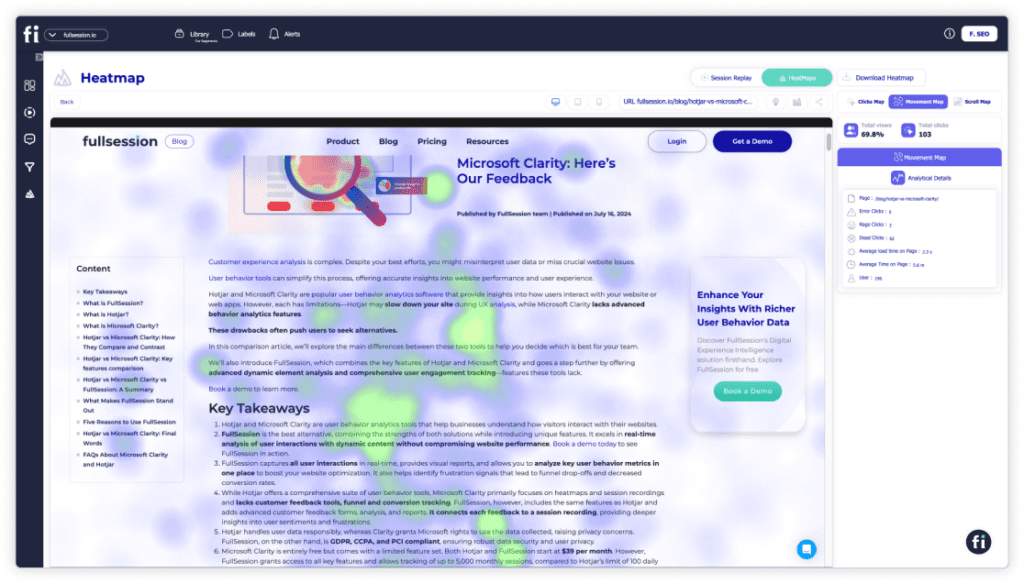
Then you can adjust your layout so critical content and elements are within the user’s line of sight. It should eliminate frustration and contribute to a better overall experience.
Get a demo to see how it works.
14 Ways to Use a Customer Feedback Report
Customers appreciate it when their opinion is valued, but they don’t want to spend too much time filling out feedback forms. Businesses are responsible for conducting balanced surveys that gather valuable information without asking for too much customer effort.
You can collect feedback on various topics for various reasons. It all depends on what you need to know right now. For example, you can launch a survey about a new feature of your web app.

Source: Freepik
The possibilities are endless, but here are 14 practical examples of how you can use customer feedback to your advantage.
1. Analyze your customers’ needs
It should be pretty straightforward. Just ask your customers what they need. It could be a product feature, a website feature, or a preference for the shopping process.
Let’s say, for example, that you sell shoes online and nothing else. You don’t have a massive platform that’s a one-stop shop for everything. End users don’t buy batches of shoes regularly and don’t need to track multiple orders. In this case, you can assume the users might prefer to skip creating an account and just enter their payment information at checkout.
It may sound logical at first, but it’s not necessarily true. It may be accurate, but only for a small number of your customers. There’s one way to find out: just ask. This will allow you to direct your effort based on customers’ pain points and spend your budget on things that matter.
2. Improve customer satisfaction
Ask your customers how satisfied they are and what improvements they want to see. Again, don’t change anything that works well.
Also, perform sentiment analysis carefully. Compare positive to negative responses. Try to figure out if there are groups of customers who want opposite things. Find a balanced solution that improves overall satisfaction and customer perception across all customer segments.

Source: Freepik
Be aware of the difference between the product and the overall experience. Let’s go back to the example of online shoe purchase.
A customer could be delighted with his new pair of shoes and still say he wouldn’t shop from your website again. Keep asking until you figure it out. Then you can start planning improvements.
3. Increase customer loyalty and advocacy
People feel more valued when they know their voice is being heard. The very act of requesting feedback can tip the scales in your favor.
Use customer feedback to power decision-making. Customers will see the results and know they contributed to your improvements, making them feel like stakeholders. This kind of involvement will increase loyalty, and loyal customers will be more likely to engage in word-of-mouth promotion.
4. Improve customer experience
Most customer satisfaction surveys ask users to evaluate aspects of their experience and put them on a scale. It can limit the feedback to the questions you listed for the survey. Keep in mind that something else may be more critical to the customer.

Source: Freepik
Use an open-ended customer feedback form to allow users to express what matters most to them. Keep in mind that open-ended questions require more effort to answer. Don’t include too many of them, and keep the survey short and easy to complete.
Last, make sure you go through all answers and label them correctly. It will allow you to turn this qualitative data into numeric data. Then you can quickly summarize the numbers into crucial findings.
5. Identify new opportunities
Customer feedback can be positive and show what things you excel at. If customers see different aspects of your service as your advantage, you can use that insight to stay ahead of the competition. Also, your respondents can help you arrive at conclusions few others have thought about. If acted upon, it will help you stay on the cutting edge.

Source: Freepik
The feedback may show surprising new opportunities that you never explored before.
6. Enhance your product and service offerings
The data from your satisfaction survey will help you find out what is important to your customers. If we retake the retail example, you can use the findings to add new product groups to your online store.
You can also start a premium service with more customer benefits. It would ensure that you cover more market segments and expand your client base.
7. Improve SEO and site performance
We mentioned product reviews as one of the sources of customer feedback. It’s a special one because reviews are public. They allow future users to research and form opinions about your product or service before buying.
Customer reviews have the power to set expectations. They can also boost your search engine rankings. Positive reviews can qualify you for rich snippets that display your star rating.
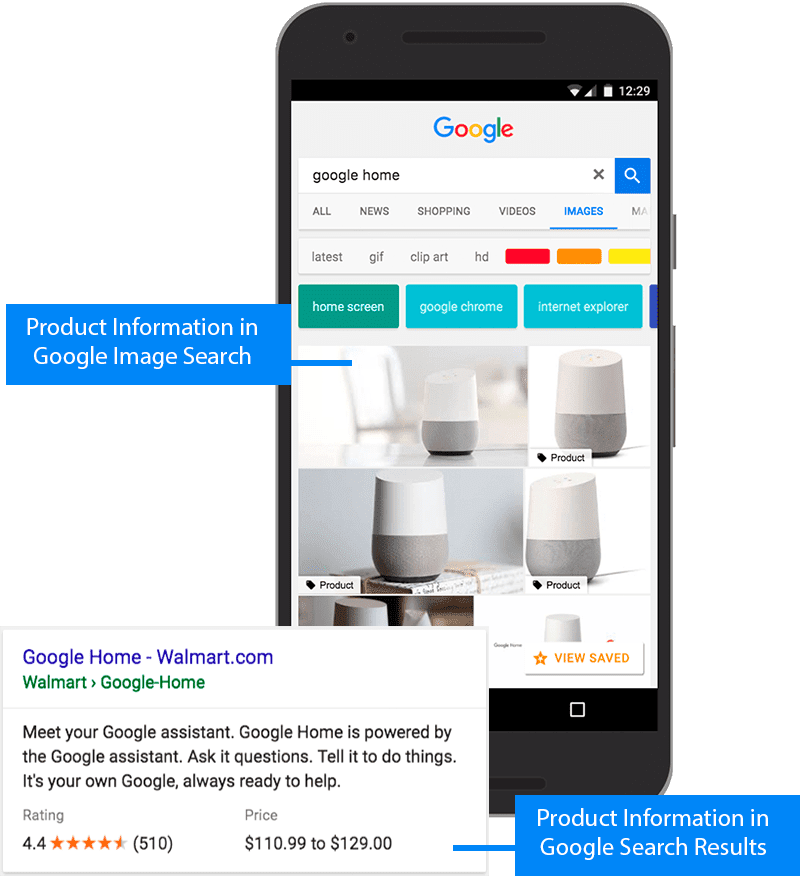
Image source: Google Search Central
If your customer feedback report shows high satisfaction, it’s wise to encourage your users to rate your product or service or leave a review online. This is another form of word-of-mouth promotion. In this case, it’s not just other clients who pick it up—search engines do this, too.
8. Improve marketing efforts
There are two areas to explore here. The first one is how to promote and position your product or brand based on current customer opinions and sentiments. The second is how to use word-of-mouth promotion by satisfied customers.
You need to know who your customers are and what’s important to them. The best way to learn is to gather feedback, whether that be through quick satisfaction surveys or in-depth interviews.
9. Improve sales efforts
How many times have you seen websites that show reviews or client testimonials?

Source: Freepik
Customers are likely to trust genuine feedback from other people. You can use feedback analysis to make data-driven decisions. You can also publish feedback from current buyers to recruit future customers and drive customer loyalty.
10. Increase conversion rates
Conversion rate is one of the most used KPIs in e-commerce. It is simple to calculate but very difficult to link to other business factors.
The conversion rate could be low for many reasons. Bad design, poorly selected market segments, and an intimidating checkout process are just a few examples of why your visitors don’t become buyers.
Use feedback surveys to ask customers why they visit your website and their intentions. They could be researching a product online but not sure if they would buy it. It is one of many possibilities.
The more users participate in your survey, the greater the significance of the feedback. Gather as many opinions as possible to ensure small data samples do not mislead you.
11. Obtain insights for innovation and change
Insight implies deep understanding, which is essential for making informed decisions. Innovation can be costly, and you must be sure you are going in the right direction. Nowadays, data is the most important factor that motivates strategic decisions.
12. Identifying inefficiencies
When your customers tell you what they need and value, match this against what you do in your daily operations. Clients are sensitive to the amount of effort they must put in to get what they need.
Use customer feedback to optimize your service and create a frictionless experience. Ideally, every interaction with your customers should be effortless for them and as easy and cost-effective as possible for you.
13. Gain knowledge of customer trends
Overall, mobile devices drive more traffic and sales in e-commerce. However, the picture may be different when you break it down by industry. According to the Statista survey on retail website visits in the first quarter of 2024, mobile traffic in retail was 77% globally.

Source: Freepik
It is just one example of a consumer trend native to a given industry that doesn’t match the global overalls. That’s why it’s important to work with data relevant to your business case.
Use customer feedback together with behavior analytics to define your customer trends. Record user browsing sessions and replay them to see what your customers look at, what they struggle with, or when they abandon the cart. It will enable you to propose changes based on the findings in your unique situation.
14. Optimize future customer acquisition
Here again, you can complement customer feedback with advanced web analytics. Use tools like FullSession to see which pages your visitors were referred from and how many customers came from each platform.
Watch the time on site, the bounce rate, and the conversion rate. This will help you identify the most efficient lead-generation channels.
Feedback also helps you to know your customers better. Thanks to customer satisfaction surveys, you can grow your knowledge of customer segments and their value to the business. It will allow an acquisition effort that targets prospects who behave like your best customers.
Customer Feedback Report: The Key Takeaway
Customer feedback is a valuable source of information, and that value is likely to increase in the digital future. A good understanding of the client’s needs and struggles helps businesses to make the right decisions, keep their customers, and recruit new ones.
A customer feedback report is a practical way to summarize and present key insights from user feedback, both positive and negative reviews. However, you need the right tools to collect and analyze feedback data to prepare the report. This is where FullSession helps a lot.
With FullSession, you can run online surveys while getting advanced user behavior analytics. You can record and replay browsing sessions to find out how visitors use your website and outline friction points and areas for improvement.
It also offers heatmaps to see how users interact with your site, funnels and conversion tracking to dive deep into user journeys, and error analysis to track, examine, and correct issues affecting user experience.
FullSession lets you:
- Track dynamic elements in real time for precise insights
- Accelerate heatmap processing with no impact on site speed
- Protect user privacy by excluding sensitive data
- Manage data sets effectively and quickly reveal insights
- Limit tracking to your site to prevent data misuse
- Facilitate cross-team collaboration on one platform
Learn more on FullSession and book a demo today!
We’ve also recently reviewed and compared other user behavior tools, such as Mouseflow vs VWO, Lucky Orange vs Hotjar, and LogRocket vs FullStory.
FullSession Pricing Plans
The FullSession platform offers a 14-day free trial and three paid plans: Starter, Business, and Enterprise. A yearly subscription can save you up to 20%!
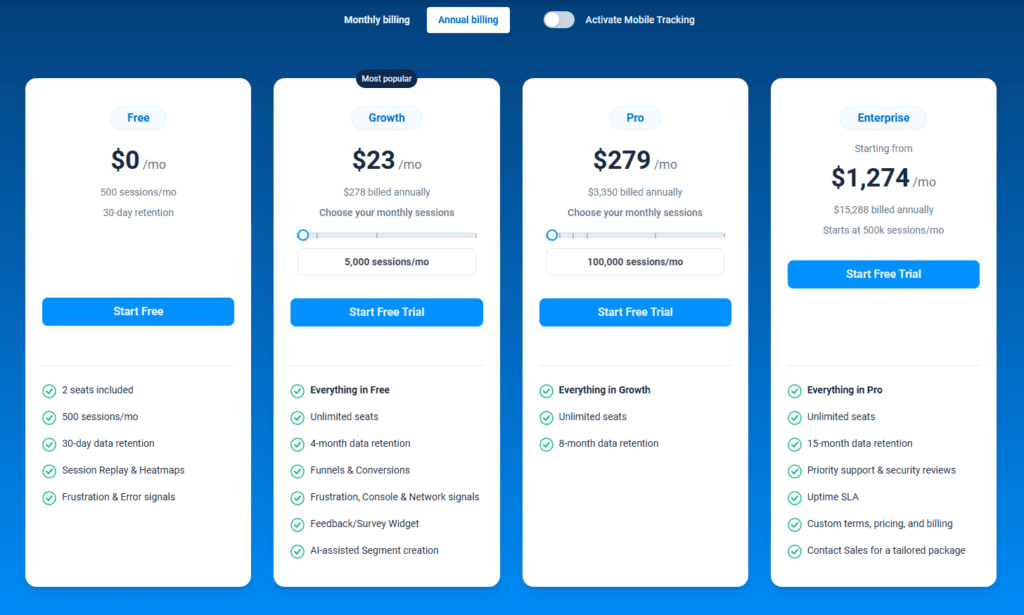
Here are more details on each plan.
- The Free plan is available at $0/month and lets you track up to 500 sessions per month with 30 days of data retention, making it ideal for testing core features like session replay, heatmaps, and frustration signals.
- The Growth Plan starts from $23/month (billed annually, $276/year) for 5,000 sessions/month – with flexible tiers up to 50,000 sessions/month. Includes 4 months of data retention plus advanced features like funnels & conversion analysis, feedback widgets, and AI-assisted segment creation.
- The Pro Plan starts from $279/month (billed annually, $3,350/year) for 100,000 sessions/month – with flexible tiers up to 750,000 sessions/month. It includes everything in the Growth plan, plus unlimited seats and 8-month data retention for larger teams that need deeper historical insights.
- The Enterprise plan starts from $1,274/month when billed annually ($15,288/year) and is designed for large-scale needs with 500,000+ sessions per month, 15 months of data retention, priority support, uptime SLA, security reviews, and fully customized pricing and terms.
Install Your First Website Feedback Form Right Now
It takes less than 5 minutes to set up your first website or app feedback form with FullSession, and it’s completely free!
FAQs About Customer Feedback Reports
How do you write a customer feedback report?
To write a customer feedback report, collect feedback via customer surveys and other tools, organize data points, analyze key trends, and present findings with actionable insights. Use clear headings and visuals to enhance understanding.
What should be included in a feedback report?
A feedback report should include an introduction, data collection methods, key findings, trends analysis, actionable recommendations (e.g., new marketing strategies), and supporting visuals like charts or graphs for survey data. You can use a feedback analysis template to start.
How do you summarize customer feedback?
Summarize customer feedback by identifying common themes, highlighting positive and negative trends, and condensing the information into key points and actionable quantitative or qualitative insights.
What is an example of good customer feedback?
Good customer feedback is specific, actionable, and balanced. For example, “The checkout process was quick and easy, but adding a guest checkout option would improve the experience further.”

Mohamed oversees operations and finance at FullSession and has contributed to the company’s UX analytics knowledge base.