Google Analytics tells you that 70% of visitors leave your pricing page without converting. What it can’t tell you is why. That’s where website heatmap tools come in.
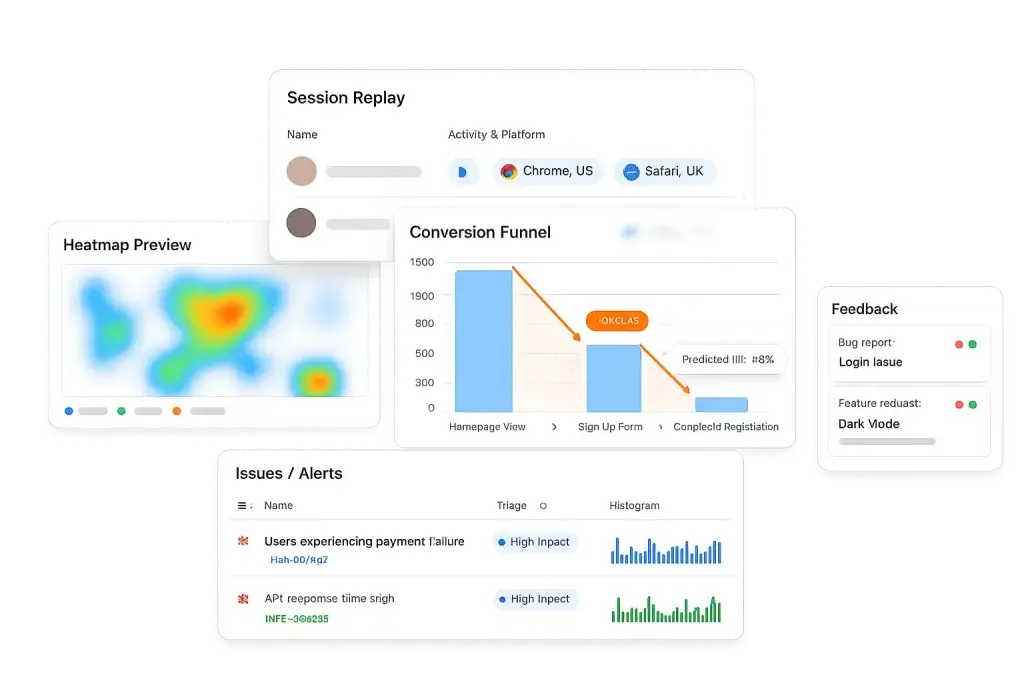
A heatmap tool turns raw behavioral data into a visual layer on your web page. These heat maps show exactly where website visitors click, how far they scroll, which sections they ignore, and where they get stuck. That context is what transforms a confusing analytics report into a list of things you can actually fix.
This guide compares seven of the best heatmap software tools available in 2026.
Each entry covers features, pricing, and when the tool fits your stack better than the alternatives, whether you need a dedicated website analytics tool, broader user behavior tools, or a full behavioral analytics platform
Key Takeaways
- FullSession: The strongest all-in-one option for teams that need interactive heatmaps, session replay, funnel analysis, and error tracking in a single workflow.
- FullStory: Suits enterprise teams that need deep autocapture, conversion maps, and shared behavioral data across product, UX, and engineering.
- Hotjar: A solid starting point for small and mid-size teams who want quick heatmap setup paired with surveys and feedback tools.
- Smartlook: Works for cross-platform web and mobile tracking, providing session replays, heatmaps, and event analytics to capture user behavior across devices
- UXCam: A good choice for mobile-first product teams that need gesture-level heatmaps across iOS, Android, and hybrid frameworks.
- VWO: Suits CRO teams who want to move directly from heatmap findings into A/B tests without switching platforms.
- Mouseflow: A feature-rich mid-market option with six heatmap types, form analytics, and AI-assisted session querying via Mina.
Every tool on this list does something well. FullSession stands out because it has advanced features that connect heatmaps to session replay, funnel analysis, feedback surveys and error tracking in one place, so your team spends less time switching between tools and more time actually fixing what’s broken.
It’s privacy-first by default, scales from a free plan to enterprise, and works on modern JavaScript frameworks where screenshot-based tools fall short.
Book a demo and see how it works on your own website.
What to Look for in Website Heatmap Tools
Not all heatmap tools are built the same. Before you commit to a free trial, check out the following features. Ecommerce teams can also compare the best heatmap software for ecommerce when they need tools built for product pages, cart behavior, checkout journeys, and conversion analysis.
| Criteria | What to look for | Why it matters |
| Heatmap types | Click maps, scroll heatmaps, movement-based heat maps, and dynamic heatmaps | Scroll heatmaps show how deep users scroll and where users drop. Dynamic heatmaps track user interaction with live elements accurately. Static heatmaps can break and distort your website heatmap data. |
| Session replay | Built-in session recordings linked directly to heatmap patterns | Heat maps show where users struggle. Session replay and user session playback explain why, connecting heatmap patterns to real user behavior in context. |
| Funnel and error tracking | Conversion funnels, funnel analysis, and error logging | Funnel analysis tracks the full user journey across multiple pages. Error tracking surfaces friction in user paths and missed user actions that quietly hurt user satisfaction. |
| Privacy and compliance | GDPR, CCPA support, and automatic data masking | A website analytics tool must protect user data while still capturing behavioral data and user interaction. Auto-masking keeps sensitive inputs secure by default. |
| Pricing and setup | Free plan availability, scalable paid plans, and setup via Google Tag Manager | Most heatmap software tools offer a free plan, but limits depend on website traffic and user session volume. Costs can rise quickly, so clear pricing tiers matter. |
The Best Website Heatmap Tools at a Glance
Here is how the seven leading website heatmap tools compare.
| Tool | G2 Rating | Best For | Top Feature | Starting Price |
| FullSession | 5/5 | All-in-one behavioral analytics | Interactive heatmaps + session replay + funnels + error tracking + Lift AI | Free plan; Growth from $23/month (annually) |
| FullStory | 4.5/5 | Enterprise digital experience teams | Autocapture + conversion maps | Free tier, custom pricing |
| Hotjar | 4.3/5 | Small to mid-size teams new to heatmaps | Engagement zone maps + surveys | Free plan; paid from $40/month |
| Smartlook | 4.6/5 | Cross-platform web and mobile tracking | 100% session capture + retroactive heatmaps | Free plan; Pro from $55/month |
| UXCam | 4.6/5 | Mobile-first product teams | Gesture heatmaps for iOS and Android | Free plan, custom pricing |
| VWO | 4.2/5 | CRO teams running A/B tests | Dynamic heatmaps + built-in A/B testing | Custom pricing |
| Mouseflow | 4.6/5 | Digital marketers and UX leads | Six heatmap types + form analytics + Mina AI | Free plan; paid from $39/month |
7 Best Website Heatmap Tools Worth Your Time
Below are the 7 best website heatmap tools worth your time in 2026, chosen for how well they help you understand how users interact with your site, improve user engagement and website performance, and turn raw behavioral data into actionable insights.
1. FullSession
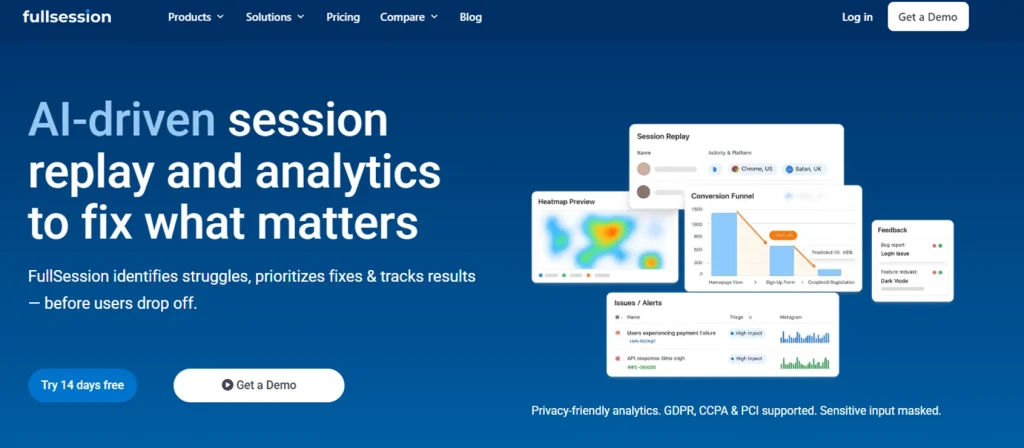
FullSession is a privacy-first behavioral analytics platform that goes significantly further than a standard heatmap tool.
Instead of giving you a standalone visual overlay, it connects your heatmap data directly to session replay, funnel analysis, error tracking, and user feedback.
That means you don’t just see where users struggle: you understand why.
Best for
Teams that need heatmaps and full behavioral context in one place.
UX designers, CRO practitioners, and product managers at SaaS, ecommerce, and digital businesses who need to move from heatmap observation to root-cause diagnosis without switching tools.
Key features
- Interactive heatmaps that track clicks, scroll depth, and mouse movement across dynamic elements, including dropdowns, modals, and single-page application routes. Unlike screenshot-based tools, FullSession captures what actually happens on your live page, not just a static snapshot.
- Session replay with direct heatmap linkage. FullSession records user sessions and ties each one to the heatmap patterns that triggered the investigation. Spot a rage-click cluster and jump straight into the specific recordings behind it. No manual filtering required.
- Funnel analysis and conversion tracking to show you exactly which step of your user journey is leaking the most traffic.
- Error tracking that automatically surfaces rage clicks, dead clicks, and JavaScript errors so you know when something is technically broken, not just confusing.
- In-app feedback tool to collect user input directly on the page. Combine the quantitative website heatmap data you collect with qualitative data from real user responses to create a complete picture of the visitor experience.
- Lift AI to process session replay, heatmap, funnel, and error data and identify the most critical friction points. It prioritizes recommendations by severity and expected impact, helping teams focus on what to fix next.
- GDPR and CCPA compliance with sensitive inputs masked by default. No manual privacy configuration required.
Pricing
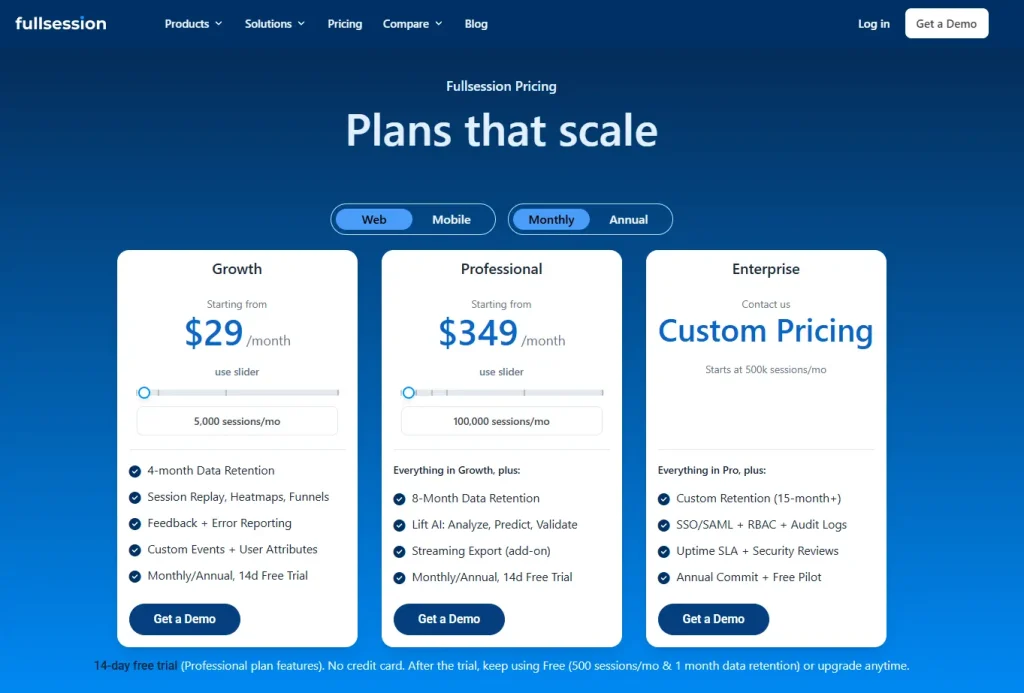
Free plan available at $0/month for up to 500 sessions per month, with 30 days of data retention.
The Growth plan starts at $23/month, billed annually (5,000 sessions/month). Pro plan starts at $279/month billed annually (100,000 sessions/month). An enterprise plan is also available with custom pricing.
Check out all the details on the pricing page before purchasing.
Why choose FullSession
FullSession is the only tool on this list that lets you move from heatmap pattern to session replay to funnel drop-off data in one continuous workflow.
That context is what turns a heatmap observation into actionable insights your team can act on, rather than a starting point for more investigation.
Book a demo now.
2. FullStory
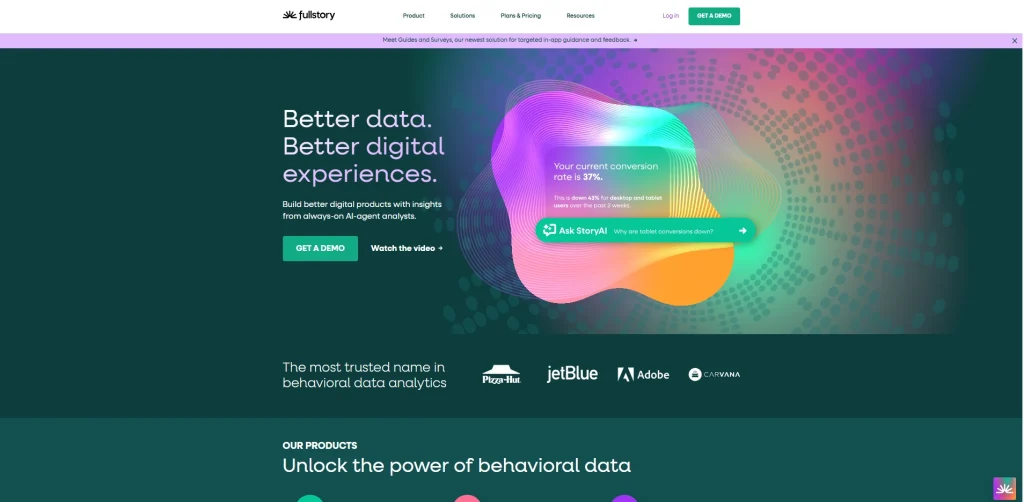
FullStory is a digital experience analytics platform built for organizations that need deep behavioral intelligence across complex digital products.
It offers what it calls Engagement Heatmaps alongside click maps, scroll maps, and a distinctive conversion maps feature that ties specific page elements to your defined conversion goals.
- Learn more about FullStory competitors.
- See how FullSession compares with FullStory.
Best for
Enterprise product and UX teams in larger organizations where product, engineering, and UX all need shared behavioral data and strong segmentation.
Key features
- Click maps and scroll maps shown as overlay reports highlight frustration signals like rage clicks, error clicks, and dead clicks. FullStory also surfaces the top 25 clicked user actions per category, giving you a ranked view of what visitors interact with most.
- Conversion maps show which specific page elements are linked to users completing a conversion goal. They connect on-page user interaction directly to business outcomes.
- Session replay jump-through. When a heatmap element isn’t performing as expected, you can move directly into FullStory’s diagnostic session replay to see what’s going wrong.
- Autocapture of all user interactions, including clicks, scrolls, and page transitions within each user session, without manual tagging.
- Segmentation by behavior, geography, device, and custom variables to build precise audience cohorts before running heatmap analysis.
Pricing
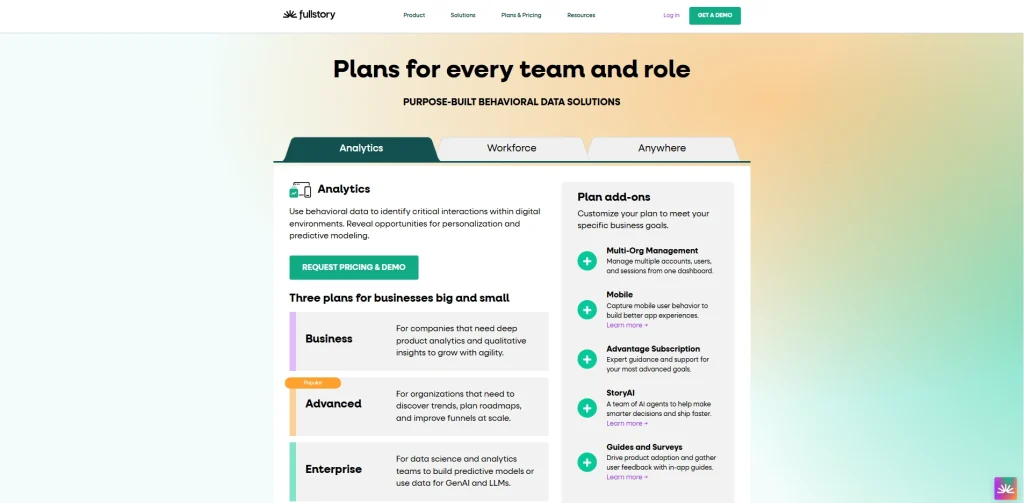
Free tier available, capturing up to 1,000 sessions per month. Business, Advanced, and Enterprise plans are custom-priced based on session volume, data retention, and team requirements.
Pricing is not publicly listed.
3. Hotjar
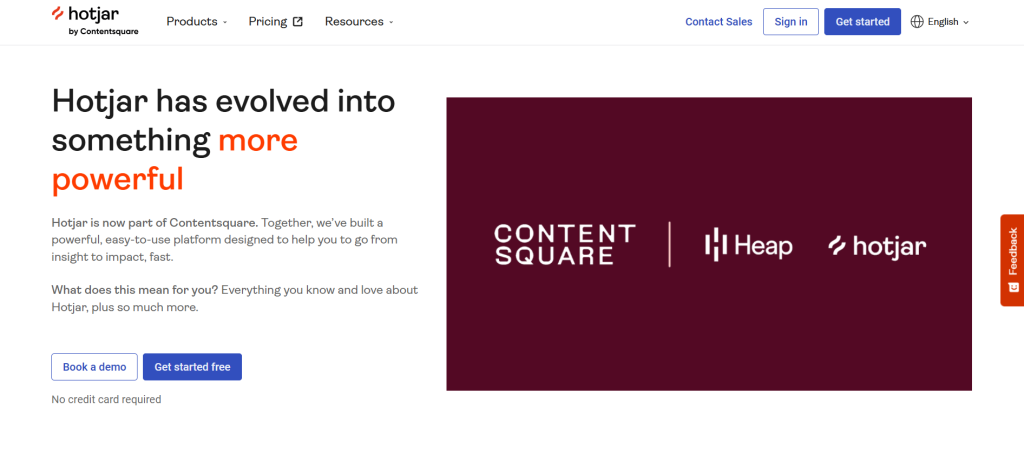
Hotjar provides popular heatmap software. It is now part of the Contentsquare ecosystem following its 2021 acquisition, which has brought new capabilities alongside a shift toward more enterprise-aligned pricing.
The core product remains accessible and familiar for teams that want a quick read on user engagement across their most important pages.
- Learn more about Hotjar alternatives.
- See how FullSession compares to Hotjar.
Best for
Small and mid-size teams new to behavioral analytics.
Marketers, UX designers, and small teams who want a quick-to-adopt tool with strong built-in survey and feedback capabilities alongside their heatmaps.
Key features
- Click and tap maps, scroll maps, and move maps covering the full range of standard heatmap types across desktop, tablet, and mobile.
- Engagement zone maps that combine click, move, and scroll data into a single view. This lets you see which parts of your page generate the most interaction without toggling between heatmap types.
- Attention maps (added after the Contentsquare integration) and the ability to compare behavior across different test variations or timeframes side by side.
- Rage-click maps that show where users get frustrated, with a direct link into session replays to understand why.
- Surveys and feedback widgets with over 40 templates and an AI survey generator (Sense). You can connect survey responses to the heatmap session that triggered them.
- Funnel analysis with AI-assisted insight surfacing to identify where users drop off across multi-step flows.
Pricing
Free plan available for up to 20,000 sessions per month. Paid plans start at $49/month. Enterprise pricing is custom.
Note that Hotjar’s positioning and pricing have evolved since the Contentsquare acquisition.
4. Smartlook
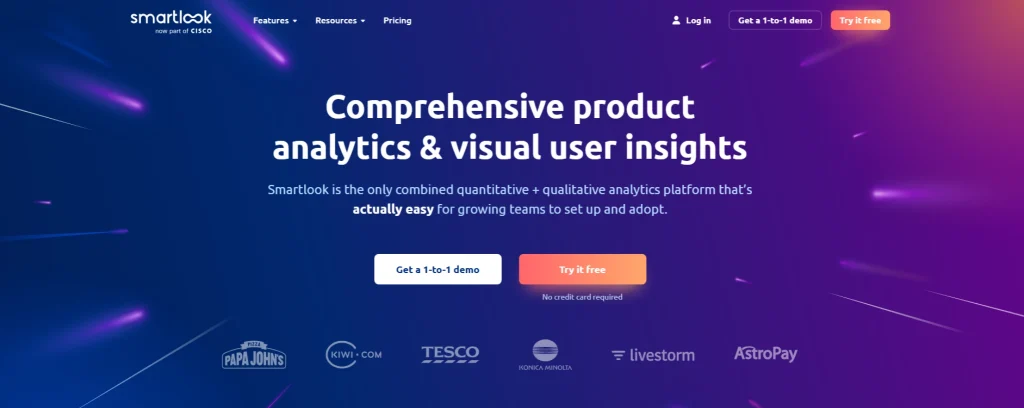
Smartlook is a behavioral analytics platform that has been part of Cisco since its acquisition. Its strongest capability is cross-platform tracking.
It supports websites alongside native iOS and Android apps and hybrid frameworks, including React Native and Flutter, giving it broader platform coverage than most web-focused tools.
- Learn more about Smartlook alternatives.
- See how Smartlook compares to Hotjar.
Best for
Product and development teams that need unified behavioral data across both web and mobile properties.
Key features
- Click, scroll, and movement heatmaps with retroactive data population. When you create a new heatmap, Smartlook immediately populates it with historical data you already have. You don’t wait for new sessions to accumulate.
- Session recordings with no data sampling by default. Every visitor session is captured, which matters on lower-traffic pages where sampled data produces unreliable heatmaps.
- Cross-platform coverage across web, iOS, Android, React Native, and Flutter from a single integration.
- Event tracking and funnel analysis without coding, using an automatic event capture system.
- Crash reports that let you watch recordings of sessions that ended in a crash, helping engineering teams reproduce and diagnose bugs faster.
Pricing
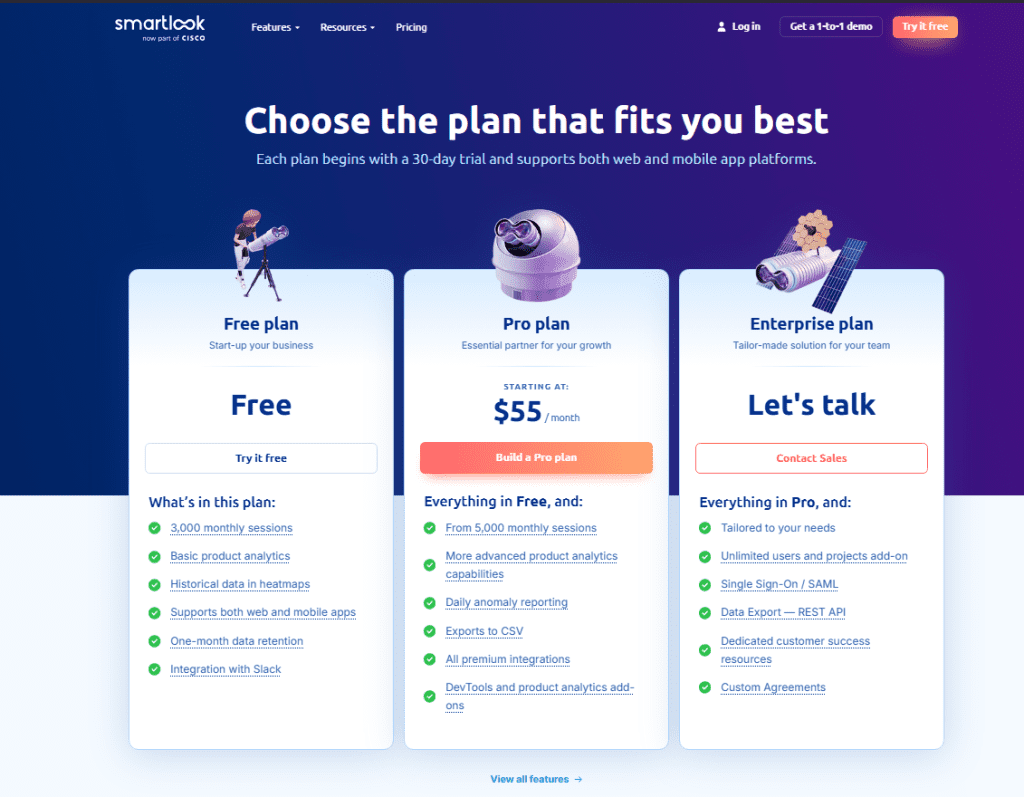
Free plan available. Pro plan starts at approximately $55/month. Enterprise pricing requires a custom quote.
5. UXCam
UXCam started as a mobile analytics platform and has since expanded to cover web. Its heatmap capabilities are strongest on mobile, where it captures touch-based gestures.
UXCam also supports usability testing workflows that combine heatmap data with session replay and funnel analysis to validate design decisions before and after release.
Best for
Mobile product teams at consumer app companies and cross-platform organizations that need gesture-level insight across iOS, Android, and hybrid frameworks alongside web analytics.
Key features
- Tap, scroll, and rage tap heatmaps for mobile apps. UXCam captures where users press most frequently, where they scroll, and where they repeatedly tap out of frustration on non-responsive elements.
- First- and last-touch heatmaps that show where users first interact on a screen and where their final interaction happens before leaving.
- Autocapture across iOS, Android, React Native, Flutter, Xamarin, and Cordova. No manual event tagging required.
- Session replay is tied directly to heatmap interactions, letting you move from an aggregate touch pattern to individual session context.
- Tara AI for AI-driven insights and behavioral analysis across product and UX data, surfacing patterns you would otherwise need to find manually.
- GDPR, CCPA, and HIPAA compliance with automatic data anonymization.
Pricing
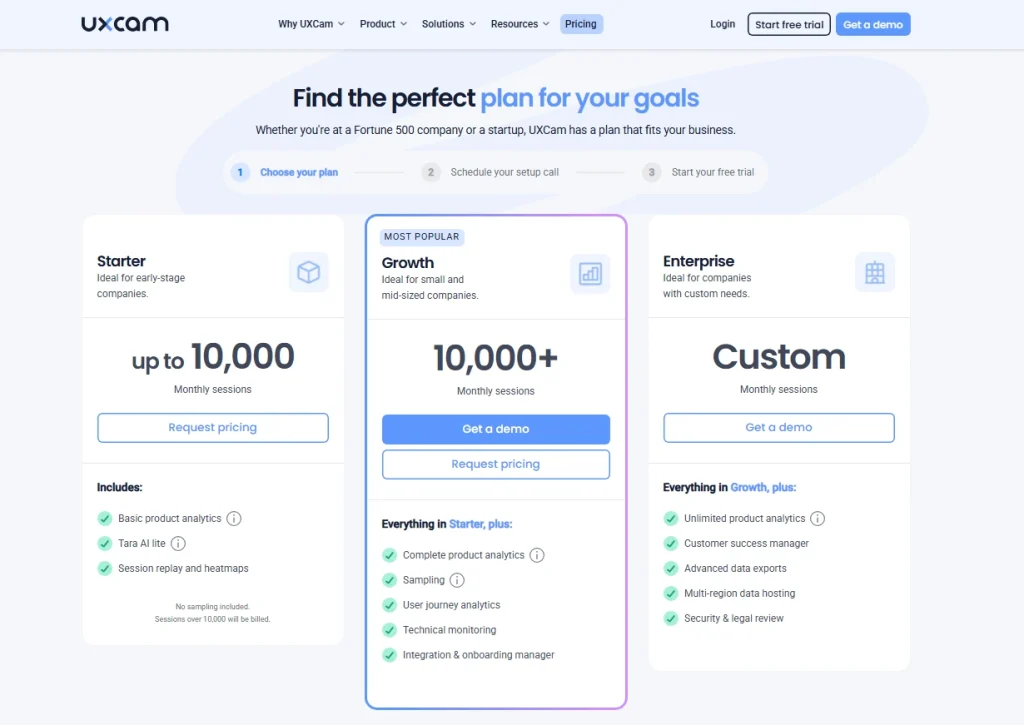
Free plan available with up to 3,000 monthly sessions. Paid plans scale by session volume and platform needs. Pricing details are not publicly available.
6. VWO
VWO is primarily known as a conversion optimization platform, and its VWO Insights product brings heatmaps, session recordings, form analytics, and surveys into the same environment where you run experiments.
If your workflow runs from heatmap observation to A/B test hypothesis to result validation, VWO reduces tool switching by keeping testing and analysis in one place.
Learn more VWO alternatives
Best for
CRO specialists and growth teams at mid-to-large businesses who want to run tests based directly on behavioral data without managing two separate platforms, while combining heatmap analysis with A/B testing.
Key features
- Dynamic heatmaps that work across modals, banners, dropdowns, password-protected pages, and dynamic URLs. VWO Copilot, the platform’s AI assistant, analyzes click and scroll behavior and delivers automated insights about UX positives and negatives with recommended fixes.
- Side-by-side heatmap comparison across devices, traffic sources, date ranges, audience segments, and A/B test variations. It makes it easy to validate whether a design change actually shifted user behavior.
- Form analytics with field-level data, including fill time, interaction duration, and abandoned fields.
- Session recordings with filters for rage clicks, dead clicks, funnel drop-off, and user attributes.
- Funnel analysis and on-page surveys tightly integrated with the A/B testing workflow.
Pricing
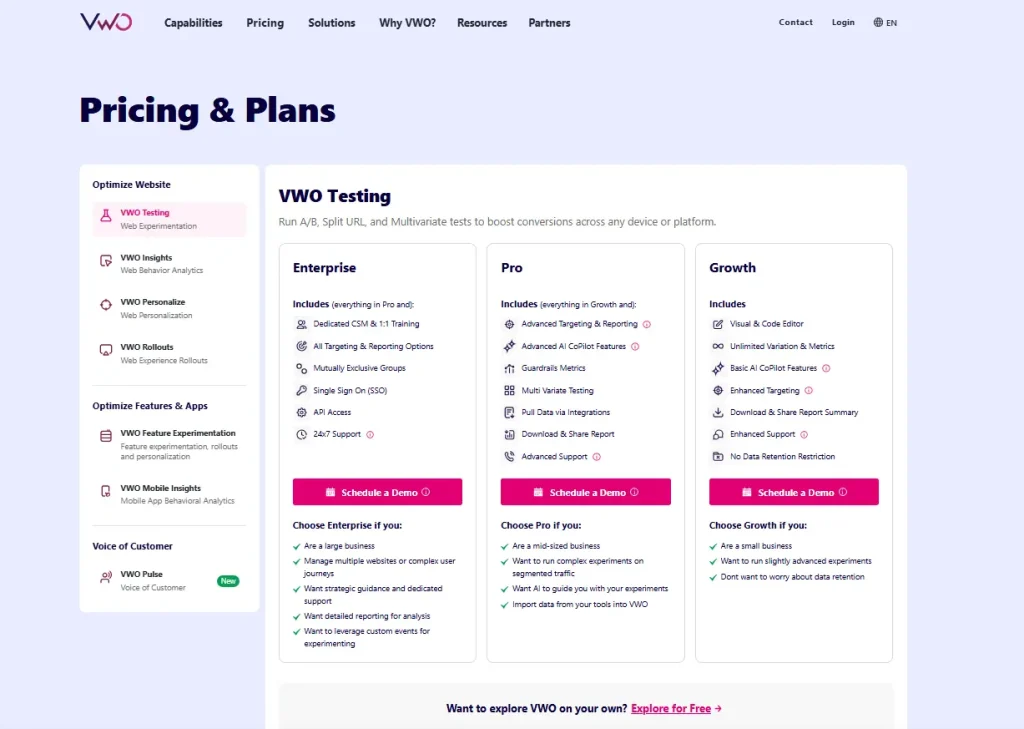
VWO offers a 30-day free trial without credit card required. Paid plans include custom pricing.
Pricing varies by session volume and included features.
7. Mouseflow
Mouseflow is a feature-rich behavior analytics platform in the mid-market category. It offers six distinct heatmap types, which is more than any other tool on this list, and combines them with strong form analytics, journey tracking, friction detection, and an AI layer called Mina.
- Learn more about Mouseflow alternatives.
- See how FullSession compares to Mouseflow.
- Find out how Mouseflow compares to VWO.
Best for
Digital marketers, UX leads, and analysts who want comprehensive heatmap coverage, including geographic and attention maps, alongside form analytics and AI-assisted session querying.
Key features
- Six heatmap types: click maps, scroll maps, movement maps, attention maps, geo maps, and live maps. The attention heatmap combines click and scroll data to show which areas users actively focus on, while geo maps visualize where in the world your traffic comes from.
- Friction detection automatically flags rage clicks, dead clicks, and JavaScript errors, plus error logging for 404 errors across sessions, giving you a friction score per session to prioritize which recordings to watch.
- Form analytics with field-level dropout data, time-to-complete analysis, and abandoned form replay.
- Mina AI, Mouseflow’s natural-language query system for session analysis. Instead of manually filtering through recordings, you describe what you’re looking for, and Mina surfaces the relevant sessions and behavioral patterns.
- Conversion funnels and journey mapping to track user paths and visualize drop-off points across multiple pages.
Pricing
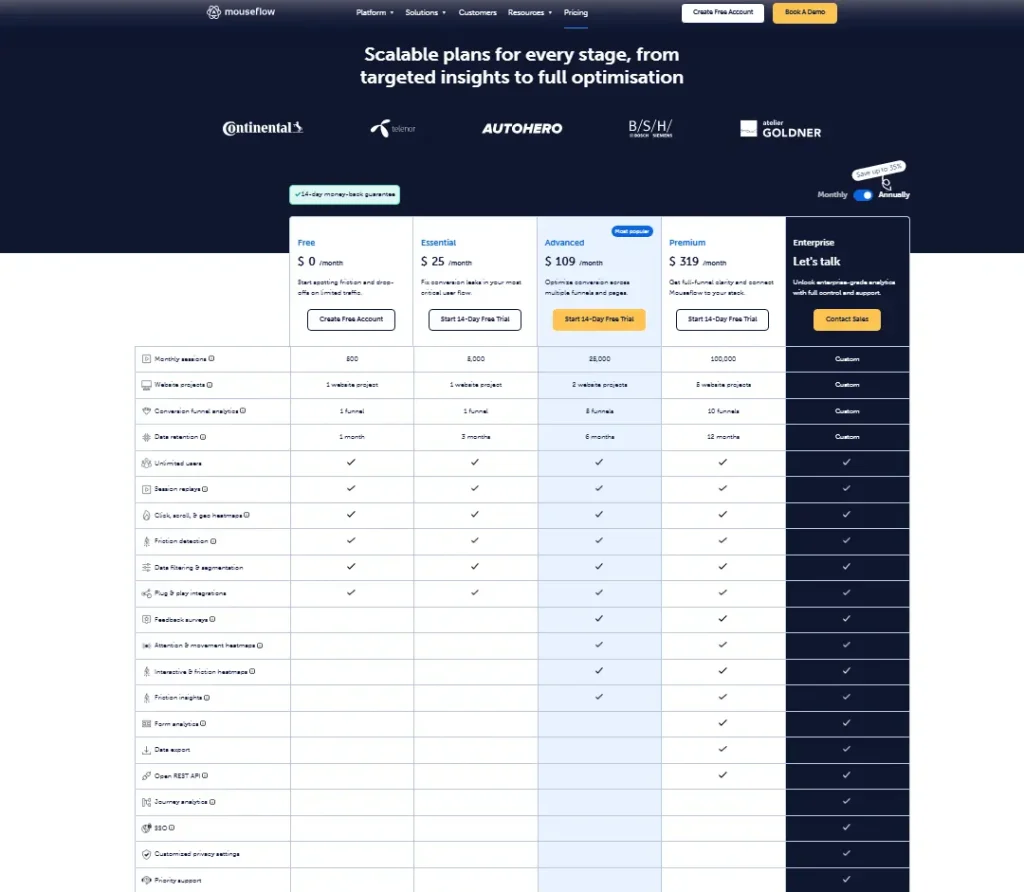
Free plan available for up to 500 sessions per month. Paid plans start at approximately $25 to $39/month, depending on annual or monthly billing.
How to Choose the Right Website Heatmap Tool for Your Team
The right choice depends on four things, not just which tool has the longest feature list:
- What’s your primary use case? If you need heatmaps as part of a broader behavioral analytics workflow that includes session replay, funnels, and error tracking, FullSession or Mouseflow cover the most ground. If you primarily need heatmaps as a feedback research tool, Hotjar is easier to adopt. If you run structured A/B tests, VWO connects analysis directly to experiments.
- Do you need mobile app support? If yes, UXCam, Smartlook, or VWO Insights cover both web and mobile. FullSession, Hotjar, and Mouseflow are web-focused.
- What session volume are you working with? Pricing scales with sessions across almost every tool. A free plan with 500 sessions works fine for testing, but if you have significant website traffic or are analyzing high-traffic landing pages, you’ll need to calculate the cost at your actual volume before comparing tools.
- What are your compliance requirements? If you handle sensitive user data or serve EU users, verify auto-masking defaults and data residency options directly with the vendor. Don’t rely on a pricing page checkbox as your compliance audit.
For most teams evaluating website heatmap tools in 2026, FullSession offers the strongest starting point because it combines the most relevant analytics features into a single workflow at a transparent, scalable price.
Start a free trial now.
Why FullSession is the Best Website Heatmap Tool
Most website heatmap tools show you where users struggle. FullSession shows you why, and gives you everything you need to fix it without leaving the platform.
This all-in-one platform connects heatmaps to session replay, funnel analysis, and other analytics features like error tracking in a single, uninterrupted workflow. That means faster diagnosis, fewer tools to manage, and no gaps in the data between systems.
Your heatmaps actually work on modern sites. Most tools generate heatmaps from a screenshot of your page. FullSession tracks interactions on your live DOM, so dropdowns, modals, and single-page app routes all get captured accurately. If your site uses React, Vue, or any modern JavaScript framework, this distinction matters.
You go from problem spotted to root cause in one click. Tools like Hotjar and FullStory let you view heatmaps and session replay, but they’re separate experiences. FullSession connects them, so a rage-click cluster on your heatmap becomes a direct entry point into the specific sessions behind it. That’s what cuts your time from “I see a problem” to “I know exactly what happened and why.”
Technical issues don’t slip through the cracks. FullSession captures rage clicks, dead clicks, and JavaScript errors alongside your heatmap data. You don’t need a separate error-monitoring tool to catch the issues that quietly break your conversion rate.
Privacy compliance is handled out of the box. Sensitive inputs are masked automatically. GDPR and CCPA compliance is built in, not bolted on. For teams operating in regulated markets or handling sensitive user data, this removes a compliance task from your setup checklist.
See FullSession in action on your own website. Reach out and discover how interactive heatmaps, session replay, and funnels work together to fix your conversion leaks.
Conclusion About Website Heatmap Tools
The best website heatmap tools do more than show where users click. They give you the context to understand why visitors behave the way they do and what to change to improve your conversion rate.
FullSession leads this list because it connects heatmaps to session replay, funnels, and error tracking in one platform, so you spend less time investigating and more time optimizing.
If you’re ready to see how that works on your own site, the free plan takes minutes to set up and requires no credit card.
FAQs About Website Heatmap Tools
What is a website heatmap tool?
A website heatmap tool is a behavior analytics tool that visualizes how visitors interact with your web pages. It uses color to show where users click most (red or warm colors) and least (blue or cool colors), how far they scroll, and how their mouse moves. This helps teams identify friction points, optimize content placement, and improve conversion rates without relying on guesswork.
What is the best heatmap tool for websites?
The best website heatmap tool depends on your use case. For all-in-one behavioral analytics, FullSession is the strongest option because it combines interactive heatmaps with session replay, funnel analysis, and error tracking in a single workflow. For teams focused on surveys and feedback, Hotjar is a solid entry point. For CRO teams who run A/B tests, VWO integrates heatmap data directly into the testing process. If you’re looking for a free tool, Microsoft Clarity is a good choice.
Does Google Analytics have heatmaps?
No, Google Analytics does not have a built-in heatmap feature. It provides traffic data, conversion tracking, and behavior flow reports, but it cannot show you visually where users click or how far they scroll on a specific page. You need a dedicated heatmap tool alongside Google Analytics to get that level of behavioral detail.
Is Hotjar a heatmap tool?
Yes, Hotjar is a behavioral analytics platform that includes heatmaps as one of its core features. It offers click maps, scroll maps, move maps, and engagement zone maps. It also includes session recordings, surveys, and funnel analysis. Hotjar is now part of the Contentsquare platform following its 2021 acquisition.
What should I look for in a heatmap tool?
Look for a tool that supports dynamic heatmaps for modern web frameworks, integrates session replay so you can investigate the “why” behind heatmap patterns, offers funnel and error tracking to catch conversion leaks, complies with GDPR and CCPA by default, and provides a transparent pricing model that scales with your session volume. A free plan or trial is helpful to validate the data quality before committing.

Roman Mohren is CEO of FullSession, a privacy-first UX analytics platform offering session replay, interactive heatmaps, conversion funnels, error insights, and in-app feedback. He directly leads Product, Sales, and Customer Success, owning the full customer journey from first touch to long-term outcomes. With 25+ years in B2B SaaS, spanning venture- and PE-backed startups, public software companies, and his own ventures, Roman has built and scaled revenue teams, designed go-to-market systems, and led organizations through every growth stage from first dollar to eight-figure ARR. He writes from hands-on operator experience about UX diagnosis, conversion optimization, user onboarding, and turning behavioral data into measurable business impact.