What is a Heatmap?
Heatmaps are a tool used to take complex data, and give you the ability visualize different ways user engage with your site based on that data. There are different types of website heatmap tools that portray different data points.
Below, we’ll dive deep into each type of heatmap, what their purpose is and how to use them effectively to increase conversions.
Types of Heatmaps
Scroll Maps
Scroll maps let you visualize your site visitors’ scrolling activity on your site. Using data from a scroll map, you can view how many visitors scroll to each depth of your page.
This data allows you to understand what section of your page most users drop off, which needs optimization. For example, you may get a report stating that 80% of users drop off at 3/4 page depth. This means that you need to optimize the section of that page, about 3/4 the way down.
Scroll maps are easy to read. The color visualization showcases hotter colors over the section of your page that has retained the most visitors, cooler colors as more visitors drop off.
Click Maps
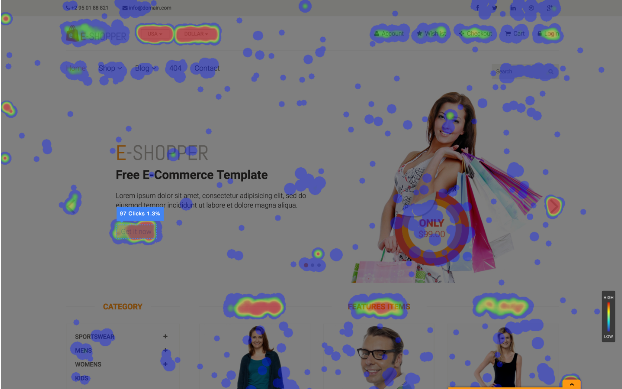
Click maps showcase where your site visitors are clicking the most. These places on your site are portrayed as hot zones.
This data helps you understand which parts of your site are going unnoticed. For example, a certain CTA button might have a relatively low amount of clicks, which gives you insight into what to optimize.
Alongside conversion rate optimization, click tracking also points out error clicks, dead clicks and rage clicks. These types of clicks work as a notifier of places on your site that need fixing.
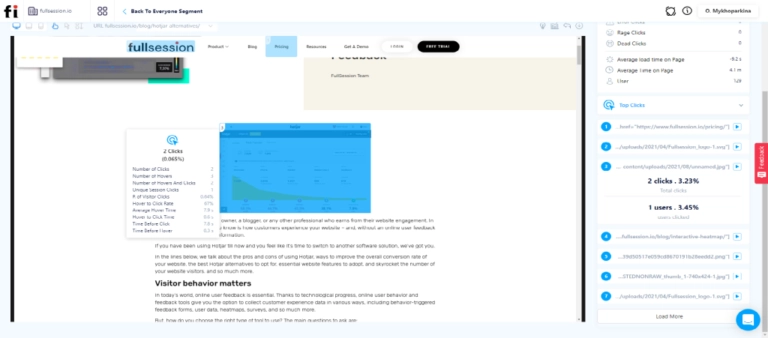
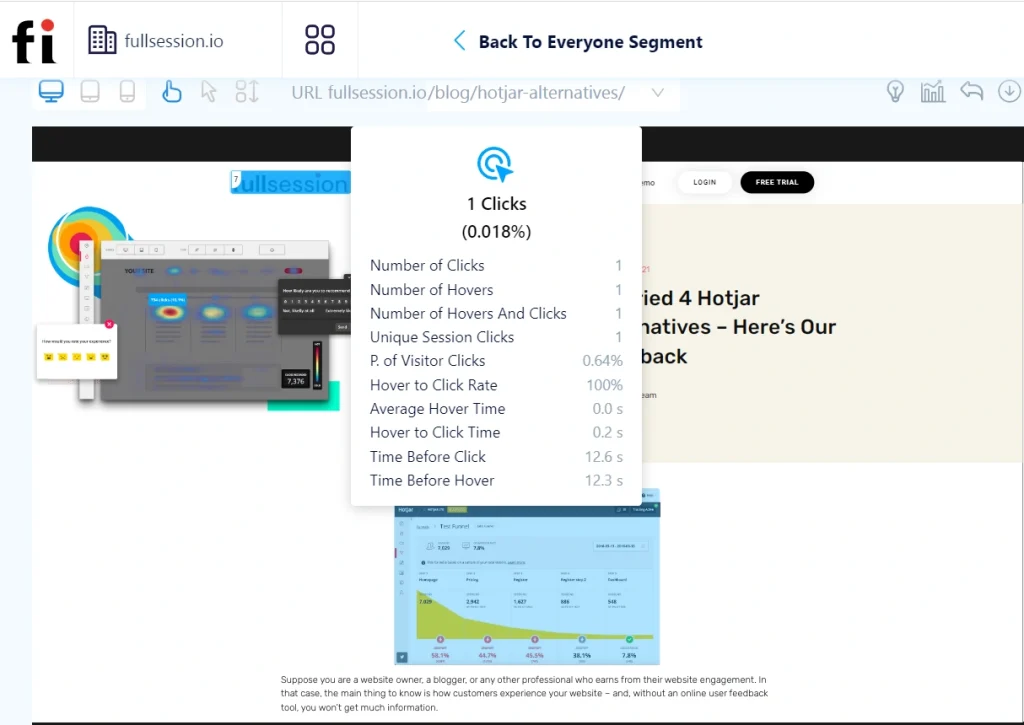
Click maps also provide data and analytics alongside the visual aspect. This allows you to overview the data with the hot zone perspective, but then dive deeper into each section of your page.
Data points per hot zone provided include:
- % of visitors clicked
- Average hover time
- Hover to click time
- Time before click
- Time before hover
Here is an in-depth guide on click tracking.
Mouse Tracking Heatmaps
Mouse tracking heatmaps, also known as mouse movement heatmaps track mouse movements made by your site visitors. This type of data gives you insight into areas of your site that cause frustration or impatience from the user.
Utilizing mouse tracking alongside the rest of the click tracking tools really wraps everything together. Visualizing where users click is one thing, but mouse movement visualization tells you how they got from click to click, and if there were any bumps along the way.
Here is a full breakdown of all of the types of heatmaps you can utilize on your site.
Benefits of Using Heatmaps
Optimizing Conversion Rates
The only way to increase your website conversion rate is through running a UX audit. A proper UX audit gives you real insight into the way users interact with your site, rather than just playing a guessing game.
Heatmaps are a huge factor in running a UX audit. They take casual data and analytics about your site, and create a visual on it. This benefits you by giving your data a human understanding and a physical element. Ecommerce teams can also compare the best heatmap software for ecommerce when they need tools built for product pages, checkout behavior, scroll depth, and conversion analysis.
As a bonus, heatmaps also give you insight into usability issues. And as we know, sometimes these usability issues that go unknown, may hurt your conversion rate by 5-10%.
Analyzing Non-Clickable Elements
Think about those moments when users hover over something that looks clickable but isn’t, leading to confusion and frustration. Heatmap tools are brilliant at spotting these design flaws.
For example, you may find that users are clicking furiously on images and areas thinking they were CTAs or navigation buttons. Once you realize this through your heatmap data, you can feed in to the sentiment, and suddenly those dead zones turn into conversion gold mines as clicks translated directly into action.
Identifying Bounce Rates and Exit Points
Detective work gets real when studying bounce rates through heat maps display capabilities. By tracking mouse movements and seeing how far down users scroll before dropping, we get insights which help us adjust content placement so everything valuable is seen quicker by more users.
How to Install a Heatmap Using FullSession
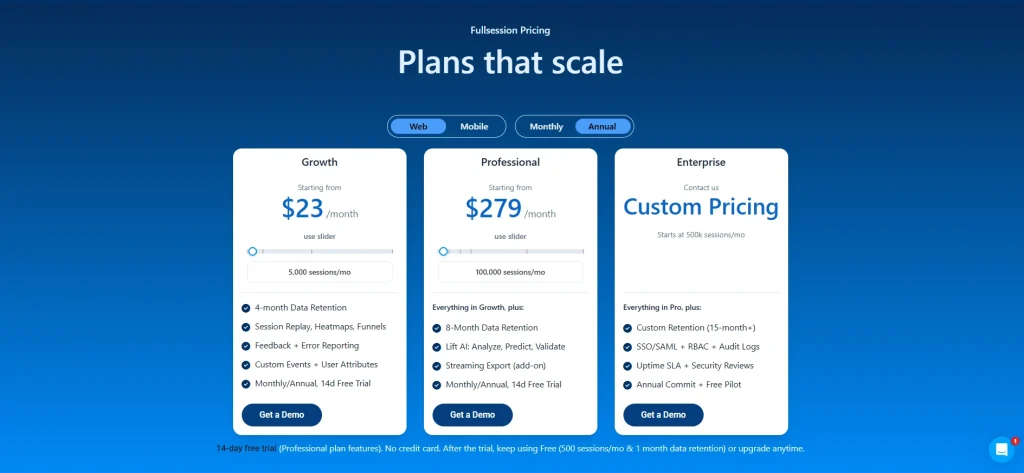
It takes less than 5 minutes to set up your first heatmap, with FullSession, and it’s completely free!
FullSession Pricing Plans
Why Use FullSession Heatmaps?
FullSession provides all of the heatmap tools we discussed in this article. Unlike other heatmap softwares, you also unlock a full suite of valuable tools to boost your optimization campaign.
FullSession also provides:
- Session Recording Software
- Funnel and Conversion Optimization
- Website Feedback and Customer Surveys
Using these tools simultaneously with a heatmap software brings you everything you need to increase your website conversions.
FAQs in Relation to What is a Heatmap?
What is a heatmap and why is it used?
A heatmap tracks where users click, move, or scroll on your site, highlighting hotspots to boost user experience.
What is an example of a heatmap?
An e-commerce site’s page showing spots where shoppers mostly click—a clear guide for improving layout design.
What is a heatmap in website tracking?
In web tracking, it’s all about spotting user trends and where they linger or bail.
Mohamed oversees operations and finance at FullSession and has contributed to the company’s UX analytics knowledge base.