Most companies nowadays rely on the Internet in one way or another, either for promotion or for selling their products and services to customers. It’s easy to consider your website successful, but you need to track users and monitor their behavior to understand how well your website performs.
To gather actionable insights, you should use web analytics tools like our FullSession. It provides interactive heatmaps, session recordings, replays, website feedback forms, and advanced analytics.
Our UX analytics tool helps you find and fix issues with your product to ensure the optimal user experience. To see how FullSession works, you can get a demo or start your 14-day free trial.
If you want to evaluate other options, Google Analytics vs Amplitude analysis will probably rank high on your list. How do they differ? How can you use them? We’ll try to answer all these questions and explain why FullSession is better for your business.
Let’s start with some basics about Google Analytics.
What is Google Analytics?
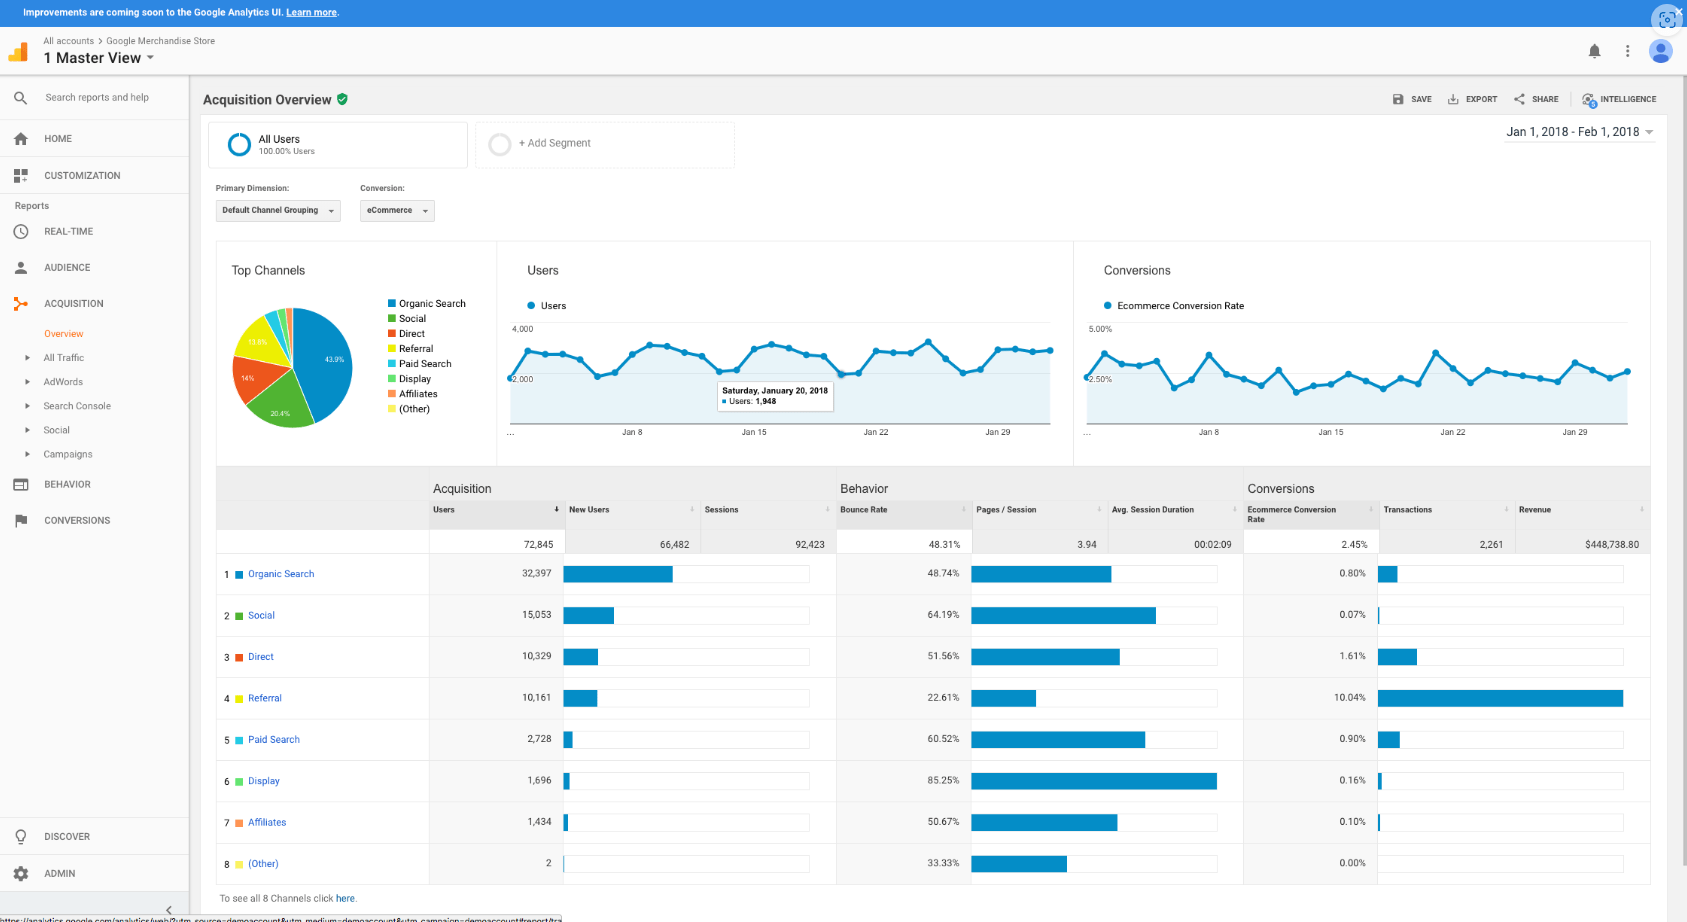
Image source: G2
Google Analytics is a free web analytics tool that lets you track website traffic, analyze website data and create custom reports. It helps you optimize your website performance, identify growth opportunities, and recognize issues so you can fix them before they affect your business.
A Google Analytics account lets you view your unique visitors, bounce rate, time on page, referer URL, search keywords, and more. You can also see which marketing channels drive traffic to your site most effectively and focus your efforts on those areas in the future.
It’s available as a web service, but to use it, you need to install a code snippet to your website. Many different industries and organizations rely on it. Marketing professionals, UX researchers, and software developers, among others, may also employ it.
What is Google Tag Manager?
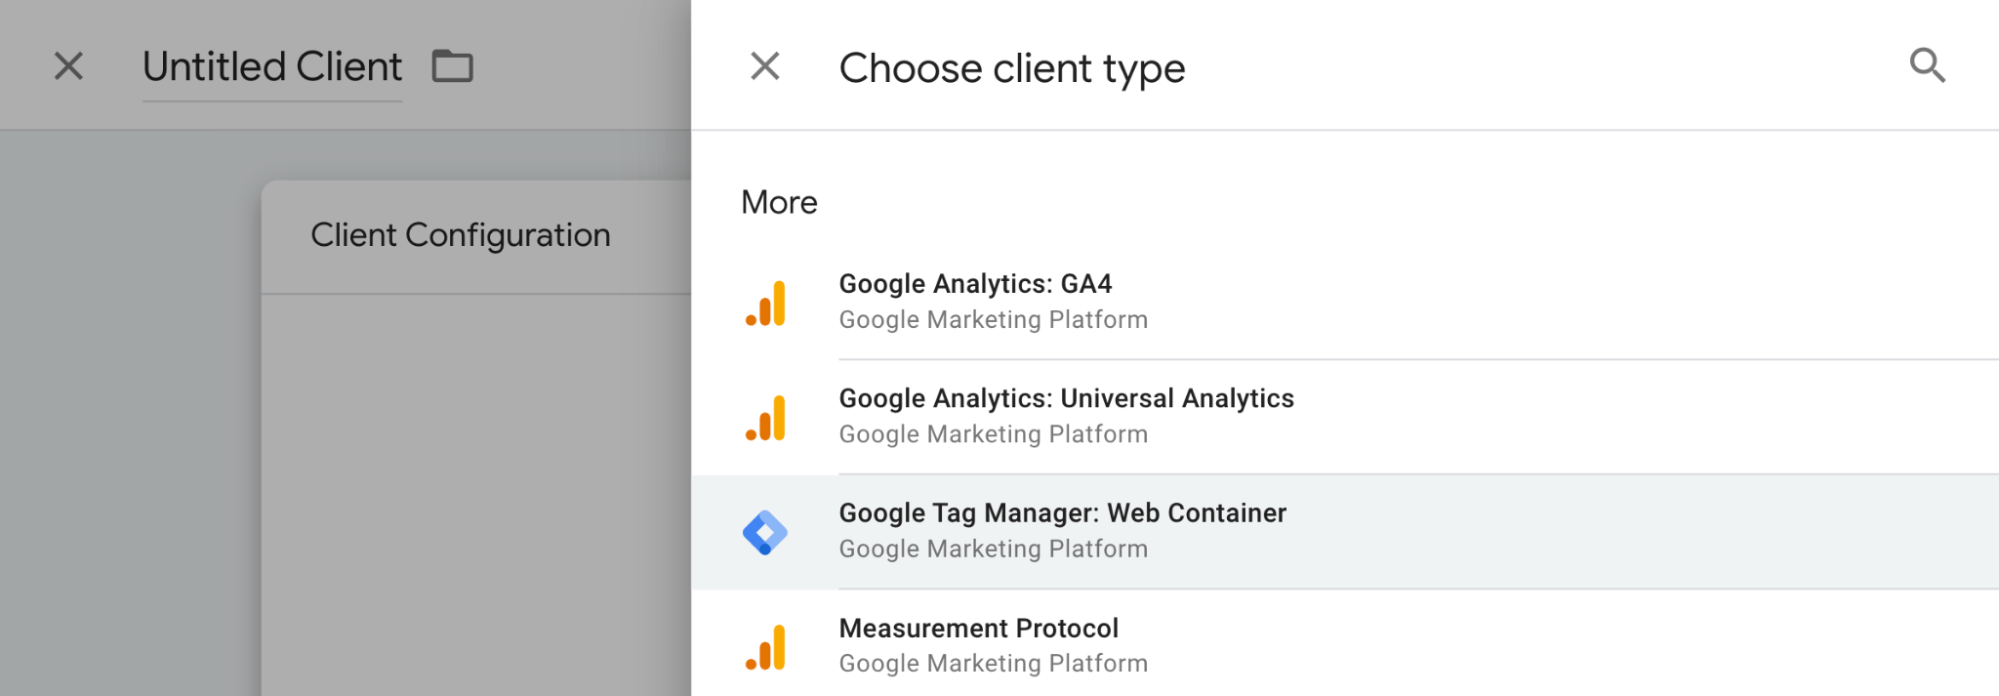
Image source: Google Developers
Google Tag Manager (GTM) is a tool that makes it easier to develop and manage tags for Google Analytics. Using GTM, you can easily create, publish, and update your website tags without writing code or tracking changes manually. Instead, you define the tags you want to track—such as page views, clicks, and conversions—and then Google Tag Manager does the rest.
Today, Google Tag Manager is one of the most popular ways to integrate Google Analytics into your website and build a comprehensive view of your website performance.
Tagging is a critical part of SEO because it lets Google and other search engines know what kind of content is on each page. It allows them to more accurately understand how relevant your site is to the people searching for it, improving your ranking over time.
G4 will soon replace Universal Analytics
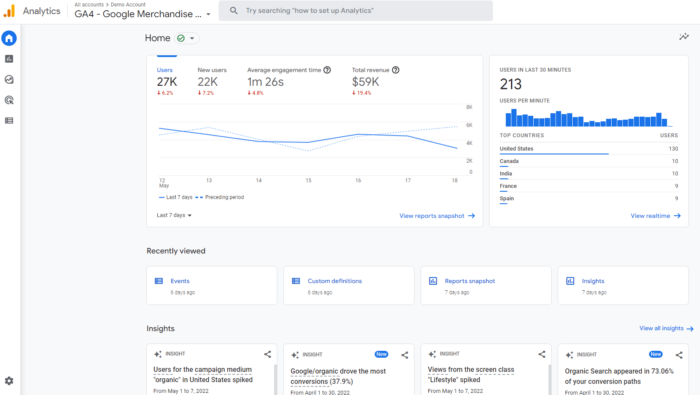
Image source: Neil Patel
It’s also worth noting that on October 1, 2023, the old Universal Analytics service will be deprecated and replaced with G4.
It is a free reporting and optimization tool for Google Analytics that gives users one-click access to their analytics data. G4 integrates with GA, allowing users to view detailed insights about their website traffic, and includes all their data in one place. Users can also set up custom events and goals and track progress.
What is Amplitude?
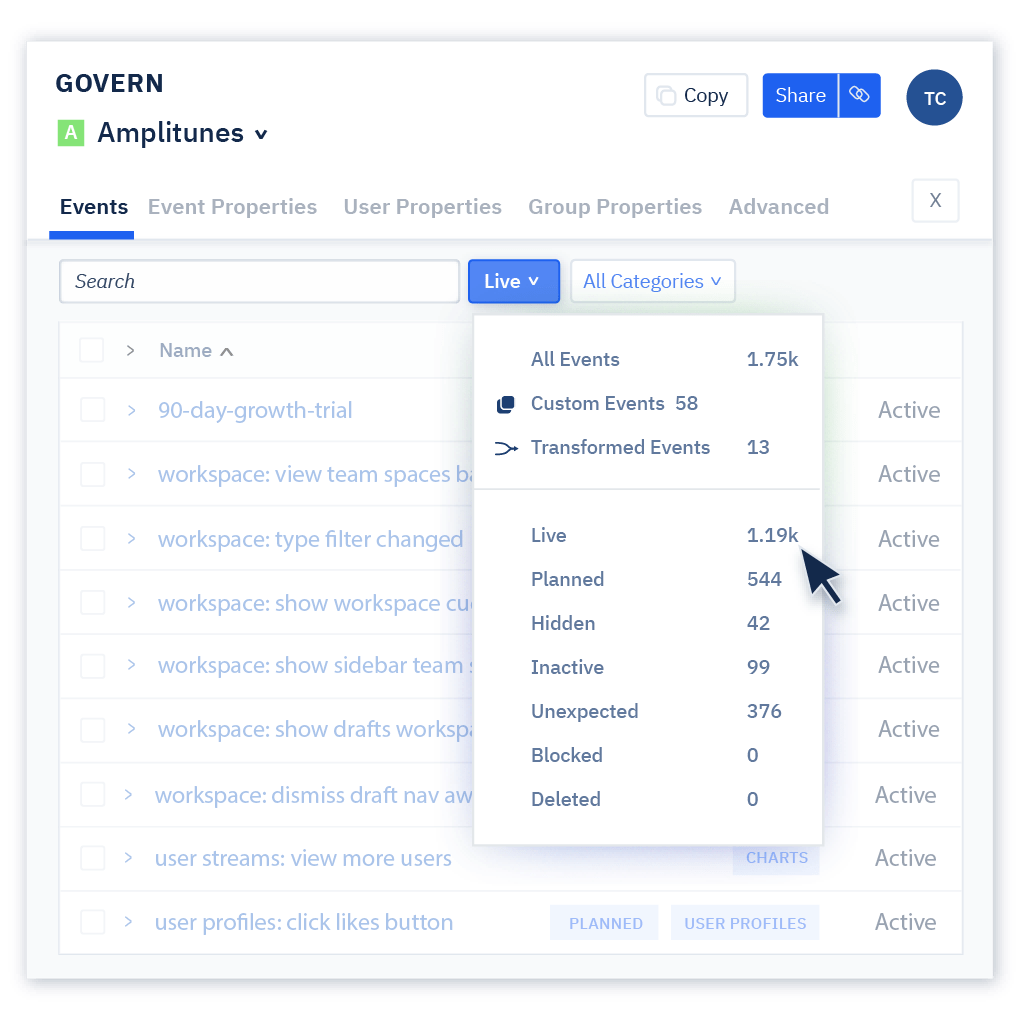
Image source: G2
Amplitude is a web analytics solution you can use to optimize a website across multiple platforms and devices. It provides you with useful data and gives you tools to understand user behavior better. You can make the necessary improvements to your digital product by analyzing user actions.
The entire Amplitude system consists of six different components. You can use some of them, or all of them, depending on your needs. These are
- Amplitude analytics – the core part of the system. It allows you to analyze your feature performance, user actions, and business outcomes.
- Amplitude recommends – focuses on the behavior of users, providing you with options to customize and personalize the customer experience.
- Amplitude experiment – helps you optimize your digital products via A/B testing – comparing two possible solutions.
- Amplitude academy – a resource repository with helpful guides, tutorials, and courses.
- Developer docs – a developer guide on APIs and SDKs.
- Amplitude data – This system part is currently in beta. It provides you with more tools to define, verify and track your data.
Since we covered the basics of Google Analytics and Amplitude, let’s explain their fundamental differences. For teams that like Amplitude’s product analytics features but want to compare tools with session replay, heatmaps, simpler setup, or different pricing models, reviewing Amplitude alternatives can help clarify which platform fits their workflow better.
Google Analytics vs Amplitude: How these analytics tools compare

Image source: Freepik
We’ve introduced both platforms, which are the main topic of this article. Now, let’s make a detailed evaluation. We’ll compare the following areas: features, integrations, languages, and deployment. We’ll also look at the pricing and customer support and consider the user reviews these solutions get on popular websites.
Google Analytics vs Amplitude: Basic differences
You can use both solutions simultaneously since they focus on slightly different things. Google Analytics allows you to track customer journeys and analyze engagement data, funnels, and similar. It’s undoubtedly a stronger brand and might be safer for some companies. It also has much better language support. You can also gather insights and try to predict future outcomes with the help of machine learning.
However, GA provides raw, statistical data. Amplitude goes one step further because it allows you to filter the information better, offering a more customer-centric approach.
You can set user properties, and you can also customize your dashboard in more ways, move metrics important for your project to the top, and so on. The platform also puts more emphasis on ease of use. It provides build-in guidance to help customers understand how to use it.
Google Analytics vs Amplitude: User ratings
Google Analytics has an 8.6 score on TrustRadius based on 3,397 user reviews. Amplitude’s rating on the same platform is slightly higher – 8.7 – but based on 99 user reviews. Both platforms also have solid 4,5/5 scores on G2 with high numbers of reviews.
Google Analytics vs Amplitude: Use cases
Both products are meant for the same user groups, more or less, though Google Analytics is undoubtedly more prevalent.
Product managers, UX specialists, product teams, and marketers can use them in their work. These platforms are popular in various industries: tech, retail, media, entertainment, and many others.
Google Analytics vs Amplitude: Deployment
Both Google Analytics and Amplitude Analytics are web platforms and require you to set up an account and configure your organization and project.
You also have to go through some additional steps. In the case of Google Analytics, it’s as simple as pasting a tracking code or installing a plugin. However, with Amplitude, the process – while well-documented – is more complicated, and you’ll probably need help from your software development team.
Google Analytics vs Amplitude: Features
Both platforms offer plenty of features. Google Analytics is a good tool for collecting statistical, raw data regarding user demographics, traffic, user acquisition, etc. You can also track various website metrics and your marketing campaign results.
The platform shows user trends crucial for your business and product strategy. The data it provides is essential for most companies. GA also has an extensive list of supported languages.
On the other hand, Amplitude puts more emphasis on the individual user. For example, it doesn’t allow as in-depth, real-time tracking as our FullSession. You won’t have access to interactive heatmaps or session recordings, but you can use Amplitude to analyze user journeys and event streams.
It helps you better understand what drives people to use your website and what makes them avoid it. Amplitude developers aspired to make features customizable and flexible to fit different user needs and scenarios.
Google Analytics vs Amplitude: Languages
Google Analytics supports over 30 languages, including ones mentioned on the Amplitude Analytics page: English, French, Deutsch, and Japanese.
However, in the case of Amplitude, it’s not clear whether there is full language support for the entire platform or only for specific features.
Google Analytics vs Amplitude: Integrations
You can integrate Google Analytics with all significant Content Management Systems. In the case of some of them, like WordPress, there are even plugins you can use to make installation even more accessible.
Amplitude Analytics integrates over 80 different technologies, including Snowflake, Braze, Amazon Web Services, BigQuery, Datazoom, Hubspot, mParticle, Notion, Salesforce, Slack, Shopify, and Google Cloud Services, among others.
Google Analytics vs Amplitude: Support
Google Analytics offers a detailed documentation page. You can also use e-mail and phone to contact the company 24/7 if you have any questions or issues.
Amplitude Analytics has an entire module dedicated to learning materials – Amplitude Academy. You can also use the provided documentation and contact the company directly using the contact form.
Google Analytics vs Amplitude: Pricing
Both platforms offer free plans that small and medium-sized businesses can use without too many problems. However, the one provided by Google is more robust.
Both services also come with paid plans. In the case of Google Analytics, it’s called Google Analytics 360, and its pricing starts at $150 000 per year. It gives access to customer-centric measurement and other features, such as unsampled reports, bigQuery export, and data-driven attribution.
Amplitude has three paid plans:
- Starter – up to 10 million events per month and access to basic analytics, unlimited data sources, and unlimited users
- Growth – customizable event volume, access to advanced behavioral analytics, collaboration tools, custom onboarding, and ongoing customer support
- Enterprise – everything offered in the previous plan, plus casual insights and monitoring, better data governance, and advanced user permissions. You also have access to premium customer support.
However, pricing isn’t shown on the Amplitude site.
What to do next?
If you are still unsure which of these tools is right for your business, we recommend you start using FullSession.
We will cover all the essential details in the following sections. To better understand what we are talking about, you can start your 14-day free trial and test all features following our explanations.
Let’s start with some basics.
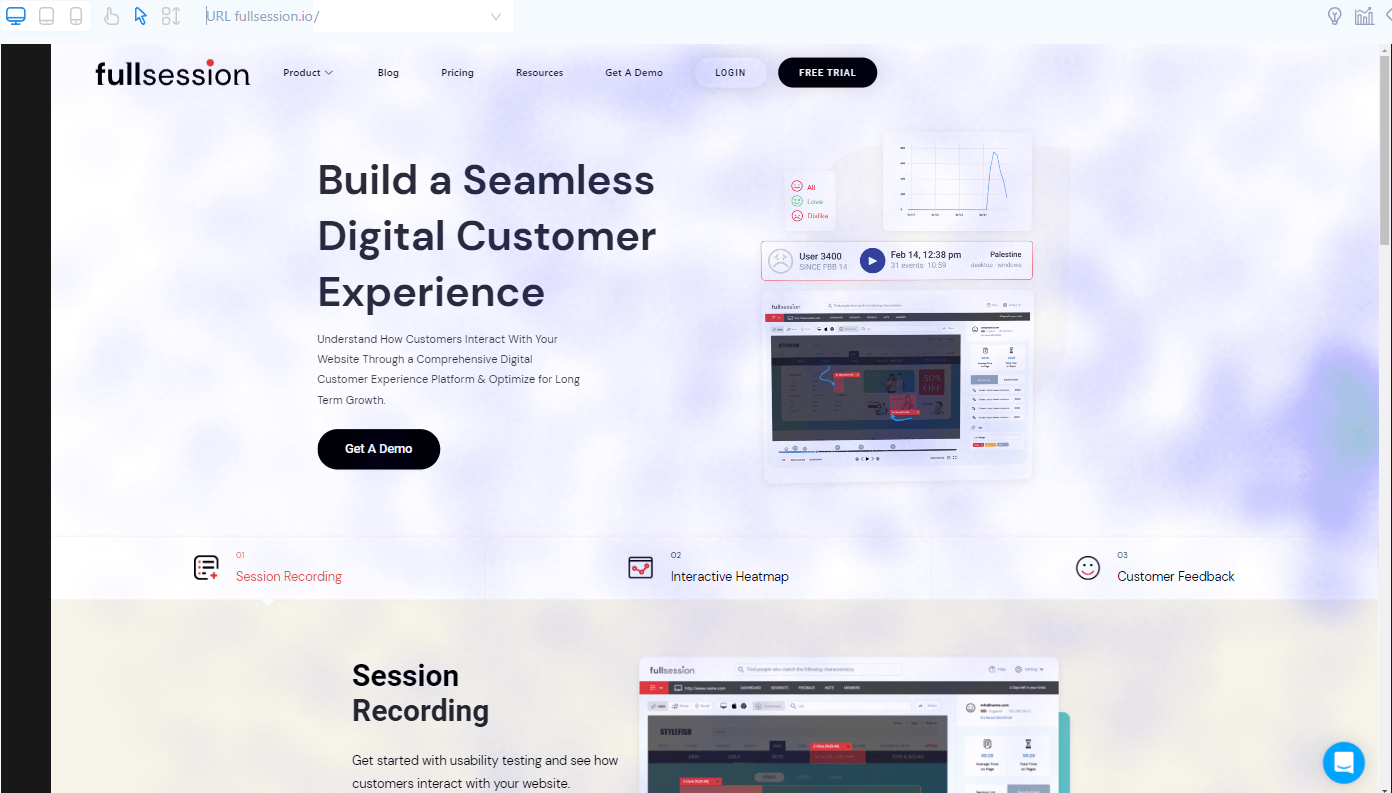
What is FullSession?
FullSession is a web analytics tool you can use to track user behavior and conduct a complex web analysis of your site, web app, or landing page. It provides a great feature set that helps you gather valuable customer data.
You can then use the data to make informed decisions about your product, improve it and increase your user experience and conversion rates. Our platform allows you to understand your users – to learn how they think, what motivates them, and what challenges they face while using your product.
FullSession is also helpful for user testing. You don’t have to spend time recruiting test participants. You can see how real users interact with your products in real-time without incurring additional costs other than the monthly fee. It’s a cost-effective way to get customer feedback and improve your product accordingly.
What features FullSession provides
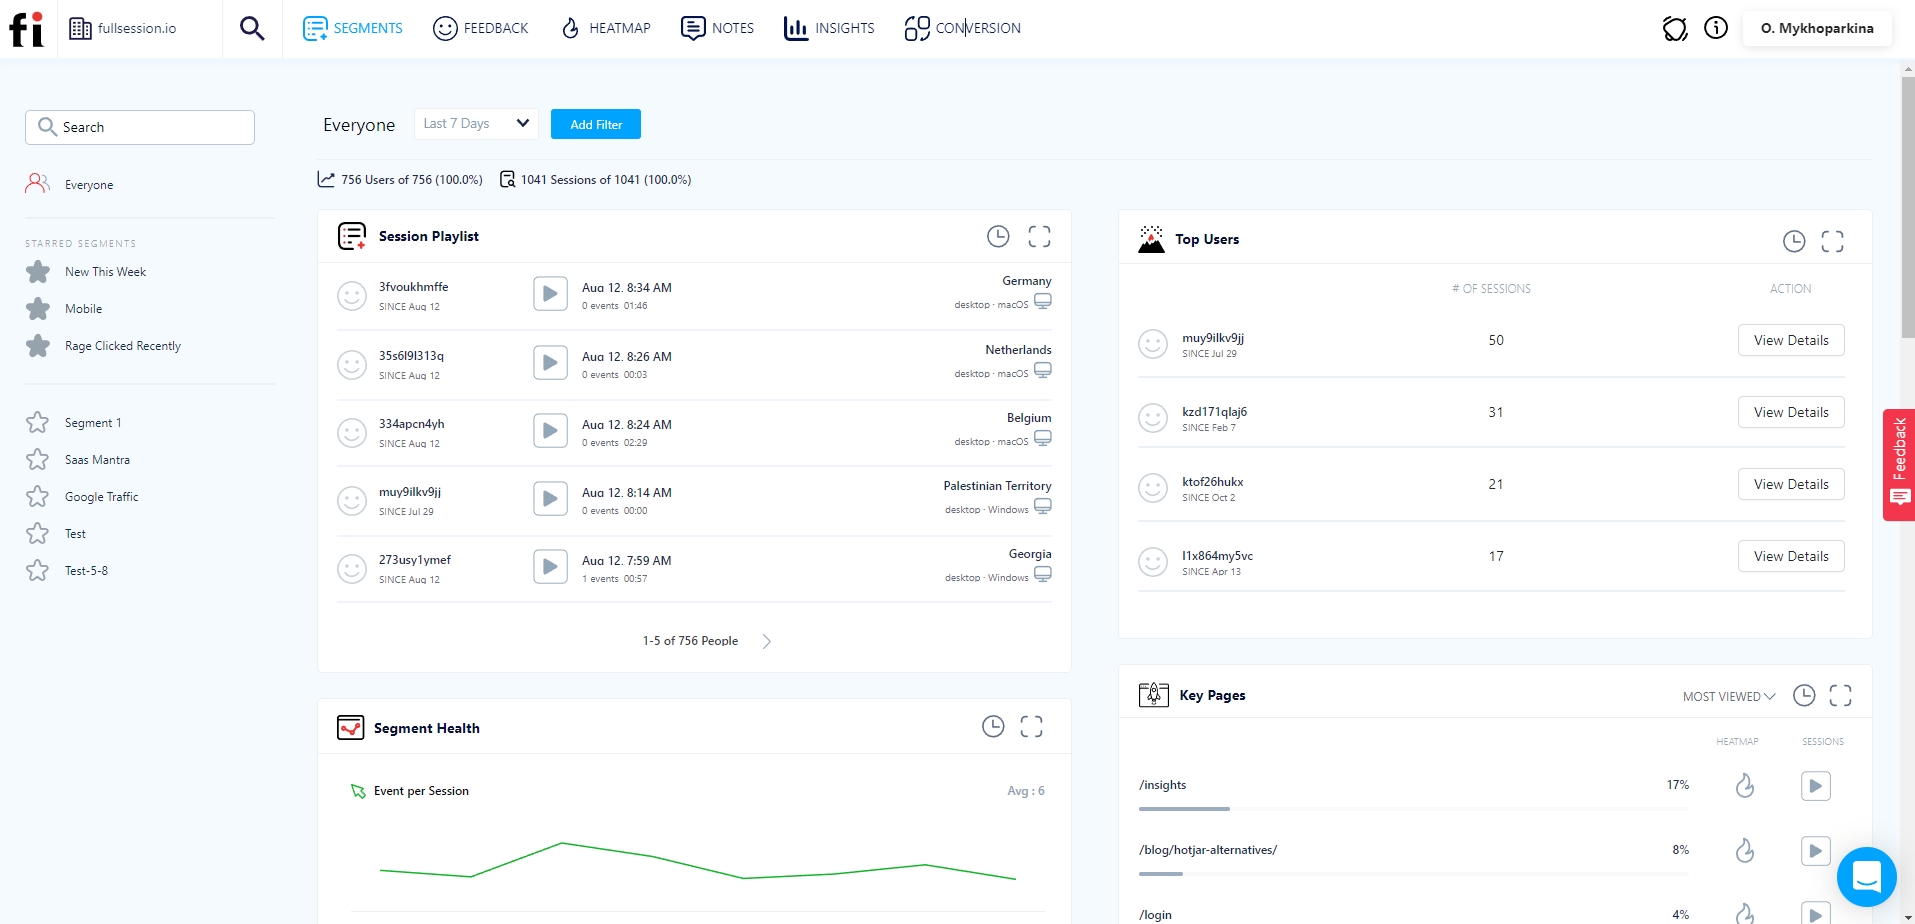
FullSession provides valuable features, including session recordings and replays, interactive heatmaps, customer feedback forms, and advanced analytics. Let’s take a more detailed look at each of these features.
-
Session recordings and replays
You can use FullSession to watch session recordings and replays. It allows you to identify problems and user trends. You can see how people use your product and what irritates them and stops them from performing specific actions.
You can also evaluate website navigation. You do all of this without hiring professional testers and conducting UX tests – you can watch how real people use your website, analyze the data, and think about what you can do better.
With our session recording and replays, you will get access to data such as
- User location and IP address
- The URL user visited
- Referrals
- Average time on page
- Total active time on page
- Session list
- Session event
You can speed these recordings up and skip periods of inactivity, so you don’t waste time during analysis. You can monitor user activity daily, weekly, monthly, or yearly.
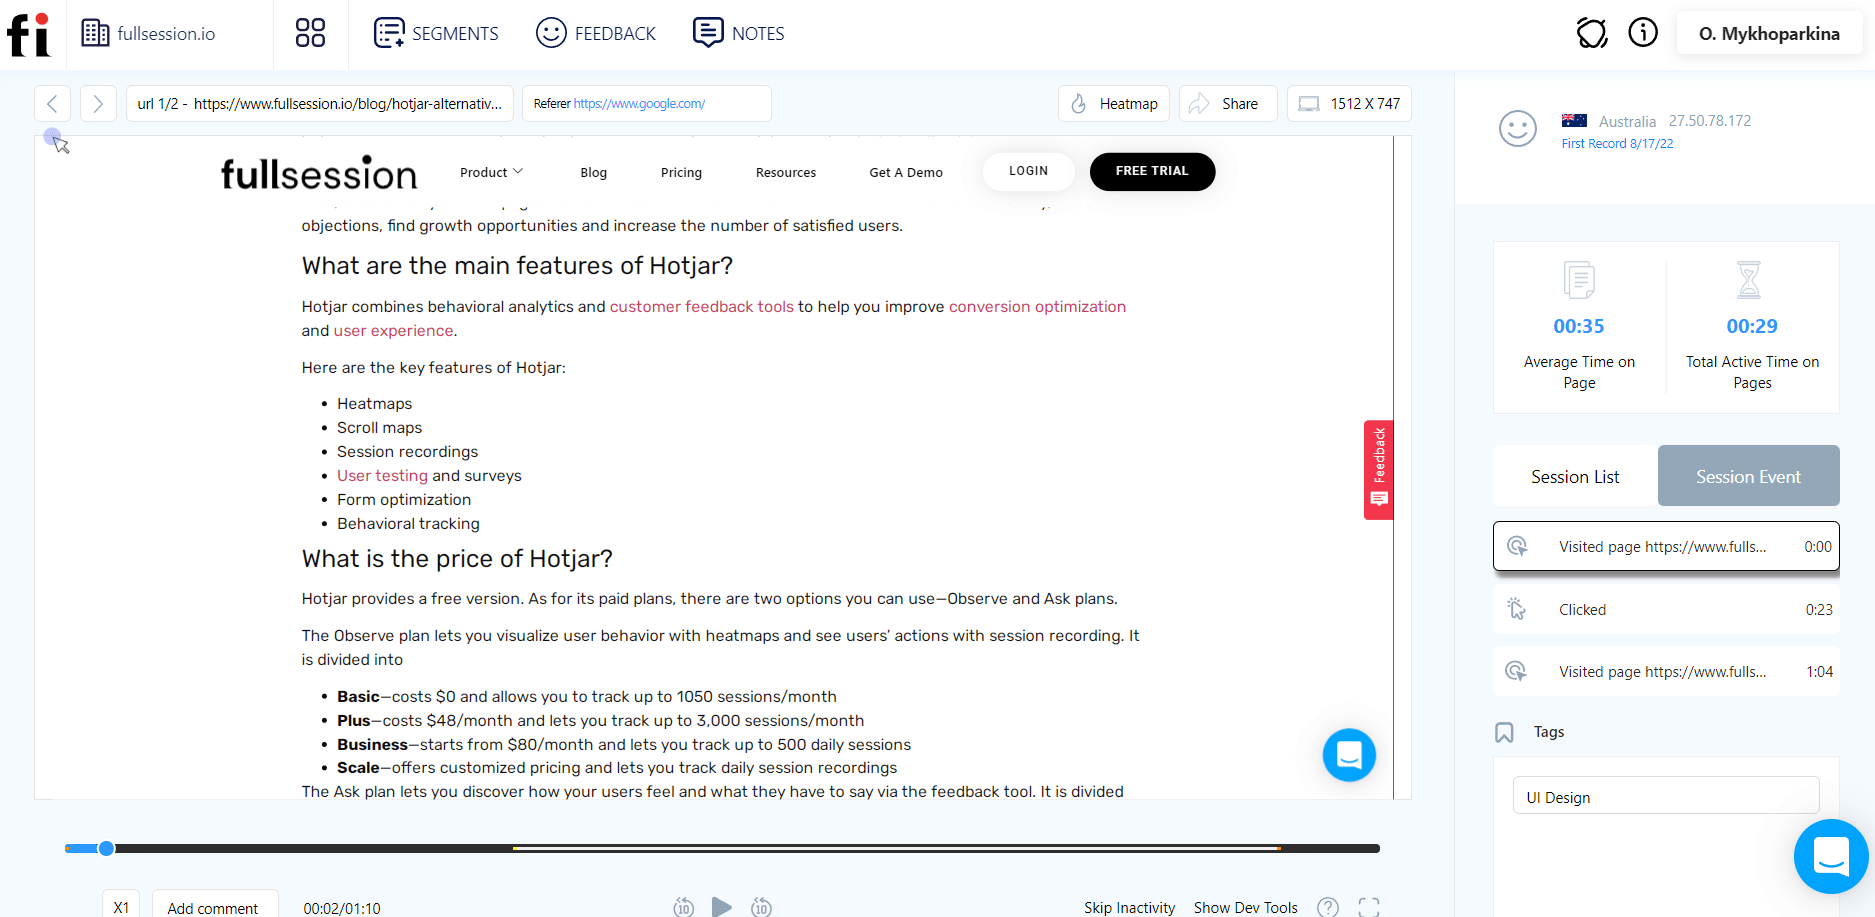
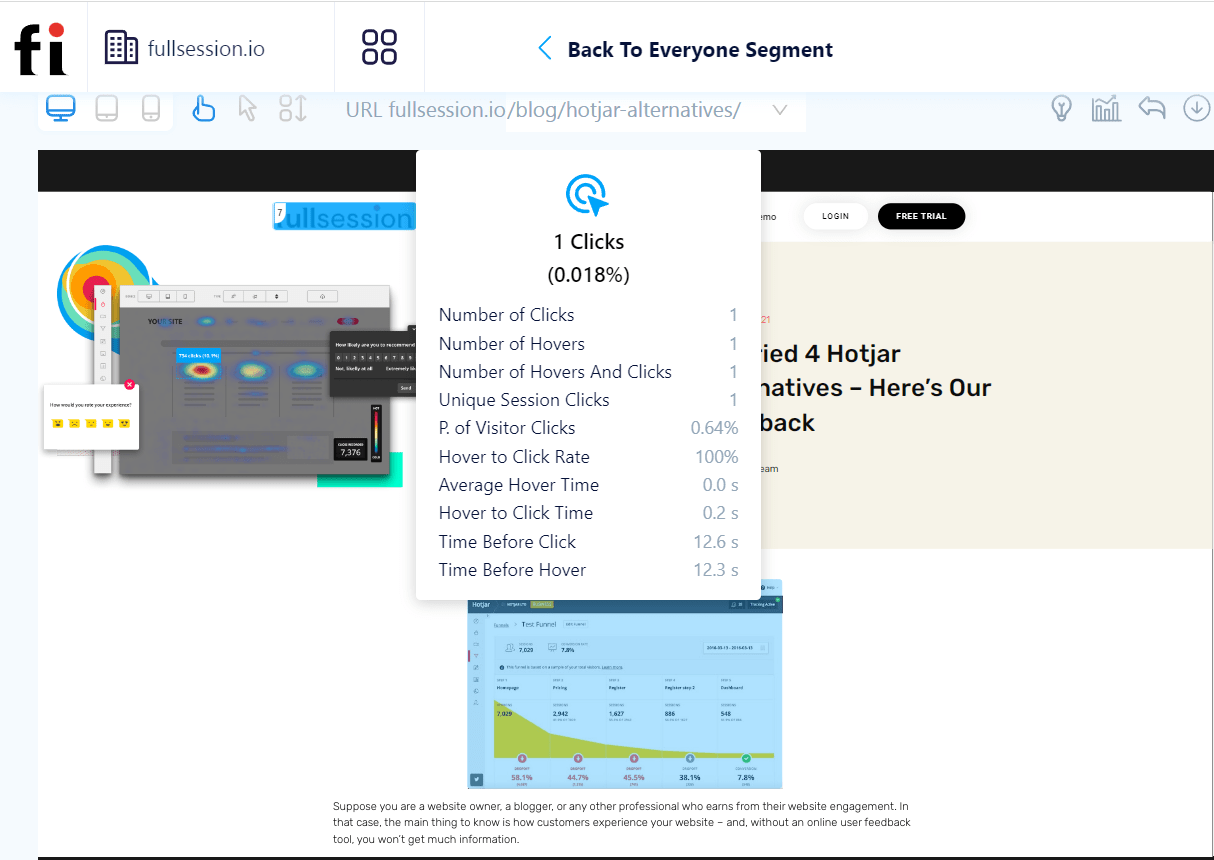
2. Interactive heatmaps
The interactive heatmaps allow you to see which elements of your website help drive user engagement and which have the opposite effect, causing them to leave before converting. FullSession provides click maps, scroll maps, and mouse movement maps.
With our heatmaps, you can:
- Check out the URL the user visited
- See the number of users who visited the page
- See the heatmap on different devices
- Get the number of total views and total clicks
- See information about the errors, rage, and dead clicks
- See the average load time on page
- Get statistics regarding the average time on a page
You can use this feature to gather information and identify friction points and problems with your solution. It also allows you to evaluate whether people find what they need on the website.
What’s important, FullSession works in real-time – you don’t have to wait for data aggregation or processing.
Click map example
Mouse movement map example
Scroll map example
3. Segments
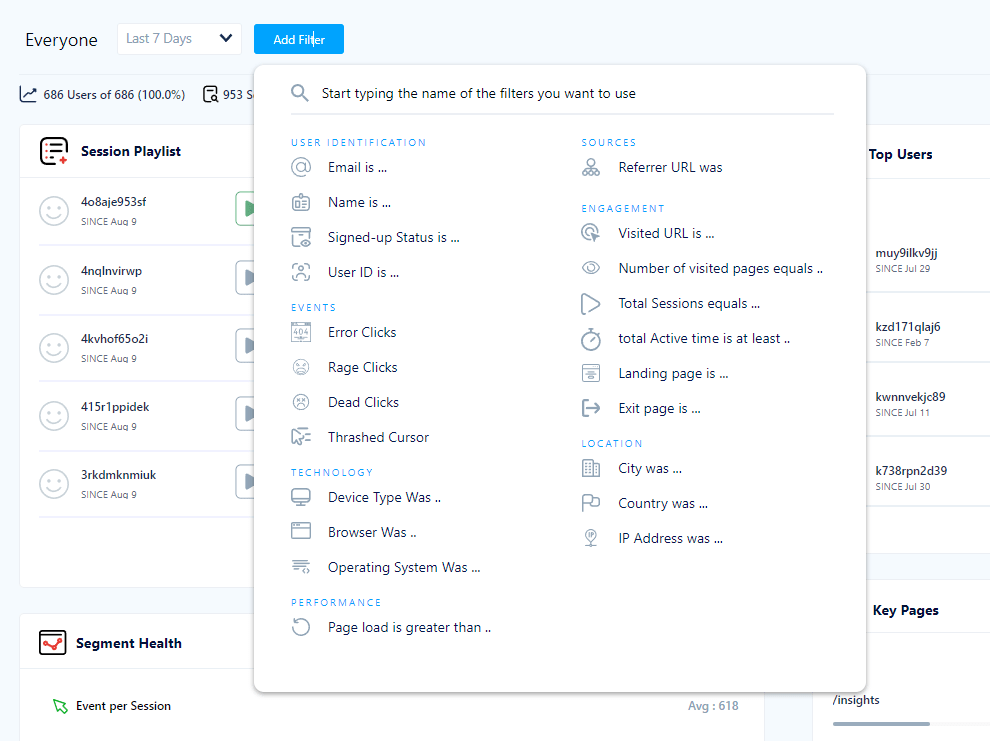
With FullSession, you can use the advanced filtering option to single out important session events and better understand the user’s frustration.
It’s a huge time saver, allowing you to focus on details that matter and share them with your team members.
4. Insights
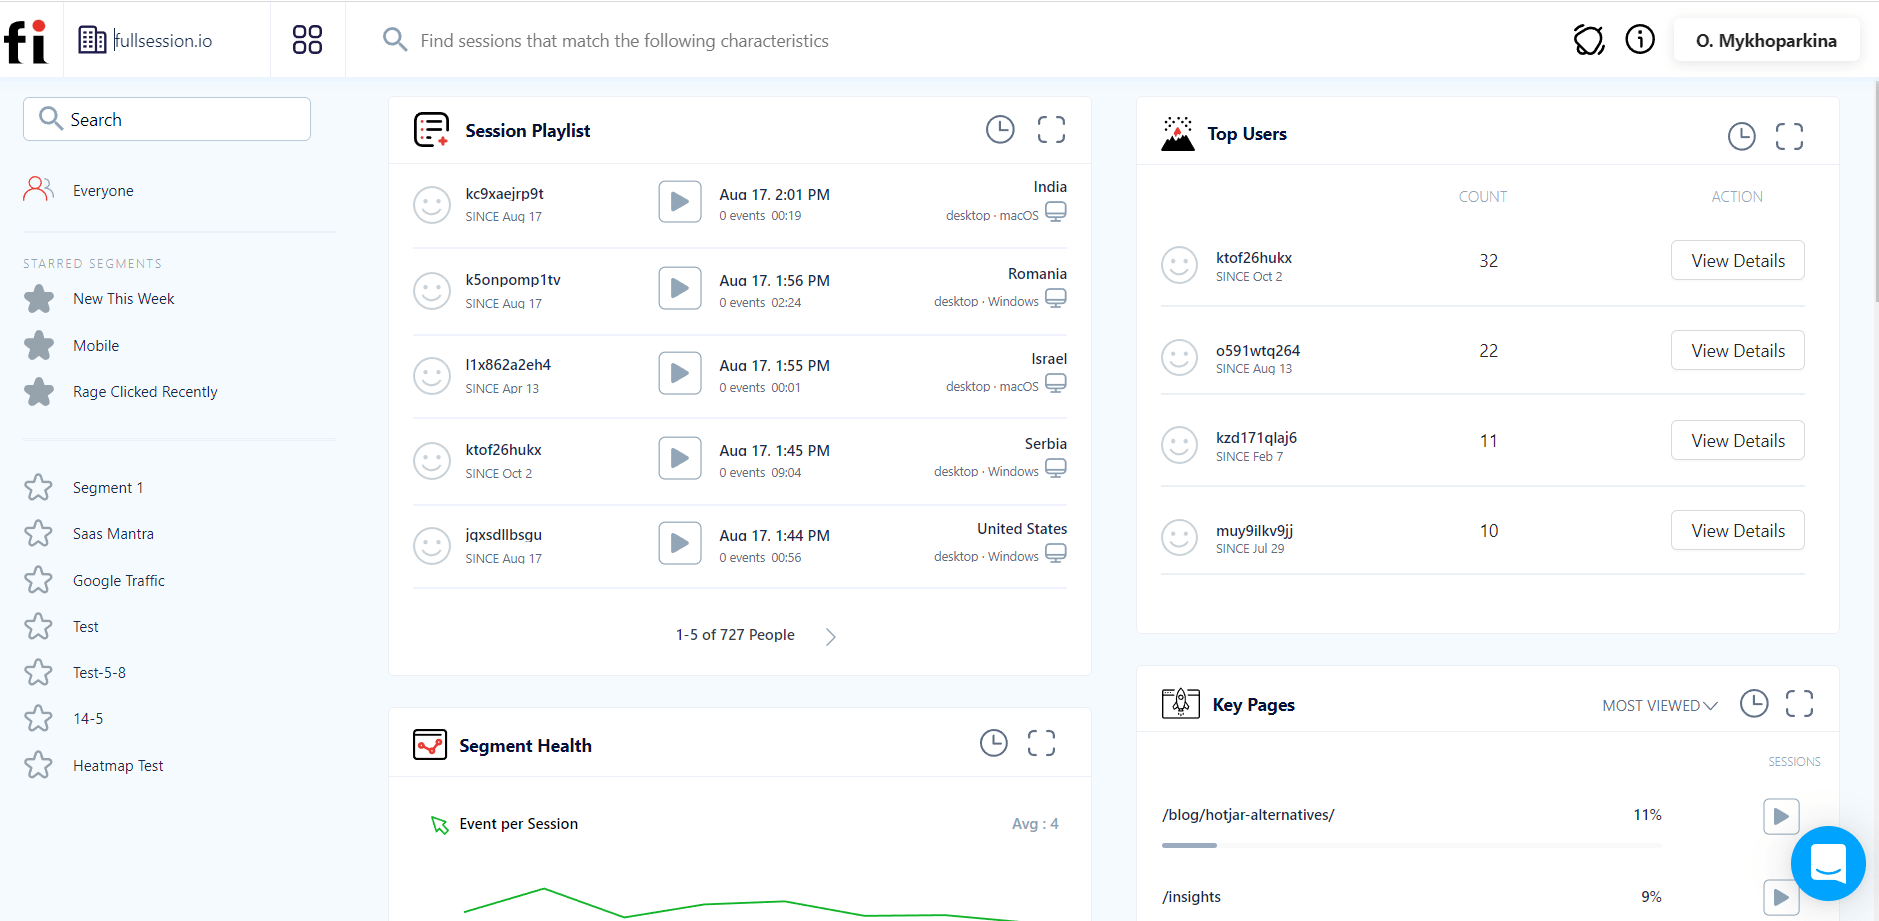
Like Google Analytics and Amplitude Analytics, FullSession gives you data you can use to analyze the behavior of users who frequent your website.
You get statistics such as the number of dead clicks, console errors, error clicks, rage clicks, average load speeds, page load data, or median scroll depth.
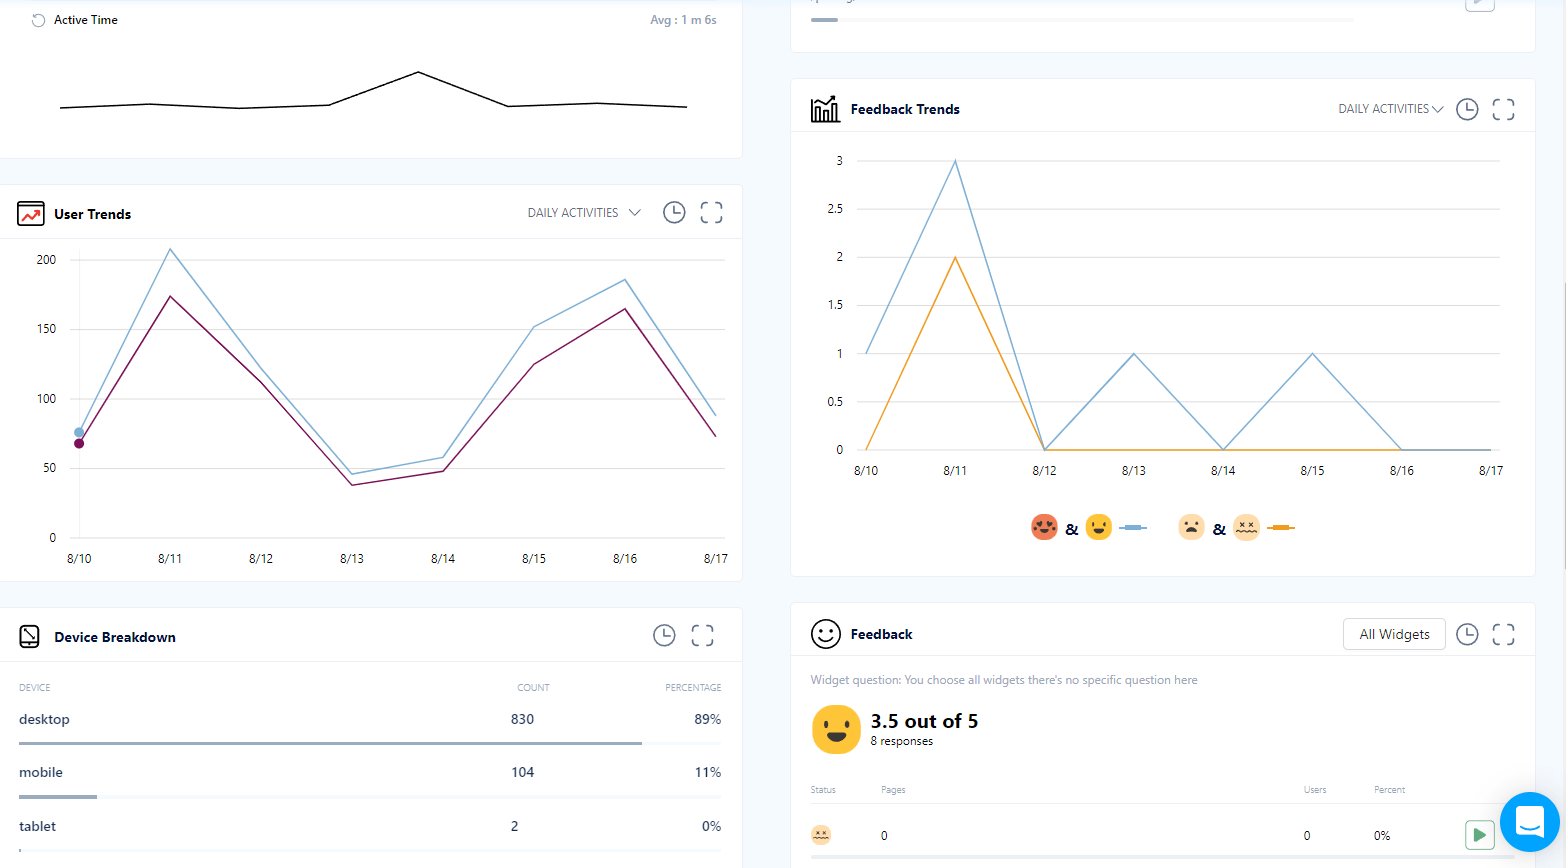
You can also see the device, browser, and screen resolution breakdown and get information on segment health, user trends, and feedback trends.
You can use this information to find and fix problems that negatively affect the customer experience. It helps you boost conversion rates and reduce funnel dropouts.
To see all data, start your 14-day free trial and connect your website with FullSession.
5. Customer Feedback
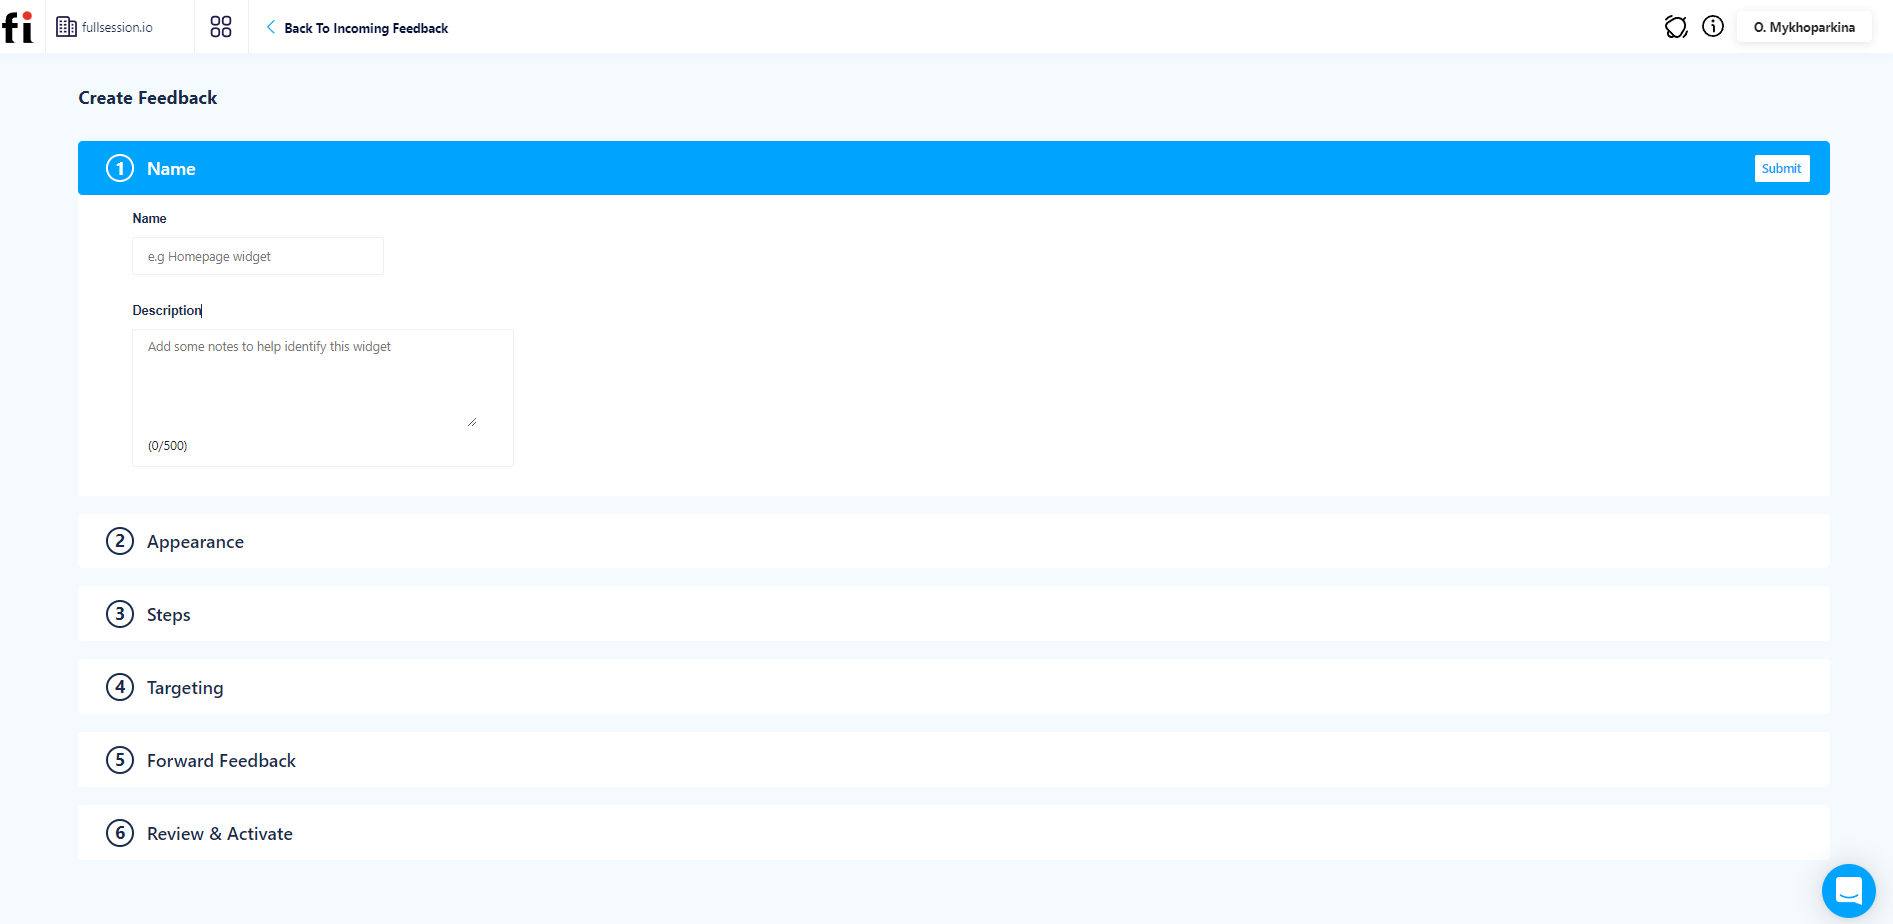
You can use FullSession to create on-page surveys, which help you gather valuable user feedback. You can choose a name and description for the poll, customize questions and design forms according to your branding, and choose the device on which you will gather the feedback.
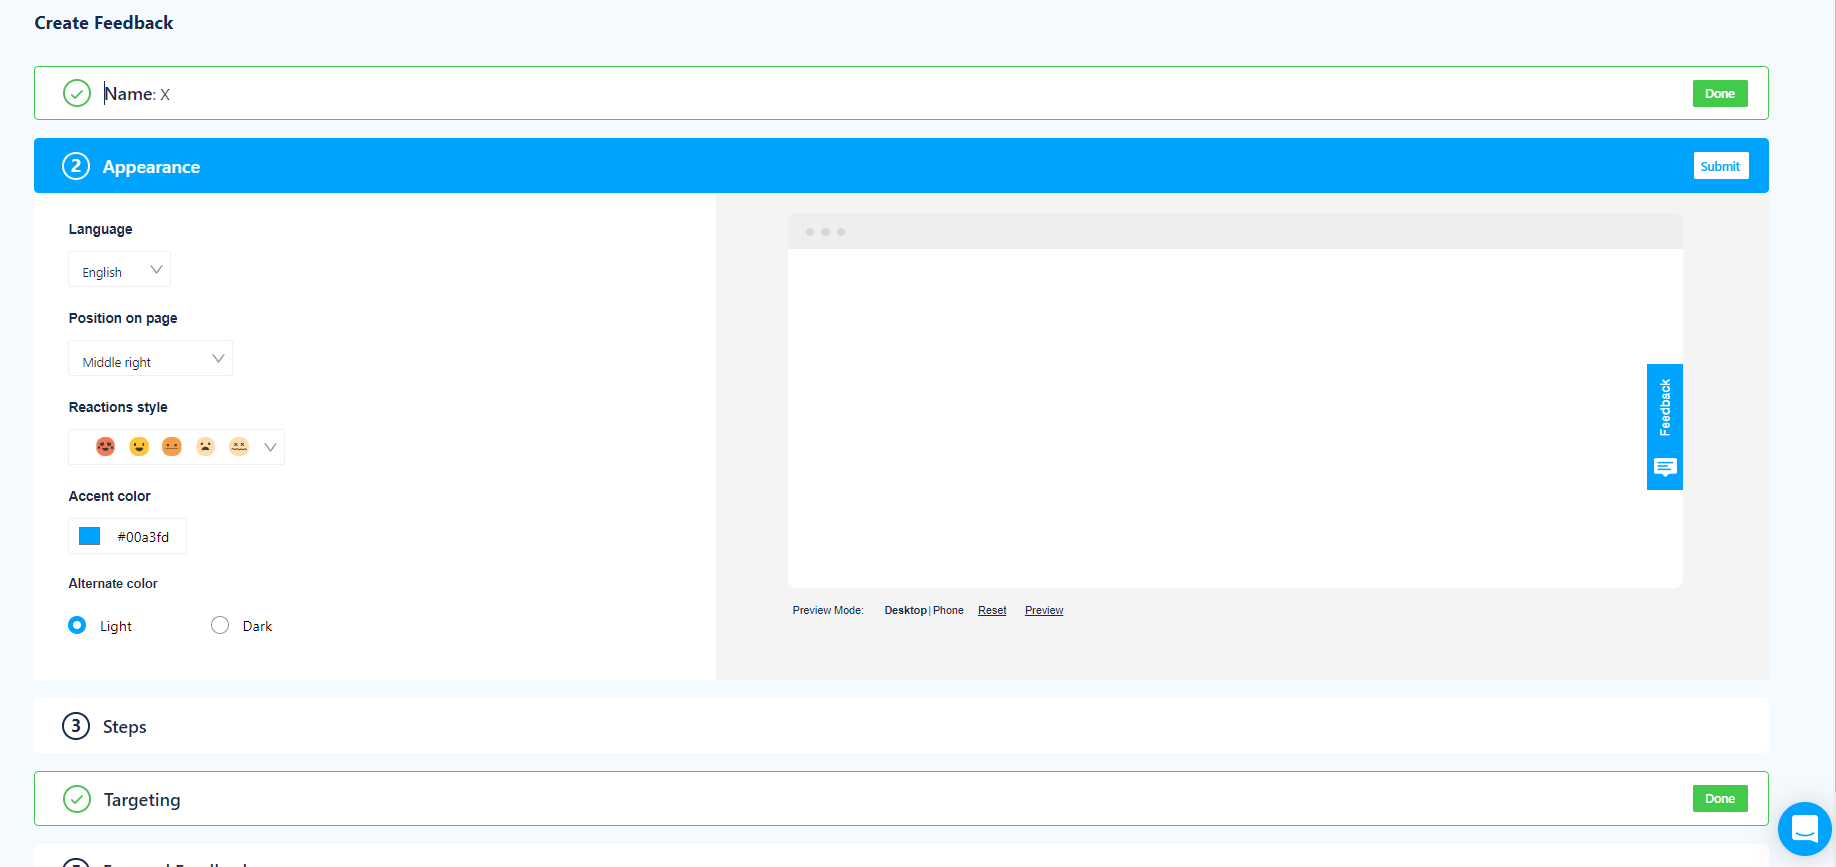
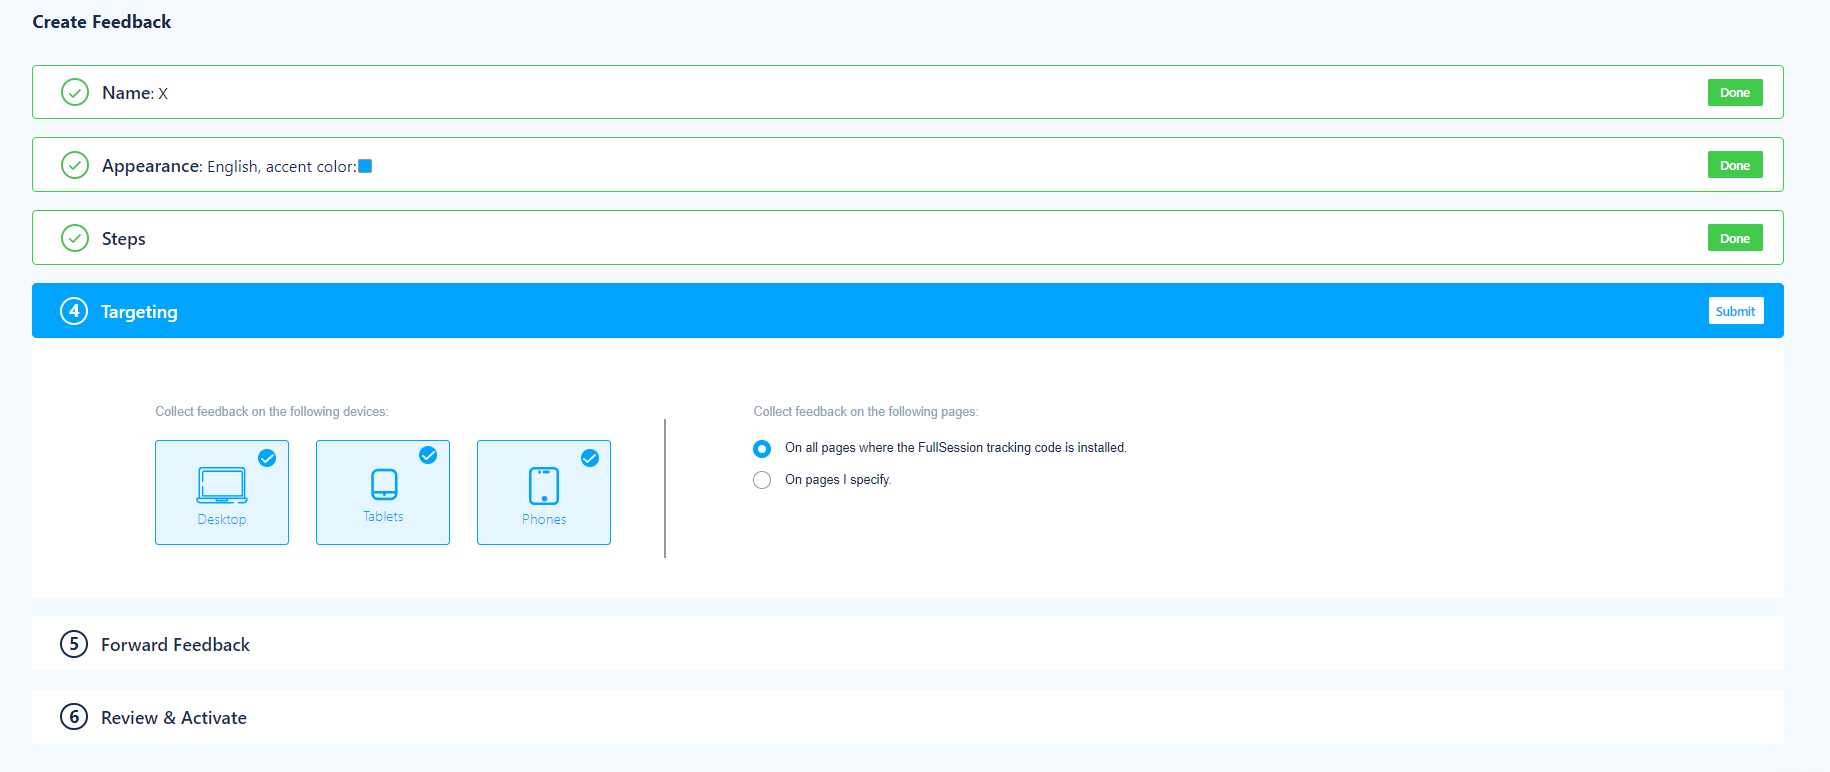
You can also choose the pages on which the form will be displayed and use interactive feedback widgets with a scoring scale – these allow users to evaluate various elements and aspects of your website. You can even send the feedback directly to your e-mail to analyze it whenever you want.
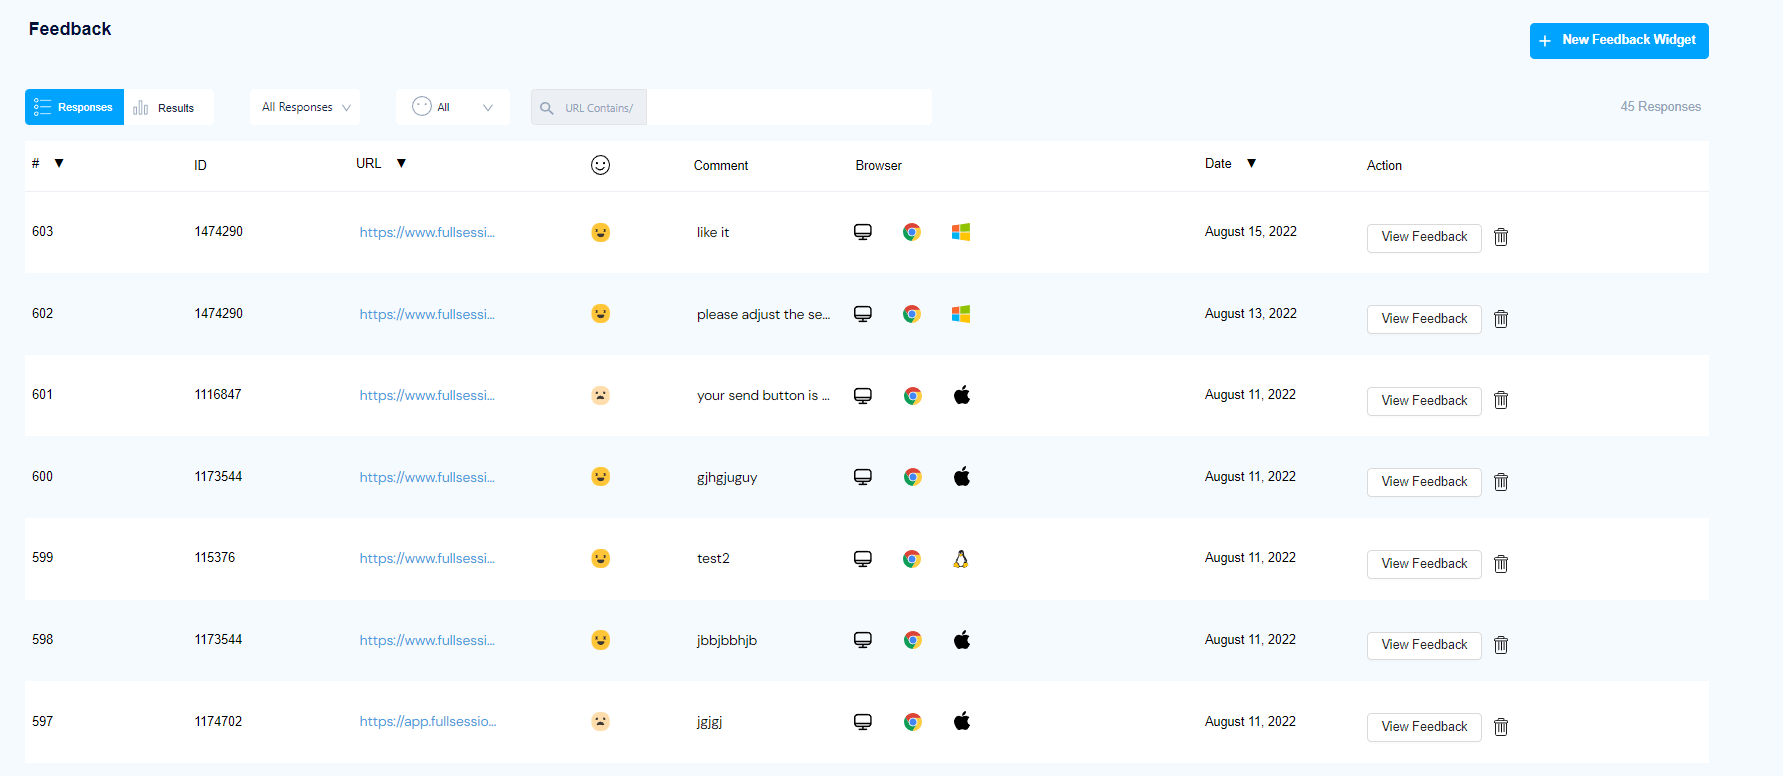
Finally, you can review the customer feedback report to see what your users think and feel about your product.
Our customer feedback feature complements session recordings very well. Survey answers give hints regarding potential problems, and you can watch the recordings to see what actually happened during a session.
6. Notes
You can leave your team notes to share important information. It makes cooperation between teams much more effortless.
7. Conversions
FullSession gives you the tools you need to track conversion. You can view conversion rates, time to convert, percentage of converted users, etc. It is beneficial when you want to see how effective your marketing strategy is.
What makes FullSession stand out
FullSession offers plenty of features and options useful in web analysis. Our platform will help you make your product much better.
Our web analytics tool doesn’t rely on user testing. Instead, it allows you to analyze real customer interactions. You can use session recordings to see how users interact with your website. You can also take things one step further and acquire comprehensive data regarding their behavior with interactive heatmaps.
You can use our platform to get information directly from your users with customer feedback forms. The search and filtering features give you easy access to whatever data you need. You can use it to identify significant events in a single session and get additional context.
FullSession is a comprehensive tool for boosting conversion and improving your marketing or sales funnel. And the best thing? It doesn’t affect your website’s performance – you can be sure our tool won’t slow your page loading time.
6 reasons to use FullSession
Here are six additional reasons to consider FullSession as your web data analysis platform:
- Focus on real user interactions – you don’t have to hire testers. You can analyze real interactions to get data you can trust.
- Ease of use – FullSession has an intuitive, well-designed interface that allows you to find information easily.
- No performance impact – our platform won’t slow your website down, so you don’t have to worry about affecting users’ experience negatively.
- A wealth of data – you can use our tool for tracking website visitors and analyzing various kinds of engagement data.
- Valuable insights – FullSession helps you understand user engagement, evaluate it, and find friction points. You can use it to optimize your sales and marketing funnels.
- Advanced filtering and segmentation options – our filters quickly let you find sessions and data you’re interested in. You can also easily identify events during a single session.
Amplitude vs Google Analytics vs FullSession: A summary
Here’s a summary of all three tools we’ve mentioned in this article, in the form of a handy table with the essential details.
| Features | Support | Pricing | Free trial or version | |
| Google Analytics | Real-time reporting,
Engagement reports, Attribution, Funnel report, Backwards pathing, Segment overlap, Proactive insights, Predictive capabilities | Documentation, e-mail, phone | $150 000 per year, billed in monthly installments ($12 500 per month) | Yes, free version |
| Amplitude Analytics | Explore behavioral data,
Visualize any journey, Measure customer engagement, Identify conversion and retention drives, Monitor key metrics, Predict future outcomes | Guides, documentation, contact form | Not provided on the website | Yes, free version |
| FullSession | Session recording and replays,
Interactive heatmaps, Segments, Insights, Customer feedback, Notes, Conversions | Help center, e-mail | Starting at $39/month | Yes, free trial |
Google Analytics vs Amplitude: Final words
Product analytics is essential. To be successful, you need to measure metrics that allow you to understand how well you’re doing, especially against your main competitors. In the case of a business that relies on the Internet, at some point, you’ll have to invest in software that’ll provide you with the necessary data.
Google Analytics and Amplitude are certainly good choices, but it’s worth pointing out that FullSession easily stands its ground against them. We offer a great feature set, including interactive heatmaps, session recordings and replays, and customer feedback forms. FullSession also gathers all the useful information and shows it on a clear, intuitive dashboard. It provides you with actionable insights, helps you analyze the acquired data, and lets you understand the reasons behind user actions.
If you want to optimize your product or evaluate how well it currently works, FullSession is an excellent choice. Want to check it out? Get a demo or sign up for our free trial!
Google Analytics vs Amplitude: FAQ
Here are answers to some of the most popular Google Analytics vs Amplitude questions you can find on the Internet.
Is Amplitude an analytics tool?
Yes, Amplitude is a platform for web analysis – a solution similar to Google Analytics, FullSession, etc.
What is the best alternative to Google Analytics?
Many web analytics platforms can compete with Google Analytics. Still, FullSession is probably the best alternative because it allows you to watch what your users do in real-time and offers you a wealth of data. You can sign up here if you want to try it.
What is Amplitude Analytics used for?
Amplitude Analytics can analyze websites and web apps. It provides engagement and conversion rate data, allowing you to monitor how users act on your site.
Is Google Analytics being deprecated?
In a sense, yes. The Universal Analytics service, the old Google Analytics some companies still use, will be deprecated on October 1, 2023. It’ll be fully replaced by Google Analytics 4, a newer solution that offers similar features.
Mohamed oversees operations and finance at FullSession and has contributed to the company’s UX analytics knowledge base.