Most SaaS companies can see where users drop off. They just can’t explain why. Your analytics show that 60% of trial users never reach the activation milestone, but no amount of staring at bar charts tells you what stopped them.
A SaaS conversion funnel is the structured journey a prospect takes from first discovering your product to becoming a paying customer and, critically, staying one. Unlike a typical sales funnel built for one-time transactions, the SaaS conversion funnel extends well past the first payment. Retention, expansion, and customer loyalty are stages, not afterthoughts.
This article covers every stage of the SaaS marketing funnel, the key metrics and conversion rate benchmarks to track at each step, how to diagnose drop-offs using behavioral data, tests that actually move the needle, and a 30/60/90 day action plan you can start this week. If you want to see exactly where your funnel is leaking before you read another word, book a demo with FullSession and watch real user behavior on your own product.
Key Takeaway
- A SaaS conversion funnel has five stages: awareness, consideration, free trial, conversion, and retention. Most revenue problems trace back to one broken stage, not the whole funnel.
- Trial-to-paid conversion is the highest-leverage metric in the SaaS funnel. A 5-percentage-point improvement can drive a 50% revenue lift from the same trial volume without changing ad spend.
- Aggregate analytics show you where users drop off. They can’t show you why. Session-level behavioral data is what closes that gap.
- B2B SaaS visitor-to-lead rates average 1.5–2.5%, but top performers reach 8–15%. That gap is a conversion problem, not a traffic problem.
- Aligning sales and marketing on shared MQL and SQL definitions is one of the fastest, zero-cost fixes for funnel underperformance in B2B SaaS.
FullSession connects every layer of your funnel data in one place: funnel drop-off reports, session replays, heatmaps, error tracking, and in-app feedback. With these actionable insights, your team can move from spotting a problem to shipping a fix without switching tools.
It’s built specifically for the SaaS customer journey pain points, from the first landing page visit through trial activation and post-conversion retention.
See where your funnel is leaking on your own product data.
Why SaaS Companies Need a Dedicated Conversion Funnel
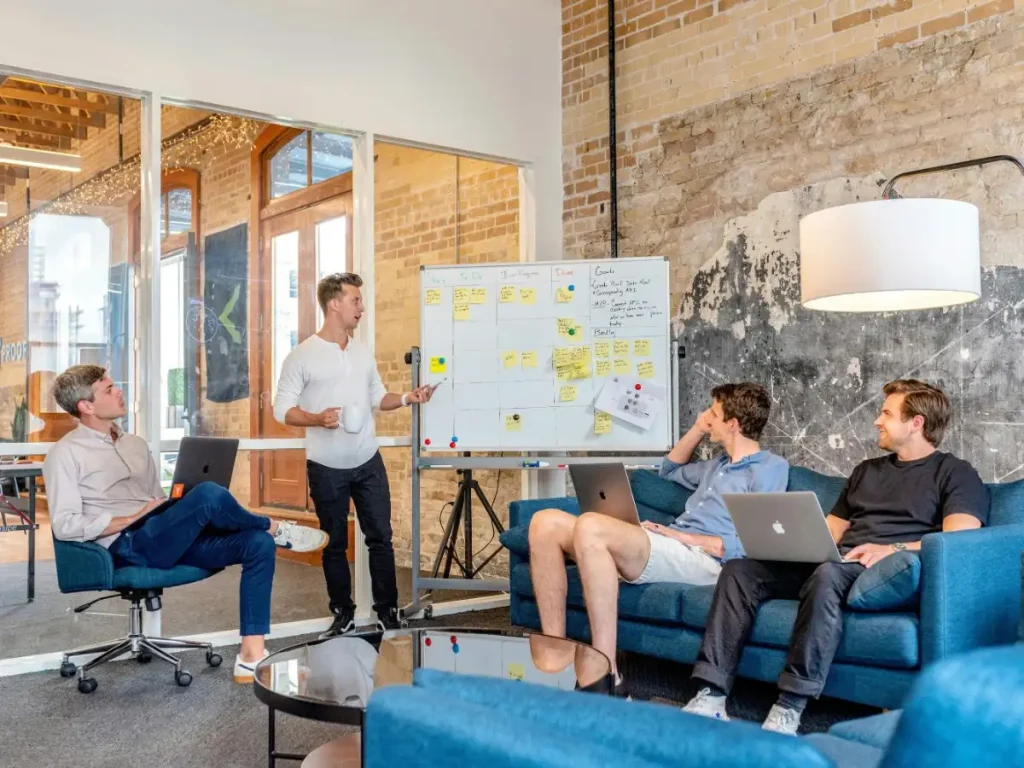
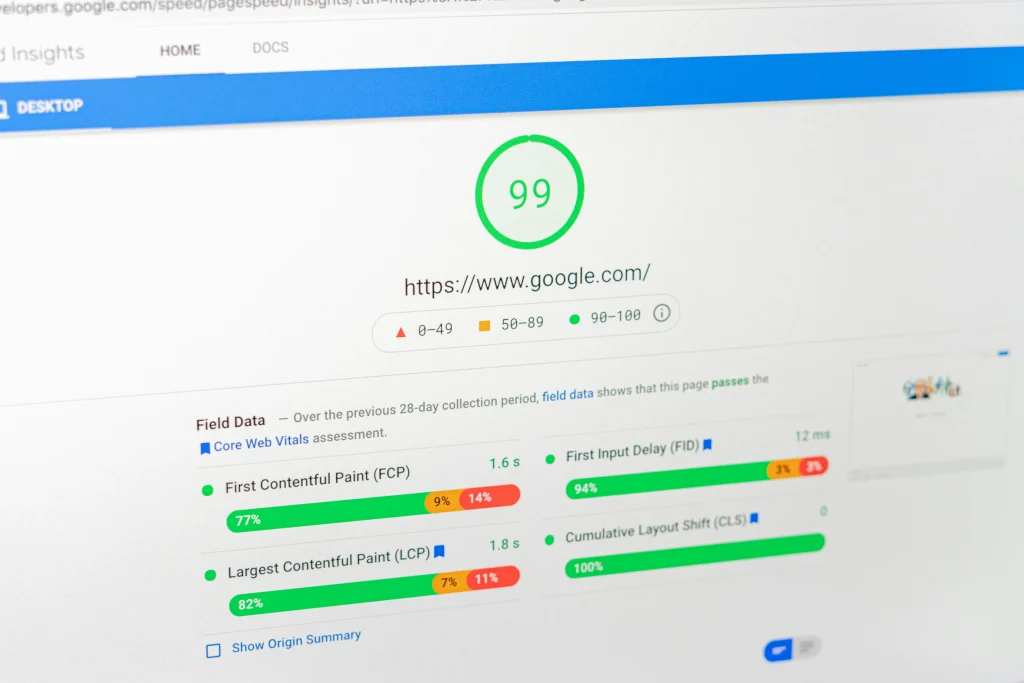
Image source: Unsplash
A SaaS business can’t grow sustainably without a conversion funnel. The subscription revenue model creates a fundamentally different relationship between acquisition and growth than any other business model, and a generic marketing funnel doesn’t account for it.
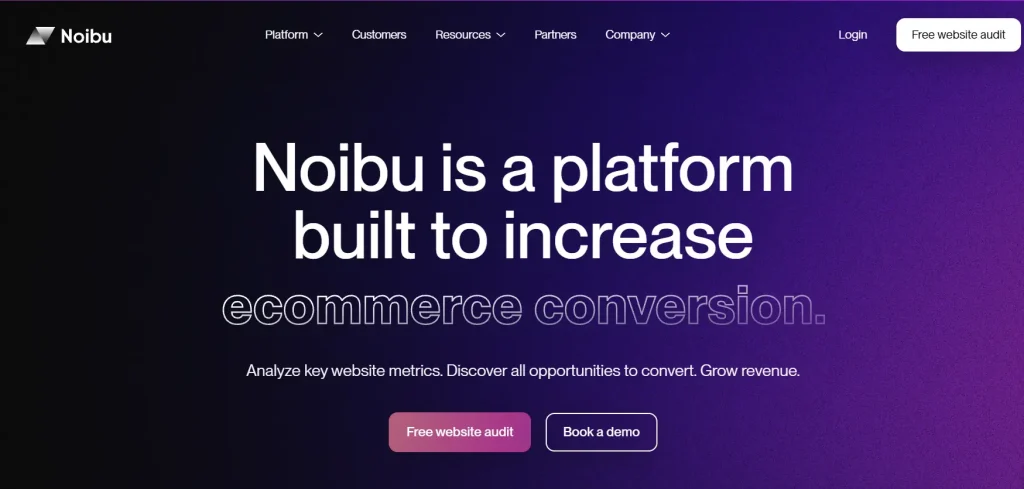
SaaS is not ecommerce
In ecommerce, a conversion ends at checkout. A customer pays once, and you move on. In a SaaS business, the first payment is the beginning of the relationship. Every month, the customer decides whether the product is still worth keeping.
That changes everything about how you structure the sales process.
What a SaaS funnel forces you to clarify
Most SaaS companies let three things stay vague for too long. A well-defined funnel fixes all three:
- What a qualified lead looks like at each stage, so marketing efforts produce paying customers, not just traffic
- Where the customer journey is breaking down, so you fix the right stage, not the most visible one
- Which channels produce new customers with the lowest acquisition cost, so your marketing team spends the budget where it converts
The financial case
Customer acquisition cost compounds fast when your funnel leaks. Spend $200 to acquire a trial user at 10% trial conversion, and your effective cost per paying customer is $2,000.
Fix that rate to 20% without changing your ad spend, and it drops to $1,000. Monthly recurring revenue grows when both acquisition rates rise and churn rates fall. The funnel is where unit economics are won or lost.
Map the SaaS Conversion Funnel by Stage
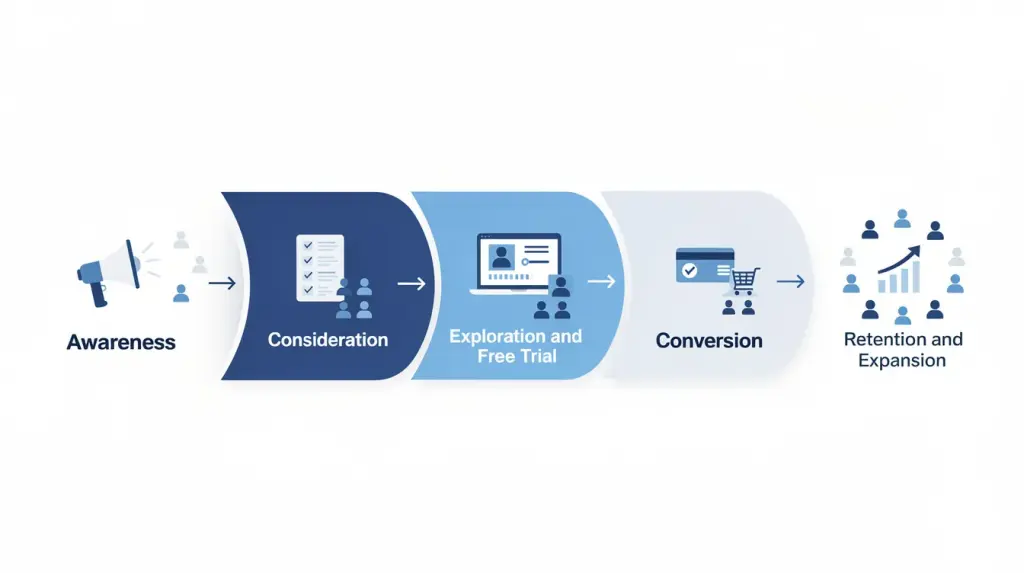
Most SaaS sales funnels use a four-stage model borrowed from traditional marketing. It misses the product exploration stage entirely and treats retention as a byproduct rather than something you actively manage.
The five-stage model below fixes both. It covers the full journey from first touch through expansion, and gives your marketing and sales teams a shared structure to align around at every stage.
Stage 1: Awareness
The awareness stage is where prospective customers discover your SaaS product through search engine optimization, paid ads, content, or word-of-mouth. At this first stage of the funnel, users recognize a problem before they recognize a solution, so your goal is education: address their challenges directly, not selling.
Key channels: SEO, paid ads, social, comparison sites, landing pages
Metrics to track:
- Organic sessions and keyword rankings
- Paid click-through rate and cost per click
- Bounce rate on landing pages
- Branded search volume
FullSession’s heatmaps show where visitors click, scroll, and stop engaging on landing pages, so you know whether your target audience ever reaches your core value proposition.
Stage 2: Consideration
Prospective customers actively evaluate your product against competing SaaS vendors. They review pricing, read case studies, and in B2B SaaS, loop in colleagues. This is where SaaS marketing and sales funnel leaks quietly in most companies. A visitor scrolls halfway down your pricing page and leaves. Google Analytics records the exit; nothing explains it.
Metrics to track:
- Visitor-to-lead conversion rate (B2B SaaS average: 1.5–2.5%)
- Pricing page scroll depth
- Demo request rate
- Time on comparison pages
FullSession’s session replay shows the hesitation patterns: where prospective customers pause, what they re-read, and what they do right before they leave.
Stage 3: Exploration and Free Trial
When users sign up for a free trial, the product either demonstrates value or it doesn’t. No sales team controls this stage. It centers on activation: the first moment a trial user experiences the core value. Until that moment happens, conversion is unlikely regardless of your onboarding emails.
According to Baremetrics, the revenue analytics platform, trial users who complete a critical activation milestone within the first three days are 3–4 times more likely to convert to paid than those who don’t.
Metrics to track:
- Activation rate
- Feature adoption in the first seven days
- Time-to-first-value
- Trial session frequency
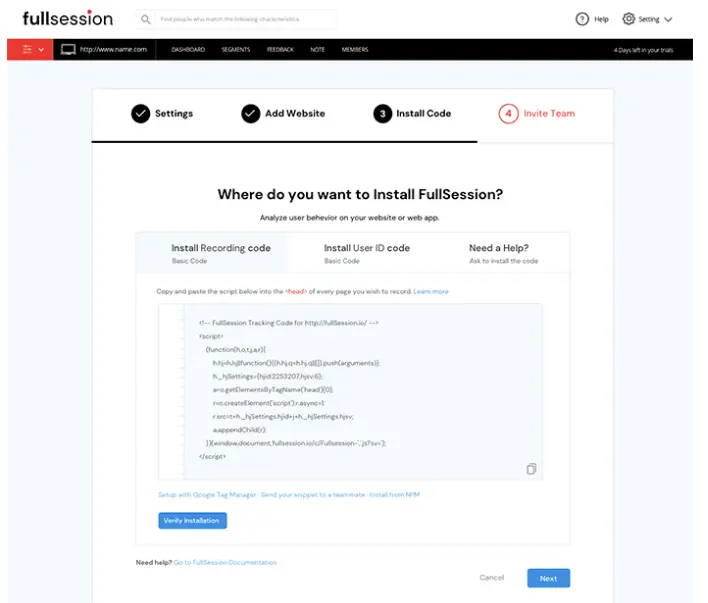
FullSession’s funnel analysis tool maps every onboarding step and shows drop-off at each stage. Click any drop-off step, and the sessions of free users who exited there load instantly.
Stage 4: Conversion
Trial users become paying customers. Everything built in the previous stages (awareness, confidence, product experience) culminates here. Friction at this stage is expensive. A broken upgrade flow or a JavaScript error on the checkout screen can kill a conversion that took weeks and real marketing spend to reach.
Common friction sources at the conversion stage:
| Friction source | Impact | FullSession detection |
| Confusing pricing page | Users can’t choose a plan | Heatmaps and session replay |
| JS errors on upgrade flow | Silent transaction failures | Errors and Alerts |
| Unclear plan comparison | Can’t justify the upgrade to the team | Scroll heatmap |
| Mobile payment issues | Mobile checkout abandonment | Mobile session replay |
According to Artisan Strategies, which analyzed data from over 1,200 SaaS companies, the SQL-to-close rate for B2B SaaS averages 20–25%. Well below that signals a handoff or qualification problem, not a product problem.
Stage 5: Retention and Expansion
The retention stage is where SaaS revenue is made or lost. Customer churn at 5% per month means losing more than half your paying customers in a year. Existing customers who upgrade or expand drive net revenue retention above 100%, which means revenue grows without new customer acquisition.
Existing users who become satisfied customers also drive referrals that no paid ads budget can match. The practical insights from their post-conversion behavior (which features they use, which flows they complete) are as useful for your product roadmap as they are for reducing churn.
Metrics to track:
- Monthly churn rate
- Net Revenue Retention (NRR)
- Feature stickiness (daily/weekly active use)
- NPS and customer satisfaction scores
FullSession’s in-app feedback links every qualitative response to the session replay from that same user, giving your customer success team full behavioral context behind every piece of input.
Key SaaS Funnel Metrics and Conversion Rate Benchmarks
Most SaaS companies track one or two funnel metrics and miss the bottlenecks between them. Data-driven teams measure every stage. Here is where to set your targets.
The SaaS funnel conversion scorecard
| Funnel stage | Key metric | Industry average | Top 10% target |
| Awareness | Visitor-to-lead rate | 1.5–2.5% | 8–15% |
| Consideration | MQL-to-SQL rate | 32–40% | 50–60% |
| Conversion | SQL-to-close rate | 20–25% | 35–40% |
| Trial (opt-in, no credit card) | Trial-to-paid rate | 18.2% | 25–30% |
| Trial (opt-out, credit card required) | Trial-to-paid rate | 48.8% | 55–60% |
| Retention | Monthly churn rate | 3–5% | Under 2% |
Sources: Artisan Strategies, 1,200+ SaaS companies, 2026;First Page Sage, 86 SaaS companies
The gap between average and top-10% visitor-to-lead rates (1.5–2.5% vs. 8–15%) isn’t a traffic problem. It’s a conversion problem at the top of the funnel.
The model choice for trials matters equally: opt-out trials convert at nearly 3x the rate of opt-in trials, but reduce top-of-funnel volume.
Core funnel metrics every SaaS team must track
These SaaS sales funnel metrics apply across all stages, not just trial-to-paid:
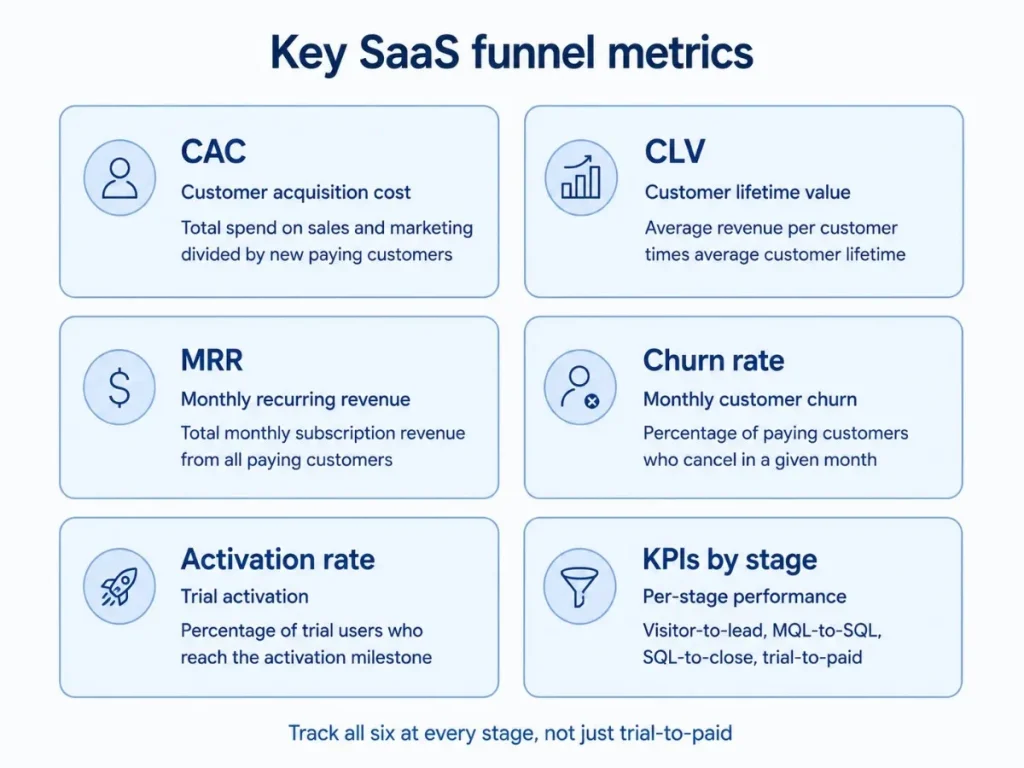
- Customer acquisition cost (CAC): Total sales and marketing spend divided by new paying customers
- Customer lifetime value (CLV): Average revenue per customer multiplied by average customer lifetime
- Monthly recurring revenue (MRR): Total monthly subscription revenue from paying customers
- Churn rate: Percentage of paying customers who cancel per month
- Activation rate: Percentage of trial users who reach the defined activation milestone
- Key performance indicators by stage: Visitor-to-lead, MQL-to-SQL, SQL-to-close, trial-to-paid
Tracking these key metrics in aggregate dashboards isn’t enough. Understanding your target market’s behavior at each stage (what convinces new customers to sign up, what keeps your target audience engaged through the trial) requires session-level data.
Google Analytics shows you traffic and drop-off numbers. It can’t show you why.
How to Measure Funnel Performance with FullSession
Knowing where your benchmarks fall short is step one. Diagnosing why is harder. FullSession, a privacy-first user behavior analytics platform, connects funnel tracking, session replay, heatmaps, in-app feedback, and error monitoring in a single dataset.
You move from “activation dropped on step 3” to watching the exact sessions that explain it, without switching tools.
Funnel tracking: visualize drop-offs at every step
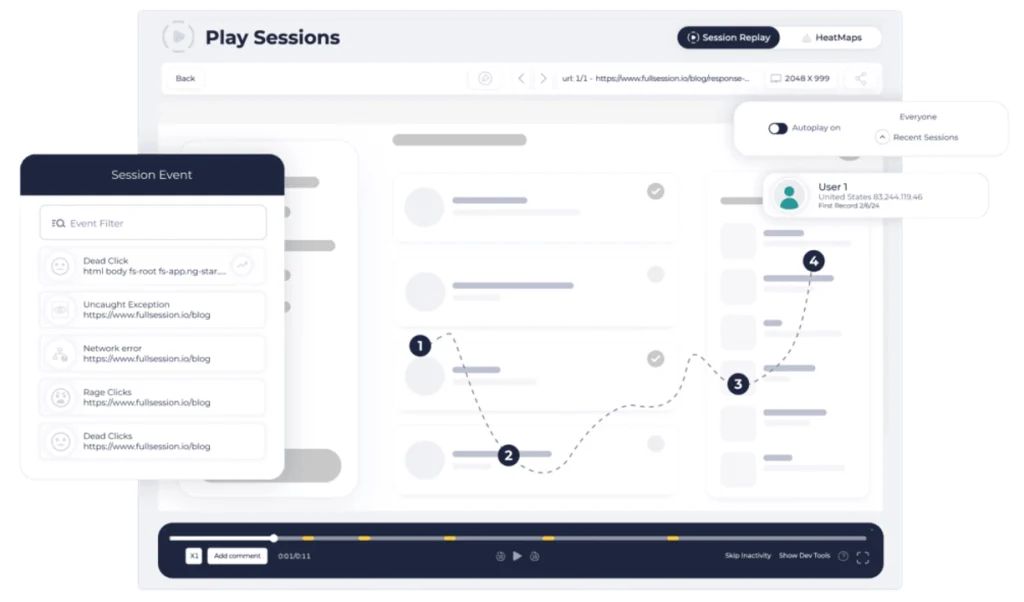
FullSession’s funnels and conversions feature builds multi-step funnels across your website and product without manual tracking code. Every funnel shows completion rates per step, drop-off at each transition, and trend data over time.
Click any drop-off step and FullSession shows the sessions of every user who exited there. You go from seeing that 40% of trial users stalled at “connect your first data source” to watching why, on the same platform, in two clicks.
Session replay: watch the why behind drop-offs
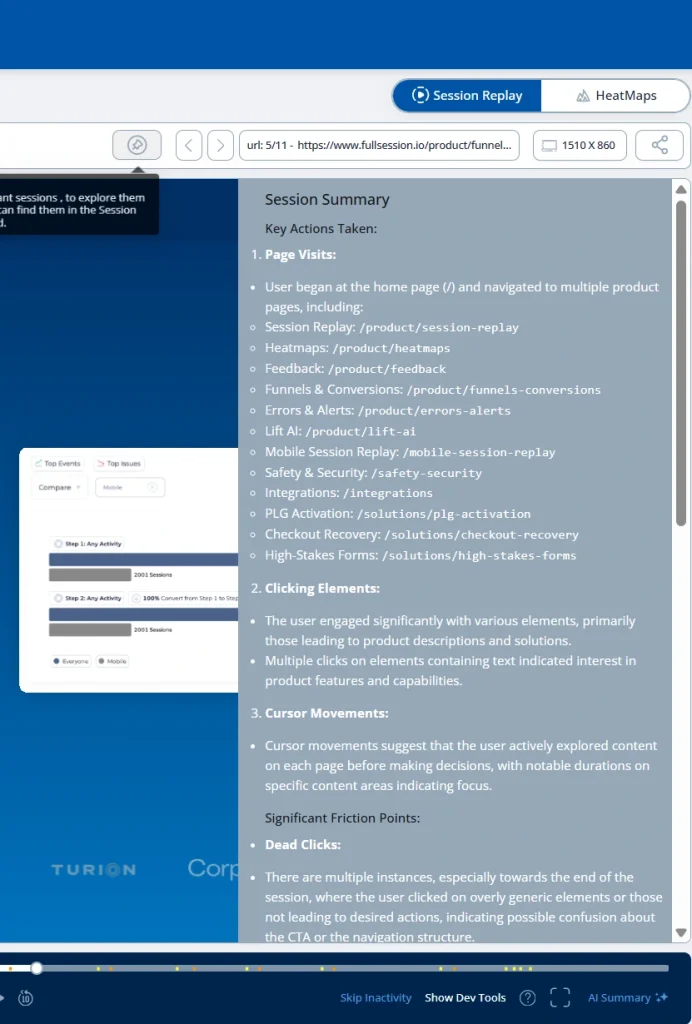
Session replay records mouse movement, clicks, scroll depth, hesitation patterns, and rage clicks as a pixel-perfect reconstruction of what each user experienced. The full guide to how session replay works covers the technical approach.
For SaaS teams, the highest-value use cases are onboarding friction, upgrade hesitation on the pricing page, and error diagnosis. Instead of guessing why users drop off, you watch them do it.
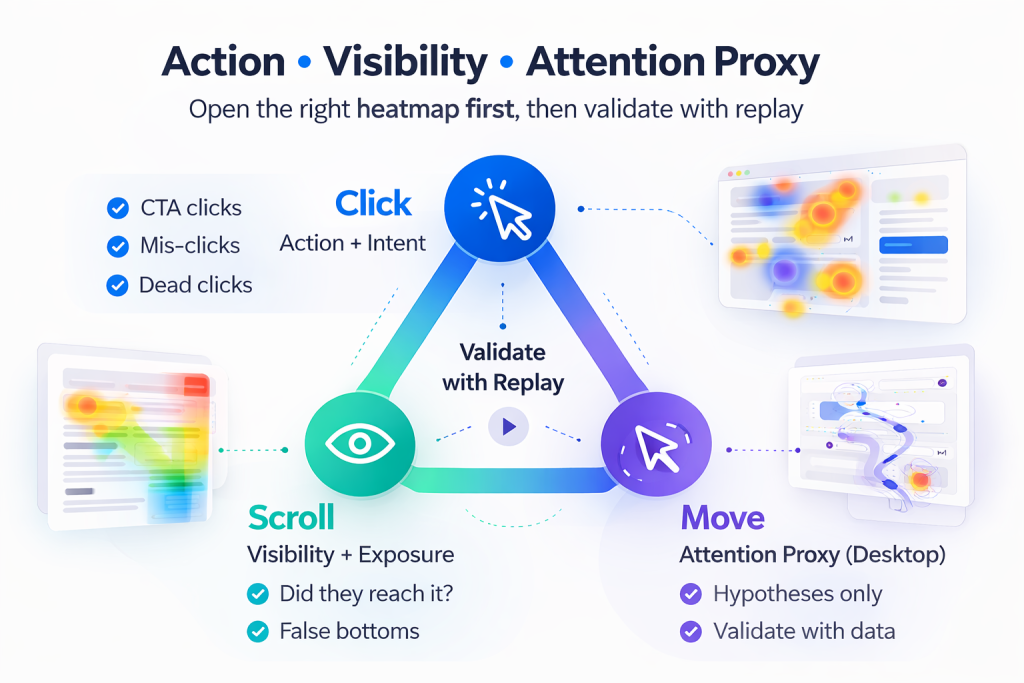
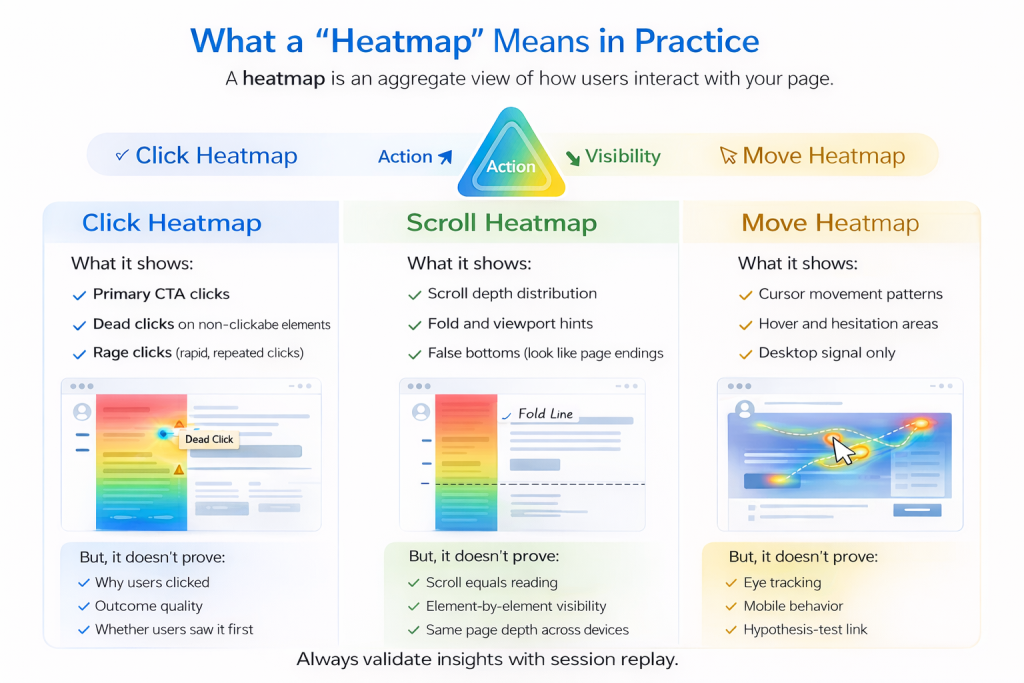
Heatmaps: aggregate behavior across funnel pages
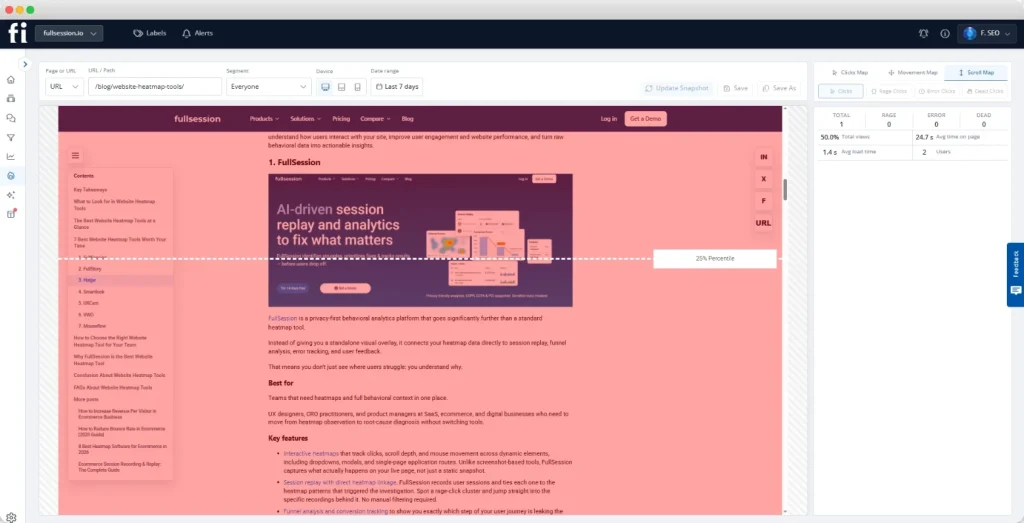
Heatmaps show what thousands of users did in aggregate where session replay shows one user at a time. Using heatmaps for SaaS activation is particularly useful: a scroll heatmap showing 70% of visitors leaving before reaching your plan comparison table is a clear, specific signal, not an aggregate metric surfaces. For the decision framework on when to use each tool, see heatmaps vs session replay.
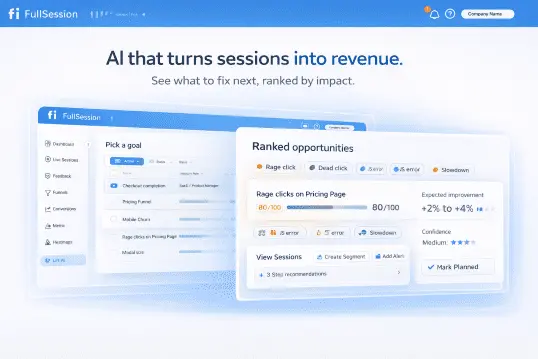
Lift AI: prioritize what to fix next
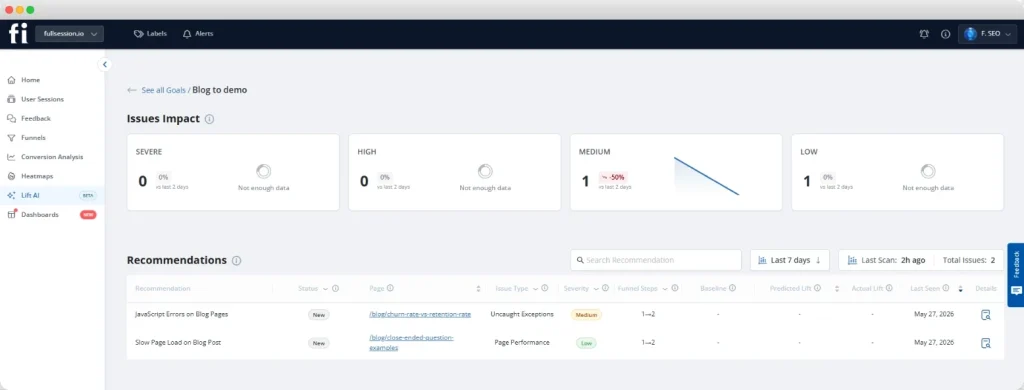
Lift AI scans all behavioral data and shows the issues most likely to affect revenue, ranked by potential impact. Without it, a team with 10,000 sessions per week has no systematic way to prioritize.
With it, you get a ranked list of the highest-impact friction points to act on first. See Lift AI in action when you book a demo: it shows prioritized issues on your real data in the first session.
If you’d rather start with your own data before committing to a call, start a free trial and install FullSession in minutes.
See Exactly Where SaaS Funnels Leak and How to Fix Them
Get a live walkthrough of how FullSession finds and shows drop-offs, friction, and conversion blockers across every funnel stage.
Tests and Tactics to Improve Funnel Performance
Identifying a drop-off isn’t the same as fixing it. Every optimization needs a hypothesis, a test, and a measurement of impact.
A/B testing: a structured process for SaaS funnels
Focus your tests on absolute drop-off volume, not the worst percentage rate. The step with the most users exiting, even at a “normal” rate, produces the highest impact when improved.
| Step | Action |
| 1. Find the leak | Identify the funnel step with the largest absolute drop-off |
| 2. Watch the sessions | Review 10–20 session replays of users who exited at that step |
| 3. Form one hypothesis | “We believe [change] will [outcome] because [replay evidence]” |
| 4. Build one variant | No multi-variable tests: isolate the change |
| 5. Run to significance | Minimum 100 conversions per variant |
| 6. Measure downstream | Check impact on the full funnel, not just the tested step |
For SaaS onboarding, the highest-return tests are signup form simplification, onboarding checklist reordering, and the trial-end upgrade prompt copy.
Optimize the trial-to-paid activation moment
Trial conversion is the most leverage-rich SaaS funnel metric. Map the minimum product interactions required to reach the activation moment, then remove everything that isn’t essential to getting there.
Use FullSession’s funnel tracking inside your product to identify which onboarding steps converting users complete versus the steps trial users skip before churning.
Tactics that consistently improve trial conversion:
- Behavior-triggered onboarding emails (not day-based timing)
- Contextual in-app prompts at activation steps
- Progress indicators showing how close trial users are to full value
- Proactive outreach to users who complete early steps but stall before activation
Reduce time-to-value
Time-to-value is the gap between signup and first experiencing core product value. Every extra day reduces conversion probability.
Watch session replays filtered to trial users who spent more than five minutes on a single onboarding step without progressing. Those sessions show the exact friction silently killing your trial conversion rate.
The PLG activation solution from FullSession is built for product-led growth teams who need to see where signups stall, activation drops, and early churn begins across the full product journey.
Start Seeing Your Onboarding Drop-Offs in Under an Hour
No call needed. Install FullSession, run it on your product, and get your first funnel insights within the hour.
Reduce Friction in User Behavior Flows
Some of the most damaging friction is invisible to standard analytics. Broken interactions, silent JavaScript errors, and confusing UI patterns quietly drain conversion rates without appearing in any funnel dashboard.
Detect and fix silent technical failures
What to look for:
- Rage clicks: Rapid repeated clicks on a non-responding element signal user frustration. Common on CTA buttons, form fields, and navigation.
- JavaScript errors: Client-side failures that block transactions never appear in server-side error logs. They affect real users silently.
- Broken flows: Steps that appear functional in QA but fail intermittently under real traffic conditions.
Here’s a practical scenario. A JavaScript error fires on the “upgrade plan” button only on mobile Safari. It affects 8% of upgrade attempts. Nobody knows it exists because it fires client-side. FullSession’s errors and alerts flags it with the full session replay and console log attached.
Collect qualitative feedback at exit points
Quantitative data shows where users exit. Qualitative feedback explains why. Effective questions to place at key exit points:
- Trial end (non-converted): “What was the main reason you didn’t upgrade today?”
- Cancellation flow: “What could we have done differently to keep you?”
- Failed activation step: “Did anything make this step confusing?”
- Pricing page exit: “What information was missing from this page?”
FullSession’s feedback feature links every response to the session replay from that same user, giving your team both the written reason and the full behavioral context behind it.
Optimize Marketing Strategy for Sustainable Growth

A high-converting SaaS funnel requires the marketing team and sales team to operate from shared definitions. Misalignment on what constitutes an MQL, or when a lead becomes SQL-ready, is one of the most silent causes of underperformance in B2B SaaS.
Align sales and marketing on stage definitions
The most common source of sales and marketing funnel dysfunction is definitional. Marketing counts MQLs one way; the sales team qualifies differently; nobody notices until a pipeline review shows a volume-to-revenue mismatch.
What to align before the quarter begins:
- MQL criteria: specific behaviors observed (pages visited, pricing page views, content downloads), not just demographic fit
- SQL criteria: a minimum qualification signal beyond submitting a demo form
- Handoff SLA: how quickly the sales team follows up after an MQL becomes SQL-ready
Better-qualified handoffs mean a shorter selling process, a better customer experience, and more customers who reach activation faster because they were the right fit from the start.
Invest in channel quality, not just volume
Not all traffic behaves the same in the SaaS conversion funnel. Organic traffic driven by search engine optimization converts at higher rates than paid traffic because it arrives with higher intent.
Channel performance principles for SaaS:
- Digital marketing teams that overweight paid ads for volume while underinvesting in content often see acquisition cost stay high even as traffic grows
- Retargeting campaigns consistently outperform cold acquisition: visitors who viewed your product pages have already demonstrated intent
- Revenue growth in SaaS is primarily a function of a better selling process, not more traffic. A 1-point improvement in visitor-to-lead rate often generates more incremental MRR than a 20% increase in ad spend
- A defined sales funnel strategy, where each channel feeds a specific stage, produces more sustainable business growth than volume-first acquisition
Combine quantitative funnel metrics with user feedback from FullSession’s in-app surveys to keep your channel strategy grounded in what your actual target audience responds to, not just what your dashboards report.
The marketing and growth analytics solution in FullSession shows why visitors don’t convert, where funnel leaks are costing the most, and which work to prioritize by revenue impact.
30/60/90 Day SaaS Conversion Funnel Optimization Checklist
The gap between understanding a funnel problem and fixing it is almost always an execution problem. This checklist turns the analysis from this article into a time-bound action plan.
Days 1–30: Measure and baseline
- Install FullSession and define funnel steps for each stage (landing pages, signup, onboarding milestones, upgrade paths)
- Fill in the SaaS Funnel Conversion Scorecard with your own rates at each stage
- Run session replays on the top three drop-off pages, minimum 20 sessions per page
- Review Lift AI’s initial prioritization queue and identify the top three flagged issues
- Run heatmaps on your pricing and primary landing pages; document scroll depth and click patterns
- Deploy a three-question exit survey to churned trial users via FullSession’s in-app feedback
Days 31–60: Diagnose and test
- Identify the two funnel stages furthest from the Scorecard benchmarks
- Launch one A/B test on the page with the largest absolute drop-off, with a hypothesis formed from session replay observations
- Map activation paths: which onboarding steps do converting users complete that churning users skip?
- Act on the top-three Lift AI flagged issues
- Align the marketing team and sales team on MQL-to-SQL definitions and document the agreed criteria
- Run error tracking checks on all conversion-critical flows (signup, onboarding, upgrade, checkout)
Days 61–90: Optimize and scale
- Ship fixes validated by A/B tests and session replay analysis
- Streamline the onboarding flow based on activation milestone data and remove non-essential steps
- Set a monthly funnel review cadence with the Scorecard as the standing agenda
- Expand error tracking to cover all post-launch product changes automatically
- Add retention-stage feedback widgets at trial end and cancellation, linked to session replays
- Measure all changes against the baselines established in days 1–30
Why FullSession Solves the SaaS Funnel Problem
SaaS teams face funnel problems that general-purpose SaaS analytics tools aren’t built to solve: why trial users stall before activation, what breaks silently on the upgrade flow, which friction points are costing the most revenue, and how to act on all of it without a full analytics team.
FullSession addresses each of those directly.
- One platform from drop-off to diagnosis. The moment you see a conversion drop in your funnel, you click that step and watch the sessions of users who left there. No data export, no tool-switching, no joining tables. Your team fixes problems in days rather than weeks.
- Behavioral data across the entire SaaS customer journey. From the landing pages where potential customers first arrive to the in-app flows where existing users hit friction, FullSession captures the complete picture: user behavior before the signup, inside the trial, and throughout the paid product.
- AI-prioritized revenue impact for small teams. Most SaaS teams don’t have the capacity to review thousands of sessions manually. Lift AI scans all behavioral data and shows the issues most likely to affect revenue, ranked. Your team focuses on what matters most, not what appeared most recently.
- Feedback that flags churn before it happens. In-app feedback linked directly to session replays gives your customer success team the behavioral context behind every “why did you cancel?” response. You can distinguish product gaps from onboarding failures from pricing objections, and fix the right one.
- Built for SaaS security requirements. Privacy-first by design: GDPR and CCPA compliance, automatic PII masking, and enterprise-grade data security and compliance standards built in. Enterprise SaaS buyers evaluating SaaS vendors in regulated industries can review the full documentation before committing.
Most SaaS teams already know their funnel has a problem. The gap is between seeing a drop-off number and understanding what caused it.
FullSession closes that gap by connecting funnel data, session replays, heatmaps, and in-app feedback in one place so your team can stop guessing and start fixing.
Whether you’re trying to improve trial activation, reduce churn, or understand why your upgrade flow is underperforming, the answer is in your users’ behavior. FullSession makes that behavior visible.
Start for free and see your first funnel insights within the hour. No credit card required.
Conclusion About SaaS Conversion Funnel
A SaaS conversion funnel only improves when your team can see behavioral data at every stage: not just the aggregate numbers, but the user behavior that explains them.
The five stages, the Conversion Scorecard benchmarks, and the 30/60/90 day checklist give you the framework. What turns it into revenue is having the right data to act on at each step.
See Where Your SaaS Funnel Is Leaking
Get a live walkthrough of how FullSession surfaces drop-offs, friction, and conversion blockers across every funnel stage.
FAQs About SaaS Conversion Funnel
What is a SaaS conversion funnel?
A SaaS conversion funnel is the sequence of stages a prospect moves through from first awareness to becoming a paying, retained customer.
It includes awareness, consideration, free trial, conversion, and retention. Unlike a typical sales funnel, it extends past the first purchase because subscription revenue depends on ongoing renewals.
What are typical SaaS conversion rates at each funnel stage?
According to Artisan Strategies, B2B SaaS visitor-to-lead rates average 1.5–2.5%, MQL-to-SQL rates average 32–40%, and SQL-to-close rates average 20–25%.
First Page Sage data shows opt-in trials convert at 18.2% on average and opt-out trials at 48.8%. Top performers reach visitor-to-lead rates of 8–15%.
How do I improve my free trial to paid conversion rate?
Identify your activation milestone: the first moment a trial user experiences core value, and shorten the path to it.
Map which onboarding steps converting users complete versus those churning users skip, then remove friction on that path.
What metrics should I track in my SaaS sales funnel stages?
Track visitor-to-lead, MQL-to-SQL, SQL-to-close, and trial-to-paid rates at every stage.
Add activation rate, monthly churn rate, customer acquisition cost, customer lifetime value, and monthly recurring revenue. Most SaaS companies track only one or two and miss the bottlenecks between them.
How is a SaaS funnel different from a traditional sales funnel?
A traditional sales funnel ends at purchase. A SaaS funnel continues into retention because revenue is recurring.
SaaS also adds a product exploration stage, the free trial, where users self-evaluate before paying. That self-directed stage, and the activation milestone within it, has no equivalent in a non-subscription selling process.

Roman Mohren is CEO of FullSession, a privacy-first UX analytics platform offering session replay, interactive heatmaps, conversion funnels, error insights, and in-app feedback. He directly leads Product, Sales, and Customer Success, owning the full customer journey from first touch to long-term outcomes. With 25+ years in B2B SaaS, spanning venture- and PE-backed startups, public software companies, and his own ventures, Roman has built and scaled revenue teams, designed go-to-market systems, and led organizations through every growth stage from first dollar to eight-figure ARR. He writes from hands-on operator experience about UX diagnosis, conversion optimization, user onboarding, and turning behavioral data into measurable business impact.


![5 Best Mixpanel Alternatives for 2026 [Compared & Reviewed]](https://www.fullsession.io/wp-content/uploads/2026/04/best-mixpanel-alternatives-2026-compared-and-reviewed.webp)