
You’ve perfected your branding, optimized your conversion funnel, and polished your website until it’s a shiny reflection of your brand’s mission, vision, and quality. Now what?
The next logical step is to determine if your strategies are working, and one way to do that is to measure customer experience.
Customer experience is the impression of your buyers throughout the customer journey, the culmination of their feelings, perceptions, and experiences with your brand. While customer experience is highly subjective, you can measure its aspects into quantifiable metrics.
In this article, we’ll review the top customer experience metrics, how to measure customer experience, and what role web analytics plays.
What is Customer Experience?
Customer experience (CX) is the sum of all interactions a buyer has with your brand throughout the customer journey, from the initial website visit to the post-purchase follow-up.
From a narrower point of view, CX is an effective indicator of how likely the customer is to make repeat purchases and recommend your brand to others.
So, how do you gauge the effectiveness of your customer experience?
11 Key Customer Experience Metrics
Measuring customer experience is the best way to see if current business strategies are working as well as they should. Are your buyers getting what they need from your brand? Does your website need more work? Are there weak points in the customer journey?
Eliminate the guesswork and use CX metrics instead. Here are the most important metrics for customer experience analysis:
1. Customer Satisfaction Score
Customer satisfaction stands as the bedrock of customer experience metrics. The customer satisfaction score (CSAT) is the direct pulse check on how customers feel about a specific interaction or overall experience with your brand, essentially a measure of satisfied customers.
Customer satisfaction is typically measured through survey questions like, “How satisfied were you with your experience?” and responses on a scale (e.g., 1-5 or 1-10), which offers immediate feedback.
It’s the go-to metric for gauging short-term satisfaction post-interaction as it allows businesses to identify strengths and areas for improvement quickly.
How to calculate CSAT: Add up the number of 4 and 5 ratings, divide by the total number of responses, and multiply by 100.
2. Net Promoter Score (NPS)
NPS measures customer loyalty and the likelihood of word-of-mouth promotion. By asking customers how likely they are to recommend your brand to others on a scale of 0 to 10, NPS categorizes them into Promoters (9-10), Passives (7-8), and Detractors (0-6).
- Promoters (score 9-10): Loyal customers who are likely to refer others and fuel growth.
- Passives (score 7-8): Satisfied but unenthusiastic customers who are vulnerable to competitive offerings.
- Detractors (score 0-6): Unhappy customers who can hurt your brand through negative word-of-mouth.
This simple yet powerful metric goes beyond surface-level satisfaction, diving into customers’ emotional connection and loyalty towards your brand.
A high NPS is a strong indicator of customer loyalty and future business growth, as it reflects overall satisfaction and the willingness of customers to become brand ambassadors.
How to calculate NPS: Subtract the percentage of Detractors (0-6 ratings) from the percentage of Promoters (9-10 ratings).
3. Customer Effort Score
Customer effort score reveals the ease of customer interactions with your brand. It asks customers to rate the effort they had to exert to resolve their issue, complete a purchase, or achieve their goal.
The principle behind the Customer Effort Score is that the less effort required, the more satisfied and loyal a customer is likely to be. High effort can lead to frustration and increased customer churn, making CES a very important metric for identifying friction points in the customer journey.
How to calculate CES: Add up all the individual customer effort ratings and divide by the total number of responses to get the average score.
4. Churn Rate
The customer churn rate provides a stark but important measure of how many customers you lose over a specific period.
High churn rates can signal deep-seated issues with customer satisfaction, product-market fit, or competitive positioning. Monitoring can help you identify trends, understand the impact of changes or improvements on lost customers, and gauge long-term customer loyalty and satisfaction.
How to calculate Churn Rate: Subtract the number of customers at the end of the period from the number of customers at the beginning, divide by the number of customers at the beginning, and multiply by 100.

5. Customer Retention Rate
Customer retention rate (CRR) measures how well a company keeps its customers over a specific period. A high retention rate means customers are happy and loyal, indicating they’re likely to stick around and continue doing business.
Needless to say, every business needs to focus on customer retention for long-term success. Loyal customers provide steady revenue, cost less to retain than acquire new customers, and often refer others, driving business growth.
How to calculate CRR: Subtract the number of new customers acquired during the period from the number of customers at the end, divide by the number of customers at the beginning, and multiply by 100.
6. First Response Time
First response time (FRT) measures the speed at which your team responds to customer inquiries or service requests. This metric should never be ignored because the initial response to a customer’s concern can set the tone for the interaction.
A swift first response is often seen as a sign of a company that values its customers and is eager to resolve their issues. In today’s fast-paced world, customers expect quick acknowledgments and a delayed response can lead to frustration and diminished satisfaction, even if the eventual resolution is favorable.
Generally, an FRT of 24 hours or less is the standard for most businesses.
How to calculate FRT: Subtract the time of the customer’s initial inquiry from the time of the first response by the support team, then average this time across all inquiries.
7. First Contact Resolution
First contact resolution (FCR) measures how often customer issues get completely resolved during the first interaction with support. Unlike first response time, which only looks at how fast a rep replies initially, FCR is all about solving the problem right away.
A high FCR rate means customers don’t have to keep coming back with the same issue, which makes them happier and more loyal.
Getting a good FCR should be a priority because it saves customers from the hassle of follow-ups and repeated explanations. This way, customer issues are handled quickly and effectively, which can help lead to exceptional customer experiences.
How to calculate FCR: Divide the number of customer issues resolved on the first contact by the total number of issues, then multiply by 100.
8. Average Resolution Time
Average resolution time takes the concept of response time further by measuring how long it takes to fully resolve a customer’s issue from the moment it’s reported.
This customer experience metric sheds light on the efficiency and effectiveness of your customer support team. It reflects not just the speed of service but also the quality, as faster resolution times are often indicative of a more efficient problem-solving process.
However, it’s important to balance speed with thoroughness; the goal is to resolve issues effectively, not just quickly. Monitoring average resolution time helps businesses identify bottlenecks in their support process and opportunities for training or resource allocation to improve overall customer satisfaction.
How to calculate ART: Add up the total time taken to resolve all customer issues, then divide by the number of resolved issues.
9. Customer Lifetime Value
Customer lifetime value (CLV) is the total revenue a business generates from a single customer throughout its relationship with the company.
CLV helps you understand the long-term value of maintaining positive customer experiences. It goes beyond transactional analysis to evaluate the overall worth of a customer. The customer lifespan value also takes into account repeat purchases, loyalty, and the potential for brand advocacy.
By increasing CLV, you can justify the investment in customer experience improvements and loyalty programs. Understanding CLV also allows for more targeted marketing and retention efforts, focusing resources on high-value customers or identifying strategies to maximize the value of others.
How to calculate CLV: Multiply the average purchase value by the average purchase frequency rate, then multiply by the average customer lifespan.
10. Customer Referral Rate
Customer referral rate shows how often your current customers recommend your business to others. It’s a clear sign of how happy and loyal they are, indicating they’re pleased enough with their experience to share it with friends, family, and colleagues.
A high referral rate means customers trust and value your products or services—so much so that they become your brand ambassadors.
How to calculate Customer Referral Rate: Divide the number of customers who referred others by the total number of customers, then multiply by 100.
11. Visitor Intent
Looking at visitor intent aims to understand why people are coming to your website. Are they looking for information, ready to make a purchase, comparing products, or needing customer support? Knowing the reason behind their visit helps you tailor your content and design to meet their needs.
Figuring out visitor intent can up customer engagement and conversion rates. Plus, when you address their specific intents, you can create more targeted content, improve the user experience, and achieve better results in terms of customer satisfaction and business success.
How to gauge Visitor Intent: Analyze website analytics, conduct user surveys, monitor search queries, and observe user behavior patterns to understand why visitors come to your site.
How to Measure Customer Experience Accurately
A well-planned approach is a must if you want to measure customer experience accurately and precisely. It sounds complicated, but don’t worry, we have a few expert tips to help you get started:
Integrate Feedback Across All Touchpoints
You can employ a unified system that consolidates feedback across all channels. This could involve integrating customer feedback tools with your website or customer support software.
Doing this will help you identify patterns and pinpoint areas for improvement that might be missed when viewing channels in isolation.
Leverage Technology
Advanced tech is a boon for capturing, analyzing, and acting upon customer experience data. CRM systems, for instance, can track customer interactions and transactions, providing a rich dataset for understanding customer behavior and preferences.
Similarly, analytics platforms can sift through large volumes of data to identify trends, customer sentiments, and areas of friction within the customer journey. More on this later.
Act on the Data
Collecting and analyzing data is only the first step. The real value comes from using these insights to drive action. This means not only addressing immediate issues but also implementing strategic changes based on customer feedback and behavior trends.
For example, if data reveals a common point of friction in the customer journey, you should look to simplify this process or provide additional support to customers at this stage.
Acting on data also involves closing the feedback loop with customers, including informing them about the changes made based on their feedback, which can enhance customer satisfaction and loyalty.
Showing your customers that their feedback matters helps you foster a more genuine relationship with them.
Keep It Continuous
Perhaps the most important aspect of measuring customer experience accurately is recognizing that it is a continuous, cyclical process. Customer expectations and market dynamics evolve, and what satisfies customers today may not suffice tomorrow.
Continuous measurement allows businesses to stay ahead of these changes, adapting their strategies and offerings to meet and exceed customer expectations.
This ongoing process involves regularly updating measurement tools and metrics, soliciting continuous feedback, and staying agile enough to respond to new insights. It also means fostering a culture that values customer feedback and sees CX improvement as a shared goal across the organization.
Web Analytics and Customer Experience
Now you know the key metrics to track and best practices to use in your approach. But what tools can you use for customer journey analytics?

This is where web analytics tools like FullSession come in. Here’s a closer look at the various ways web analytics contributes to improving CX:
Understanding Customer Behavior
Web optimization tools track various metrics, such as page views, session duration, bounce rates, and paths through a site. By analyzing this data, you can gain a deep understanding of how customers engage with your online presence.
For instance, high bounce rates on specific pages might indicate that the content is not meeting users’ expectations, or a common exit point on a purchase path could signal a frustrating checkout process.
Example: An e-commerce website uses web analytics to discover that a significant number of users spend a lot of time on product comparison pages but do not proceed to checkout.
This insight leads to the introduction of a feature that simplifies product comparisons and highlights key benefits, resulting in increased conversion rates.
Personalization and Targeting
One of the keys to delivering an exceptional user experience is personalization. Web analytics allows businesses to segment their audience based on behavior, demographics, and other criteria, giving them more personalized content, recommendations, and offers.
Example: A streaming service uses web analytics to segment its audience based on viewing habits and genre preferences. It then personalizes its homepage for each user segment, showcasing relevant content at the top.
This strategy increases user engagement and time spent on the platform as viewers find content that interests them more quickly.
Identifying Pain Points and Opportunities for Improvement
Web analytics can highlight areas of a website or app that are underperforming or causing friction for users, making it easier for designers and developers to address issues before they turn away more customers.
Example: A software company notices through web analytics that there’s a high drop-off rate on the pricing page of their website.
Further investigation reveals that users find the pricing options confusing. In response, the company simplifies the pricing structure and adds a FAQ section directly on the pricing page, which leads to a decrease in bounce rates and an increase in sign-ups.
Measuring the Impact of Changes
Web analytics serve as a must-have tool for measuring the impact of recent CX improvements. This empirical approach makes sure that decisions are data-driven, reducing the risk of implementing changes that don’t positively affect the customer experience.
Example: After receiving feedback that the checkout process is too lengthy, an online retailer uses A/B testing to compare the original checkout process with a new, more efficient version.
Web analytics show that the streamlined version has higher completion and lower abandonment rates, confirming that the new method provides a better customer experience.
Predictive Analysis and Strategic Planning
Advanced web analytics, incorporating AI and machine learning, can predict future customer behavior based on historical data. With this predictive capability, businesses can better anticipate customer needs, preferences, and potential issues before they arise, allowing for strategic planning and proactive CX improvements.
Example: A travel agency uses web analytics to track seasonal trends in destination searches and bookings. Predictive analytics indicate a growing interest in certain destinations during specific times of the year. The agency proactively creates targeted marketing campaigns and special offers for those destinations, leading to early bookings and increased revenue.
Improve Customer Experience with FullSession
Optimize your customer experience strategy with FullSession, an all-in-one tool that shows you all the data you need to improve customer satisfaction and reduce churning. With FullSession, you gain access to:
- Session recordings and replay: See how your customers navigate your website in real-time. Replay sessions to conduct CX analysis and pinpoint potential issues.
- Interactive heat maps: Analyze summaries of your clicks, scrolls, and other web interactions with FullSession’s heat maps to identify which items get the most attention and which ones do not.
- Market segmentation: Use FullSession’s filtering and segmentation tools to see how different groups in your target market interact with your content.
- Customer feedback integration: Gain instant customer sentiment from happy or unhappy customers through FullSession’s website feedback forms.
Stop the guesswork and get into the real customer data. Sign up for a free trial today!
FullSession Pricing Plans
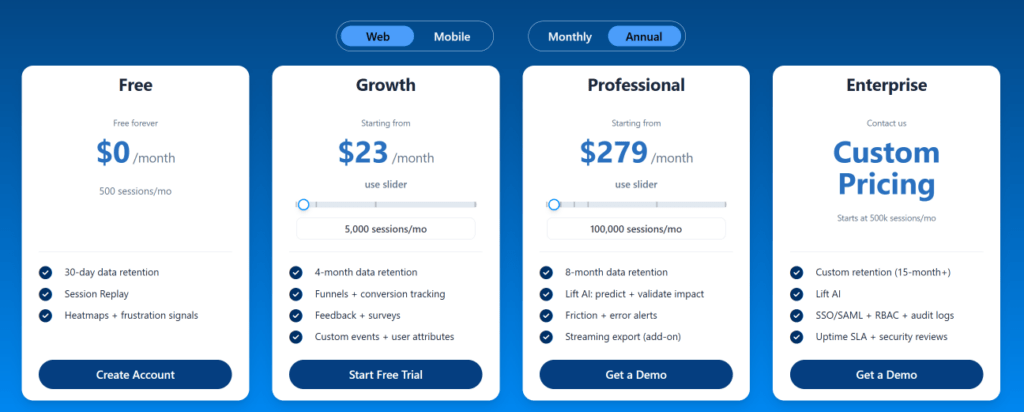
Here are more details on each plan.
- The Starter plan costs $39/month or $32/year and allows you to monitor up to 5,000 monthly sessions with up to 6 months of data storage.
- The Business plan costs $75/month or $60/year and helps you to track and analyze up to 100,000 monthly sessions with up to 12 months of data storage.
- The Enterprise plan has custom pricing and offers customizable sessions plus full access to all features.
Install Your First Website Feedback Form Right Now
It takes less than 5 minutes to set up your first website or app feedback form, withFullSession, and it’s completely free!
FAQs About Measuring Customer Experience
How often should I measure customer experience?
Continuously. Think of it as keeping your finger on the pulse of your customer satisfaction. Regular monitoring helps you catch and address issues before they escalate.
Can small businesses measure CX without breaking the bank?
Absolutely! Many tools and strategies are scalable and can be tailored to fit smaller budgets. Focus on key metrics and leverage affordable, high-value tools like FullSession.
Is NPS really that important?
Yes, because it gives you a direct line to understanding your customer’s loyalty, which is a strong predictor of business growth. However, it should be used with other metrics for a complete picture.
Mohamed oversees operations and finance at FullSession and has contributed to the company’s UX analytics knowledge base.