Most ecommerce brands are solving the wrong problem. They spend more on traffic, while the visitors they already have leave without buying. Ecommerce conversion rate optimization is how you fix that.
Ecommerce conversion rate optimization is the practice of increasing the percentage of website visitors who complete a desired action on your online store, most commonly a purchase. It combines data analysis, UX design, user behavior insights, and structured testing to identify friction points, reduce drop-off, and lift conversion performance.
For most retailers, CRO is one of the highest-leverage growth levers available: instead of spending more to acquire new traffic, you get more value from the visitors you already have.
This guide covers the commerce conversion rate optimization: how to calculate your rate, which metrics to track, how to analyze user behavior, what to fix on product pages and at checkout, how to build a repeatable process, and how to report results to stakeholders.
Key Takeaway
- Conversion rate optimization (CRO) focuses on improving what happens after visitors arrive, not just how many you attract. More traffic without better conversion means higher costs for the same results.
- Use conversion rate formula to evaluate your results: (Conversions ÷ Total Visitors) × 100. Track it at every funnel stage, not just at purchase.
- A good ecommerce conversion rate depends on your category, device mix, traffic sources, price point, and target market. Use ecommerce CRO audit and industry benchmarks as directional context, but always measure against your own historical baseline before setting targets.
- Session replay, heatmaps, and funnel tracking reveal why visitors drop off, not just where. Behavioral data is what turns a leaking funnel metric into a fixable problem.
- A repeatable six-step loop, measure, find friction, prioritize, fix, validate, and report, is what makes CRO compound over time rather than delivering one-off gains.
FullSession brings every layer of this process into one platform: session replay, heatmaps, funnel tracking, user feedback, and error monitoring, built specifically for ecommerce teams. Instead of stitching together multiple tools, you get a single workflow for diagnosing friction, running tests, and reporting lift.
What is Ecommerce Conversion Rate Optimization?

Image source: Pexels
Ecommerce conversion rate optimization is the process of increasing the share of site visitors who complete a purchase or other desired action, without increasing acquisition costs. A conversion is any action you define as valuable: a completed order, an add-to-cart event, an email signup, or a product page view, depending on the funnel stage.
Most stores invest heavily in driving potential customers in, then lose them before checkout. Ecommerce CRO closes that gap with behavioral data and structured testing rather than guesswork, turning more site visitors into actual customers without increasing acquisition spend.
Every percentage point recovered from bounce rates, cart abandonment, or checkout drop-off can create more value from existing traffic before costs, refunds, fulfillment, and margins are considered.
How to Calculate Your Ecommerce Conversion Rate
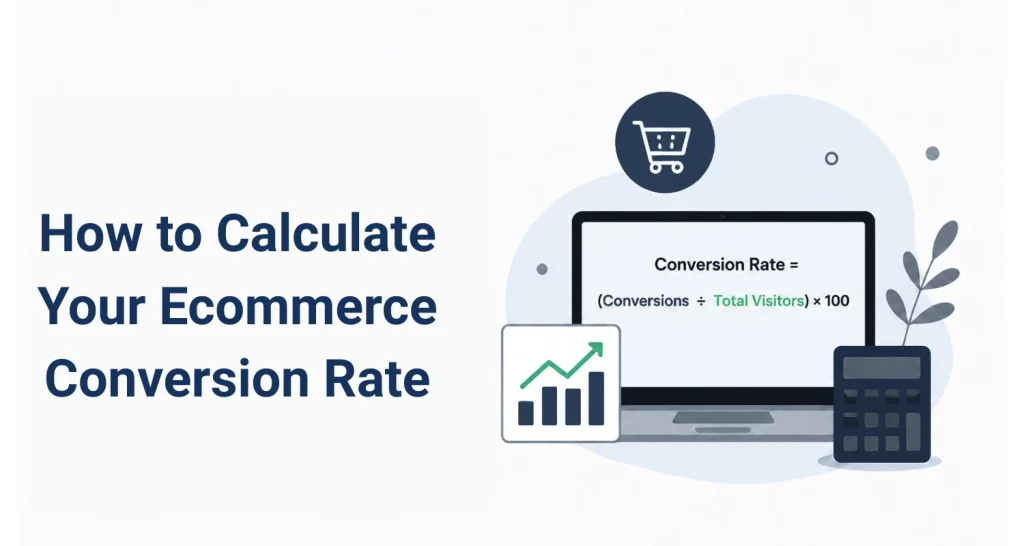
Divide conversions by total visitors, then multiply by 100.
Conversion Rate = (Conversions ÷ Total Visitors) × 100
Example: 800 purchases from 40,000 website visitors = (800 ÷ 40,000) × 100 = 2%.
You can calculate the conversion rate for any funnel action: purchases, add-to-cart events, checkout initiations, or signups. Tracking multiple points tells you where your funnel performs well and where it doesn’t.
For a full breakdown, see our guide on how to calculate conversion rate.
Which Conversion Metrics to Track for Your Online Store
Your overall conversion rate tells you how the store is performing. The conversion metrics below tell you where it is breaking down. Tracking each stage separately is what turns a single number into an actionable diagnosis.
- Overall conversion rate: The share of all site visitors who purchase. Your primary baseline for all CRO activity.
- Add-to-cart rate: Share of product page visitors who add to cart. A persistently low rate may indicate a page, pricing, or trust issue.
- Checkout initiation rate: Share of shoppers who start checkout after adding to cart. Drop-off here usually signals cart friction.
- Cart abandonment rate: Share who add to cart but don’t purchase. According to the Baymard Institute, this averages around 70% across 50 studies.
- Average order value: Revenue per completed transaction. Track alongside conversion rate to measure full CRO impact.
- Bounce rates by page type: Share of visitors who leave after one page. High rates on product pages or landing pages often signal a relevance or experience mismatch.
- Page speed and load time: Slow-loading pages reduce conversions, particularly on mobile. Track as one of your key performance indicators.
- Mobile vs. desktop split: Mobile and desktop users convert at different rates. Tracking them separately shows where mobile friction is highest.
No single metric tells the full story. Together, they give you a map of where your funnel is losing revenue and which problems are worth fixing first.
How to Analyze User Behavior to Find Friction
Benchmarks vary significantly by source, methodology, and category. IRP Commerce reported an overall average Conversion metrics show where your funnel leaks. They don’t show why. Analyzing user behavior is how you get from a number to a fix.
Your analytics will tell you 62% of users who reach checkout don’t complete a purchase. It won’t tell you whether a mandatory account creation field stops them at the first step, whether your payment button is off-screen on a phone, or whether a JavaScript error breaks the form on Safari.
That is why behavioral data matters: it connects user behavior to the specific friction points behind the drop-off.
Behavioral data closes that gap.
- Session replay lets you watch real sessions: where users hesitated, what they rage-clicked, how far they scrolled, and when they left.
- Heatmaps show aggregate attention across hundreds of sessions. A heatmap might reveal that visitors spend more time on your returns policy than on your add-to-cart button.
- Conversion funnel analysis shows exactly how many visitors move between each stage and where the largest drop-offs occur. Segmenting by device, traffic source, or user type turns a funnel metric into a specific, addressable problem.
- Error tracking catches JavaScript failures, broken API calls, and payment errors that never surface in standard analytics. Each error links directly to the session replay where it occurred, so you can see exactly what the user experienced.
- User feedback widgets capture direct signals at the point of frustration. A short survey after a checkout exit gives qualitative context that click data can’t. Linking that feedback to the session replay for the same visit turns a text response into a full diagnostic.
Together, these tools connect conversion behavior to specific friction points across the customer journey. For a structured approach to acting on behavioral data, see our guide on funnel drop-off analysis.
FullSession, the behavioral analytics platform for ecommerce, brings session replay, heatmaps, funnel tracking, user feedback, and error monitoring into one workspace.
See Every Friction Point Before It Costs You Another Sale
Get the full behavioral picture, from first click to checkout exit, without stitching together multiple tools.
How to Audit Product Pages for Higher Conversions

Image source: Unsplash
Your product page is where buying decisions happen. To optimize product pages effectively, identify which elements cause hesitation and fix those first; don’t redesign everything at once.
Run heatmaps on your highest-traffic pages before changing anything. You may find users scroll past your primary image, that trust signals are too far down to see, or that your CTA blends into the background on certain devices.
Key areas to address:
- High-quality product images: Use multiple images with zoom. Mobile-first sizing matters. Product images that look sharp on the desktop often load slowly on phones. Consider 360-degree views where dimensions or fit drive hesitation.
- Product descriptions: Lead with benefits, then features. Specific copy converts better: “Fits 15-inch laptops with a padded sleeve” outperforms “great for travel.” Use the language your target audience searches with.
- Social proof: Place ratings and review counts near the top of the page. Visible customer satisfaction signals, reviews, and social proof above the fold can increase confidence at the decision point.
- Trust signals: Display security badges, return policy summaries, and guarantees near your add-to-cart button so users see them before clicking, not only in the footer.
- CTA placement and copy: Test alternatives to “Add to Cart” for high-ticket items. Make sure your button is visible without scrolling on all screen sizes.
Before committing to any product page changes, you need to know which elements visitors actually engage with and which they ignore.
FullSession heatmaps show you exactly where attention lands across your highest-traffic pages, which trust signals get seen before the add-to-cart click, and where users drop off on mobile versus desktop.
Pair that with session replay to watch individual visits, and you have a clear picture of what to fix before writing a single line of new copy or moving a single element.
Landing Pages and Landing Page Attribution
A paid campaign converting at 7% on a dedicated landing page but 1.4% on your homepage isn’t a traffic quality problem. It’s a relevance and attribution problem.
Different traffic sources bring different visitors. Someone arriving via a branded search has more familiarity and intent than someone from a cold prospecting ad. They have different trust levels and different friction points.
UTM tracking lets you segment conversion data by source, medium, and campaign so you can prioritize optimization efforts by revenue impact.
Act on this:
- Set UTM parameters on every paid link to isolate landing page performance by source.
- Track the landing page to the checkout funnel as a separate mini-funnel.
- Use session replay on landing page sessions to spot first-visit friction: slow load times, unclear headlines, or missing social proof.
- Compare conversion rates by source regularly. Focus on the highest-volume, lowest-converting combinations first.
For most stores, the gap between potential customers who land and those who convert is a messaging or trust problem, not a product problem.
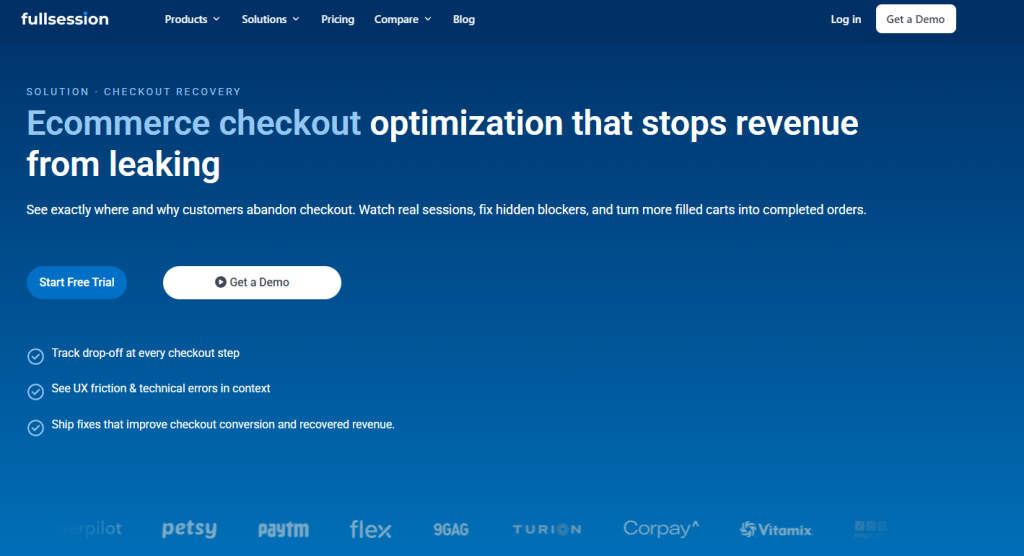
How to Optimize Checkout to Reduce Abandonment
Checkout is where many stores lose a large share of potential revenue. Usability issues, missing payment options, and poorly designed forms are fixable problems, and addressing them directly is where checkout optimization typically delivers the most impact.
Results vary by store, but the starting point is the same: reduce friction at the moment visitors are closest to buying.
- Guest checkout: Forced account creation is one of the most documented causes of abandonment. Offer it after the order is placed. Guest checkout should be the default, not a secondary option.
- Checkout forms: Cut fields to the minimum. Enable autofill. Use inline validation so users see errors immediately, and add a progress indicator. Keeping users on the same page through checkout rather than redirecting between pages reduces drop-off.
- Payment options: Offer credit cards, Apple Pay, Google Pay, and at least one buy-now-pay-later option when relevant to your target market. Limited payment options can create friction in the checkout flow and give shoppers another reason to leave.
- Free shipping thresholds: A visible threshold (“Add $14 more for free shipping”) can lift average order value and reduce abandonment from unexpected costs at checkout.
- Trust signals at checkout: Place SSL certificates, a returns policy summary, and a support link on the checkout page. Anxiety is highest at the moment of payment.
- Error tracking: Session replay on checkout pages shows rage clicks, field hesitation, and exit points. FullSession error tracking catches JavaScript failures and broken payment API calls that never appear in standard analytics.
If checkout drop-off is a priority, see how the FullSession’s checkout recovery solution approaches the full recovery workflow.
Mobile Users and Mobile Optimization

Image source: Unsplash
Mobile drives the majority of ecommerce traffic for most stores, but converts lower than desktop. Understanding that gap is step one.
It has clear causes: slow load times on mobile networks, small tap targets, complex checkout forms that are hard to complete on a phone keyboard, and navigation that breaks down on small screens.
Mobile-specific actions to prioritize
- Design for mobile first, not as a scaled-down desktop.
- Test page speed on mobile regularly. Slow site speed and slow-loading pages are especially damaging for mobile users because smaller screens, mobile devices, and variable connections make friction more visible.
- Replace multi-field forms with one-tap methods like Apple Pay and Google Pay wherever possible. Mobile optimization at checkout means fewer keystrokes, not just bigger buttons.
- Verify tap targets are at least 44 x 44 pixels across product pages and checkout.
- Use FullSession’s mobile session replay to watch what mobile users actually encounter, not a browser resize simulation.
Slow load times hit mobile users hardest. Site speed is a baseline requirement for mobile CRO, not a nice-to-have.
Build a CRO Experimentation Process
Random changes produce inconsistent results. Repeatable conversion rate optimization strategies separate stores that improve steadily from those that run a few tests and stop.
The six-step CRO loop
- Measure baseline: Document your average ecommerce conversion rate, funnel metrics, and segment performance before touching anything.
- Find friction: Use session replay, heatmaps, funnel analytics, and user research to identify where and why users drop off.
- Prioritize by revenue impact: Score friction points by traffic volume affected, drop-off severity, and confidence in the fix. An impact x confidence x effort matrix keeps ecommerce CRO efforts focused on revenue.
- Fix one variable: Change one thing per test. Multiple changes make it impossible to identify what drove the result.
- Validate with data: Run tests until you have a sufficient sample size and statistical significance relative to the effect size and business context. A lift on a small sample during a peak period isn’t a reliable signal.
- Report lift: Document baseline, result, and revenue delta. Feed learnings back into step one.
FullSession’s Lift AI supports two stages of this loop. It identifies friction points and prioritizes them by estimated revenue impact so teams focus on what matters most, tracks the impact of fixes after they go live, and helps you validate whether a change actually moved the needle before reporting results to stakeholders.
Run this loop on product pages, checkout, landing pages, and mobile experience in parallel, one variable at a time. Enhancing user experience is a continuous system, not a one-time project. Each completed cycle compounds your ability to boost conversions without spending more on traffic.
Use Funnels and Conversion Funnel Micro-Metrics
Funnel analytics show how many visitors moved from one step to the next and exactly where users drop between stages. That’s the difference between knowing you have a problem and knowing where it is.
Your core ecommerce funnel: Landing Page → Product Detail Page → Add to Cart → Checkout Initiation → Purchase.
Micro-metrics by stage:
- Landing on PDP: Low click-through often signals a navigation, filtering, or product discovery problem.
- PDP to Add to Cart: A persistently low add-to-cart rate relative to category benchmarks points to a product page or pricing issue.
- Add to Cart to Checkout Initiation: High drop-off here usually means cart friction or unexpected shipping costs.
- Checkout Initiation to Purchase: Where payment options, form design, and trust signal work.
Segment by device, traffic source, and new vs. returning users. A concentrated drop-off at one stage among one audience segment is a far more actionable starting point than an aggregate rate.
Privacy-Friendly Analytics Tools for Ecommerce
Standard tools like Google Analytics, commonly used as a benchmark layer for ecommerce data, show traffic volumes and goal completions. They don’t show what users did inside those sessions. Behavioral context is where the CRO diagnosis actually happens.
A complete ecommerce CRO analytics stack needs five layers:
- Web analytics: Session counts, traffic sources, goal completions.
- Session replay: Individual user recordings showing clicks, scrolls, rage clicks, and navigation.
- Heatmaps: Aggregate attention maps for click density, scroll depth, and interaction patterns.
- Funnel analysis: Step-by-step drop-off tracking between defined stages.
- User feedback: In-page surveys that collect qualitative signals from real visitors at friction points.
GDPR and CCPA apply to stores serving EU visitors or California residents. Your tools should support data masking, cookieless tracking options, and documented data retention policies.
FullSession, the behavioral analytics platform for ecommerce, supports privacy-focused CRO workflows with built-in data masking, documented data controls, session replay, heatmaps, funnel analysis, and user feedback.
This helps teams review user behavior and technical issues while keeping privacy requirements part of the CRO workflow.
Stores should still confirm their own GDPR, CCPA, and PCI-related requirements with legal or compliance teams.
For a tool comparison, see our guide on the best CRO tools for ecommerce.
How to Calculate ROI and Report Conversion Improvements

Image source: Unsplash
Knowing your conversion rate has improved is useful. Knowing what that improvement is worth in revenue is what tells you where to focus next.
Use ROI formula: (Revenue Gained ÷ Cost of Fix) × 100
Here is what this looks like in practice: a store invests $8,000 in a checkout redesign. Conversion rate improves from 2.1% to 2.8% on 50,000 monthly sessions at $85 average order value.
That’s roughly 350 additional orders per month, around $29,750 in additional monthly revenue before costs and refunds.
Annualized, that’s $357,000 from an $8,000 investment. Actual net return depends on margins and return rates.
What to include in every CRO report:
- Baseline conversion rate with date range and segment definition
- Post-test rate with statistical significance and sample size confirmed
- Revenue delta: additional transactions × average order value, noted as a pre-cost estimate
- Estimated annual impact based on current traffic
- Customer lifetime value multiplier for stores with strong repeat purchase rates
Two guardrails matter here. Confirm statistical significance and adequate sample size before concluding a test. Use holdout groups where possible to separate CRO lift from seasonal demand shifts.
A conversion rate bump during a peak sales period is not the same as a repeatable improvement, and treating it as one leads to poor prioritization decisions down the line.
Quick CRO Checklist for Your Online Store
Return to this after every major site change, migration, or seasonal peak.
- Conversion rate baseline documented for the current period
- Funnel tracking active: Landing, PDP, Add to Cart, Checkout Initiation, Purchase
- Session replay live on product pages, checkout, and key landing pages
- Heatmap audit completed on the top five product pages
- Checkout tested on mobile and desktop with guest checkout as the default
- Mobile UX tested on real devices, not browser emulation
- Page speed checked: review first contentful paint, load time, and site speed on mobile, with faster pages prioritized for key product pages, landing pages, and checkout pages.
- At least one A/B test is active with a defined hypothesis
- Privacy controls reviewed: data masking enabled, GDPR and CCPA documentation current
- Error monitoring is active with alerts for JavaScript failures and payment API errors
- User feedback widget live on checkout and post-add-to-cart pages to collect data at friction points
- ROI report updated after each test with baseline, result, and estimated revenue impact
More sales come from removing what stops visitors from buying. This checklist keeps your optimization efforts systematic and your business growth on track.
Why Choose FullSession for Ecommerce CRO
Most ecommerce teams lose time switching between tools: one platform for analytics, another for session replay, another for feedback, and another for error monitoring.
By the time you piece together what happened in a single checkout session, the diagnosis has taken longer than the fix.
FullSession brings every layer of the CRO process into one workspace so you spend less time connecting dots and more time improving conversions.
- Session replay: Watch real sessions on product pages, landing pages, and checkout. See hesitation, rage clicks, scroll depth, and exit points. Every recording is searchable by page, device, source, and behavior.
- Heatmaps: See which elements attract clicks, which are ignored, and where scroll depth drops. Direct your test backlog with data before writing a line of code.
- Funnel tracking: Map your full customer journey from browse to purchase. Segment by device, source, and user type to see where users drop, which audience needs attention, and where optimization efforts can improve conversion performance.
- Error and alerts tracking: Catch JavaScript errors, failed API calls, and broken payment flows before they cost you orders. Every error links directly to the session replay where it occurred.
- User feedback: Collect in-page feedback at the exact moment of friction, linked to the session replay of that visit. Qualitative signals and behavioral data in the same place.
- Lift AI: Analyzes user journey patterns to find friction points ranked by revenue impact, so your team focuses optimization efforts where they are most likely to move the needle.
- Mobile replay: Full session replay for mobile users, including tap behavior, scroll patterns, and device-specific errors. Real sessions on real devices, not browser resize simulations.
FullSession includes a free plan for getting started, with paid plans available for higher session volume. See the FullSession pricing page for details.
Not Ready to Talk Yet?
Set up session replay, heatmaps, and funnel tracking with no credit card required.
Conclusion About Ecommerce Conversion Rate Optimization
Conversion rate optimization is a system, not a list of one-off fixes. Stores that improve steadily run the same loop: measure, find friction, prioritize, fix, validate, report, repeat.
Traffic isn’t always the only problem. For most stores with an established digital presence, the bigger opportunity is in what happens after visitors arrive. Behavioral data makes each cycle of that loop more precise.
You have the full framework: metrics to track, behavioral tools to diagnose friction, product page and checkout fixes to implement, a mobile strategy, an experimentation process, and a reporting structure to keep the program funded.
Each part supports the same goal: understanding where users drop, why they hesitate, and which optimization efforts are most likely to increase conversion rates.
The goal is not only to boost sales in one sprint. It is to build a repeatable conversion optimization strategy that compounds through better user behavior insights, stronger product pages, smoother checkout flow, and continuous testing.
Over time, this makes CRO less about isolated fixes and more about a repeatable system for improving user experience and driving more sales.
More sales and sustained business growth start with understanding what visitors are actually doing on your site.
FullSession shows you the behavior behind every drop-off, from session replay to funnel analytics to error tracking.
This gives ecommerce teams a clearer way to connect user behavior, technical issues, and conversion metrics before deciding what to fix next.
Turn UX Insights Into Revenue Growth With FullSession
Start measuring and optimizing your ecommerce store with privacy-compliant behavioral analytics.
FAQs About Ecommerce CRO
What is a good conversion rate for ecommerce?
A good ecommerce conversion rate depends on category, device, traffic source, product price, and target market. Some industry research shows higher e-commerce conversion rates in categories like arts and crafts, while electronics often convert lower because shoppers compare products before buying.
Your own average conversion rate and historical trend are the most reliable benchmarks.
How do I calculate my ecommerce conversion rate?
Divide completed purchases by total website visitors in the same period, then multiply by 100. Example: 800 purchases from 40,000 visitors = 2%.
You can calculate conversion rate for any funnel action, including add-to-cart events and checkout initiations, to measure performance at each stage separately.
What causes low conversion rates in ecommerce?
Common causes include checkout friction, forced account creation, long checkout forms, limited payment options, poor mobile experience, slow site speed, small tap targets, weak product pages, low-quality product images, vague product descriptions, absent social proof, and missing trust signals.
Session replay and heatmaps identify which cause applies to your store.
How can I improve my ecommerce conversion rate?
Measure your funnel micro-metrics to find where you lose the most visitors. Use session replay and heatmaps to understand why. Prioritize by revenue impact, change one variable per test, and validate with adequate sample size before scaling.
Follow the six-step loop: measure, find friction, prioritize, fix, validate, report, repeat. To increase conversion rates systematically, run this loop continuously rather than as a one-off project.
What tools are used for ecommerce conversion rate optimization?
A complete stack covers five categories: web analytics for baseline data, session replay and heatmaps for behavioral context, funnel analysis for step-by-step drop-off, user feedback for qualitative signals, and error monitoring for technical failures.
FullSession combines these layers in one platform with privacy-focused features such as data masking and documented data controls, while stores should still confirm their own GDPR and CCPA requirements.

Roman Mohren is CEO of FullSession, a privacy-first UX analytics platform offering session replay, interactive heatmaps, conversion funnels, error insights, and in-app feedback. He directly leads Product, Sales, and Customer Success, owning the full customer journey from first touch to long-term outcomes. With 25+ years in B2B SaaS, spanning venture- and PE-backed startups, public software companies, and his own ventures, Roman has built and scaled revenue teams, designed go-to-market systems, and led organizations through every growth stage from first dollar to eight-figure ARR. He writes from hands-on operator experience about UX diagnosis, conversion optimization, user onboarding, and turning behavioral data into measurable business impact.