You’re at a crossroads. Your team needs to understand how visitors behave: where they drop off, what frustrates them, and why they abandon carts. But you’re unsure whether Hotjar or Microsoft Clarity is the right fit.
This decision between Hotjar vs Microsoft Clarity shapes your entire approach to user behavior analytics.
Both tools promise insights, but they solve the problem in different ways. This matters because choosing wrong costs you time, money, and critical insights that drive revenue growth. The right tool becomes key to how your team makes decisions about website analytics, performance, and user experience.
This guide breaks down exactly how Hotjar vs Microsoft Clarity work, when each makes sense for your business, and how FullSession compares as an emerging alternative.
FullSession combines the best of both worlds: advanced analytics depth like Hotjar with the affordability and simplicity that appeal to teams choosing between these established options.
You can start a free trial to test the platform.
Key Takeaways
- Microsoft Clarity is best for teams that need a free, no-setup starting point because it covers the basics of heatmaps and session recordings without any cost or commitment.
- Hotjar is best for teams that need qualitative depth alongside behavioral data because its built-in surveys, feedback widgets, and user interviews make it the stronger choice when you need to understand the why behind user actions.
- FullSession is best for teams that need everything in one place without the tradeoffs because it combines advanced session recordings, funnel analysis, error tracking, and feedback tools at a price point that scales with you.
FullSession closes the gap between Clarity’s simplicity and Hotjar’s depth, giving you enterprise-grade behavioral insights without the enterprise price tag.
Whether you’re diagnosing drop-offs in a checkout flow, tracking JavaScript errors alongside session replays, or segmenting users by behavior to find your highest-value cohorts, FullSession gives your team the full picture in a single platform.
Book a demo to see how it works in practice.
What Is User Behavior Analytics?
User behavior analytics collects qualitative data (user feedback data, frustration scores, sentiment) alongside quantitative data.
Google Analytics tells you what happened. User behavior analytics tools, like Hotjar and Microsoft Clarity, show you why. They capture friction, confusion, and the moment a user journey falls apart.
You can see their frustrations, hesitations, where they get stuck, what confuses them, and the exact moment they decide to leave or convert.
Among other features, these tools provide session recordings that let you watch exactly how someone navigated your site. They also display heatmaps showing where users click, how far they scroll, and which areas draw their attention.
You can see user interactions in real time, from mouse movements to form fills to rage clicks.
This combination of tracking user behavior and understanding user sentiments is why companies treat behavior analytics as essential infrastructure. User engagement metrics become actionable insights.
What Hotjar is and What You Get
Hotjar is a feedback-first user behavior analytics platform built for cross-functional teams. It’s designed for product managers, designers, marketers, and researchers who need user feedback data to justify their decisions.
Hotjar bridges the gap between what you think your users are doing and what they actually do. It combines session recordings, heatmaps, surveys, and interviews into a single platform.
This approach means you’re not constantly switching between other tools. You save time, get clearer insights, and can actually act on them to improve your product and boost conversions.
When you compare Hotjar vs Microsoft Clarity, Hotjar’s strength lies in its comprehensive feedback features and advanced user behavior tracking for web visitors.
- Learn more about Hotjar alternatives.
- See how Hotjar compares to FullSession.
Best for
- Product teams building for paying customers who need both quantitative metrics and qualitative insights
- E-commerce teams optimizing conversion funnels and identifying where customers drop off during checkout
- SaaS product managers improving onboarding by pinpointing where users get confused or disengage
- Marketing teams validating which messages resonate through real user feedback
- UX design teams that need to back up design decisions with a mix of hard data and user insight
Key features
- Session Recordings with auto-tagging: Watch users interact with your site. Hotjar automatically tags sessions and scores each for frustration and user engagement, helping you skip to the insights that matter. See how visitors interact with every element, from user and form system flows to navigation. Track data retention up to 365 days.
- Comprehensive heatmaps: Click maps, move maps, scroll maps, and engagement zones show exactly where visitor behavior patterns emerge across specific web pages. Monitor user engagement patterns in real time.
- Feedback widgets and surveys: Embed targeted feedback tools and on-page feedback collection to capture user sentiments in real time without a separate survey tool. Collect data directly from visitors about their experience and gather survey responses.
- Conversion funnels: Track how users behave through multi-step processes like checkout, sign-up, and onboarding. Identify exactly where people drop off in your funnel analysis process. Understand which users convert best.
- User interview tools: Recruit, schedule, and conduct moderated user interviews directly within the platform to understand user behavior at a deeper level.
Integrations
Hotjar integrates with tools including Google Analytics, Google Optimize, Google Tag Manager, HubSpot, Jira, Linear, Microsoft Teams, Mixpanel, Optimizely, Slack, Trello, Unbounce, Webhooks, and Zapier, along with partner-built integrations.
This broad ecosystem makes it easier to connect Hotjar with your existing tools and workflows.
Pricing
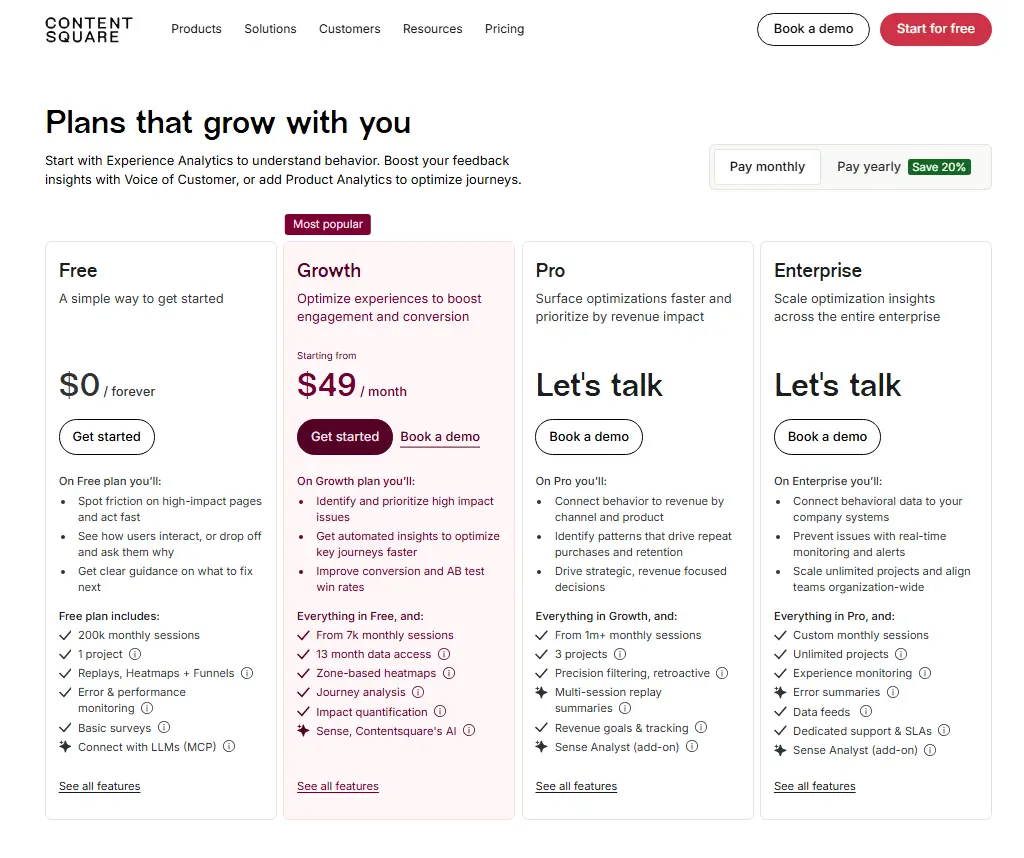
Hotjar offers a free plan to get started, while paid pricing begins with the Growth plan at $49/month.
According to Contentsquare’s pricing page, Growth includes 7,000 monthly sessions and 13 months of data access, with Session Replays available for 2 months on that plan.
What Microsoft Clarity is and What You Get
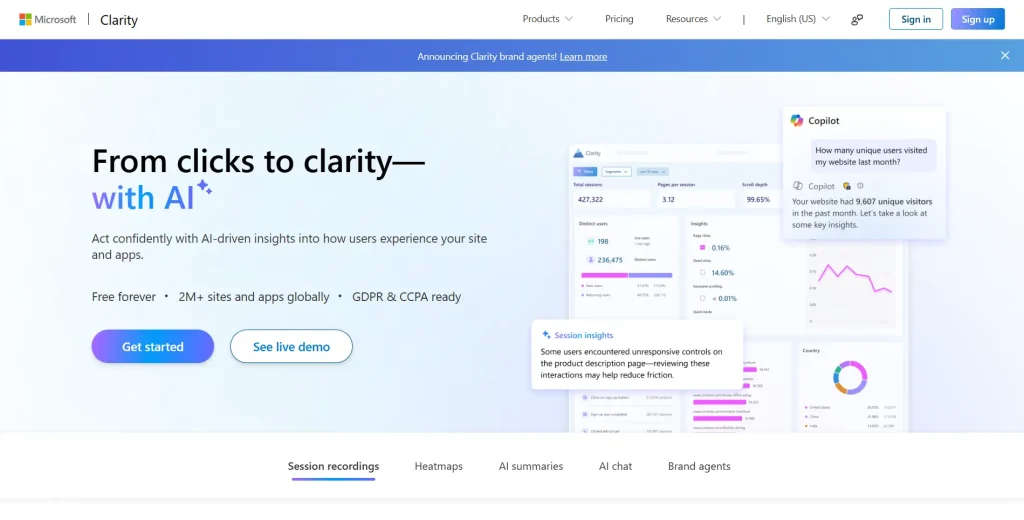
Microsoft Clarity is a free session replay and heatmap tool built for teams that want visibility into user behavior without paying for advanced analytics platforms.
Unlike other analytics tools, it’s intentionally simple: you get heatmaps and session recordings, nothing more, nothing less.
As a free tool, Microsoft Clarity gives teams access to these core essentials at no cost, making it an easy starting point for understanding how visitors interact with your website.
See how Microsoft Clarity compares to FullSession.
Best for
- Solo marketers who need analytics basics without a budget commitment
- Startup founders validating product-market fit and early user behavior
- Blog owners track visitor engagement and basic page performance
- Product teams testing new features or validating landing page designs
- Budget-conscious organizations that need user behavior visibility without Hotjar’s cost
Key features
- Heatmaps: Dead clicks, error clicks, first clicks, and area maps visualize where specific web pages draw attention. See exactly where users repeatedly click or experience friction on your website.
- Session replays: Watch recordings live or on demand. Includes JavaScript errors and console logs for debugging. See what users do and what technical issues they encounter.
- Live dashboard: Monitor website visitors and traffic in real time with instant visualizations showing live user behavior across multiple pages.
- Google Analytics integration: Clarity offers a dedicated Google Analytics dashboard that lets you import GA segments for filtering.
- Performance metrics: Track page load times, rage clicks, excessive scrolling, and other website performance indicators. Improve site performance and understand user behavior.
Integrations
Microsoft Clarity offers Google Analytics integration, but its collaboration and workflow tooling is not positioned as strongly as Hotjar’s. This limits how insights flow through your organization.
When you need dedicated support or advanced collaboration features, Microsoft Clarity falls short.
Pricing
Completely free. Zero cost, zero limitations, zero upgrades. All features are included with no surprise charges.
Hotjar vs Microsoft Clarity: Core Features Compared
The key differences between Hotjar and Microsoft Clarity come down to depth versus simplicity. The table below breaks down the key features side by side.
| Feature | Hotjar | Microsoft Clarity |
| Session recordings | Yes, with auto-tagging and frustration/engagement scoring | Yes, with live replay and on-demand replays |
| Heatmaps | Click, move, scroll, engagement zones | Dead clicks, error clicks, first clicks, area maps |
| Feedback widgets | Yes | No |
| Surveys | Yes | No |
| User interviews | Yes | No |
| Conversion funnels | Yes | No |
| Error tracking | Some JS error and crash‑related insight but not its primary focus | Yes, includes JavaScript errors and console logs |
| Data retention | Up to 365 days | Recordings/playback data: 30 days; heatmaps and labeled/favorited sessions: 13 months |
| PII masking | Yes, with data suppression controls for text, images, videos, and user input before data is sent to Hotjar | Yes, sensitive content is masked by default, and masked content is not uploaded to Clarity |
| Data residency | Hotjar states that user and usage data is stored on AWS infrastructure in EU-West-1, Ireland | Clarity does not publicly position customer-controlled region selection or data residency as a standard feature |
| Sampling on high traffic | Sampling applies when traffic exceeds your plan’s session capacity | No general traffic limits; recordings may be sampled if a project exceeds ~100k recordings/day |
| Mobile SDK | Primarily web‑focused; mobile SDK status changing (Hotjar now under Contentsquare) | Yes, mobile SDK for Android, iOS, Flutter, React Native |
| SOC 2 / SSO | Security docs available; SOC 2 and SSO can vary by plan/contract | Microsoft back‑end security applies; Clarity‑specific SOC 2 / SSO not clearly positioned as standard public features |
| Performance impact | Hotjar says its script is designed for minimal impact, but any JavaScript can affect performance depending on page complexity. See:Does Hotjar slow down my site? | Clarity says it is designed not to impede site performance and offers a lightweight mobile SDK with minimal performance or bandwidth impact |
| Collaboration features | Integrates with Slack, Microsoft Teams, and others | Limited collaboration integrations |
| Integration ecosystem | Broad, 1,000+ tools via Zapier and native integrations | Dedicated Google Analytics integration/dashboard experience |
| Free plan | Yes, up to 200k monthly sessions | Yes, unlimited and fully free |
| Paid pricing | Starts at $49/month | No paid tiers mentioned; fully free |
| Ideal use case | E-commerce, SaaS, product, and UX teams optimizing conversions | Solo founders, marketers, bloggers, and small teams validating ideas |
| Main limitation | Costs increase as usage grows | Lacks surveys, funnels, interviews, and deeper qualitative research |
How to choose between Hotjar vs Microsoft Clarity
Overall, both Clarity and Hotjar help teams understand user behavior, but they serve different needs: Hotjar is better for deeper research and qualitative insight, while Clarity is better for cost-effective, straightforward behavioral tracking.
- Choose Hotjar if you need a more complete UX research and feedback toolkit, especially when your goal is to understand not just what users do, but also why they behave that way through surveys, feedback tools, and deeper analysis.
- Choose Clarity if you want a free, simple, and lightweight tool for session recordings and heatmaps, particularly for basic behavioral insights and quick performance monitoring.
For teams that want everything Hotjar offers without the usual paywalls, FullSession is a strong alternative. It includes the same advanced behavior analytics and feedback tools, and also offers a free plan like Microsoft Clarity, with no stripped-down feature set.
In other words, you do not have to upgrade just to access the core functionality; you get the full toolset from the start.
Meet FullSession
FullSession is a digital experience intelligence platform that positions itself between Microsoft Clarity’s simplicity and Hotjar’s feature richness. It’s built for teams that have outgrown basic analytics but find Hotjar’s pricing steep at scale.
It leads you through the seeing-to-proving loop: First, spot user friction instantly via session replays and heatmaps. Then, use Lift AI to predict your ROI lift before making changes and validate the actual results after fixes go live. No more guessing; you get hard proof on what’s truly driving conversions.
Best for
- SaaS companies that need more than basic analytics, especially when it comes to segmentation and funnel analysis.
- E-commerce teams handling high traffic and trying to understand how users move through the full purchase journey and where they drop off.
- Marketing and growth teams that want deeper funnel insights, cohort comparisons, and user segmentation without paying Hotjar-level pricing.
- Businesses with solid but controlled budgets that need more capability than Clarity, but do not want to commit to expensive enterprise tools.
- Teams working with complex user journeys that require better segmentation, clearer behavioral insights, and access to reliable support when needed.
Key features
- Session recordings with smart tagging: Sessions are tagged by relevance with behavioral triggers for deeper filtering. Access data retention for 15+ months to review historical user behavior patterns. Track data collected automatically.
- Lift AI: Leverage AI-driven insights to detect intent, highlight valuable visitors, and surface the most relevant insights and sessions that matter most for optimization and conversion growth.
- Advanced segmentation: Filter user interactions by custom events, user attributes, cohorts, and behavioral patterns. This goes far deeper than Clarity’s basic filtering capabilities. Create segments based on user actions and replay those exact sessions.
- Funnel analysis: Get funnel-tracking features with sophisticated cohort comparisons that show which users convert best. Understand your conversion funnels at a granular level.
- Error tracking: Identify JavaScript errors, broken links, console errors, and performance bottlenecks in a single platform. Integrated error tracking eliminates tool fragmentation.
- Feedback integration: Connect surveys and feedback tools directly to user behavior data so responses are not isolated. Instead of looking at feedback on its own, you can break it down by user segments and behavior patterns.
Integrations
FullSession currently has fewer native third-party integrations than some of the larger competitors. It supports Slack, Google Analytics, Zapier, and additional tools across reporting, alerts, and workflow automation.
However, we welcome integration requests as part of any enterprise engagement. If it’s a blocker to adoption, we build it. Responsiveness is something we can still offer that the larger players can’t.
Pricing
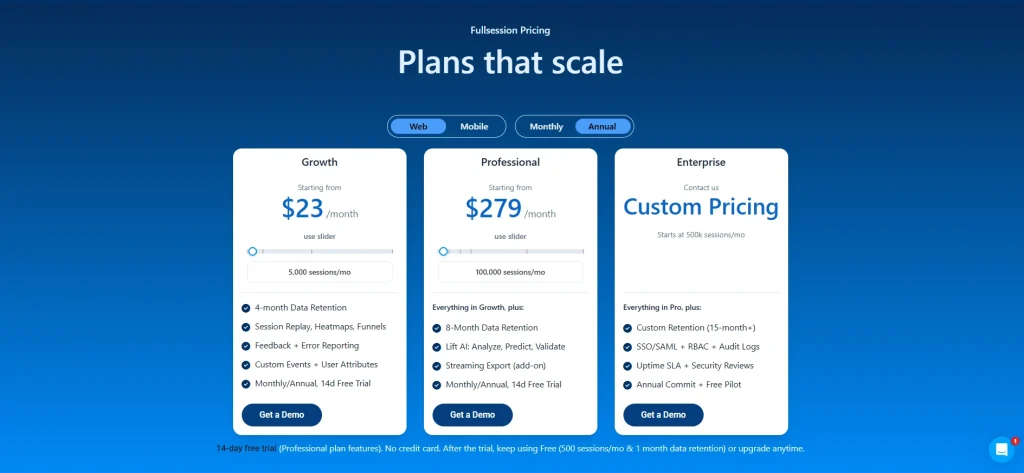
FullSession offers a generous free plan with 500 sessions per month and 1 month of data retention. It also includes a 14-day free trial of the Professional plan, with full access to all features and no credit card required.
Paid plans start at $23 per month (billed annually) for 5,000 sessions and include all key features, along with 4 months of data retention.
Annual billing also comes with a 20% discount, making it a more cost-effective option for long-term use.
Check out the pricing page for more details.
Hotjar vs Microsoft Clarity vs FullSession: Head-to-Head
| Feature | FullSession | Hotjar | Microsoft Clarity |
| Session Recordings | 365-day data retention, auto-tagging, cohort replay | 365-day data retention | 30-day retention for recordings; labeled or favorited sessions kept for 13 months |
| Heatmaps | 5+ types (click, move, scroll, engagement, zones) | 5+ types (click, move, scroll, engagement, zones) | 4 types (dead click, error click, first, last) |
| Conversion Funnels | Yes, with cohort comparison | Yes, native funnel tracking features | No |
| Error Tracking | Integrated JavaScript, console, and network error tracking with session-level context | Limited | JavaScript errors, console logs |
| User Feedback & Surveys | In-app feedback widget, survey responses | Native surveys, feedback widgets, interviews, and user ratings | None |
| User Interview Tools | No | Yes, native user interviews | No |
| Google Analytics | Zapier + API | GA segment filtering | Dedicated Google Analytics dashboard (deepest integration) |
| Collaboration Tools | Slack native, dedicated support team | Slack, Microsoft Teams, email integration | Microsoft ecosystem only |
| Learning Curve | Moderate | Moderate | Very low |
| Free Option | Free plan plus 14-day trial of Professional plan | Free plan for 200k monthly sessions | Free forever, all features |
Real-World Use Cases: When to Choose Each Tool
Understanding if FullSession, Microsoft Clarity and Hotjar fit your situation matters more than which is “best.” Here’s how each platform serves different teams and use cases.
When Microsoft Clarity Wins
Clarity works well for teams that want to start with behavior analytics without adding budget pressure. Its real-time dashboard helps teams monitor live traffic, and its heatmaps and session replays make it easier to spot friction on content sites, blogs, and early-stage product experiences.
For solo founders, small teams, or businesses with limited resources, it offers a practical way to begin understanding user behavior.
Clarity helps answer early questions, such as where users get stuck, which pages create friction, and how visitors move through the site. Those valuable insights can be useful for improving usability and identifying obvious issues quickly.
However, its feature set is more limited for advanced analytics, especially if your team needs deeper segmentation, funnel analysis, feedback tools, or more robust qualitative research capabilities.
When Hotjar Wins
You need to understand why users convert. You’re running an e-commerce, SaaS, or conversion-focused business. Your team spans product, design, marketing, and customer success. Hotjar gives feedback, interviews, and qualitative data.
When you need to justify design decisions, Hotjar’s combination becomes essential. User sentiments matter when optimizing user journeys. Teams managing complex onboarding flows benefit from frustration scores.
Hotjar delivers comprehensive tracking for user engagement optimization.
When FullSession Wins
FullSession is the right fit when your team needs more than heatmaps and recordings but doesn’t want to stitch together three separate tools to get there.
Session replay, heatmaps, conversion funnels, error tracking, in-app feedback, and mobile replay are all included in one subscription, connected on the same dashboard from day one.
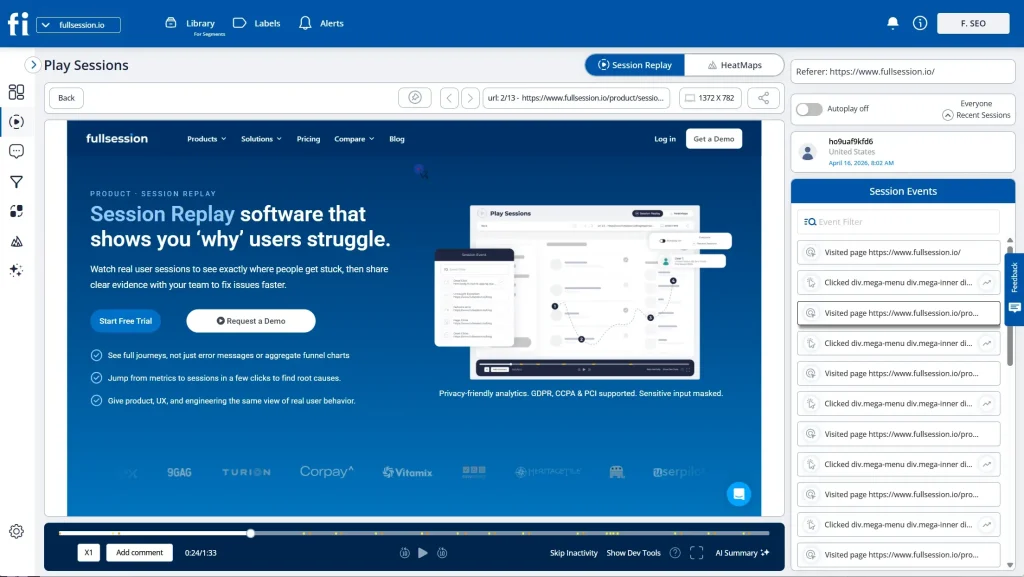
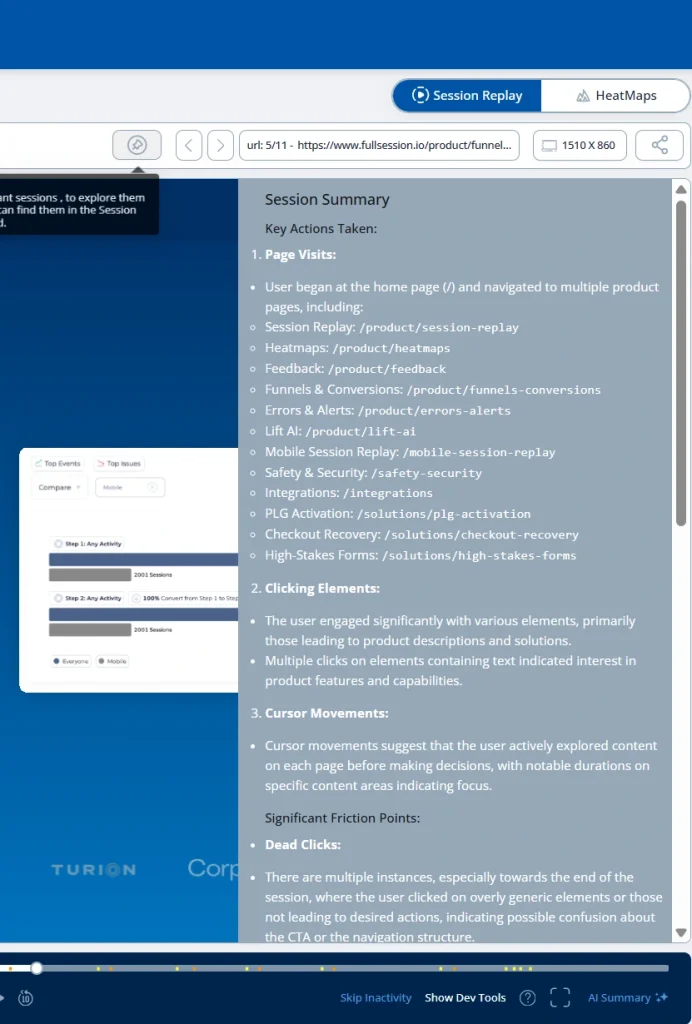
The Play Sessions interface gives you every interaction in sequence, pages visited, elements clicked, and navigation path, with heatmaps one click away. The Errors and Alerts dashboard catches broken user flows before they reach a support ticket.
What separates FullSession from other platforms is Lift AI.
It doesn’t just find problems; it ranks them by expected revenue impact and links each one directly to the session replays where the issue happens. When a fix ships, Lift AI validates whether it actually moved the needle.
That loop, from observation to action to confirmation, is what most analytics tools can’t close.
The interface is clean enough for product managers, marketers, and support teams to use without training, and the SDK runs asynchronously, so your Core Web Vitals and website usability stay untouched.
Pricing starts at $23/month on the Growth plan, with every tier published publicly. No hidden upgrades to unlock features you expected from day one.
Book a demo to see how FullSession handles your specific use case.
Conclusion About Hotjar vs Microsoft Clarity
Microsoft Clarity, Hotjar and FullSession help teams understand user behavior, but they support different levels of analysis and different business needs.
Choose FullSession if you need an all-in-one platform for analyzing and improving complex user journeys. It is best for teams that want deeper segmentation, stronger funnel analysis, error tracking, and session-level context in one place.
See why teams choose FullSession for advanced analytics and clearer insight into user behavior.
Book a demo to see how it works in practice, or start your free trial today.
FAQs About Hotjar vs Microsoft Clarity
Can you use Hotjar and Microsoft Clarity together?
When comparing session recordings, Microsoft Clarity offers 30-day playback retention while Hotjar and FullSession extend up to 365 days. Yes, you can use both, but doing so can split your data across tools, making analysis less efficient.
For teams that want a simpler and more complete setup, FullSession is the stronger option because it brings session replay, heatmaps, funnels, and deeper behavioral analysis together in one platform.
How long does setup take?
Clarity: 5 minutes. Hotjar and FullSession: 15–30 minutes each. Extra time pays off with advanced features.
Which integrates best with Google Analytics?
Clarity has the deepest integration, offering a dedicated dashboard for importing GA segments. Hotjar offers segment filtering. FullSession uses Zapier or API.
How do platforms handle sensitive data?
All three masked credit card numbers and passwords. Hotjar and FullSession offer more granular controls. Verify compliance certifications (GDPR, CCPA, SOC 2) if handling sensitive data.
What if I need dedicated support?
If dedicated support matters to your team, Hotjar offers email support on all plans and phone support on higher tiers. FullSession provides email, chat, and a dedicated support team, while Clarity mainly offers community and email-based support.

Roman Mohren is CEO of FullSession, a privacy-first UX analytics platform offering session replay, interactive heatmaps, conversion funnels, error insights, and in-app feedback. He directly leads Product, Sales, and Customer Success, owning the full customer journey from first touch to long-term outcomes. With 25+ years in B2B SaaS, spanning venture- and PE-backed startups, public software companies, and his own ventures, Roman has built and scaled revenue teams, designed go-to-market systems, and led organizations through every growth stage from first dollar to eight-figure ARR. He writes from hands-on operator experience about UX diagnosis, conversion optimization, user onboarding, and turning behavioral data into measurable business impact.