Hotjar, Crazy Egg, Mouseflow, and Fullstory all help you understand user behavior, but they are not built for the same job. Hotjar is often the easiest starting point for heatmaps, recordings, and feedback. Crazy Egg is strongest when A/B testing and CRO are central. Mouseflow is a better fit when you need deeper journey, form, and friction analysis. Fullstory is the strongest option for deeper product and enterprise digital experience analytics.
If you are comparing these tools, the right choice depends less on brand recognition and more on your team’s actual workflow. Are you trying to improve landing pages, diagnose funnel drop-offs, collect qualitative feedback, or give product, support, and engineering teams deeper behavioral context? This guide breaks that down clearly.
Quick answer:
Choose Hotjar for easy feedback-led website research, Crazy Egg for CRO and A/B testing, Mouseflow for journey and form analysis, and Fullstory for enterprise-grade digital experience analytics. If you want an all-in-one alternative beyond those four, evaluate FullSession based on your team’s workflow rather than defaulting to it automatically.
Key Takeaways
- Hotjar is the easiest option for teams that want heatmaps, recordings, surveys, interviews, and lightweight funnel insight in one place.
- Crazy Egg is the strongest fit for CRO-focused teams that care about A/B testing, visual reports, and page-level optimization.
- Mouseflow is best for teams that need deeper website behavior analysis, especially around journeys, form analytics, and friction detection.
- Fullstory is best for teams that need deeper digital experience analytics across product, support, engineering, and complex user journeys.
- FullSession is worth evaluating if you want replay, heatmaps, feedback, funnels, and error analysis in one platform without jumping straight to a heavier enterprise stack.
Now, let’s dive into the detailed comparison of these analytics tools.
Visualize, Analyze, and Optimize with FullSession
See how to transform user data into actionable insights for peak website performance.
What Do These Tools Have in Common?
All four tools fall under behavior analytics, but they are not built for exactly the same job. Each one helps you understand how users interact with your site, yet they differ in depth, audience, and workflow. Some are better for marketers and UX teams, while others are stronger for product, support, or engineering use cases.
The biggest differences come down to five areas: session replay depth, heatmap usefulness, funnel and journey visibility, feedback collection, and implementation complexity. Those are the factors that usually determine which platform is the best fit.
How we evaluated these tools
We compared Hotjar, Crazy Egg, Mouseflow, and Fullstory using the criteria that matter most during selection:
- session replay and debugging depth
- heatmaps and visual behavior insight
- funnels, journeys, and form analysis
- surveys, feedback, and voice-of-customer tools
- pricing clarity, setup effort, and team fit
This article is designed as a decision guide, not just a feature list. The goal is to help you identify which platform fits your use case, not just which one has the longest feature page.
Feature-by-feature comparison
Now, let’s move on to comparing the features of these pieces of software. You’ll find that they are similar in many ways, but as usual, the devil’s in the details. Let’s take a look.
Session replays
All these services share a feature, which is arguably one of the most important tools in web analytics: session replay. Session recordings capture and aggregate exact user behavior on the site, which is then presented to the user in the form of a video replay.
These are not actual recordings, as this would be privacy-intrusive, but rather reconstructions of how users group use and move around your site.
When you analyze the given data, you can adapt your UX to improve sections where people drop off and lose interest, stamp out any glitches or performance issues such as slow loading times or JavaScript errors, and optimize landing pages and funnels to maximize sales.
All the platforms we examined in this article have the session replay feature (sometimes called recordings). User data gathered through replays can be segmented by device used, OS, browser, country, site load time, etc.
Session recordings and A/B testing
When we compare the session recordings feature in Hotjar and Mouseflow to Fullstory and Crazy Egg, the first two tools have one distinct advantage—the ability to use them in conjunction with A/B testing.
Hotjar and Mouseflow allow you to capture data on website visitors from split traffic, helping you create separate assessments for each version of your pages to demonstrate which one is more effective.
Hotjar does not offer A/B testing but lets you record visitor interactions on multiple variants of your website. CrazyEgg does not seem to have that specific filter for its session recordings, although it does boast a proprietary A/B testing tool.
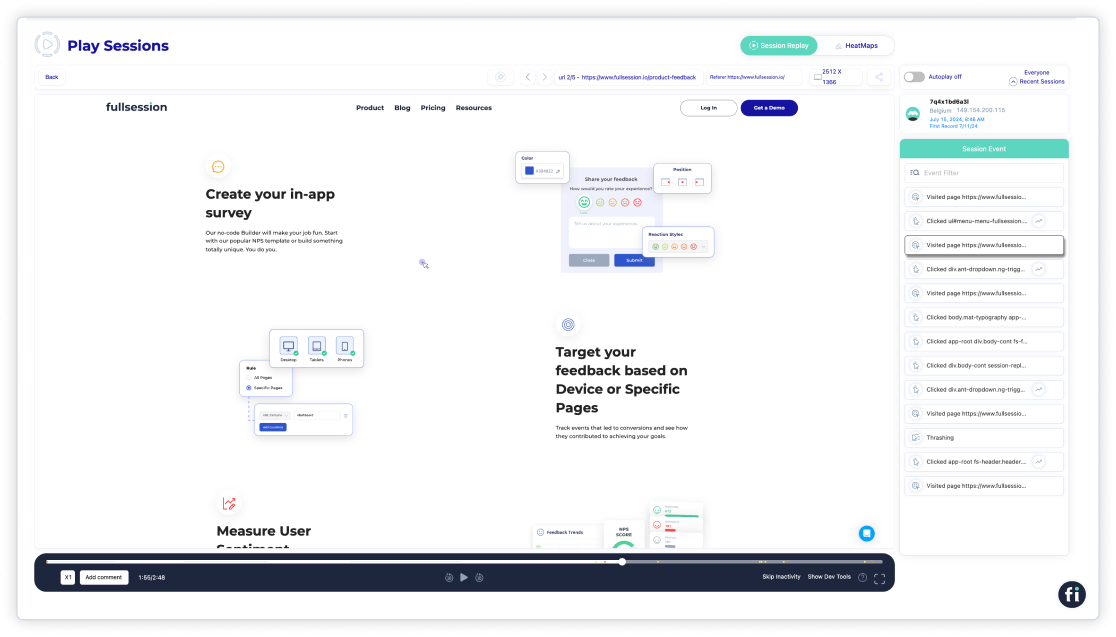
FullStory: Session replay and customer support
One of the areas where FullStory truly shines is in its customer support-oriented features. The tool lets you integrate user session replays with customer support tickets and complaints.
FullStory does this by providing you with session recordings for specific users when they write in a ticket. You’ll also receive recordings of website visitors’ behavior before and after they ask for help.
Replays allow you to see exactly what they were doing on a page when they ran into trouble. This removes the need for dragged-out communication with the customer, as you can just look at what they did through replays instead of asking them to recall their actions.
FullSession: Session recordings and replay
Imagine being able to watch how users navigate your site instead of making assumptions based on raw numbers. With user recordings, FullSession lets you see exactly where users click, scroll, and get stuck.
This feature creates a video replay of user sessions, allowing you to observe their journey through your site as if you were right there with them. You can identify exactly what captures their attention, where they experience frustration, and where they abandon the process—all from an easy-to-use interface.
It helps you spot and fix issues quickly, whether it’s a confusing navigation menu, a broken link, or a slow-loading page. By understanding these pain points, you can make targeted improvements to improve the user experience and boost conversions.
Heatmaps
Besides recordings, all of these services give you access to user heatmaps (called Snapshots in Crazy Egg). Heatmaps are aggregated, visual user behavior data that show you how users behave on your pages.
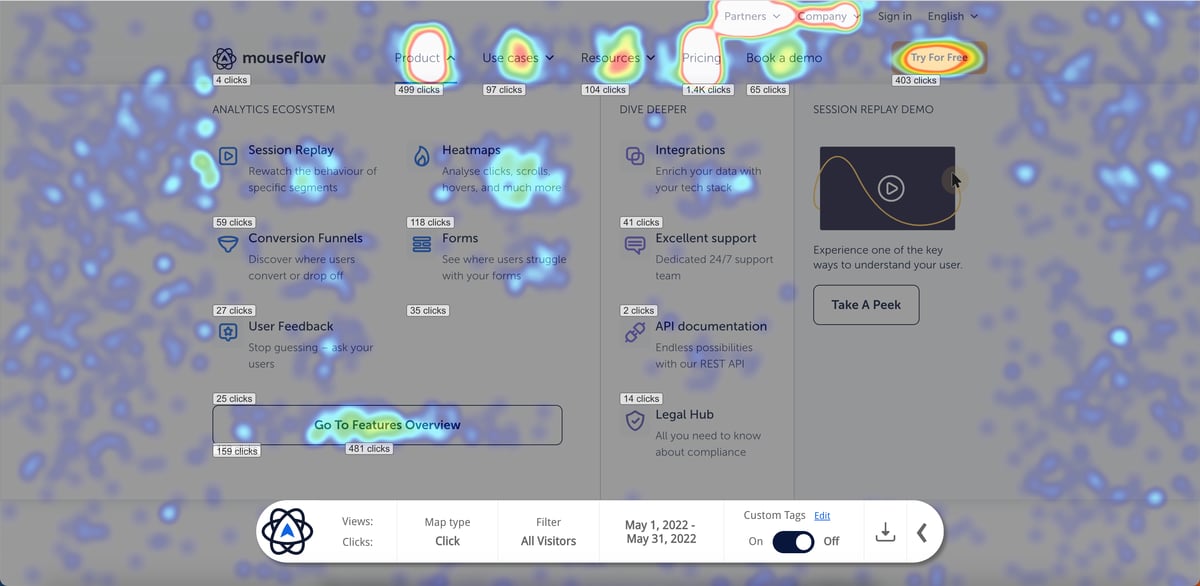
Image source: G2
Heatmaps present a great way for you to see which parts of your page visitors gravitate to the most. Do they keep clicking the banner that actually doesn’t take them anywhere? Is your sign-up button unresponsive? Do users just ignore whole sections of your website? These are just some of the many questions heatmaps help answer.
Now, we’ll go over the heatmap sub-types and compare which ones are found with each tool.
Scroll maps and click maps
Scroll maps show you how far down a visitor tends to scroll on your page. Naturally, the top portion of your page will be the most looked at, but the user’s interest tends to fall off as you move downwards.
They are extremely useful for assessing whether your online content is too long. They prompt you to reorganize page elements and place important CTAs on portions of your page that users actually interact with.
If the buttons you want a visitor to interact with are stuck in sections they don’t even look at, you probably won’t see much success.
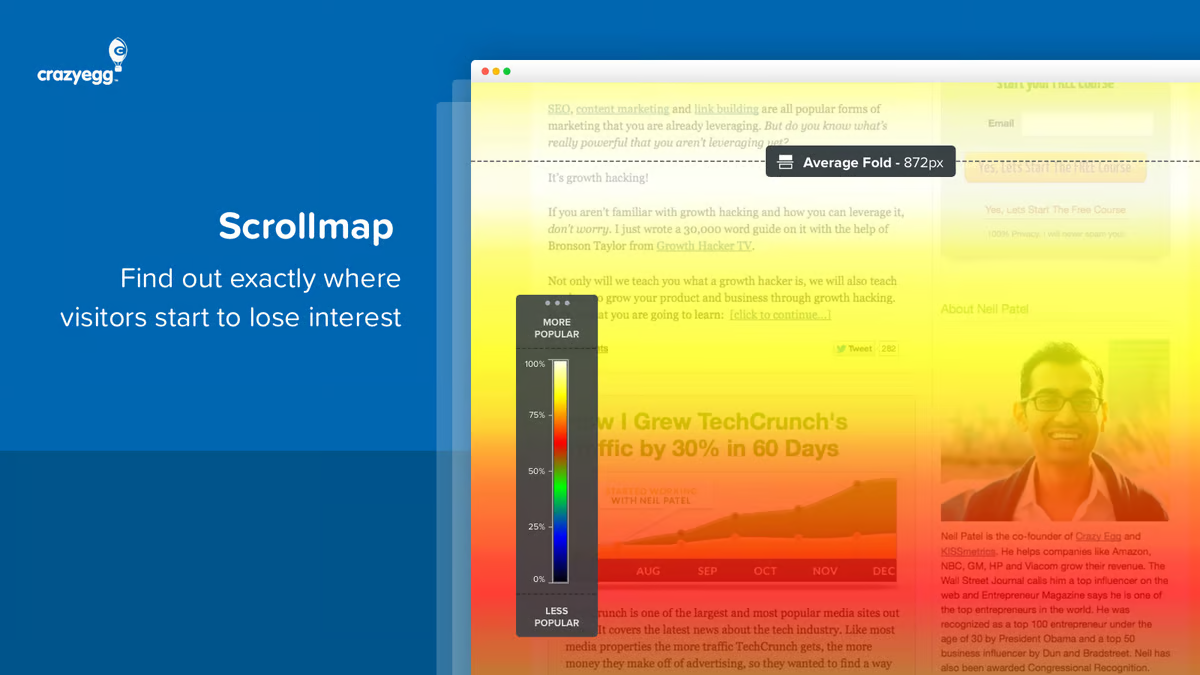
Image source: G2
Conversely, click maps allow you to track which parts of your site are clicked the most. Armed with this information, you can adjust your strategy to improve your conversion funnels and boost sales.
Each of the services reviewed here offers click-and-scroll maps, which function similarly on each platform.
Mouse movement maps
UX designers would want nothing more than to sit behind a person and watch how they move across your website. Since this is not really feasible and would be a little bit awkward, they rely on the next best thing: moving maps.
This type of heatmap shows you how a user moves their mouse while on your pages, which can serve as a strong indicator of which UX element seems to draw their attention the most. If their attention goes to a page segment that won’t lead them to become a customer or lead, it’s probably a good idea to rethink the page’s looks.
Hotjar and Mouseflow bring move maps to the table, while Crazy Egg and FullStory lack this type of insight. Hence, a business that wants to focus on glowing up its website would probably want to stick to Hotjar or Mouseflow.
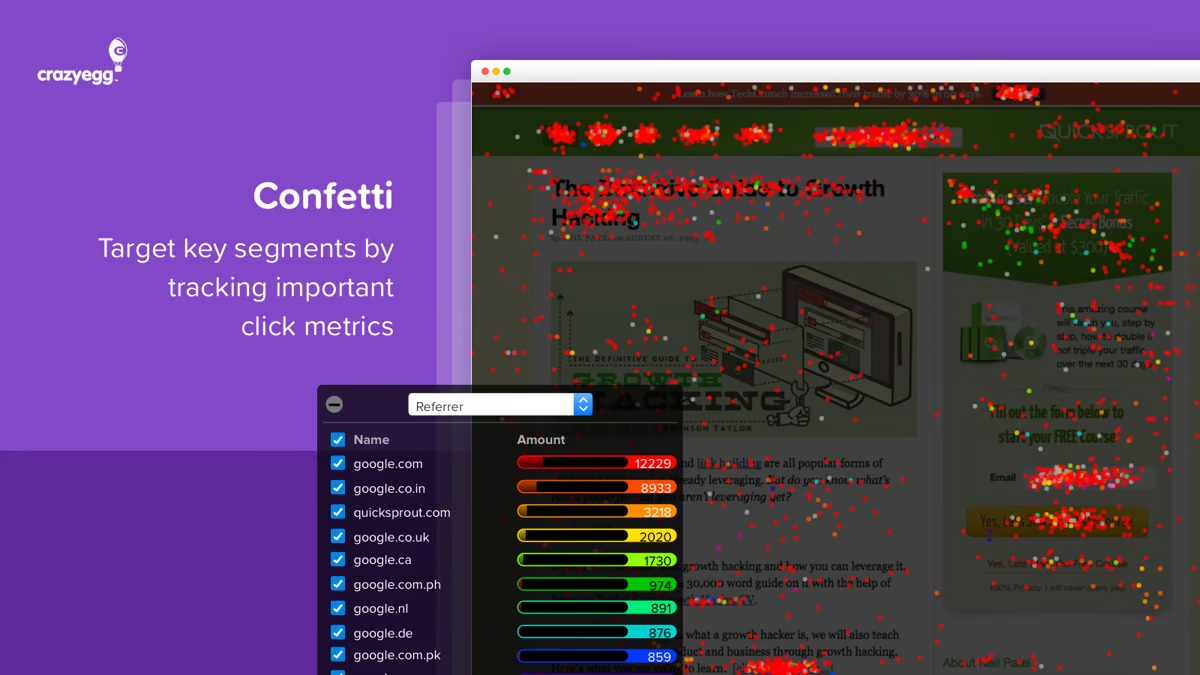
Crazy Egg: Confetti reports
Confetti reports are Crazy Egg’s unique features, as no other tool showcased here has them. These reports are upgraded click maps that tell you not only what is clicked but who is clicking as well.
Confetti reports let you segment the visitor clicks by referring source, allowing you to determine whether customers who, for example, came from Google act differently than those who come by following a link on an affiliate site. Other ways to group user clicks are by country of origin, time of day, device and browser used, and much more.
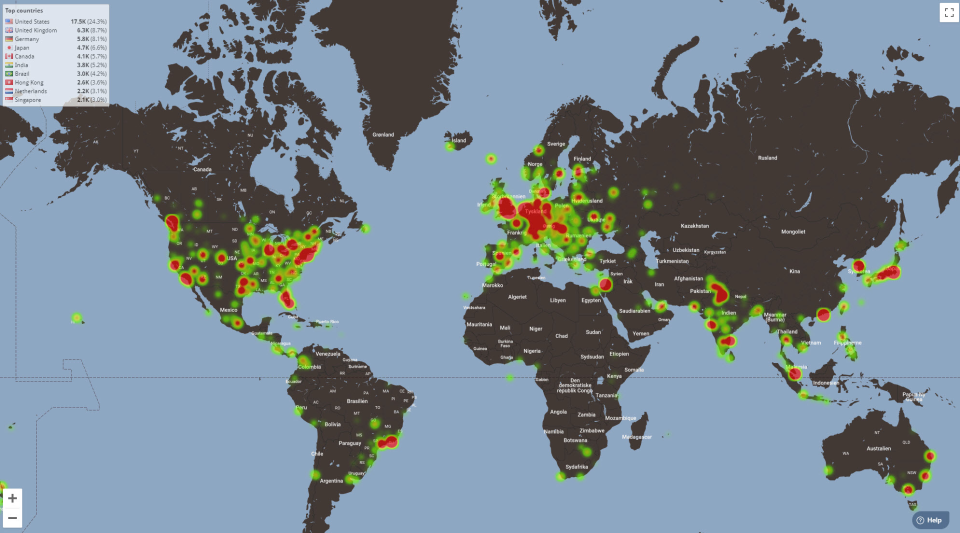
Mouseflow: Geographical and attention maps
Mouseflow’s not short on standout features either. Mouseflow offers two specialized heatmaps- geographical and attention maps.
Geographical maps tell you where most of your users are coming from, visualized through a heatmap of the world. This is one of the best features for assessing which regions to target more through marketing and to discover more potential for growth.
If American users seem particularly interested in your offer, you might want to run a dedicated marketing campaign for the region.
Attention map analytics are very similar to scroll maps, but they reveal how much time users spend looking at your content instead of showing scrolling patterns. They represent a window into what on your website holds people’s attention and what bores them or drives them away.
Read our Mouseflow vs VWO comparison to learn more.
FullSession: Click, scroll, and mouse movement maps
These visual tools show you where users are clicking, scrolling, and hovering, giving you a clear picture of how visitors interact with your site. Heatmaps highlight the most popular areas of your page in warm colors, while cooler colors indicate less interaction.
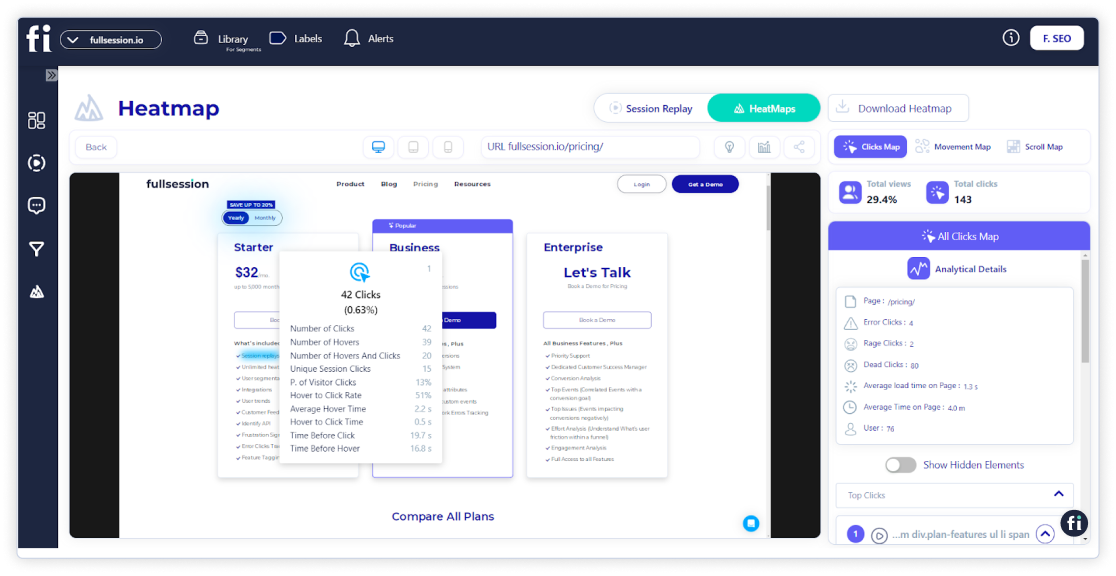
It helps you understand what draws your users’ attention. Are they clicking on a banner that doesn’t lead anywhere? Is your call-to-action button in a spot that’s frequently overlooked?
You can optimize your page layout and design for maximum engagement, which helps make sure that key elements like buttons, links, and important content are placed where they will be most effective.
Customer surveys
While statistical data and replays are a great way to understand how and why your customers interact with your websites in a certain way, sometimes the best option is to ask visitors directly.
A customer feedback tool adds a layer of certainty to your interpretation of collected data and helps you get feedback for things you couldn’t divulge through analytics alone.
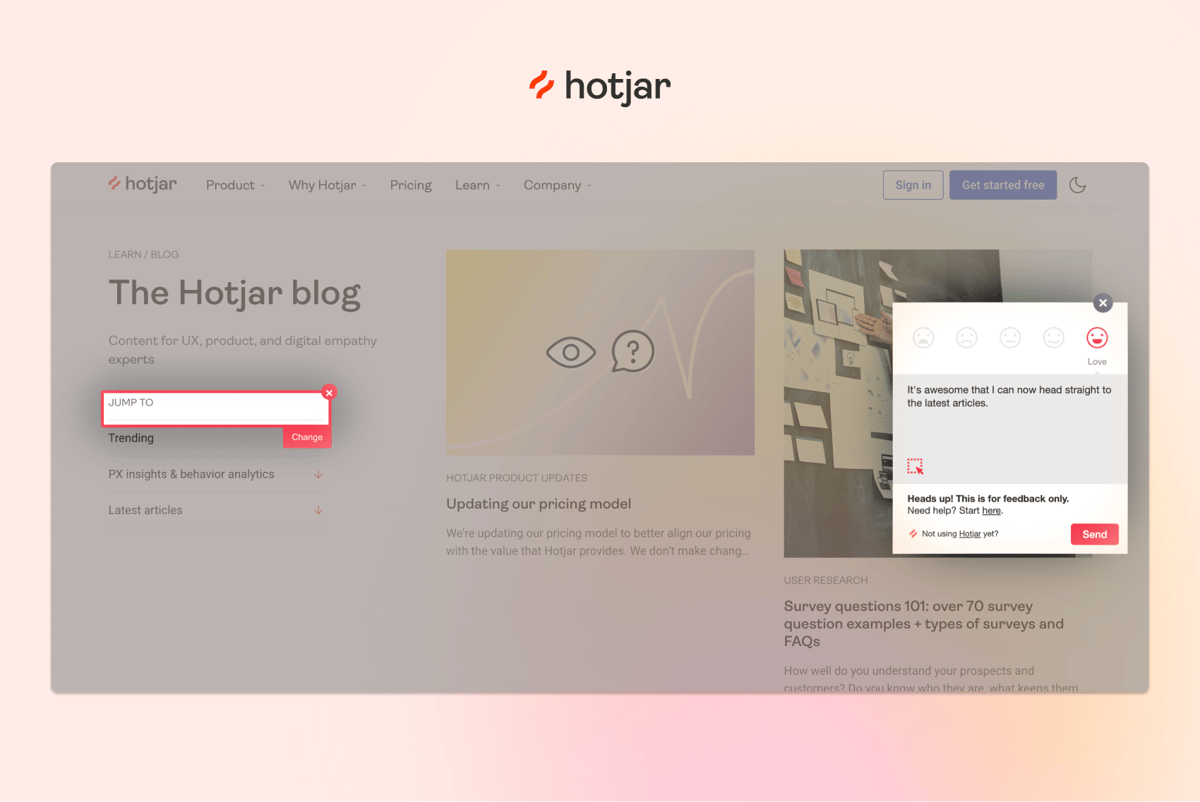
Hotjar and Mouseflow both let you run surveys and form analyses. You can target specific groups, such as those who made a purchase or customers who abandoned a shopping cart.
They are useful not only for getting direct feedback but can also serve as lead capture forms. However, not all plans will give you unlimited responses.
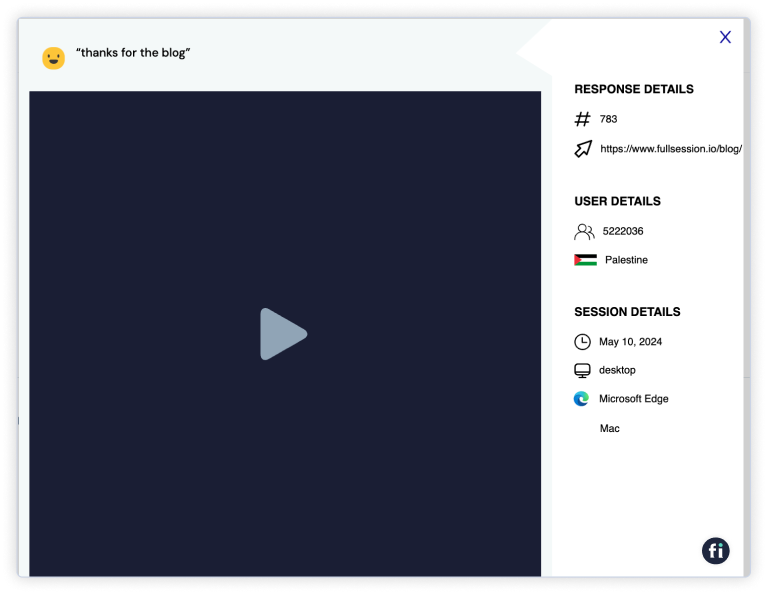
FullSession: Customer feedback with session recordings
Sometimes, the best way to understand your users is to ask them directly. Customer feedback forms allow you to gather insights straight from the source.
These forms can be customized to target specific user groups, such as those who made a purchase or those who abandoned a shopping cart. You can ask direct questions about their experience, preferences, and any issues they encounter.
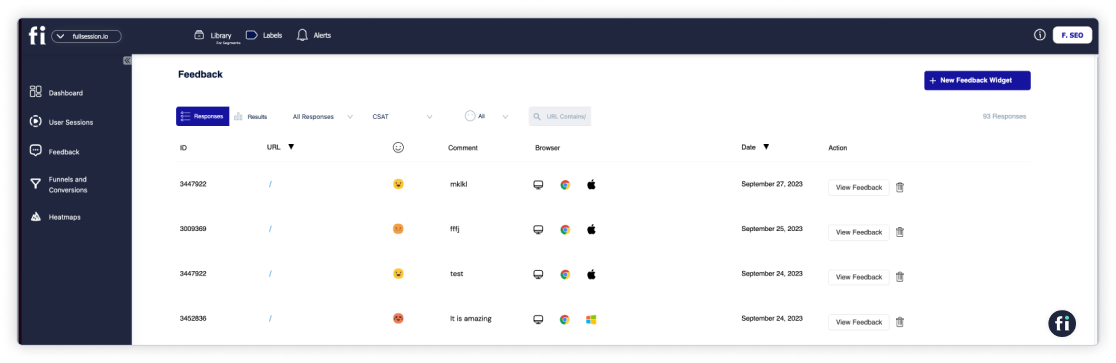
What’s more, FullSession links this feedback to specific user sessions to give you a complete picture of the context behind their responses. This combination of direct user feedback and observed behavior helps you understand not just what users are doing but why they are doing it.
Conversion funnels optimization
Conversion funnels represent your customer’s journey from first accessing your website to (hopefully) making a purchase or leaving information. However, that journey is often fraught with danger, and there are many points at which a person might disengage.
This can result from lost interest, a link that leads away from the road you want them to travel to, and so forth.
Every site that dabbles in online sales has a funnel in place, but you need to optimize it to minimize customer drop-off. This is where a traffic analysis tool can come in, helping you identify pages or parts of your pages where people leave the funnel.
While practically all data collected through web analytics software can help you improve your funnels, some platforms have dedicated tools for this.
Funnels are where these tools become more meaningfully different. Hotjar now supports funnels in the Contentsquare ecosystem, but it still feels more lightweight and insight-led than deeply analytical. Crazy Egg is useful when funnel work sits inside a CRO and experimentation workflow. Mouseflow is especially strong because it combines funnels with journey analysis, form analysis, and friction detection. Fullstory is strongest when funnel analysis needs to support product, support, or enterprise-level digital experience work.
FullSession: Conversion funnel tracking and analysis
The FullSession funnels and conversions feature offers an in-depth analysis of user journeys, which allows you to track, understand, and optimize each step of your conversion funnel.
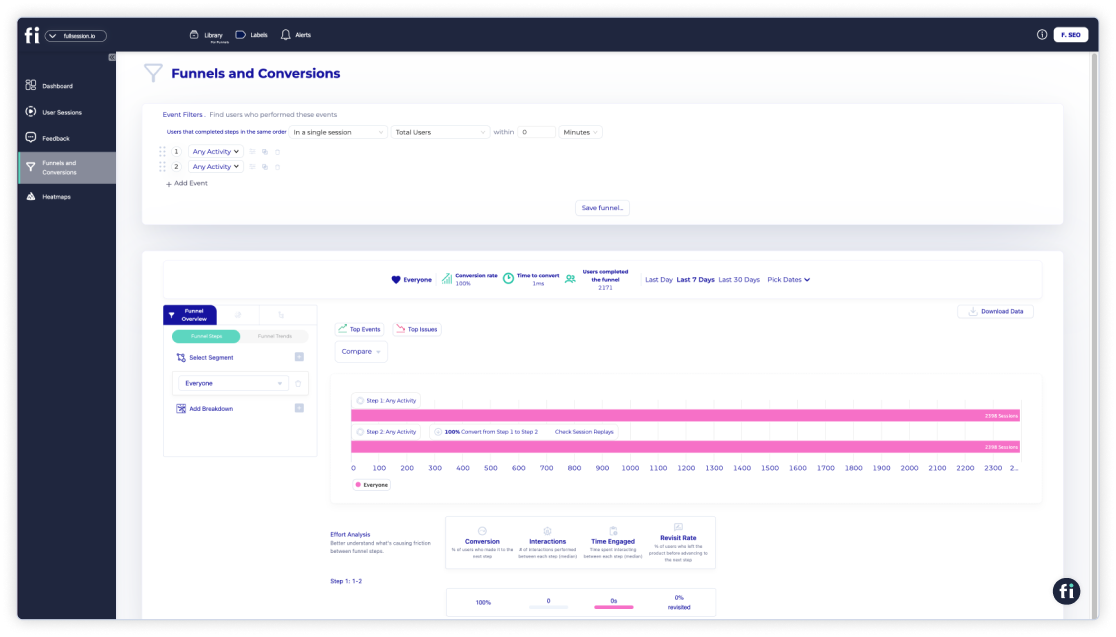
This tool is designed to identify key actions that drive conversions, pinpoint issues that cause drop-offs, and improve the overall user or customer experience. It’s also a great way to collect data on your conversion funnels without the hassle of manual tracking.
Here are the key components available on FullSession:
- Funnel steps: Picture the user progression throughout all funnel steps to better understand user behavior and gain actionable insights on how to improve user experience
- Funnel trends: Track user flow and conversion rate changes over time
- Event tracking and correlations: Pinpoint actions that increase conversions
- Effort analysis: Measure interaction time between funnel steps, improve the most engaging steps and optimize steps where users exit
- Segmentation and comparison: Compare performance across different user groups and analyze trends over various time periods
Error analysis
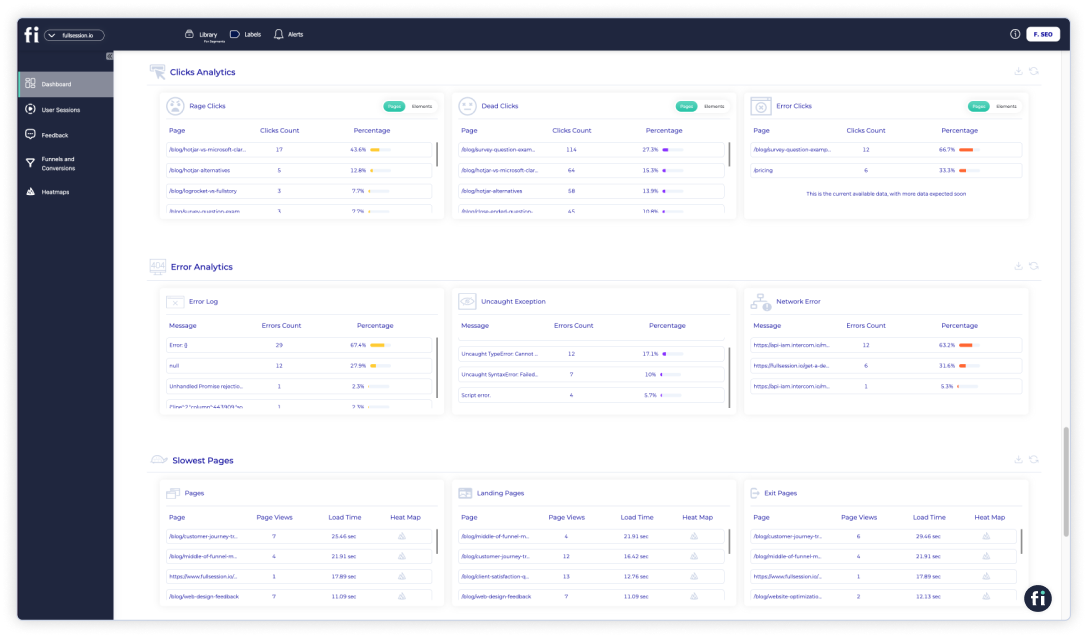
Not all web analytics tools have error tracking, but FullSession makes it a main feature.
The FullSession error analysis feature helps you identify, analyze, and resolve various errors that impact the user experience. You can leverage data on error clicks, network errors, console errors, error logs, and uncaught exceptions.
Thanks to this feature, FullSession provides actionable insights to upgrade the reliability and satisfaction of your web pages or mobile apps.
Visualize, Analyze, and Optimize with FullSession
See how to transform user data into actionable insights for peak website performance.
Hotjar vs Crazy Egg vs Mouseflow vs FullStory: Pricing
Of course, nearly every business has to factor in the pricing of these analytics tools when deciding which one to pick. Sure, every website owner wants the features that best suit them, but if that specific solution doesn’t fit your budget, you won’t be able to do much.
Let’s see how much of a dent these tools will make in your wallet.
All of these tools have similar pricing plans. You’re charged monthly, and your pricing tier determines the number of page views or replays you can capture.
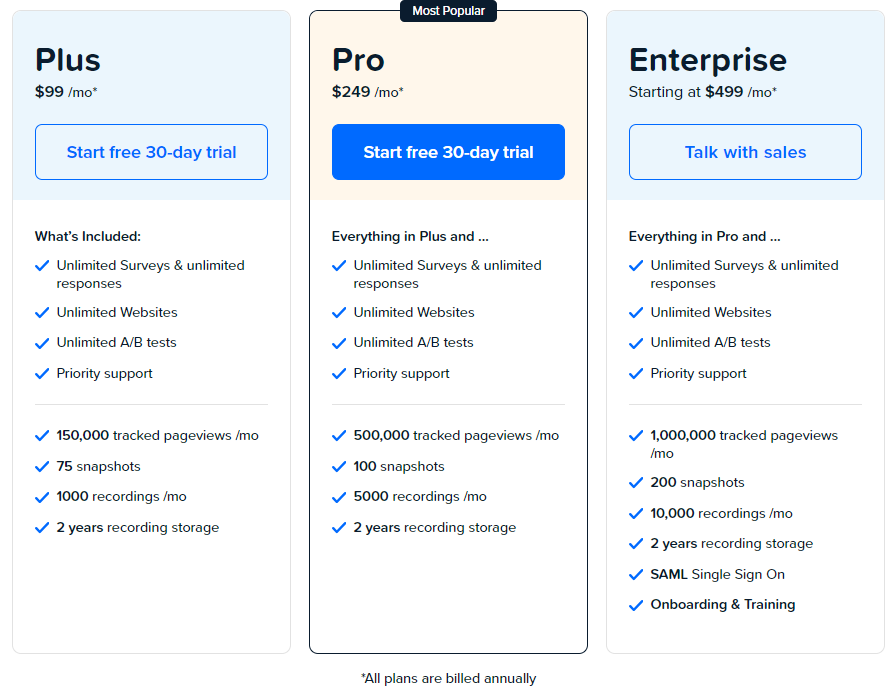
Crazy Egg pricing
Crazy Egg’s pricing starts at $99/month and goes up to $499/month for the priciest plan. Each subsequent plan brings more session replays, snapshots (heatmaps), and page views.
Crazy Egg is the only tool here without a free plan. Hence, if you’re comparing Crazy Egg to the other software, this may be a deciding factor.
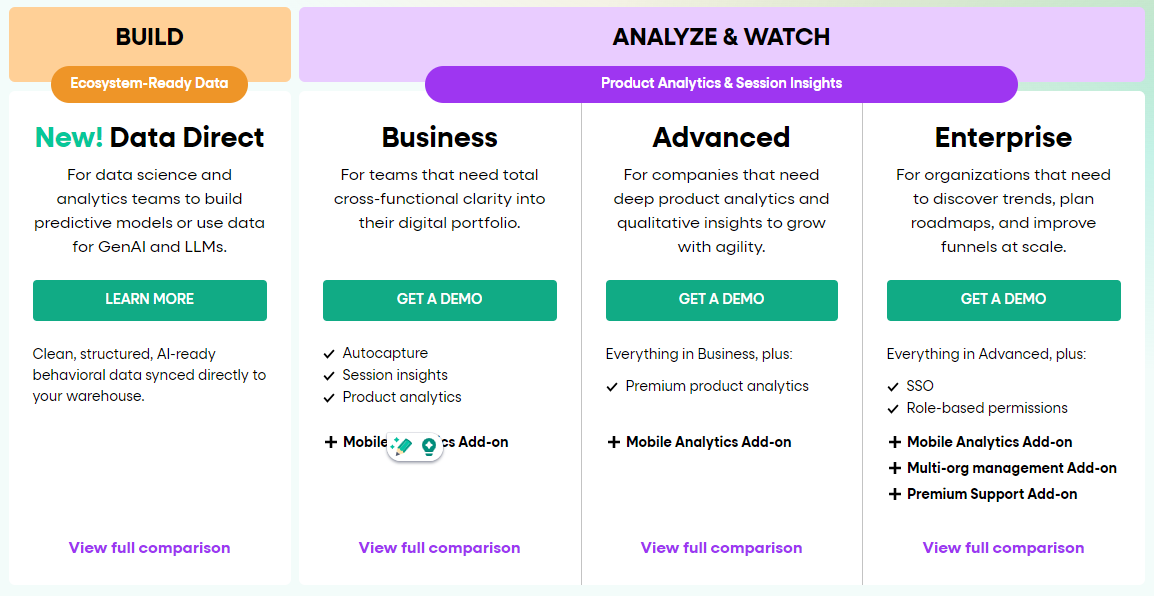
FullStory pricing
FullStory offers four paid plans with varying features. Their website doesn’t provide transparent pricing, so you will have to contact their sales team.
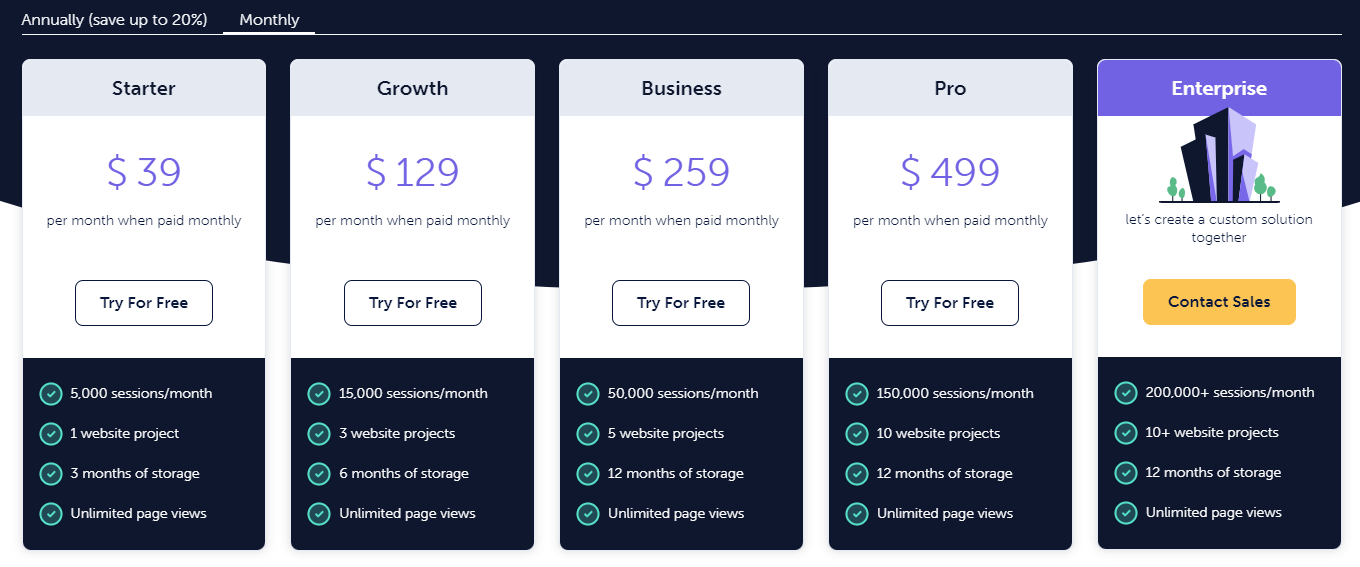
Mouseflow pricing
The software’s price starts at $39, while the biggest plan costs $499.
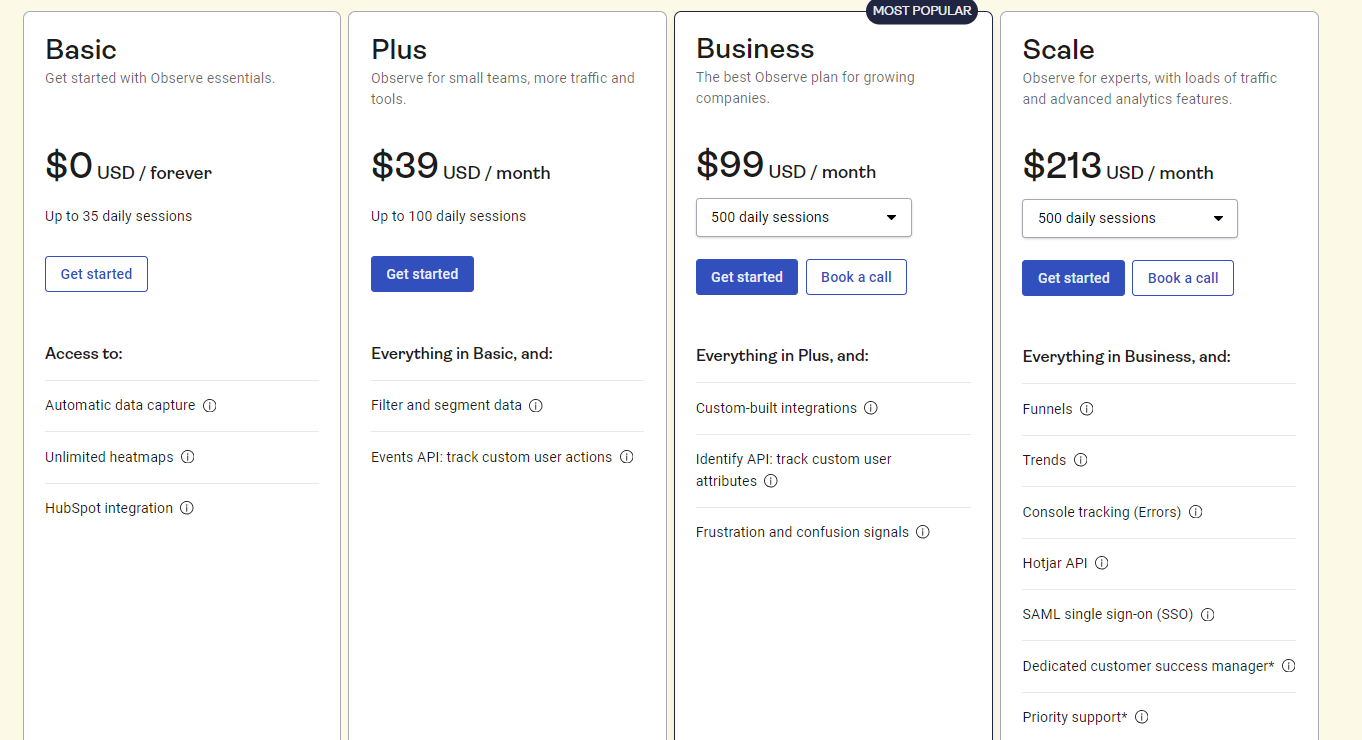
Hotjar pricing
Hotjar offers three paid plans, starting at $39 per month, which gives you about 100 daily sessions. The most expensive plan starts at $213 per month for a custom number of sessions.
Comparison Summary
At the beginning of the article, we compared the four solutions based on their pricing and capabilities. Now, after conducting our reviews, let’s see the key differences.
| Tool | Best for | Strongest advantage | Main trade-off |
|---|---|---|---|
| Hotjar | Marketers, UX researchers, small teams | Easy-to-use mix of heatmaps, recordings, surveys, and feedback | Less depth for advanced journey or enterprise analysis |
| Crazy Egg | CRO teams, landing pages, agencies | A/B testing and visual optimization workflow | Less compelling if you need deeper journey analysis |
| Mouseflow | Mid-market website teams | Strong journey analytics, form analytics, and friction insight | More analytical than some simple website teams need |
| Fullstory | Product, support, engineering, enterprise teams | Deep digital experience analytics and replay depth | Broader platform can be overkill for simpler website use cases |
| FullSession | Teams wanting replay + heatmaps + funnels + feedback + errors | Broad optimization workflow in one platform | Needs to be evaluated against your specific workflow rather than assumed as a universal default |
Hotjar vs Crazy Egg vs Mouseflow vs FullStory: Our Verdict
There is no single winner because these tools are strongest in different situations.
- Choose Hotjar if you want the easiest mix of heatmaps, recordings, surveys, and feedback. If performance overhead is part of the decision, does Hotjar slow down my site? is worth reading alongside this comparison.
- Choose Crazy Egg if you care most about CRO, visual reports, and A/B testing.
- Choose Mouseflow if you need deeper journey analysis, form analysis, and friction visibility. If that use case fits but you want to compare similar tools before deciding, review a Mouseflow alternative with session replay, heatmaps, form analytics, and friction detection.
- Choose Fullstory if your organization needs deeper digital experience analytics across product, support, engineering, or complex user journeys. If that feels too advanced or enterprise-heavy, compare other FullStory competitors before making a final decision.
The real mistake is choosing based only on brand familiarity. The better question is: which platform fits the job your team needs done most often?
Where FullSession fits
If those four tools do not fully match your workflow, FullSession is worth evaluating among Hotjar alternatives. It is especially relevant for teams that want replay, heatmaps, funnels, feedback, and error analysis in one platform.
FAQs About Hotjar vs Crazy Egg vs Mouseflow vs FullStory
Which is better, Hotjar or Crazy Egg?
Hotjar is better if you want an easy-to-use mix of heatmaps, recordings, surveys, and user feedback. Crazy Egg is better if your main goal is CRO and page optimization through visual reports and A/B testing. Choose Hotjar for broader qualitative insight and Crazy Egg for experimentation-heavy workflows.
What is the difference between Hotjar and FullStory?
Hotjar is better suited to teams that want simple website insight through heatmaps, recordings, funnels, and feedback tools. Fullstory is better suited to teams that need deeper digital experience analytics, broader replay depth, and stronger cross-team use across product, support, and engineering.
Is Mouseflow better than Hotjar?
Mouseflow is better if you need deeper journey analysis, form analytics, and friction detection. Hotjar is better if you want a simpler all-in-one tool for heatmaps, recordings, surveys, and feedback.
Does Fullstory have a free plan?
Yes. Fullstory now offers FullstoryFree, so it should no longer be described as quote-only by default.
Does Crazy Egg have a free plan?
Yes. Crazy Egg now offers a free plan and paid plans starting below the older $99 entry point still mentioned in many comparison articles.
Which tool is best for form analytics?
Mouseflow is usually the strongest fit if form performance is central to the buying decision, because form analytics and friction analysis are part of its core positioning.
-
Qualitative vs Quantitative Data: Key Differences & Examples
Your analytics dashboard says conversions dropped by 12% last week. It doesn’t explain why. That gap lies at the heart of the qualitative vs. quantitative data question. Quantitative data tells you what happened and how often, while qualitative data tells you why. Quantitative data is anything you can count or measure, such as session length…
-
Customer Journey Mapping Tools: The Complete Guide (2026)
Most customer journey maps get built once, presented in a meeting, and then quietly go stale. Customer journey mapping tools exist to stop that cycle by giving teams a shared, updatable view of how people actually move through a product or service. Some teams call the output customer journey maps; others call them user journey…
-
40 Close-Ended Question Examples For Market Research And UX
A closed-ended question is a survey question that limits respondents to a fixed set of predefined answer choices, such as yes/no, multiple-choice, or a rating scale. If you’re staring at a blank survey builder and the wording won’t come out right, our list of closed-ended question examples solves that blank-page problem fast: pick a format,…

Roman Mohren is CEO of FullSession, a privacy-first UX analytics platform offering session replay, interactive heatmaps, conversion funnels, error insights, and in-app feedback. He directly leads Product, Sales, and Customer Success, owning the full customer journey from first touch to long-term outcomes. With 25+ years in B2B SaaS, spanning venture- and PE-backed startups, public software companies, and his own ventures, Roman has built and scaled revenue teams, designed go-to-market systems, and led organizations through every growth stage from first dollar to eight-figure ARR. He writes from hands-on operator experience about UX diagnosis, conversion optimization, user onboarding, and turning behavioral data into measurable business impact.