It takes 0.05 seconds for a user to form an opinion about a web page. So, how do you make sure your visitors get the best user journey possible?
You must stay ahead of your competitors and use all available tools to learn more about your customers and how they interact with your website. And there’s no better way to analyze their behavior than using interactive heatmaps.
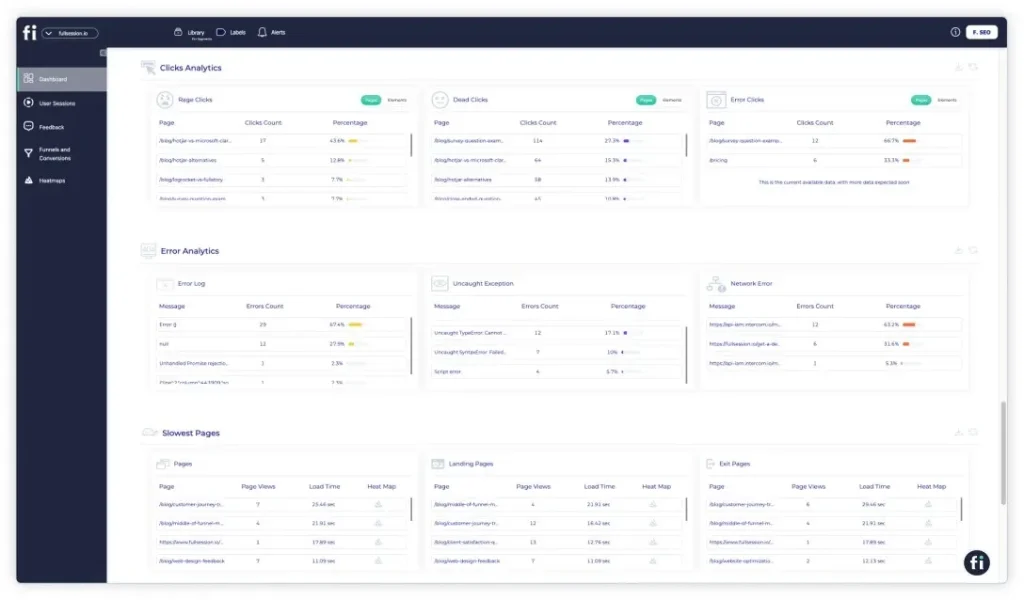
Heatmaps can help you understand how well your website navigation works. They can tell you how easily visitors find the information they want on your website and what content you can improve on your site. That’s why you need heatmap software.
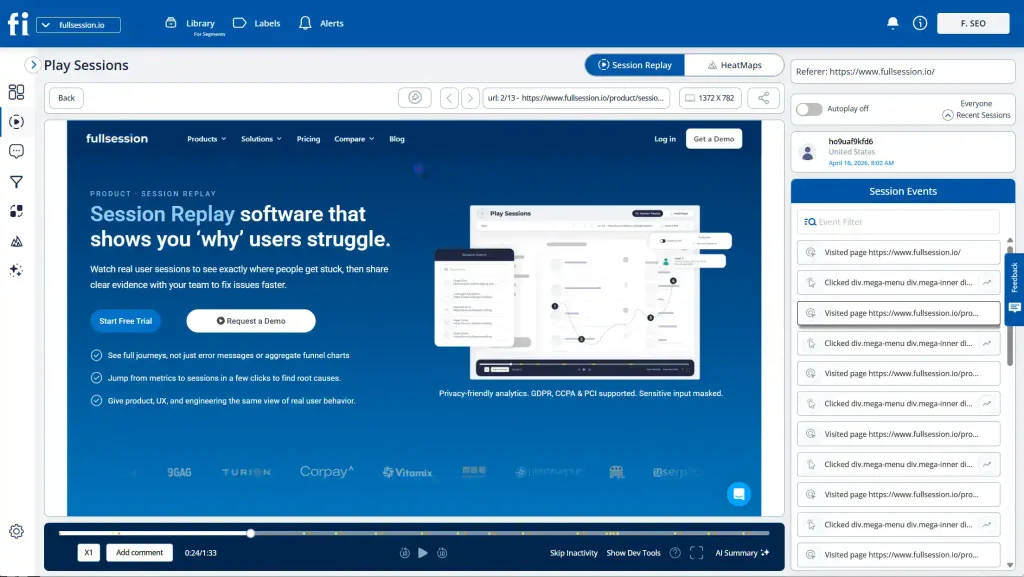
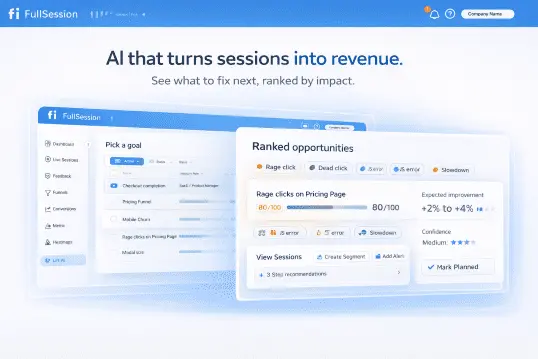
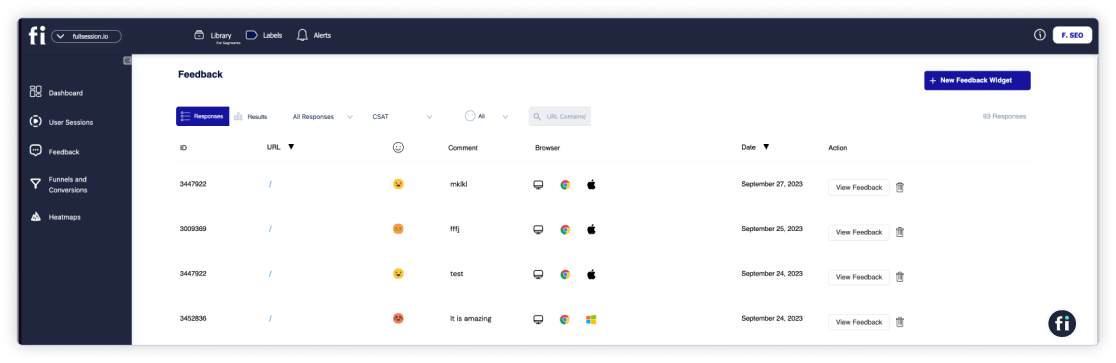
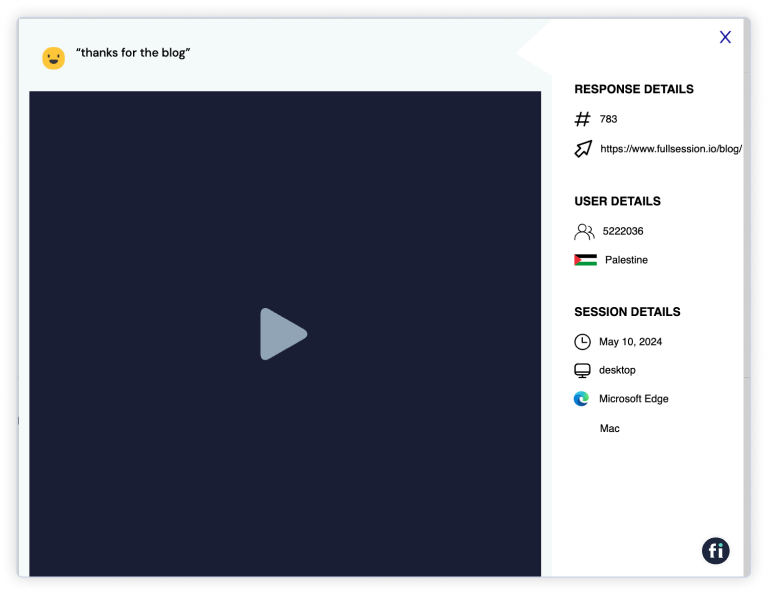
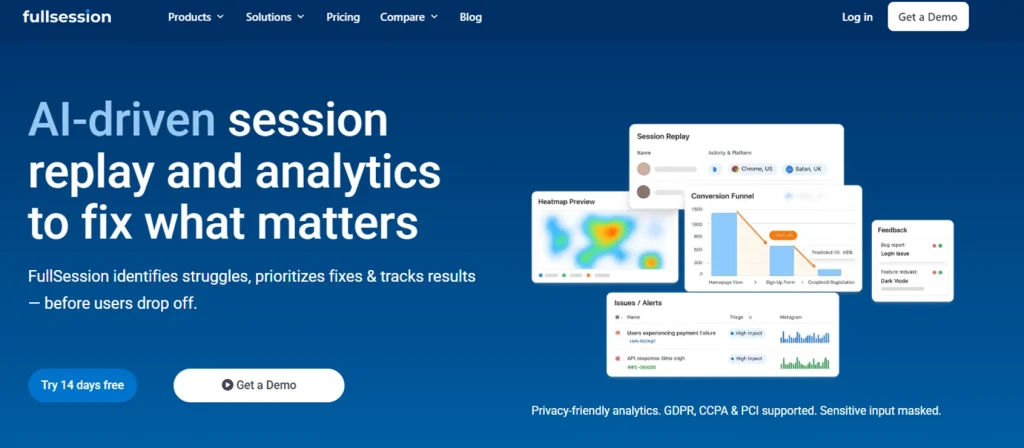
FullSession is an advanced user behavior analytics software that provides comprehensivebehavior analytics tools, such as heatmaps, session replays, incoming feedback, conversion funnel analysis, and error analysis to capture user activity and obtain data to improve your website and online campaigns.
In this article, we’ll go over what website heatmap tools are and how to use them on your website. We’ll also cover when you should use a heatmap and its benefits. You’ll learn what data it collects and how to interpret it.
Let’s start with the basics.
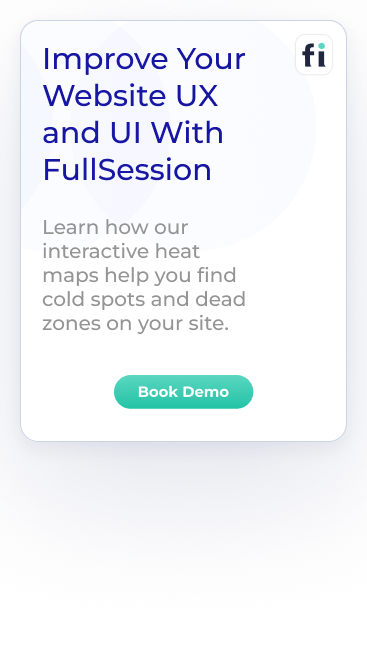
Improve Your Website UX and UI With FullSession
Learn how our interactive heat maps help you find cold spots and dead zones on your site.
What Is a Website Heatmap?
A heatmap is a user behavior tool that shows how users interact with your web pages. It can provide valuable insights into user engagement, user experience, and the effectiveness of your user interface.
Imagine working on an e-commerce website and wanting to know which sections of the site visitors spend the most time on. This is where a heatmap can help.
If you’re looking to improve your conversion rates, keep reading our tips on analyzing these charts and what information they can reveal about your site.
When Should You Use a Heatmap?
Customer experience teams usually use heat maps when they notice the poor performance of certain elements and campaigns or want to test new features. However, you don’t necessarily have to use them exclusively for these types of activities.
Some other use cases include:
- Diagnosing which elements and sections perform best
- Checking which features and sections have average performance and need improvement
- Deciding the best page length
- Learning behavior patterns
- Identifying the points where users exit the page or drop off the funnel
- Identifying broken links, false bottoms, and non-clickable elements that lead to dead clicks
Where Should You Use a Heatmap?
Heat mapping your whole website seems ideal, but it’s not practical. Instead, we recommend analyzing pages that have the most impact on your conversion rates.
Home pages
Yourhomepage is your introduction to your brand. If you monitor where visitors are scrolling through and whether they’re hovering over key information and clicking on links, then you’ll know exactly where to place the most important elements. It will reduce you rbounce rate and increase your conversion rate.
Landing pages
It’s also important to implement heat maps on landing pages and consider user behavior for the best conversion rate. Heat maps show you where your visitors are looking on your website to help you design the best landing page and acquire more leads ready to convert. For ecommerce teams, comparing the best heatmap tools for ecommerce can also help connect landing page behavior with checkout friction and conversion drop-offs.
The whole purpose of landing pages is direct conversions, so if you notice that conversions have been low recently, a graphical representation of where users click and scroll can help you diagnose any issues.
High-traffic blog posts
The copy placement on your blog can heavily influence its conversion rate. You can use heatmap data to test where to place your CTAs on your blog post.
For example, you can place the same CTA in the middle of the post and after the conclusion. Heatmaps will show you which CTAs users interacted with the most. Then, you can apply that knowledge to other blog posts to maximize conversions.
Importance of desktop and mobile heatmaps
It’s important to use heatmaps on different devices to identify potential issues. Your audience is segmented into mobile and desktop users.
To deliver the best results for your visitors, analyze both desktop and mobile versions of your websites carefully. This will improve conversions and ensure a positive experience for your customers on desktop and mobile devices.
You can also use heatmaps to picture the importance of different features, where every column represents a feature, and the corresponding color signifies their level of importance.
How Does a Heatmap Work?
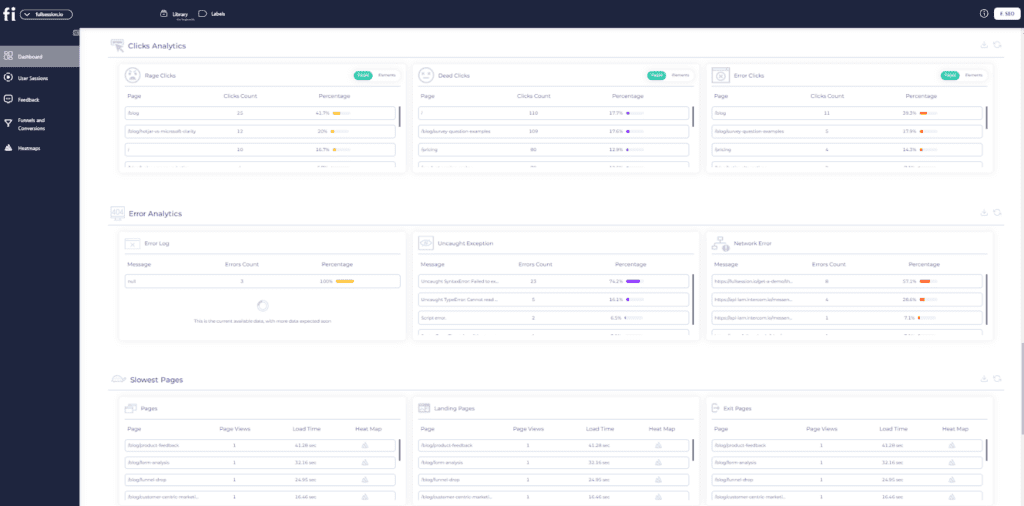
Heatmap tool track user interactions on a webpage. This can include user clicks, mouse movements, scrolling, and other forms of engagement. Then, a small JavaScript snippet is embedded in the web page’s code, which collects interaction data and sends it to the heatmap tool’s servers.
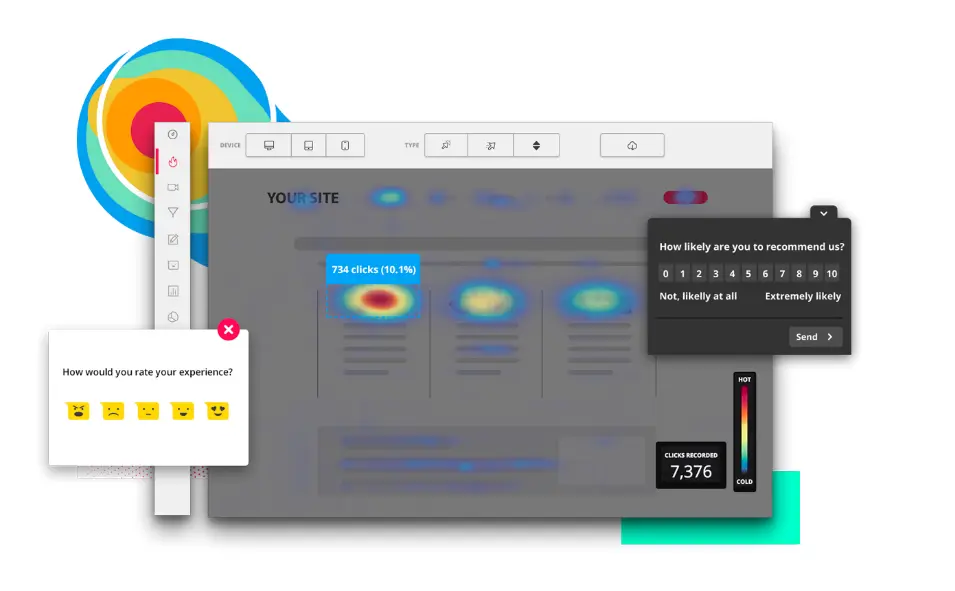
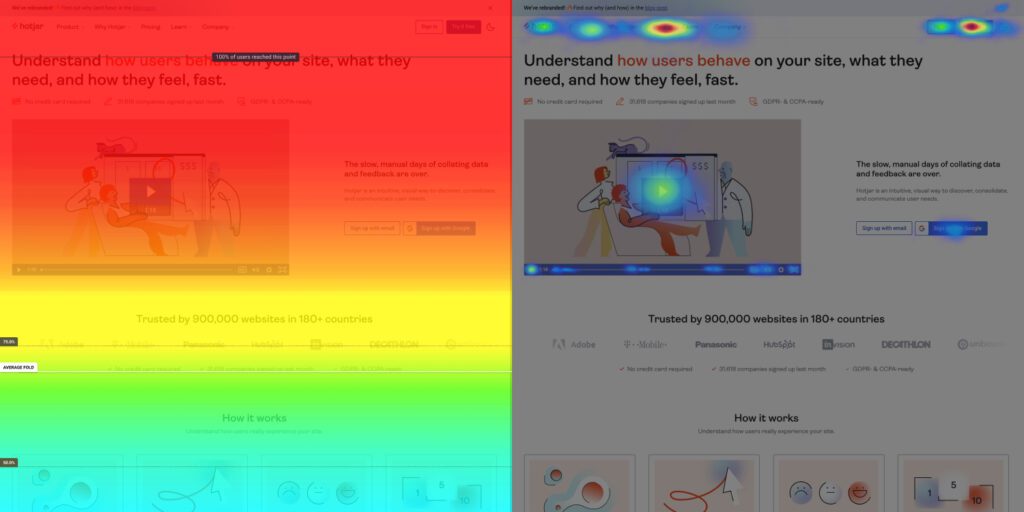
Once it collects the information, heatmaps visualize individual values in grid cells. Generally, areas with higher interaction or larger values are shown in warmer colors (reds and oranges), while areas with less interaction or smaller values are shown in cooler colors (blues and greens).
Cell value annotations display the numeric values directly on the heatmap, which helps provide a clear view of interaction density.
The average cell value provides insight into the typical number of clicks per area, while cell value annotations display these numbers directly on the heatmap.
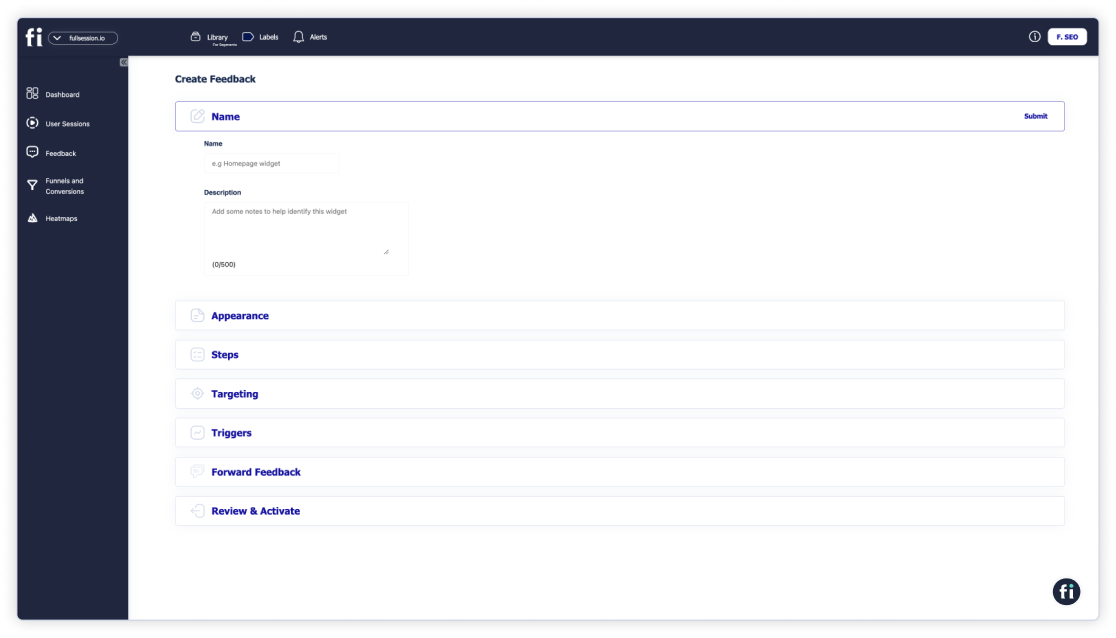
How Do I Create a Website Heatmap?
Creating a website heatmap is very easy and only takes a couple of minutes if you’re using advanced website heatmap tools like FullSession.
Book a demo today to see how easy it is.
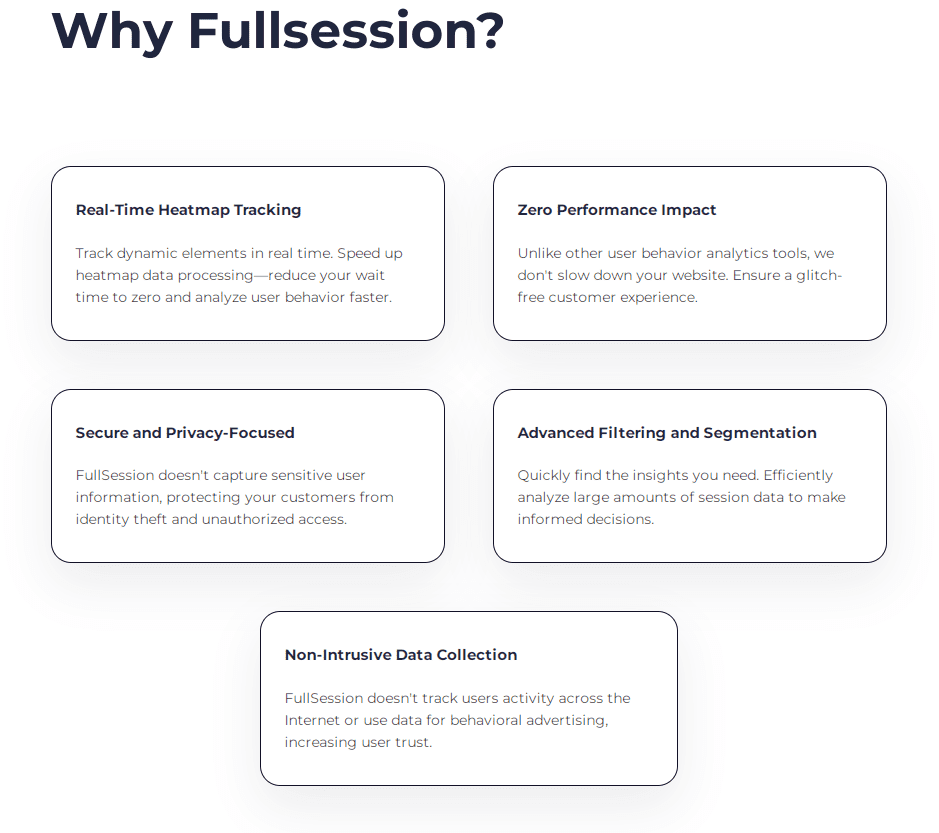
What sets FullSession apart from competitors is our heatmap feature, delivering real-time insights, without any waiting time for data processing.
Even though heat maps are notorious for slowing down websites, FullSession’s interactive heat maps won’t impact your site performance. We also offer additional analysis tools you can combine with heat maps to look for various user behavior patterns and discover what users love and hate about your site:
- Session recordings
- Customer feedback tool
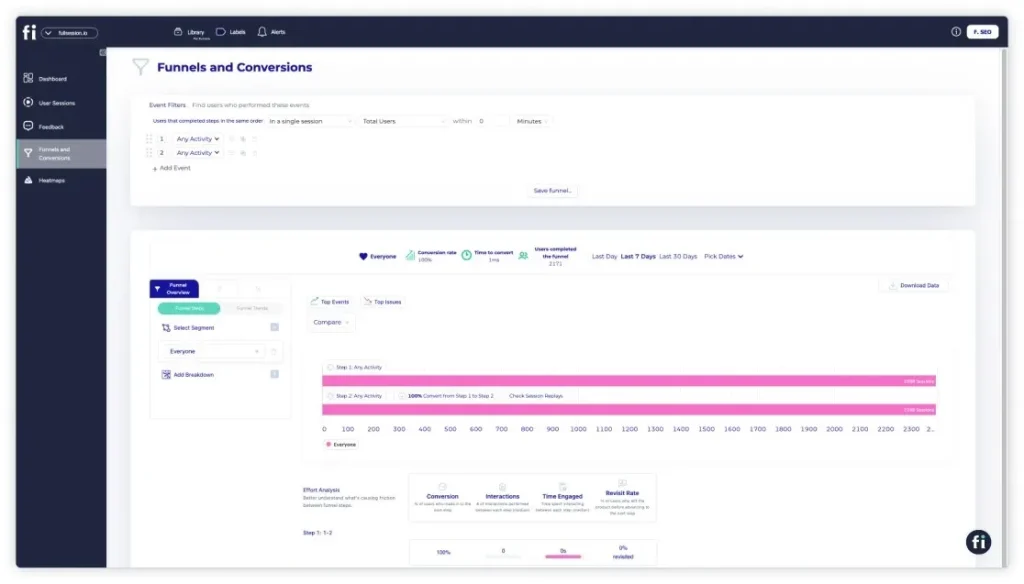
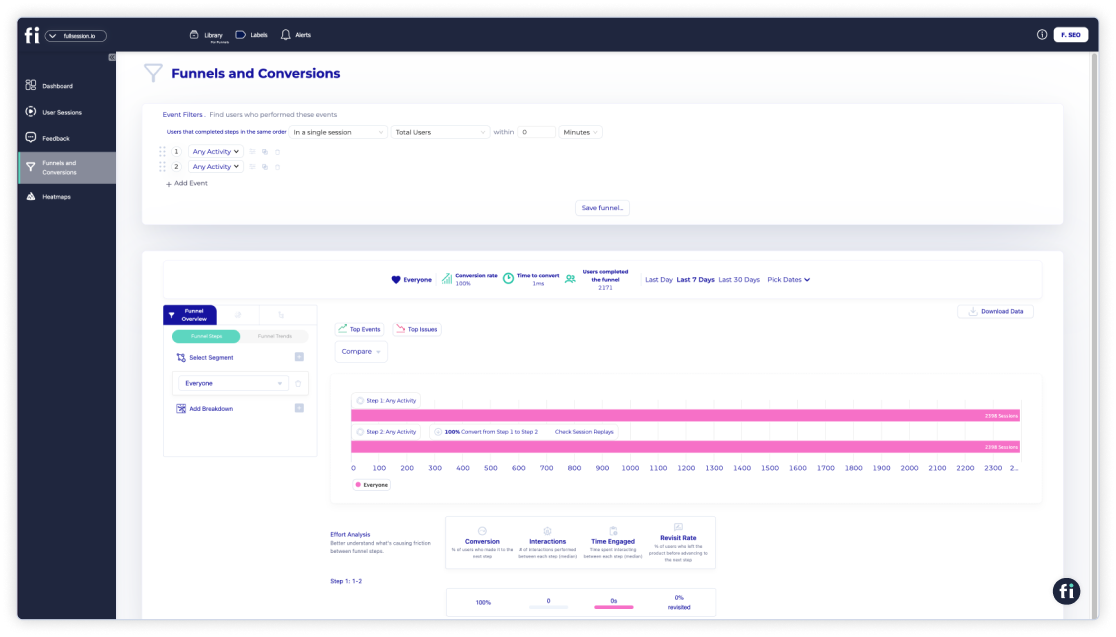
- Conversion funnel analysis
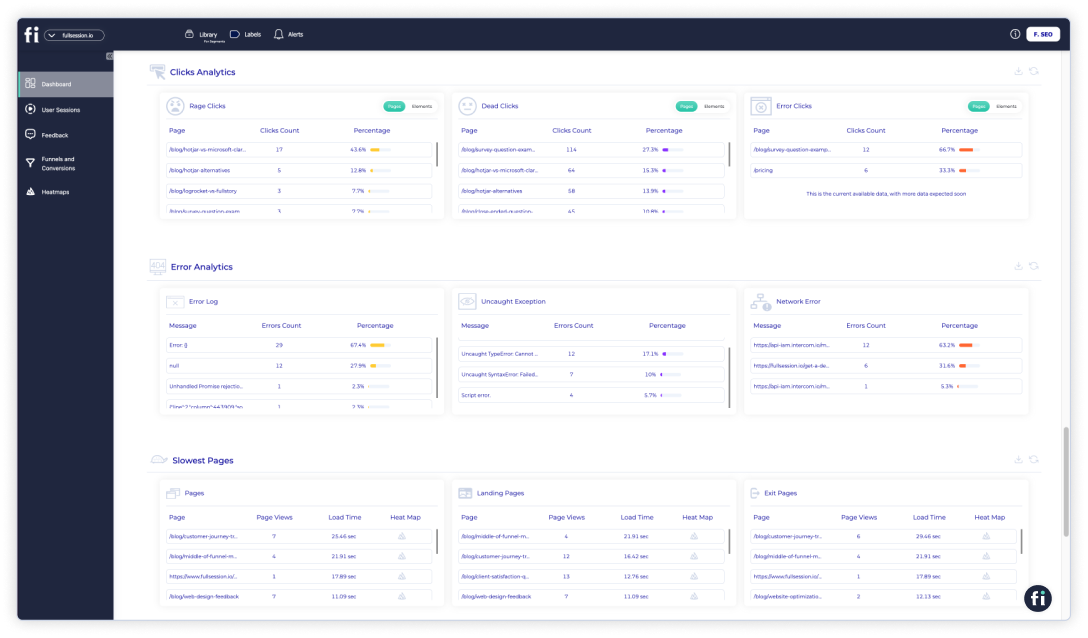
- Error analysis
5 Different Types of Heatmaps
There are many different types of heat maps, each analyzing a specific type of behavior. Let’s explore the five most common heat map types.
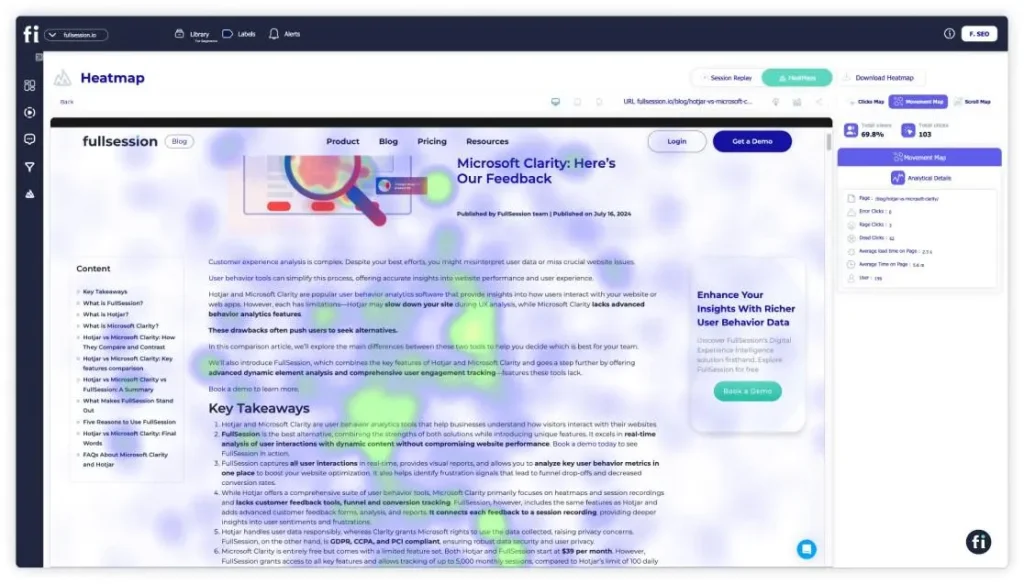
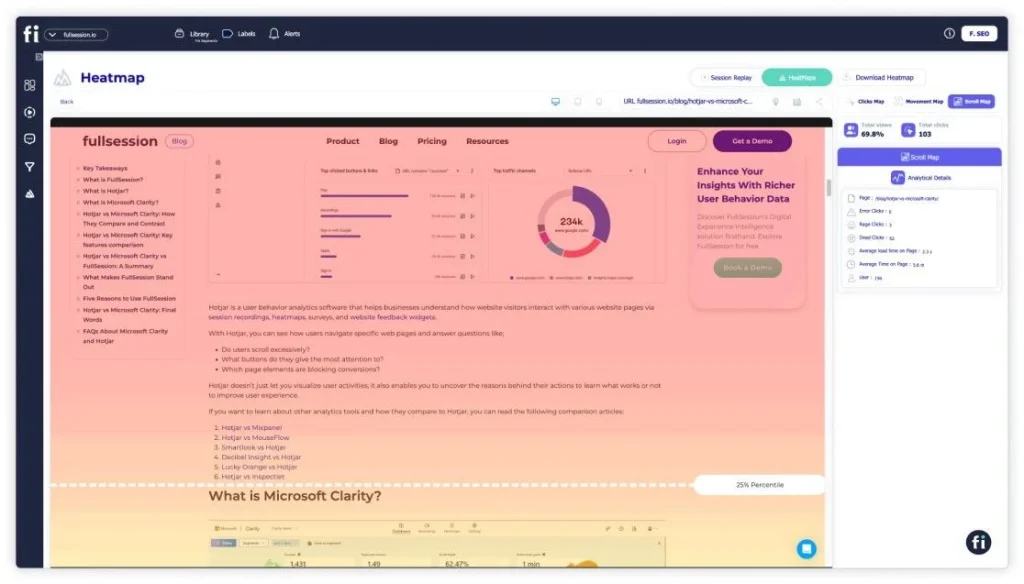
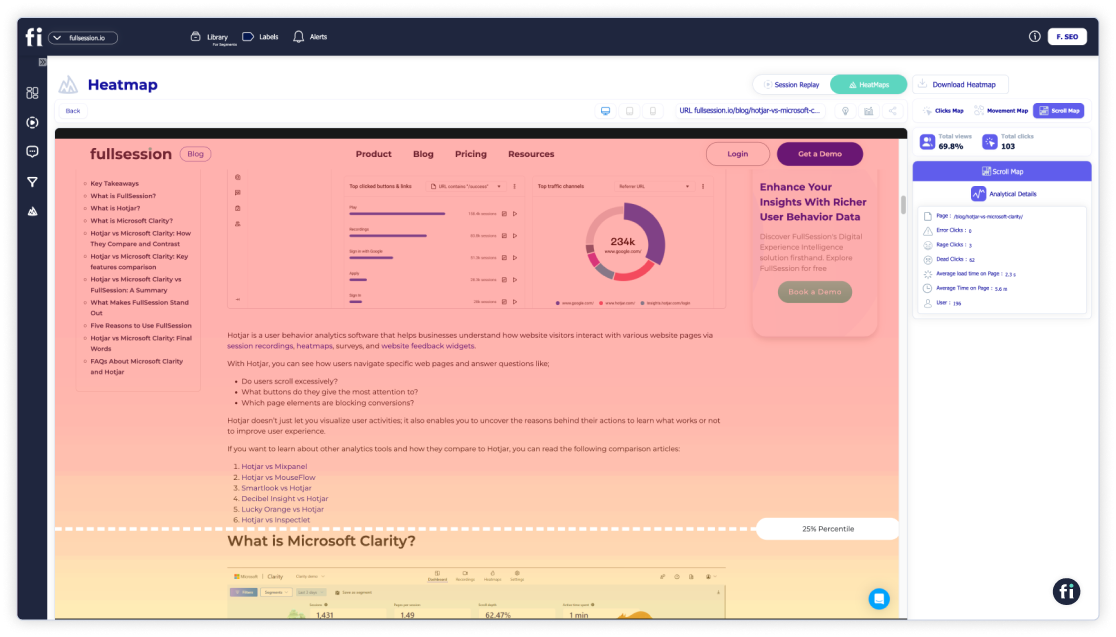
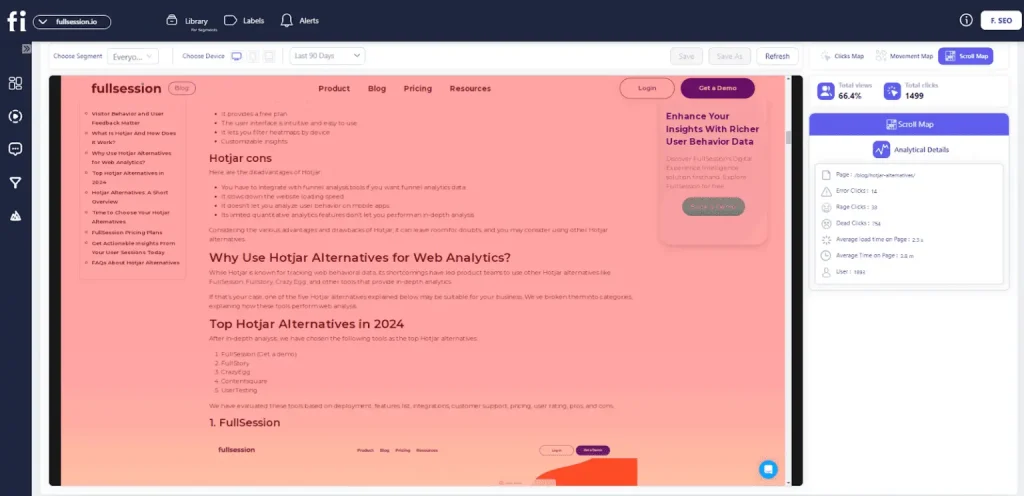
1. Scroll maps
FullSession offers scroll maps that show your website visitors’ scrolling activity.
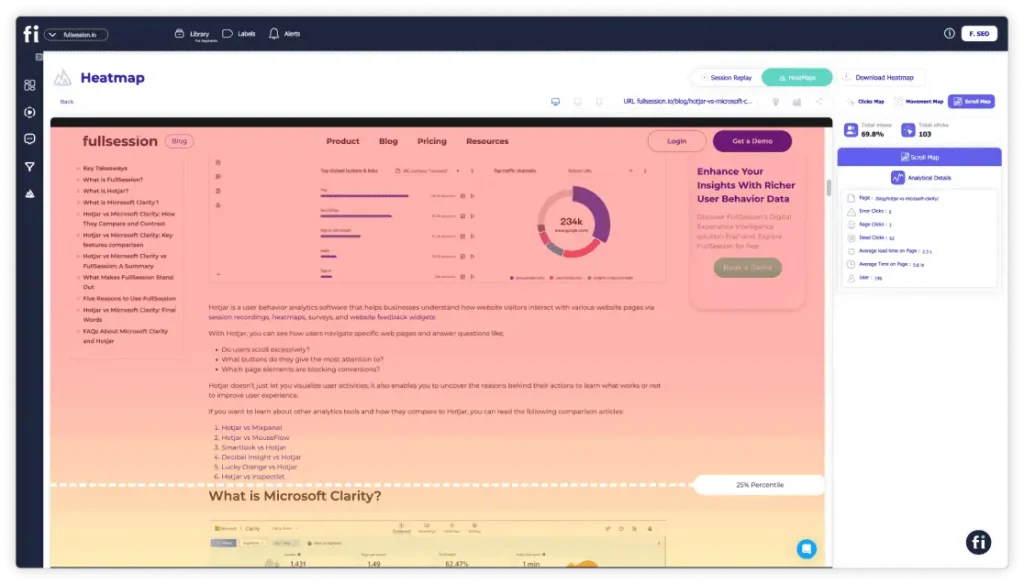
Scroll maps allow you to see exactly how your audience interacts with your site, helping you identify content gaps and optimize your website for greater success. The y-axis represents the scroll depth, while the x-axis might represent time or the percentage of users reaching a certain scroll depth.
Dynamic scroll heatmaps also let you know which parts of the site your visitors are interested in. Scroll maps help you position the most important sections of your website in highly visible areas, ensuring customers engage with critical information on key pages, such as product pages.
With a scroll heatmap, you can learn about your website’s heat zone from top to bottom. The hottest colors on the scroll map indicate which sections are most viewed. The scroll map consists of three main components: peaks, troughs, and layout grid.
Peaks indicate where users stop scrolling. Troughs show where users stop due to poor user experience, such as excessive ads or navigational problems. A layout grid divides the page into columns to measure the scrolling activity within each column.
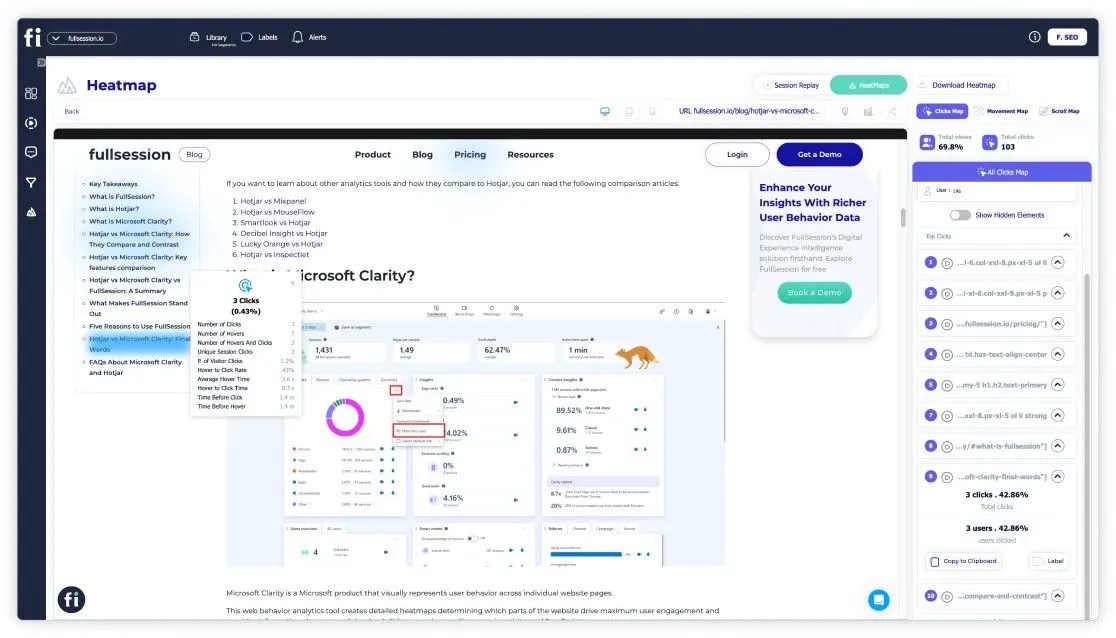
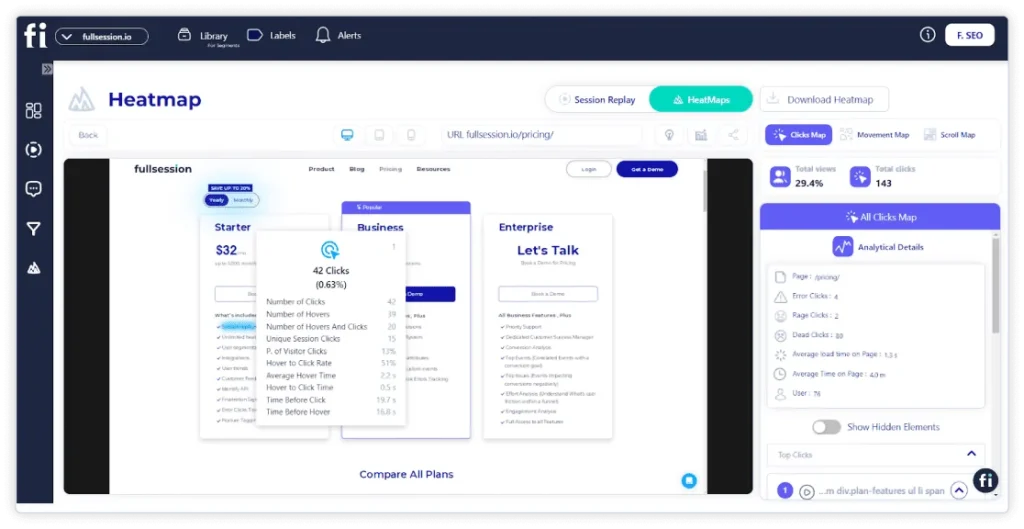
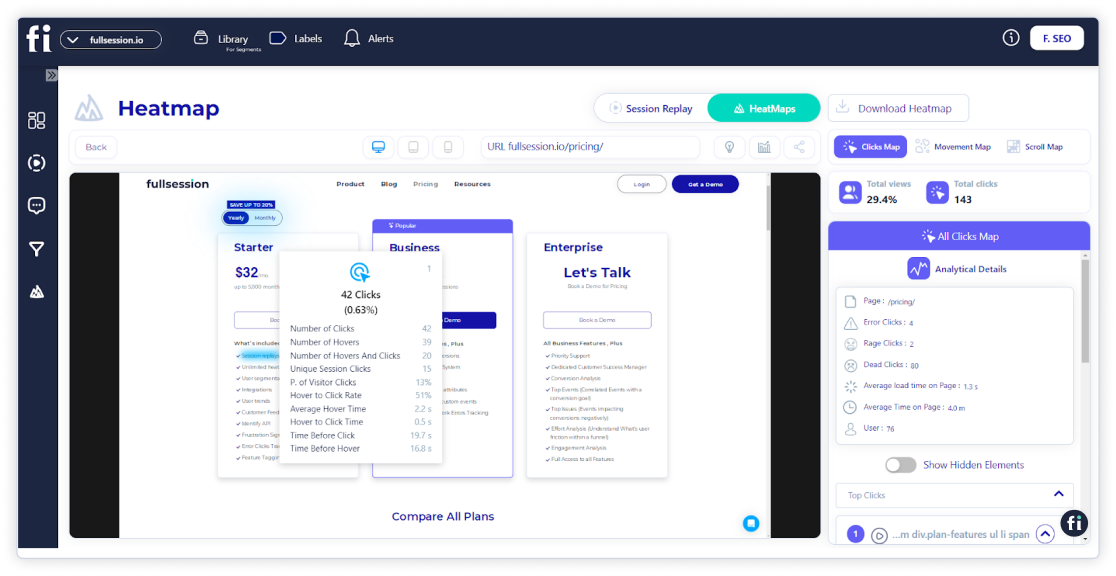
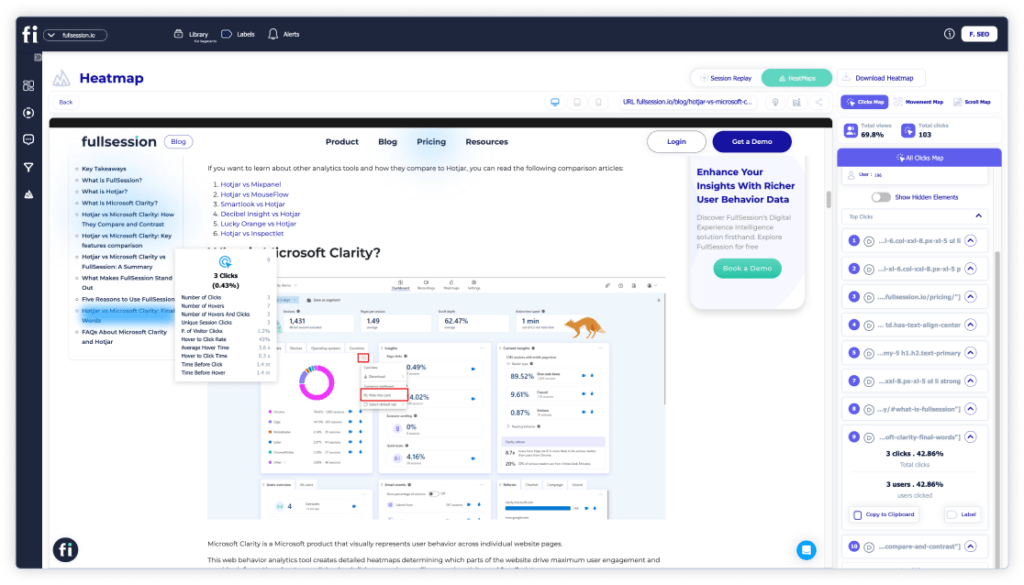
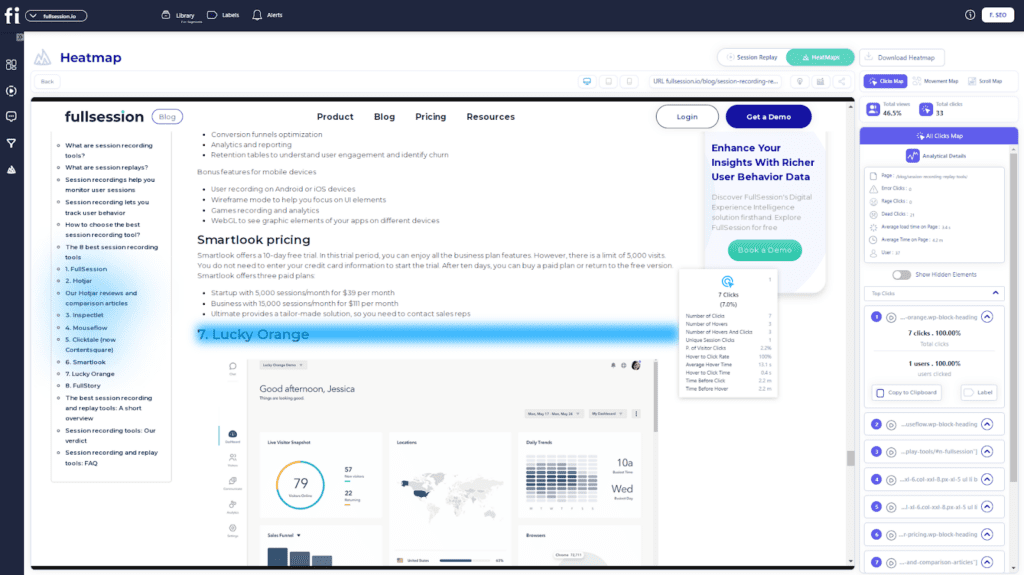
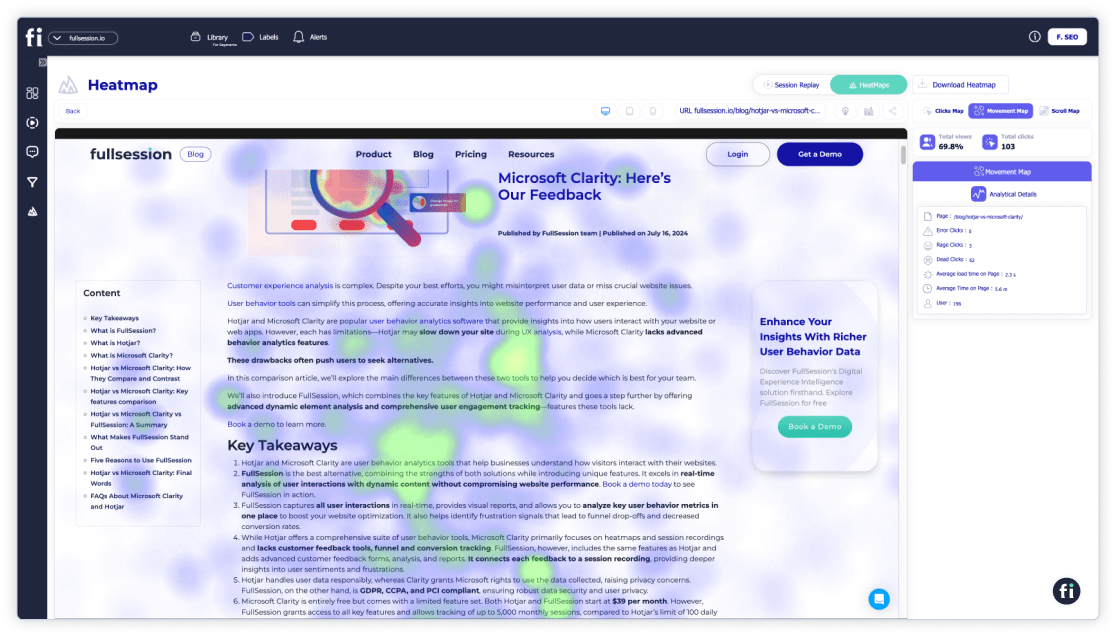
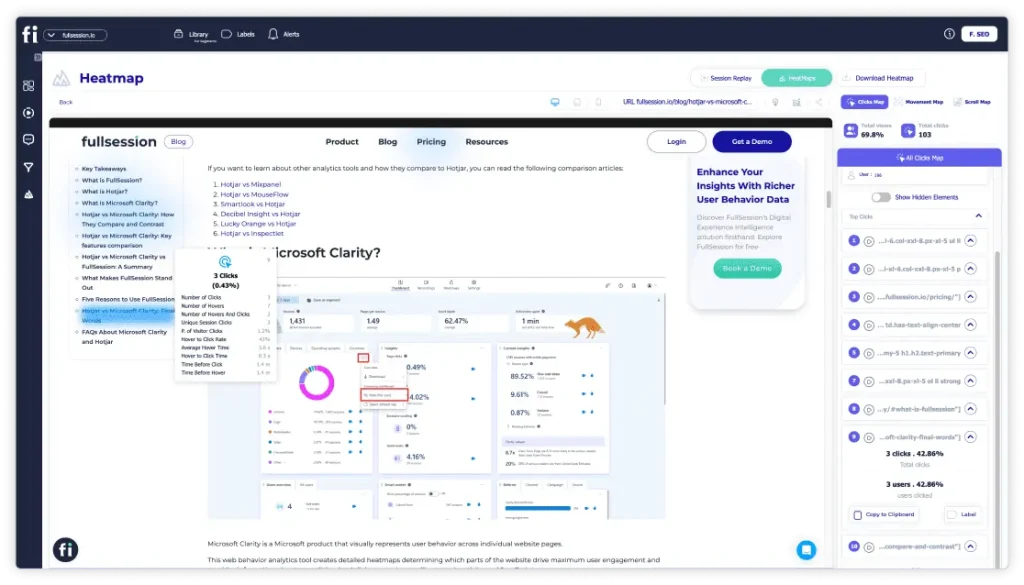
2. Click maps
With FullSession, you can also use click heatmaps to visualize your visitors’ clicking patterns. The vertical axis displays the horizontal position of clicks, while the horizontal axis shows the vertical position.
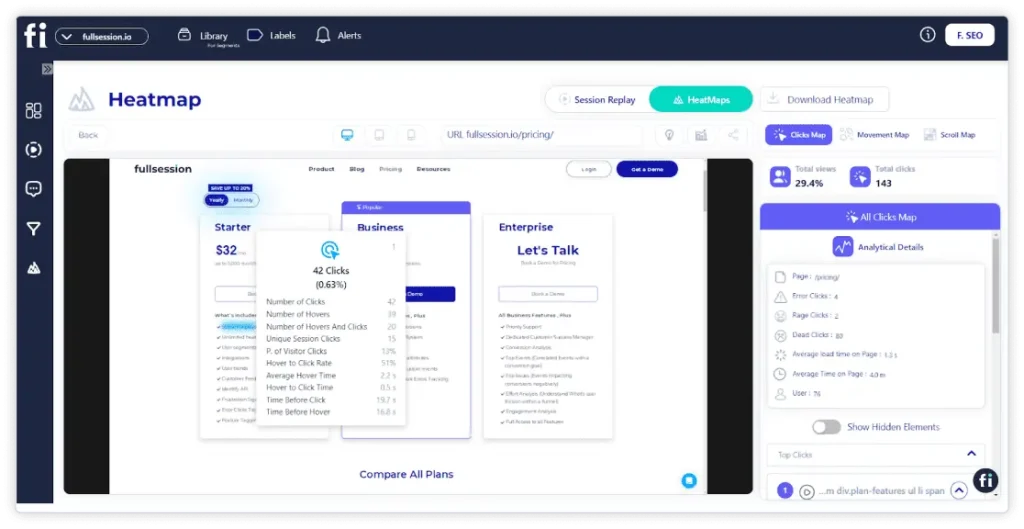
The color intensity on the heatmap changes according to the frequency of clicks at specific coordinates. Each click is recorded as a data point with a numeric value that represents the number of clicks at a particular spot on the webpage.
With a click sensor, heatmaps can detect where and how many times visitors click on the website. Click heatmaps reveal valuable information to website owners through data visualization.
FullSession also lets you get deeper user insights on each click heatmap, such as error clicks, rage clicks, average time on page, and more.
Click tracking allows you to analyze visitor behavior during a website visit to optimize the user experience. This simple tool helps you increase conversion rates, decrease bounce rates, and improve landing pages and content design.
This type of data analysis ensures that visitors engage positively with your blog, website, app, or landing page. One of the best ways is to check for clicks and scrolls before bouncing. If you see a few clicks and scrolls, your visitor might have found an issue with the colors, layout, headline, images, or some other element of your content.
3. Eye-tracking heat maps
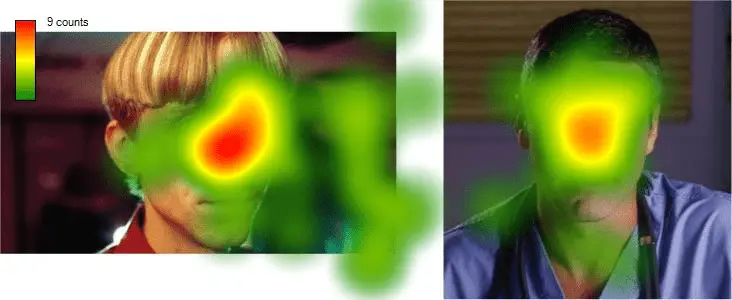
Image source: 90 Percent On Everything
Eye-tracking heatmaps allow designers to identify which page elements visitors find most and least engaging.
They also help pinpoint redundant or confusing elements by showing where users focus their attention. You can use this data to optimize content and determine the most effective page layout.
Eye-tracking heatmaps significantly reduce the user’s cognitive load, enabling you to identify areas of your website that may need further review or redesign, with results visually represented in a heatmap color code.
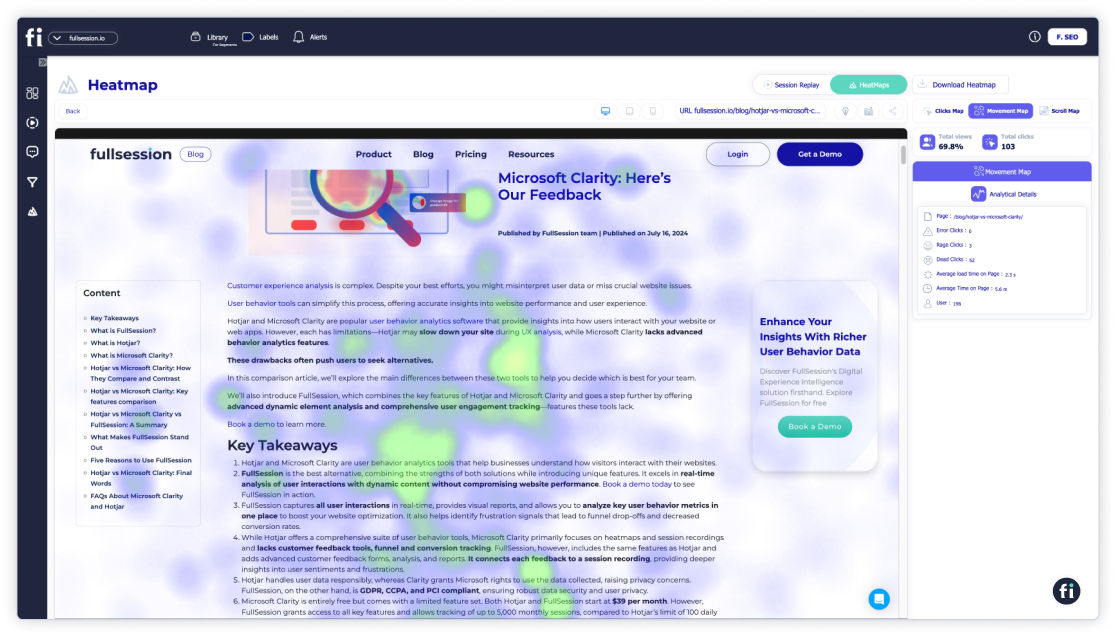
4. Mouse-tracking heat maps
FullSession provides mouse heatmaps, a form of data visualization that captures where your visitors are clicking, scrolling, and hovering the most.
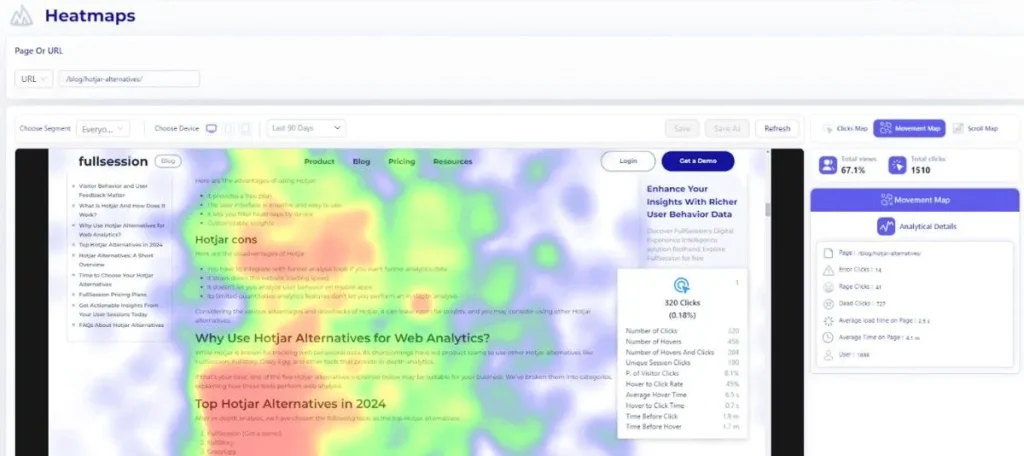
Analyzing mouse heatmaps can help you pinpoint areas where visitors experience high levels of frustration or struggle, identify unique behavior patterns, and determine opportunities for web optimization.
Mouse heatmap navigation enables designers and marketers to understand the preferred reading regions of your website visitors, highlighting areas where users either avoid clicking or spend the most time exploring content.
Your team can assess which web pages perform well and decide which ones need optimization.
A categorical axis variable, made up of discrete categories or labels, is used instead of continuous numerical values. Each category represents a distinct group or type, such as different products, user segments, or webpage elements. When tracking movement within various sections of a webpage (e.g., header, footer, sidebar), these sections can be categorized along the axes for more precise analysis.
5. Correlation heatmap
A correlation heatmap is a visual representation that shows the correlation between two variables in a dataset. It uses colors to indicate the strength and direction of the relationships between multiple variables, making it easier to identify patterns and relationships at a glance.
Typically, lighter colors indicate a positive correlation, while darker colors signify a negative correlation.
Correlation heatmaps are created by collecting data for the axis variables you wish to analyze, including any measurable data, such as sales figures, temperatures, and user interactions.
Improve Your Website UX and UI With FullSession
Learn how our interactive heat maps help you find cold spots and dead zones on your site.
The Benefits of Heatmaps
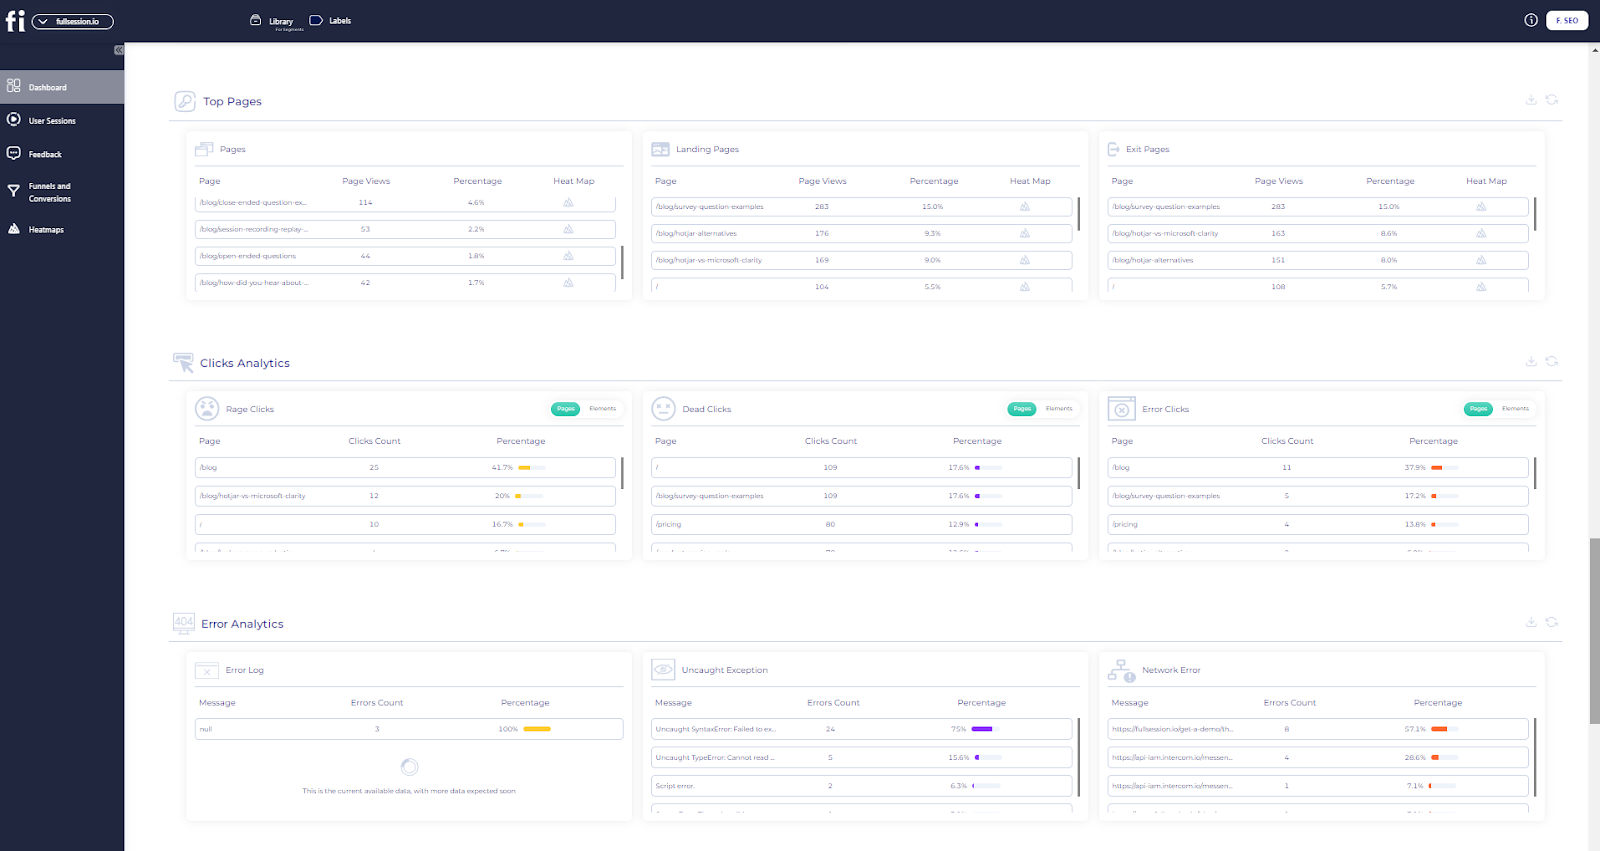
Heatmaps measure user attention and help you design content that resonates with your audience. Using heatmap software, you can evaluate site layout, conduct A/B tests, optimize call-to-action placement, and more.
Here are some additional benefits of website heatmaps.
They help you determine key performance indicators

Source: Freepik
One of the best tools for understanding how users behave on your website is heat mapping, which can highlight significant issues with your site at a glance.
It helps you identify which metrics are the most important for your website’s success:
- Geo heatmaps will show you the different locations to focus your marketing efforts on
- Attention heatmaps will show you where on your website to place the most important messages and CTAs
- Movement heatmaps will show you which areas are overlooked
- Scroll maps help you determine which elements you should put above the average fold
They use visualization to help you interpret data
A heatmap can be worth a thousand words. When observing visitors through heatmaps, you’ll see how people interact with different sections of your site.
Using website heat mapping, you can analyze where people are clicking and understand why some actions increase bounce rate.
Also, it’s much easier to visualize data than looking at numbers and tables. A simple, colorful layout will give you all the necessary information with a single glance—red means that customers look and interact with something more frequently, while yellow shows average interaction. At the same time, green represents the areas that they don’t interact with enough.
They help you learn from users’ experience
Image source: AovUp
Heat maps help you understand how users engage with your site—what your audience does and how they react to your design.
While surveys are another way for customers to learn more about their experience, they are usually time-consuming, so customers often skip them. Heatmaps don’t require any additional effort from your customers, yet they can show you precisely what they’re interested in.
Site visitors can reveal a lot about what they respond to on your website. Use A/B testing with heatmaps to change the design before going live on any platform with a larger audience.
They are great when combined with other analytics tools
But what other tools should you use with website heat mapping? Heatmaps are a great analytics tool that could help you uncover the best designs for your website and better understand how people use your product, but their effectiveness is enhanced when combined with other software.
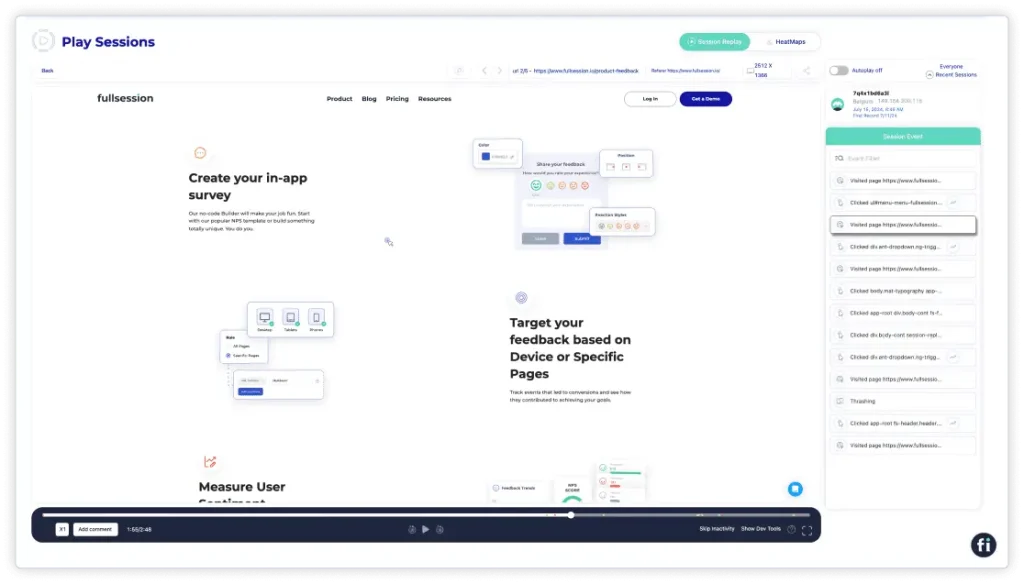
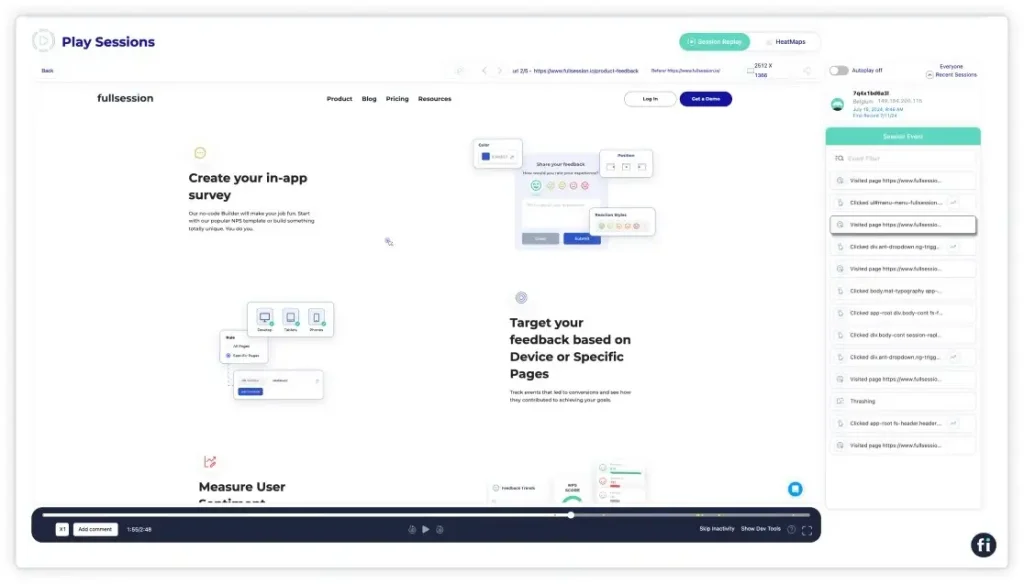
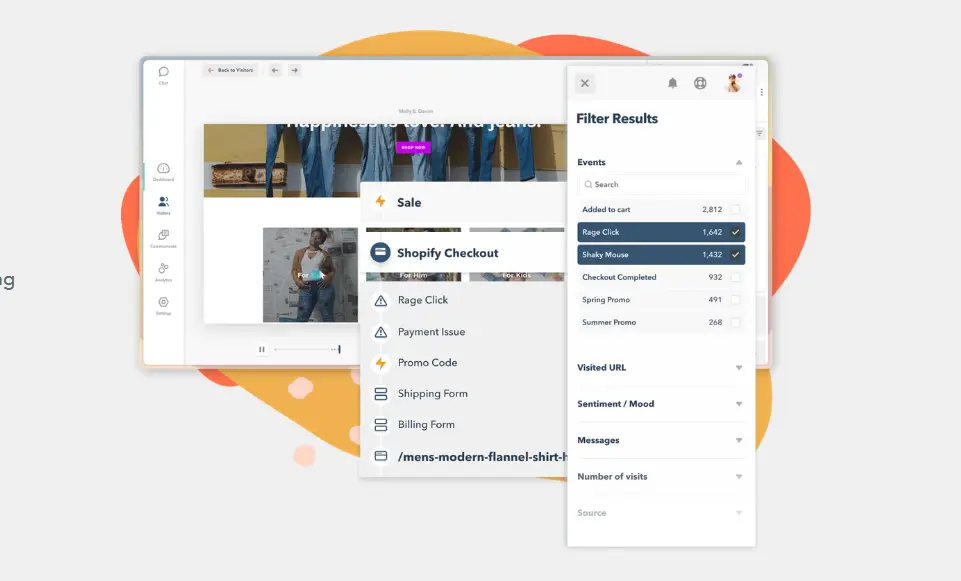
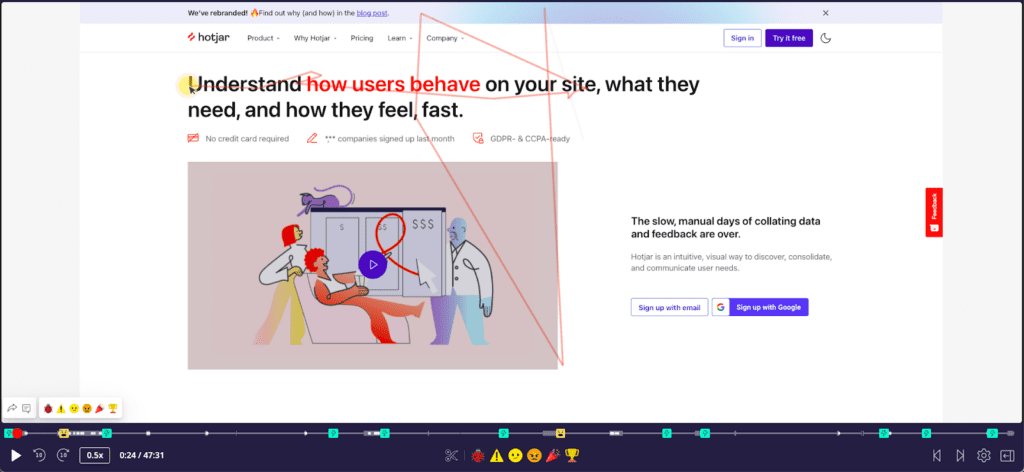
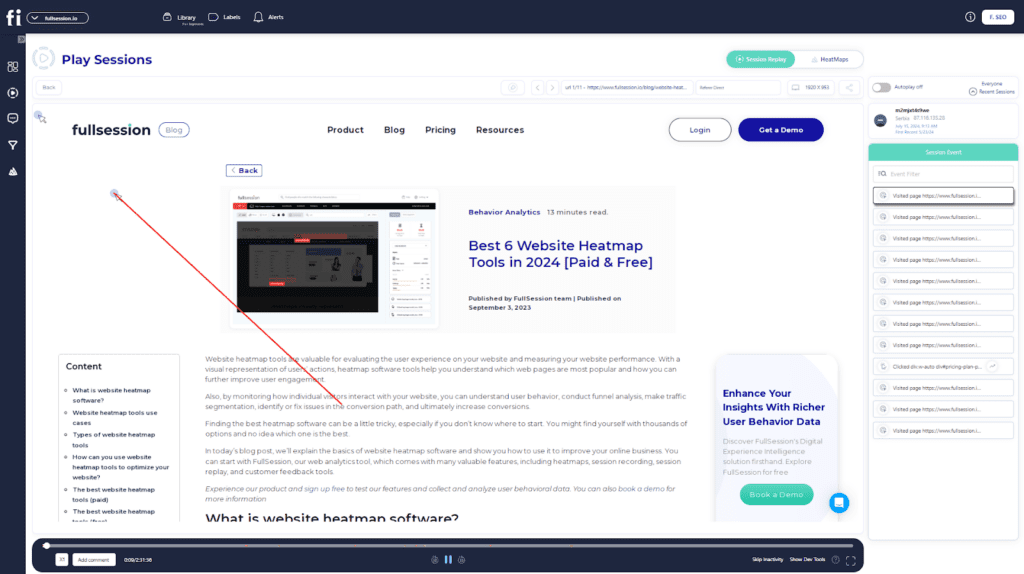
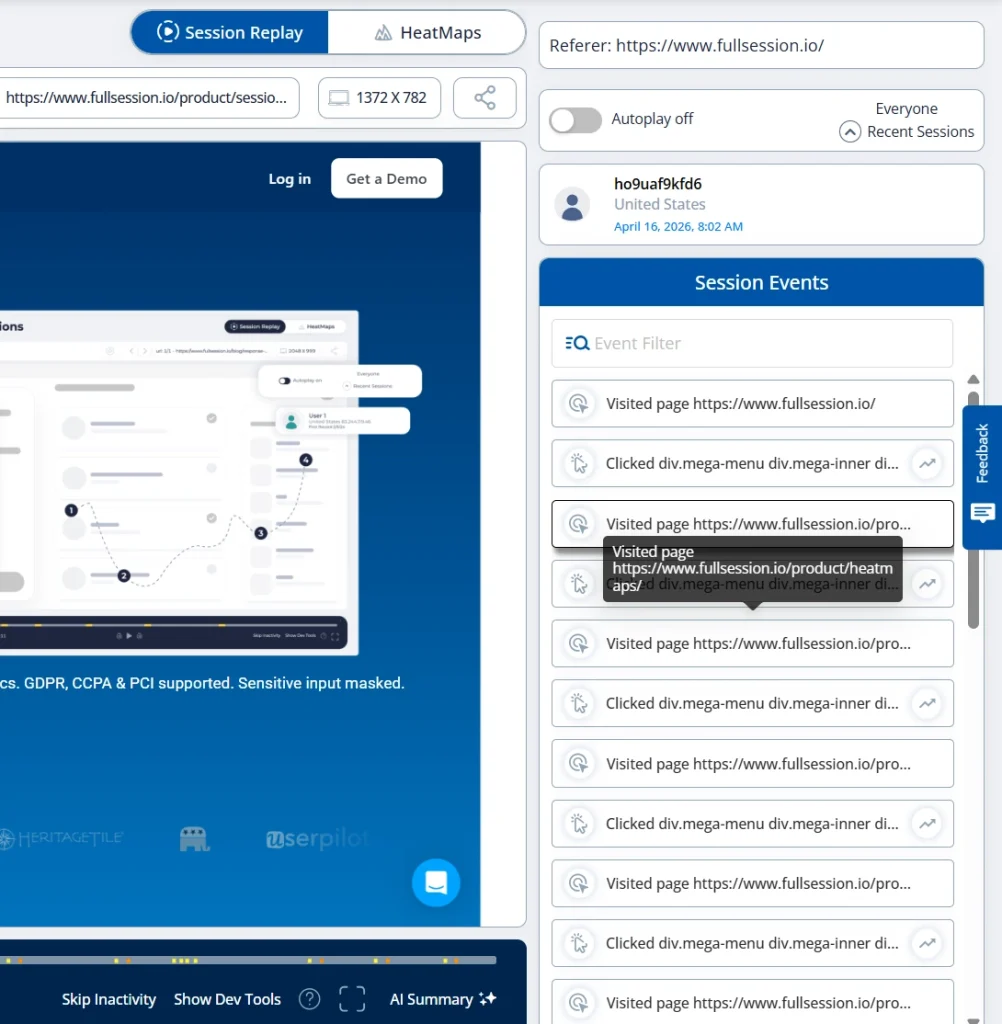
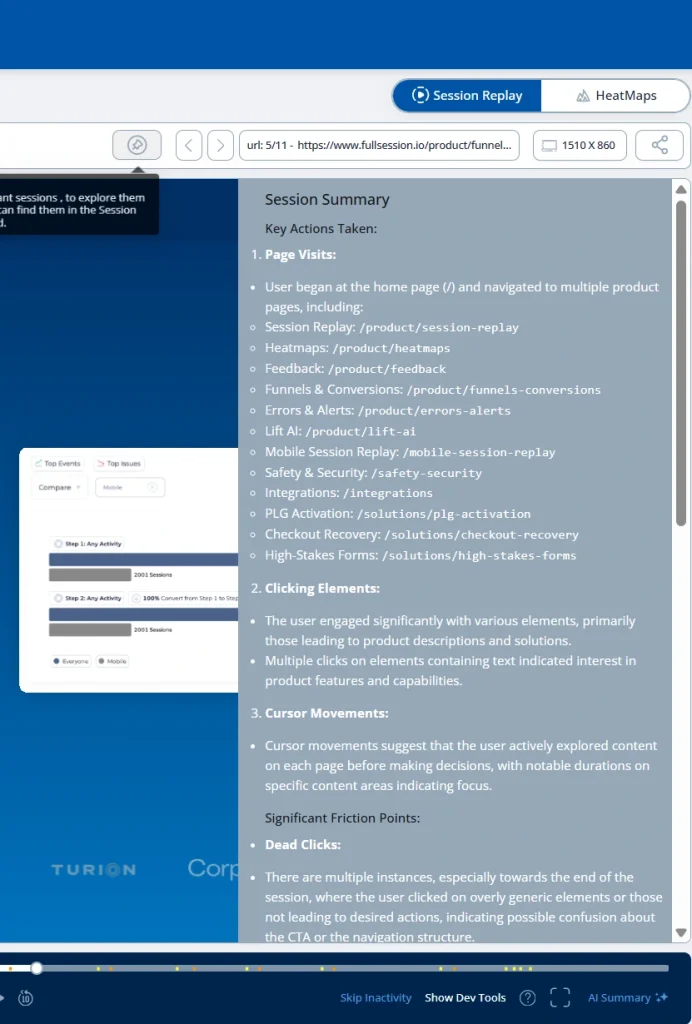
Sessions replay provides you with a reel of what your users are doing on-site, which you can replay to see the big picture. Filters allow you to zero in on specific user types, like high-paying customers.
FullSession session replay tool does just that—it records users’ activities and allows you tofilter and segment them by key events.
Start a free trial to see how it works.
They can point to some issues you overlooked in the past
With website heat mapping, you can identify where people are clicking and what they are viewing, so you may make necessary changes to your webpage.
UX design requires time and money to review. It’s much easier to retain customers by fixing any issues they might be dealing with on your website than to acquire new customers.
Heatmaps provide an opportunity to uncover website content and design issues by mapping the user experience. For example, you might notice that a group of customers exits the website when they reach a certain point. It can help you diagnose whether it’s a broken button, misplaced CTA, or something else that’s causing the issue.
They help you understand your customers’ behavior better
Tools like heat mapping can help you identify pain points so that developers can optimize page designs better. These tools automatically track data points within a website, which gives you an idea of what interests new viewers and what deters them.
Listening to specific feedback can help you tailor a better experience for users. Web heat mapping, for instance, shows how audiences react to a message.
Take note of where you placed the message. Open your heat map, and you’ll get a clearer picture. Users aren’t showing enough interest if the message is painted with a cool color. If it’s warm and solid, they are interested in the message.
They help increase conversions and profit
Web heat maps help companies sell more products. They also allow website or product managers to make better decisions based on the information provided. It can lead to increased customer satisfaction, which helps your conversions.
You don’t have to guess how visitors interact with your content with website heatmaps. Using accurate data and metrics, you can optimize conversion rates accordingly.
Best Practices for Using a Heatmap
Here’s a quick checklist of tips, tricks, and advice on how to use heatmaps to improve your business:
- Don’t use heatmaps for all pages on your website simultaneously
- Segment your website into smaller categories when using heatmap for testing
- Filter heatmap data by page type, performance, device type, and channel
- Combine heatmaps with other tools likesession recordings,customer feedback, funnels and conversions, VoC data, and web analytics
- Use heatmaps to discover which content performs best and why and which doesn’t
- Use heatmaps to reduce the bounce rate by pinpointing the areas on your website where users usually exit the page
- Use tagging and data overlays to keep track of how recent changes on your website are performing
- Experiment and look for new ways to interpret heatmaps
Create Insightful Heatmaps With FullSession
Heatmaps are a great way to understand your customers’ needs and, ultimately, attract more visitors to your site. The way they interact with different elements and pages will give you a unique insight into what you need to improve and what’s already working.
The FullSession customer experience suite allows you to track important user behavior metrics and gives you actionable advice on how to improve them. You can also watch users’ actions and replay sessions to diagnose why they didn’t buy your product or service.
Plus, the interactive heat map feature provides a visual representation of which elements get the most attention.
Book a demo today to discover how FullSession can help you provide your customers with an unforgettable experience.
You can also find our reviews and comparisons of Mouseflow vs VWO, Lucky Orange vs Hotjar, Hotjar vs Microsoft Clarity, and more.
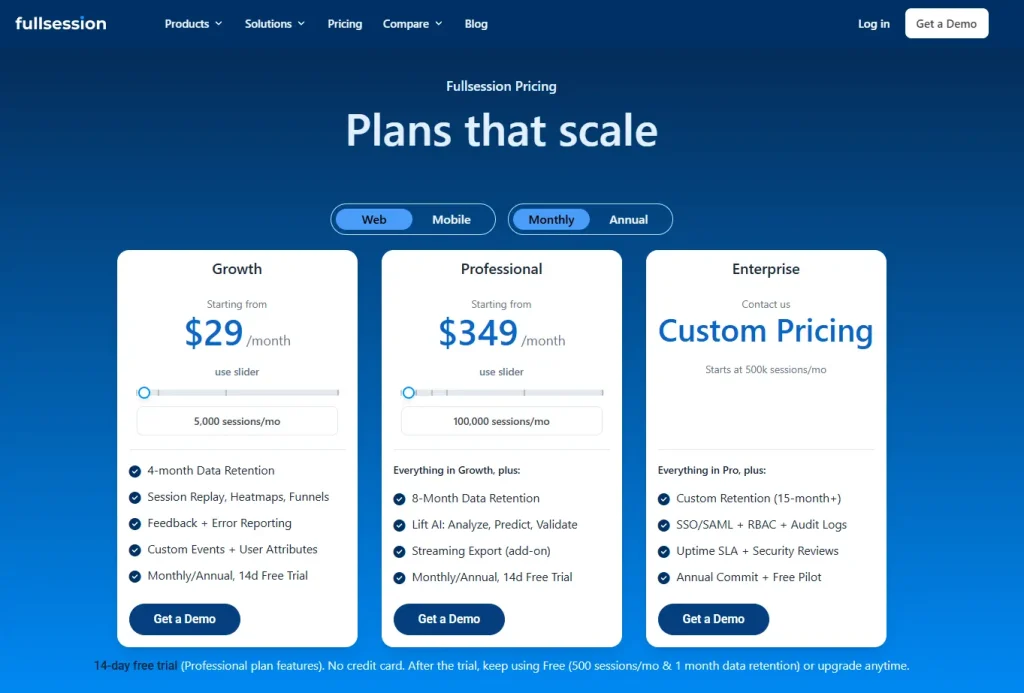
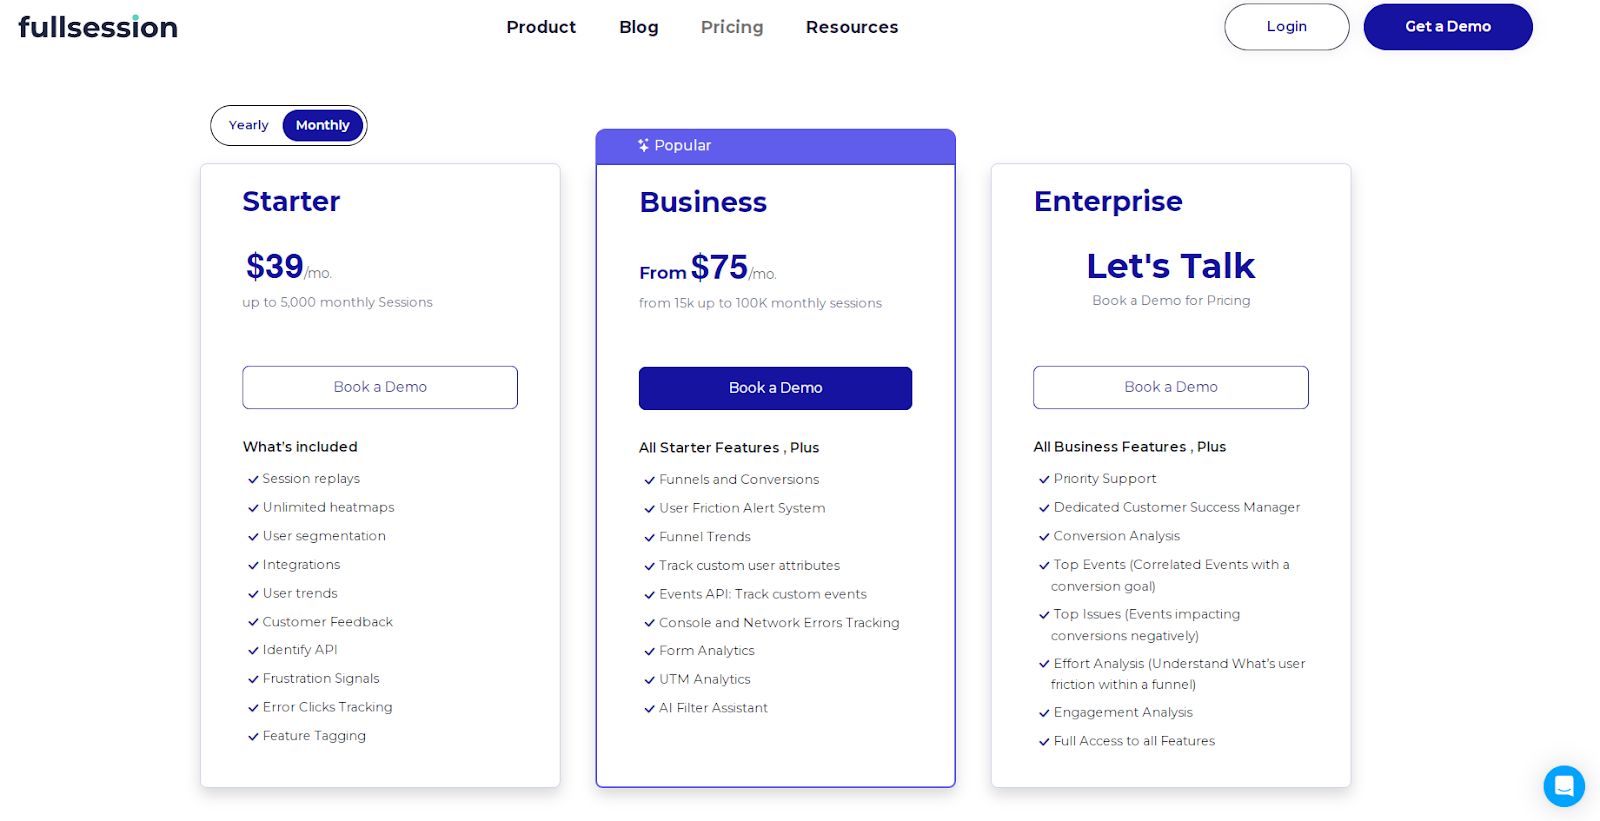
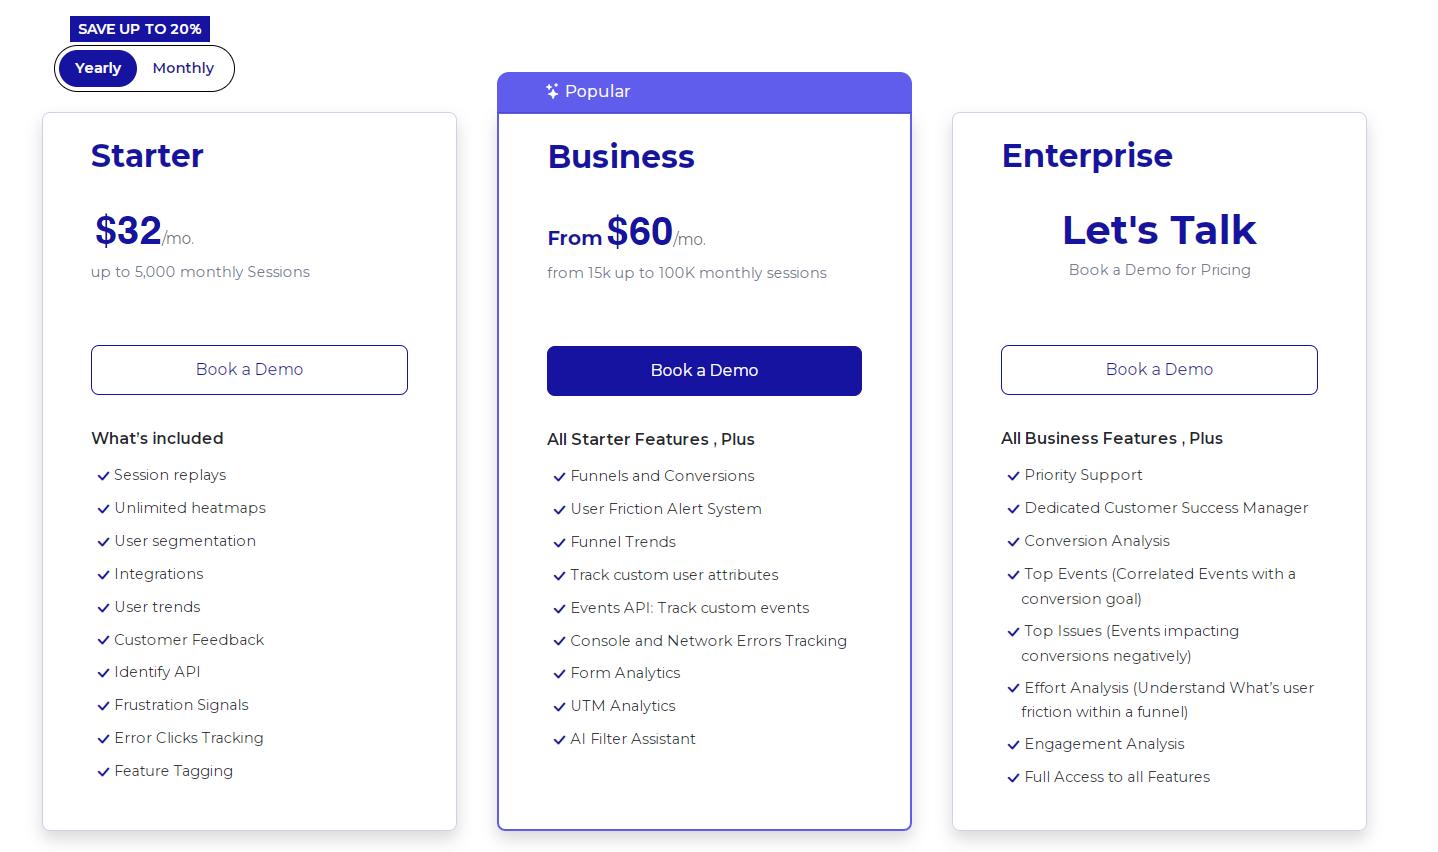
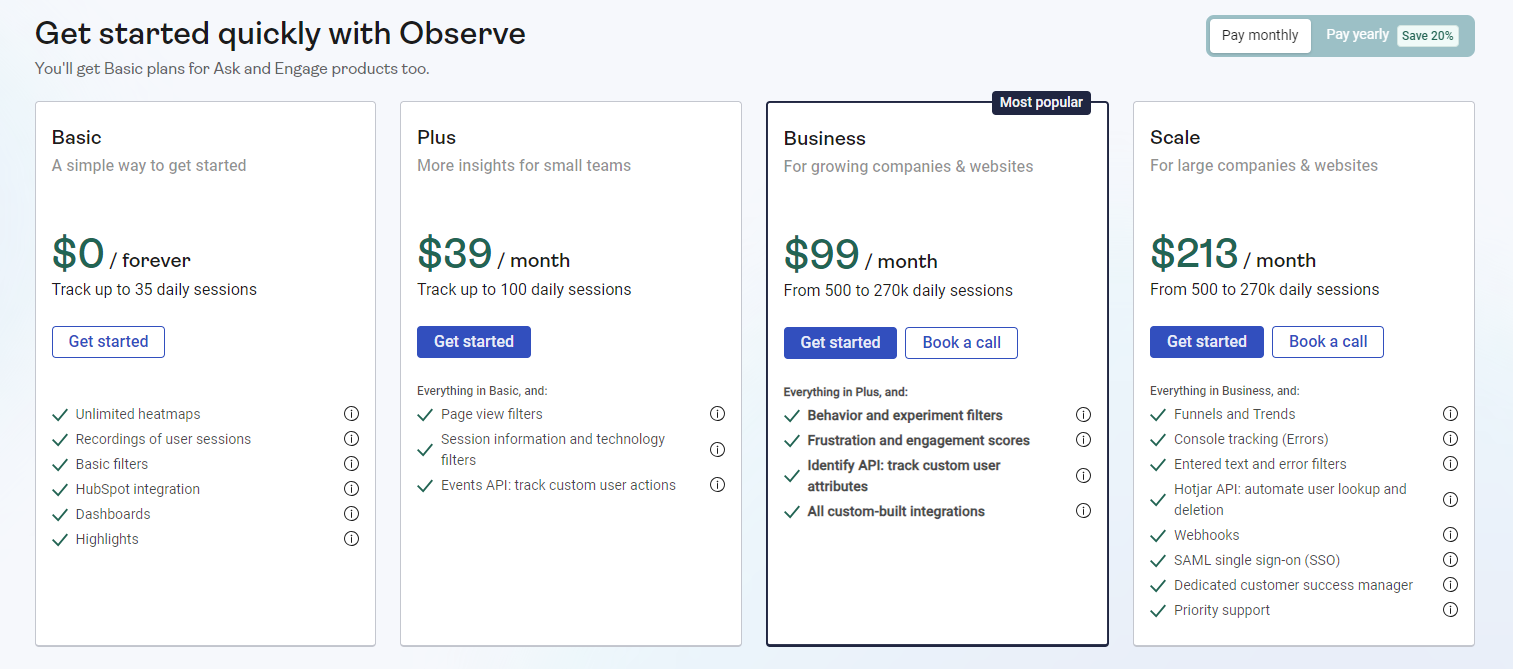
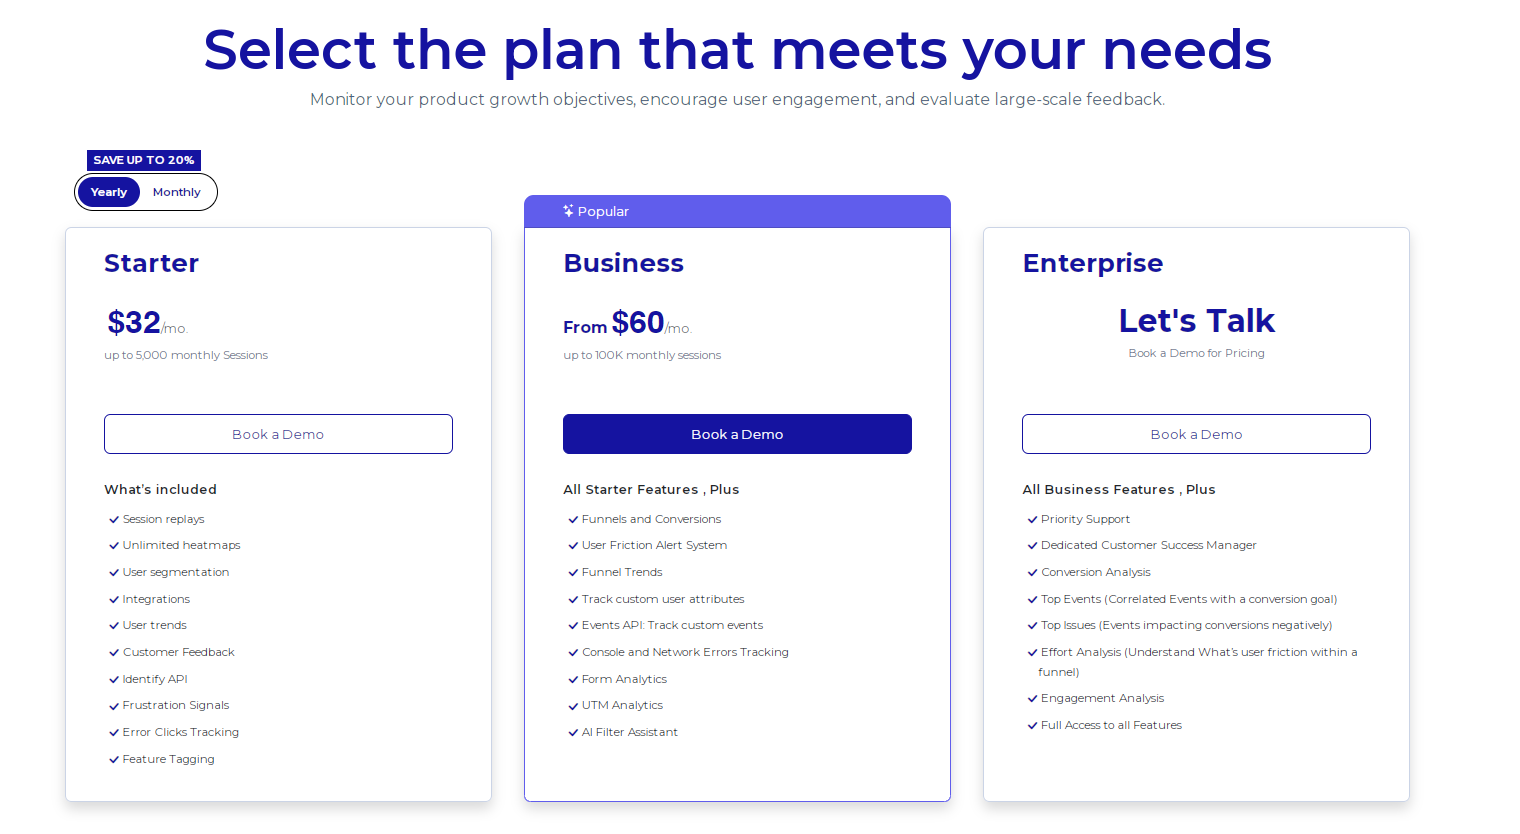
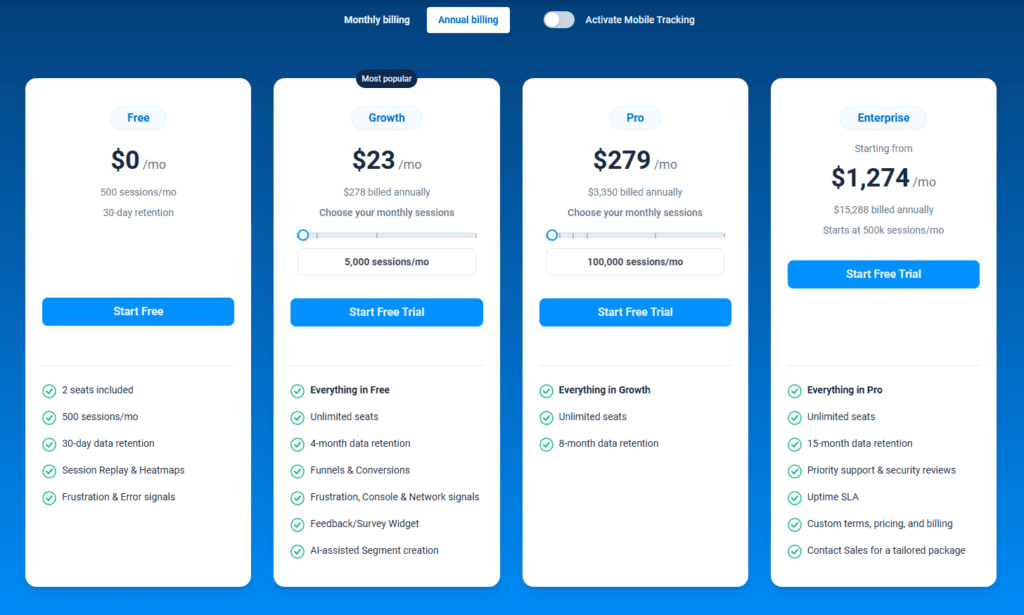
FullSession Pricing Plans
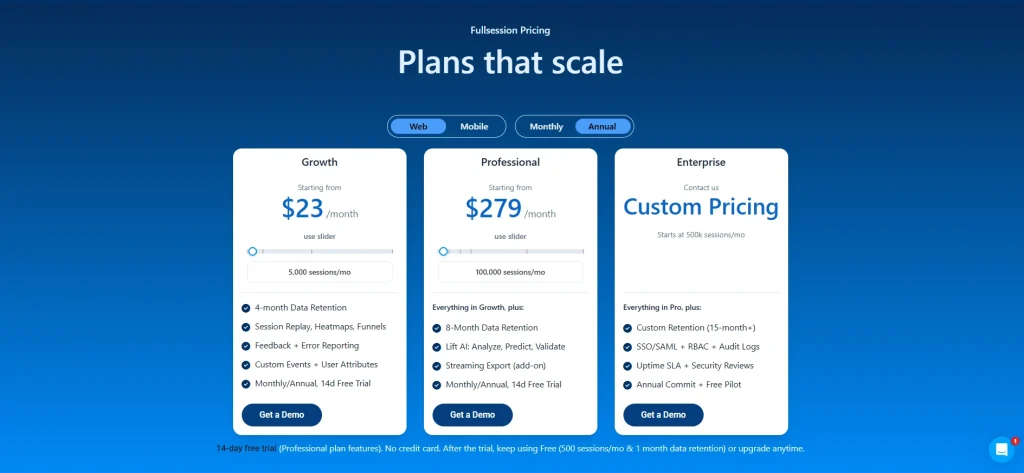
The FullSession platform offers a 14-day free trial and three paid plans: Starter, Business, and Enterprise.
FAQ About How to Read a Heatmap
What is a heatmap?
A heatmap is a data representation that uses color to represent the intensity of values in a dataset. The term heatmap describes graphical representations where data points are shown with colors indicating higher (warm colors like red and orange) or lower (cool colors like blue and green) values.
What web analytics tools have heatmaps?
Tools like FullSession, Smartlook, Mouseflow, Hotjar alternatives, and Google Analytics offer heatmaps along with other web analytics tools.
How do you interpret heatmap data?
To interpret a heat map, start by identifying what the x-axis and y-axis represent, which are typically the variables or categories being compared. Understand the color scale: warm colors like red and orange often indicate higher values, while cool colors like blue and green signify lower values. Each cell’s color represents a specific value, and some heatmaps include numeric annotations for exact values. Look for patterns, such as clusters of similar colors, to identify trends, anomalies, or areas of interest.
How do you read a heat graph?
Reading a heat graph involves identifying the axes, checking the color legend, examining individual cells, and looking for overall patterns. The x-axis might show time intervals, while the y-axis shows different metrics. Understand what the colors represent, and look for gradients, clusters, or outliers to gain insights into the data distribution.
How do you read a heatmap correlation?
Reading a heatmap correlation involves understanding that it visualizes a correlation matrix where each cell represents the correlation between two variables. The axes list the variables being compared. Colors close to 1 (dark red) indicate strong positive correlations, colors close to -1 (dark blue) indicate strong negative correlations, and colors near 0 indicate no correlation. Look at cell value annotations for exact correlation coefficients and identify significant correlations or patterns.
How do you evaluate a heatmap?
Evaluating a heatmap involves ensuring it accurately represents the data with clear colors and accurate annotations. Check if every single variable is relevant and provide insights. The color scale should be appropriate and intuitive. Look for clear patterns or insights that align with the data’s purpose. Consider the context of the data and assess whether the insights are actionable and can inform decisions or further analysis.
Mohamed oversees operations and finance at FullSession and has contributed to the company’s UX analytics knowledge base.