The international software-as-a-service (SaaS) industry grew to $237.48 billion in 2022 and is expected to reach over $900 billion by 2030. The market is supersaturated to the point that the competition is kicking the weakest links out before they can even gain traction.
On the flip side, the SaaS companies sitting on top are perfecting their business strategies, workflows, and services to stay successful. Their secret? Maximizing the wealth of data they have at their fingertips.
Analytics is your best friend when running a successful SaaS business. Complex data tells you what you’re doing right and how you can be even better. However, keeping track of all the information available is a fool’s errand–if you want to optimize your business, you need to choose the right SaaS metrics to track.
Let’s look at 17 key metrics SaaS companies should focus on if they want a more straightforward path to success.
What Are SaaS Metrics?
SaaS metrics offer a comprehensive overview of a company’s performance and overall health status. Most SaaS businesses measure success by the volume of regular subscribers and how well they can keep current customers.
SaaS metrics, especially when well-chosen, tell companies if they are hitting these targets. Plus, analyzing these data points identifies opportunities for improvement and helps predict customer retention, which are some of the most crucial aspects of running a SaaS business.
Why Do Key SaaS Metrics Change Over Time?

SaaS businesses don’t keep track of the same metrics, nor do they track all of them. If you want to optimize your company’s growth, choose the right growth metrics depending on your current stage, business model, and goals.
Picture a SaaS company as a growing kid. When they’re just starting, it’s all about getting those initial users through the door and making sure they stick around—like ensuring a kid eats their veggies and gets enough playtime. At this stage, it’s all about user acquisition and retention. You want to see lots of new faces and make sure they’re happy enough to stay.
But as the company grows up, things start to shift. It’s no longer just about gathering a crowd; it’s about making serious cash and broadening the horizons. Now, think of this as the teenage years, with more focus on building meaningful relationships and laying the groundwork for the future. For a more mature SaaS company, the game changes to optimize revenue and make sure the customer base doesn’t just grow but becomes more diverse and stable.
Nevertheless, there are three crucial aspects to any SaaS business model, regardless of age:
- Profitability: SaaS companies rely on subscriptions to generate profit. You always want to stay in the black, where metrics like gross margin, annual recurring revenue, and monthly recurring revenue (MRR) come in.
- Growth: A successful SaaS business is constantly growing, whether expanding services or tapping into a new market. Stagnant growth usually follows a decline in profitability, even in traditional businesses.
- Cash Flow: Successful SaaS companies strive for cash flow positivity through various strategies, such as reasonable upgrades, upselling products, and minimizing delays between expenses and revenue. In contrast, spending more than you receive can easily lead to a downward spiral.
Additionally, mature SaaS businesses can re-track early-stage metrics as related issues arise. For example, a company seeing a sudden decline in existing customers can review its churn rate to get an idea of what’s happening.
Most Important SaaS Metrics For Early-Stage Companies
The biggest concern of SaaS startups is getting their foot in the door, acquiring customers, and keeping any attention that comes their way, all while tackling the challenge of having limited resources. At this stage, the focus is on identifying the most important aspects of the business and figuring out how to optimize them.
These core metrics are a great starting point for a fresh SaaS business:
1. Retention Rate
The retention rate quantifies the percentage of customers who remain subscribed or continue purchasing after their initial transaction, serving as an important indicator of customer satisfaction and product or service value.
Retention Rate Formula: (number of customers at the end of a given period – number of new customers) ÷ total number of customers at the beginning of that period.
2. Traffic-to-Lead Rate
The traffic-to-lead rate shows the percentage of your website visitors that you successfully convert into a lead, whether that means signing up for a newsletter or booking a trial. Tracking this metric helps you determine if your lead-generation strategies are working.
Traffic-to-Lead Rate Formula: (number of website visits ÷ number of generated leads within the same period) x 100
3. Customer Conversion Rate
Once you’ve got potential customers’ attention, the customer conversion rate (also known as the lead-to-customer rate) tells you just how many customers are digging into their pockets to buy what you’re selling. A high conversion rate means your onboarding tactics work well, and customers see your product’s value quickly.
Customer Conversion Rate Formula: (total number of trial users converted to a paid subscription ÷ total number of trial users.
4. Churn Rate
Churn rate measures two types of losses. Customer churn rate shows the percentage of customers giving up their accounts every month compared to your total number of customers. On the other hand, revenue churn quantifies the amount of cash your revenue stream loses every month, calculated as the percentage of your revenue lost from your total revenue.
Both revenue and customer churn can be helpful indicators of customer attrition and your company’s overall health. However, most SaaS companies find revenue churn more useful; the number of customers lost doesn’t always reflect how much you lose in revenue.
Churn Rate Formula: (number of churned customers in a given time frame ÷ total number of customers at the beginning of the period) x 100
5. Daily Active Users and Monthly Active Users
Daily active users (DAU) and monthly active users (MAU) give you a snapshot of how many people are using your service every day or month. Substantial numbers here suggest your users are really into what you’re offering, which is a good sign for keeping that retention rate healthy. However, you can’t use DAU or MAU on their own.
The DAU/MAU ratio helps you understand how often existing customers return to the application within a month. A higher ratio indicates that users engage with the service daily, suggesting high user retention and a more engaged, active user base. For instance, a DAU/MAU ratio of 0.5 means that, on average, half of the monthly users use the service daily, a strong indicator of a highly engaging product.
DAU and MAU Ratio Formula: (number of unique daily active users ÷ number of monthly active users) x 100
6. Customer Engagement Score (CES)
CES goes a step further by measuring not just if users log in but how they interact with your product. Are they exploring, clicking, and getting involved? The customer engagement score helps you see which parts of your product are hitting the mark and where you might need to up your game to keep users interested.
Unlike a single formula that applies universally, the CES is typically customized to each company’s specific context, reflecting how users interact with their product or service. To calculate a CES, companies often consider a variety of factors, including but not limited to:
- Frequency of Use: How often a user interacts with the product or service within a given time frame.
- Depth of Use: The variety of features or services within the user’s product.
- Duration of Use: The amount of time spent during each interaction.
- Breadth of Use: The number of different functions or features used.
- Recency: How recently the user has interacted with the product or service.
- Growth: Increases in usage over time.
- Conversion Actions: Specific actions that indicate a higher level of interest or engagement, such as making a purchase, upgrading an account, or completing a set of tasks.
A company will assign weights to these factors to create a CES formula based on their importance to the business objectives. For example, a SaaS company might consider frequency and depth of use as more critical engagement indicators and assign them higher weights. The formula might look something like this:
CES=(w1×Frequency)+(w2×Depth)+(w3×Duration)+…CES=(w1×Frequency)+(w2×Depth)+(w3×Duration)+…
where w1,w2,w3,…w1,w2,w3,… represent the weights assigned to each factor.
After calculating the scores, companies can segment users into different engagement levels (e.g., low, medium, high) to tailor their marketing, support, and product development efforts accordingly.
7. Monthly Recurring Revenue (MRR) and Annual Recurring Revenue (ARR)
Monthly recurring revenue and annual recurring revenue track the steady flow of cash your subscriptions are bringing in each month and year. These metrics are your go-to SaaS revenue recording process, best for understanding how your financial health looks and where it’s headed. They’re critical for planning, budgeting wisely, and ensuring you’re on track to grow and keep your company thriving.
Annual Recurring Revenue Formula: Total annual contract value ÷ number of years
Most Important SaaS Metrics for Late-Stage Companies

As SaaS companies transition from their early stages of growth to more mature phases, the focus of their metrics shifts towards optimizing revenue, sustainability, and long-term customer value.
Understanding and leveraging these metrics becomes crucial for steering the company toward continued customer success, and scalability:
8. Average Revenue Per Account (ARPA)
ARPA, also known as average revenue per user (ARPU), is a vital metric for gauging the average revenue generated per customer account over a specific period. It offers insights into the revenue impact of your customer base and helps identify trends in upselling and customer growth.
As your SaaS company matures, ARPA becomes an essential indicator of how well you’re maximizing the value of each customer, guiding strategic decisions around pricing, product development, and customer segmentation.
Average Revenue Per Account Formula: Monthly recurring revenue ÷ total number of active subscriptions
9. Activation Rate
The activation rate is the most important among SaaS metrics as it measures the number of customers who realize the value of your service and activate their accounts.
A high activation rate is often a predictor of future, customer retention rate and satisfaction, making it a critical metric for understanding the initial user experience and the effectiveness of your product in meeting user needs.
Activation Rate Formula: number of customers who perform your desired action ÷ total number of users
10. Customer Acquisition Cost (CAC)
CAC calculates the total cost of acquiring a new customer, including marketing and sales expenses. It’s a cornerstone metric for assessing the efficiency of your growth strategies and the sustainability of your business model.
A lower CAC about customer value indicates a healthy, scalable company. Monitoring CAC closely helps late-stage SaaS businesses refine their acquisition strategies to ensure long-term profitability. Remember, the faster you can recover customer acquisition costs, the faster you can reinvest that positive cash flow into your business.
Customer Acquisition Cost Formula: Total amount of money spent on sales and marketing within a time frame ÷ number of new customers acquired within that time frame
11. Customer Lifetime Value (CLV)
Customer lifetime value estimates the total revenue a business can expect from a single customer account throughout their relationship. This metric is crucial for understanding the long-term value of customer relationships and for making informed decisions about how much to invest in customer acquisition and retention.
A high customer lifetime value indicates a strong, loyal customer base and suggests that the company’s offerings continue to meet and exceed customer expectations over time.
Customer Lifetime Value Formula: (Revenue x customer lifetime) – customer acquisition cost and maintenance
12. CLV-to-CAC Ratio
Comparing your average customer’ lifetime value and customer acquisition cost helps you determine whether your marketing efforts are working. A healthy CLV-to-CAC ratio (typically 3:1 or higher) signifies that a company is spending its resources efficiently, generating significant value from its customers compared to what it spends to acquire them.
For example, if you earn $1,000 from one customer within a given period, your SaaS business should only spend up to $300 to acquire that customer. This helps ensure you’re not losing money.
Customer Lifetime Value (CLV) to Customer Acquisition Cost (CAC) Ratio Formula: Customer lifetime value over a period: customer acquisition cost over the same period
13. Expansion Revenue
Expansion revenue measures the additional revenue earned from existing customers through the sales process upselling, cross-selling, and upgrades. It’s a testament to a company’s ability to grow its revenue base without solely relying on new customer acquisition.
High expansion revenue indicates effective account management and product value, contributing to company growth and customer satisfaction. Focusing on this crucial metric can help you fight the negative effects of customer churn.
Expansion Revenue Formula: Total MRR from upselling and/or cross-selling
14. CAC Payback Period
The CAC payback period measures how long it would take you to recoup the costs (typically from sales and marketing) of acquiring a customer. This metric is crucial for understanding cash flow implications and financial health, especially for SaaS businesses where upfront acquisition costs can be significant.
A shorter payback period improves cash flow and reduces the risk associated with long-term investments in a customer acquisition strategy. This can also be a valuable metric for SaaS companies in the middle of the growth stage who want to avoid potential cash flow issues.
CAC Payback Period Formula: CAC ÷ MRR from a new customer
15. Net Promoter Score (NPS)
Net Promoter Score (NPS) is a straightforward yet powerful tool to measure customer satisfaction and loyalty. It’s based on a simple question: “On a scale of 0 to 10, how likely are you to recommend our product/service to a friend or colleague?”
Here’s how the NPS is calculated:
- Respondents are categorized into three groups based on their rating:
- Promoters (9-10): These are your most enthusiastic and loyal customers. They will likely sing your praises to friends and colleagues, driving organic growth.
- Passives (7-8): Satisfied but unenthusiastic customers vulnerable to competitive offerings. They’re happy enough but not blown away.
- Detractors (0-6): Unhappy customers who can hurt your brand and impede growth through negative word-of-mouth.
- Calculate the percentage of Promoters and Detractors: Once you have your survey responses, calculate the percentage of respondents that are Promoters and Detractors. Passives count towards the total number of respondents, normalizing the score, but they don’t directly affect the NPS.
- Subtract the percentage of Detractors from the percentage of Promoters: The formula looks like this:
Net Promoter Score Formula =(Percentage of Promoters)−(Percentage of Detractors)NPS=(Percentage of Promoters)−(Percentage of Detractors)
The result is your NPS, ranging from -100 (everyone is a Detractor) to 100 (everyone is a Promoter). A positive NPS (>0) is generally good, and a score above 50 is excellent, indicating strong customer loyalty and a customer satisfaction score.
16. Net Revenue Retention
NRR measures the percentage of recurring revenue retained from existing customers over a given period, factoring in upgrades, downgrades, and churn. It’s a powerful indicator of customer satisfaction, product-market fit, and the effectiveness of retention strategies.
High NRR values suggest that a company is not only retaining its customer base but also successfully encouraging additional spending.
Net Revenue Retention Formula: (Retained revenue ÷ base recurring revenue) x 100
17. Gross Margin
Gross margin reveals the profitability of a company’s core activities by subtracting the cost of goods sold (COGS) from total revenue. For SaaS companies, this typically includes the costs associated with delivering the service, such as hosting and support. Monitoring gross margin helps ensure that as the company scales, it does so profitably and that revenue growth outpaces the growth of direct costs.
Gross Margin Formula: ((Revenue – cost of goods sold) ÷ revenue) x 100
What SaaS Metrics Can Web Analytics Track?

Web analytics can be a goldmine of data for SaaS companies. These tools track how users interact with your website, providing insights that can help optimize the customer journey, improve product features, and ultimately drive growth. Here are some key SaaS metrics that web analytics can measure:
- Traffic-to-Lead Ratio: This measures the effectiveness of your website in converting visitors to leads. By analyzing website traffic and the actions visitors take, you can understand how well your site attracts and captures potential customer interest.
- Lead-to-Customer Conversion Rate: Web analytics can track the journey of leads as they progress through your conversion funnel, helping you identify how many leads become paying customers.
- Customer Engagement and Product Usage: Integrating web analytics with your SaaS product can help measure how users interact with your product. Metrics such as feature usage, session duration, and frequency of use provide a clear picture of engagement levels, which are vital for customer retention and product development.
- Churn Rate: Although web analytics alone may not capture churn directly, it can provide early warning signs of customer dissatisfaction through decreased engagement, reduced session time, or declining frequency of use. These indicators can help you take proactive measures to reduce churn.
- Daily Active Users (DAU) and Monthly Active Users (MAU): Web analytics tools can track the number of existing customers who engage with your product daily and monthly, offering insights into your product’s stickiness and regular usage patterns.
- Customer Acquisition Cost (CAC): Tracking marketing and advertising expenses alongside conversions from various channels can help you calculate the cost of acquiring a new customer, a critical metric for understanding the efficiency of your marketing efforts.
- Page Views per Session and Time on Site: These metrics give you an idea of how engaging your content is. High page views and longer time on site often indicate that visitors find your content valuable, which can be a good indicator of potential lead quality.
- Bounce Rate: This represents the percentage of visitors who navigate away from the site after viewing only one page. A high bounce rate might indicate that your landing pages are not relevant or engaging enough for your target audience.
- Traffic Sources: Understanding where your traffic comes from (e.g., organic search, paid ads, social media) can help you identify which channels are most effective at driving engaged users and leads, allowing you to allocate your marketing budget more effectively.
- Funnel Analysis: Web analytics can help you map out and analyze the customer journey, identifying bottlenecks where users drop off. This analysis is crucial for optimizing the conversion path and improving the overall user experience.
Install Your First Website Feedback Form Right Now
It takes less than 5 minutes to set up your first website or app feedback form, with FullSession, and it’s completely free!
Monitor the Most Crucial SaaS Metrics with FullSession
Understanding the SaaS metrics most relevant to your company is an excellent starting point for business optimization. You don’t want to waste time tracking metrics that don’t matter. In the same vein, you want a way to track these important metrics efficiently.
FullSession is an intuitive platform that gives you access to a host of powerful tools, including:
- Funnel data: Identify which parts of your conversion funnel are causing potential customers to drop out. Track KPIs like site visits, sign-up rates, bounce rates, and more.
- Session recordings: FullSession offers replays and live recordings of customers using your website, giving you a clear idea of how they navigate your site and things that can cause frustration.
- Interactive heat maps: Website heatmaps track clicks, scrolls, and dynamic elements like drop-down menus and pop-ups. A heatmap provides a visual representation of which items are gaining the most attention vs. getting ignored, and potential issues like confusing graphics.
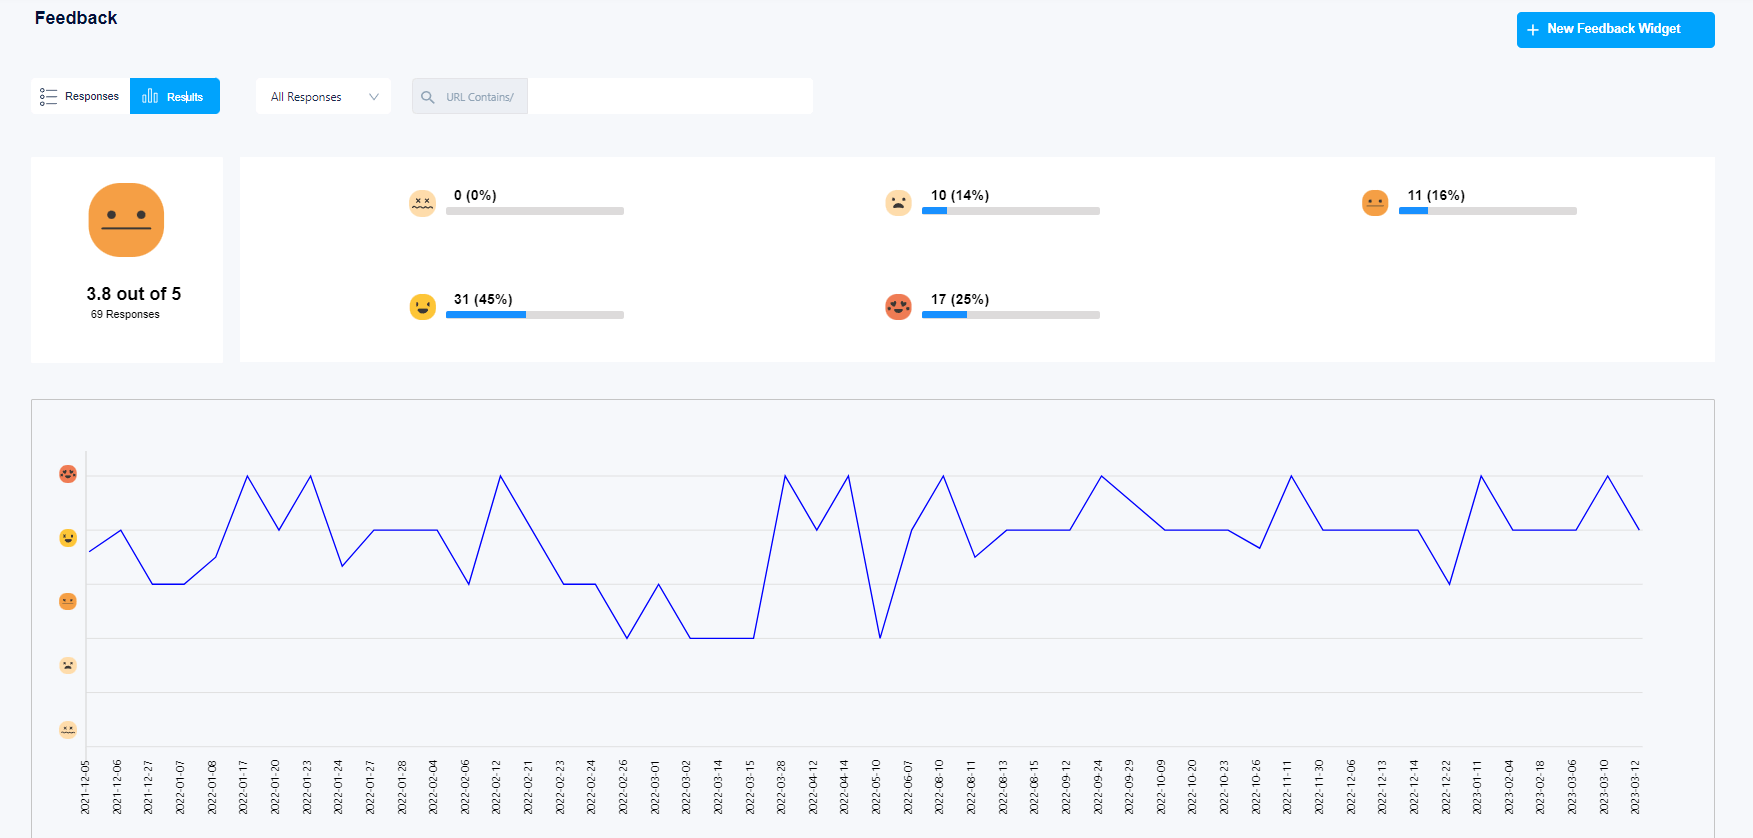
- Customer feedback tools: FullSession lets you integrate customer feedback tools into your website, letting visitors leave instant reviews you can use to optimize your SaaS business.
FullSession Pricing Plans
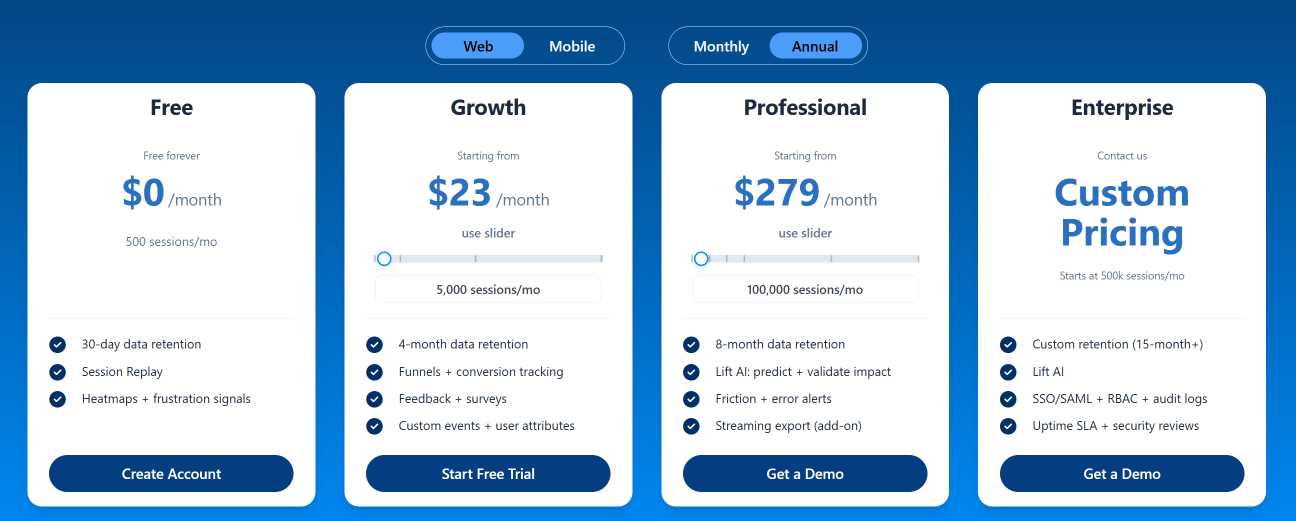
Here are more details on each plan.
- The Starter plan costs $39/month or $32/year and allows you to monitor up to 5,000 monthly sessions with up to 6 months of data storage.
- The Business plan costs $75/month or $60/year and helps you to track and analyze up to 100,000 monthly sessions with up to 12 months of data storage.
- The Enterprise plan has custom pricing and offers customizable sessions plus full access to all features.
FAQs About SaaS Metrics
How often should I review my SaaS metrics?
Ideally, review your key metrics on a monthly basis, but some, like DAUs or MAUs, may require more frequent monitoring.
Can I use all these metrics from the start?
While it’s possible, it’s more effective to focus on the metrics most relevant to the current stage and objectives of your SaaS business.
How do I improve my SaaS metrics?
Start by identifying areas of weakness or opportunity, then implement targeted strategies, such as improving user onboarding for better activation rates or optimizing marketing strategies to lower CAC.
Mohamed oversees operations and finance at FullSession and has contributed to the company’s UX analytics knowledge base.