The best website visitor tracking software helps you monitor and analyze how visitors interact with your website. It lets you gather detailed insights about user behavior, optimize your marketing strategies, improve user experience, and increase conversion rates.
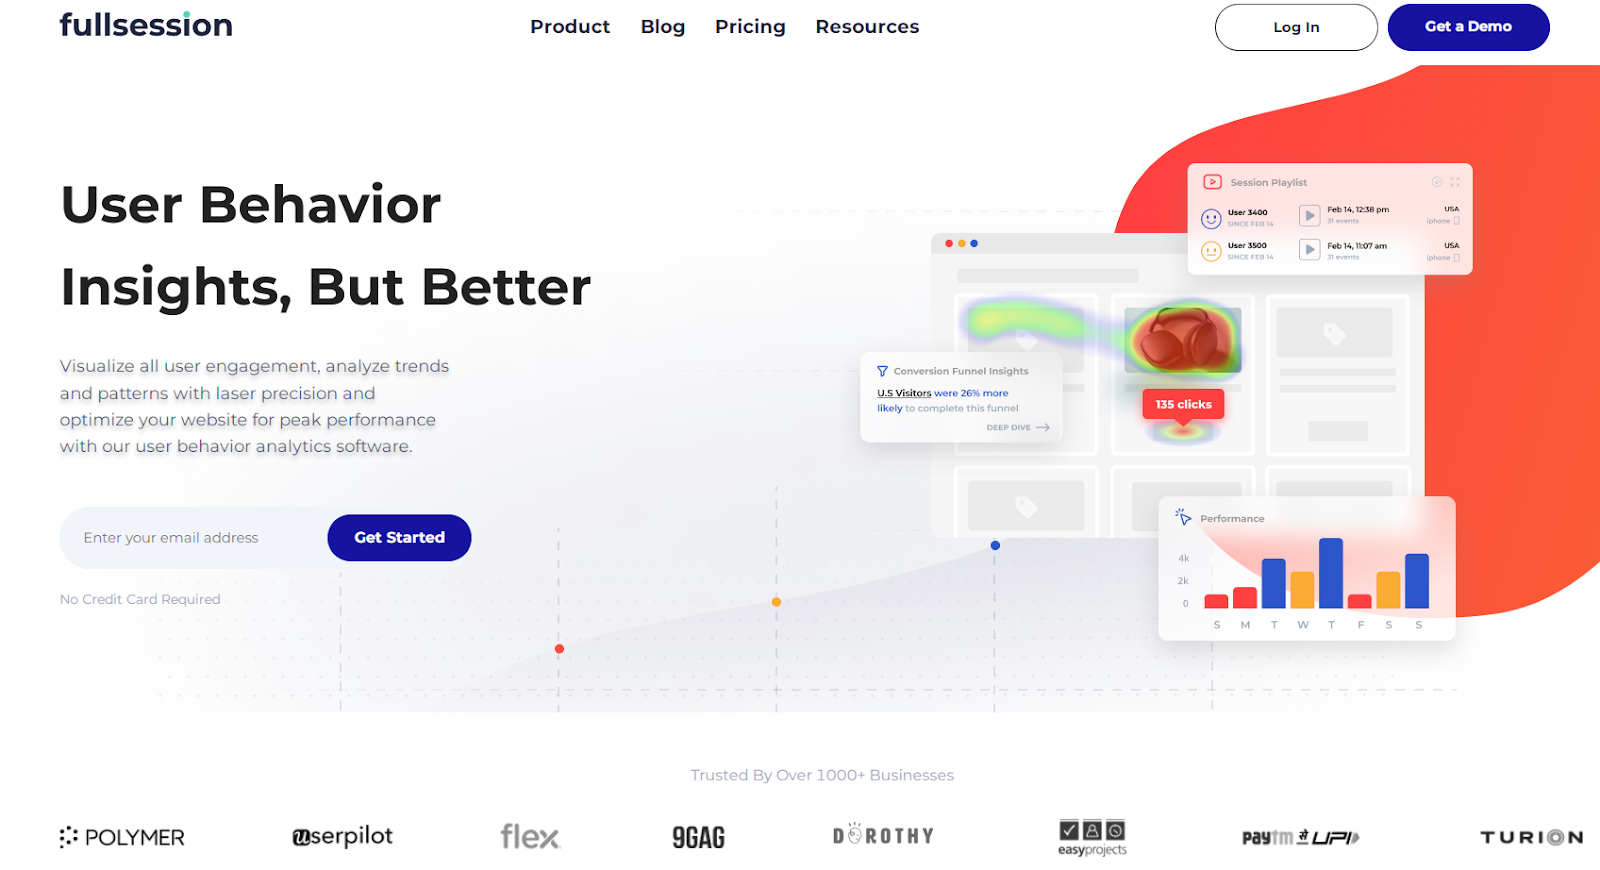
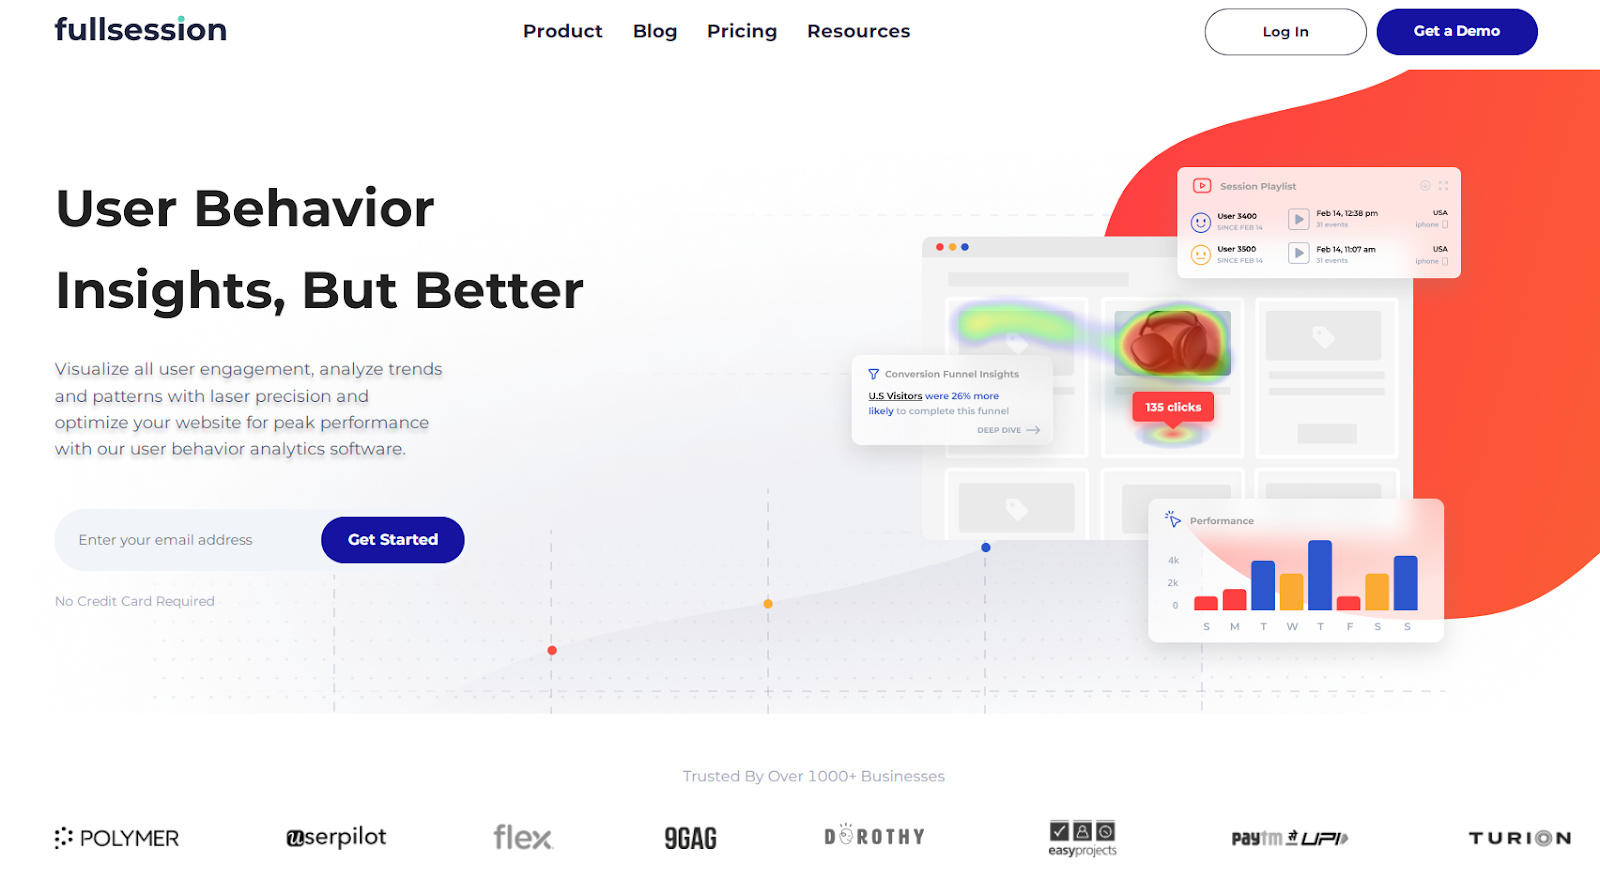
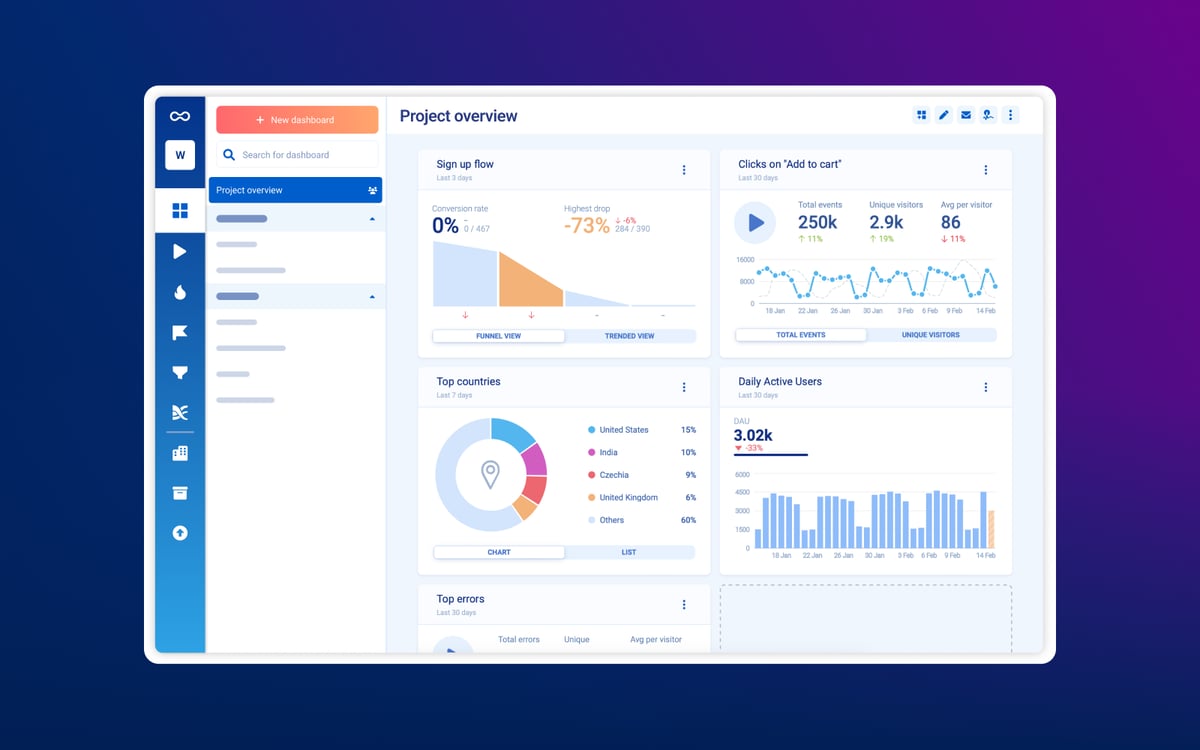
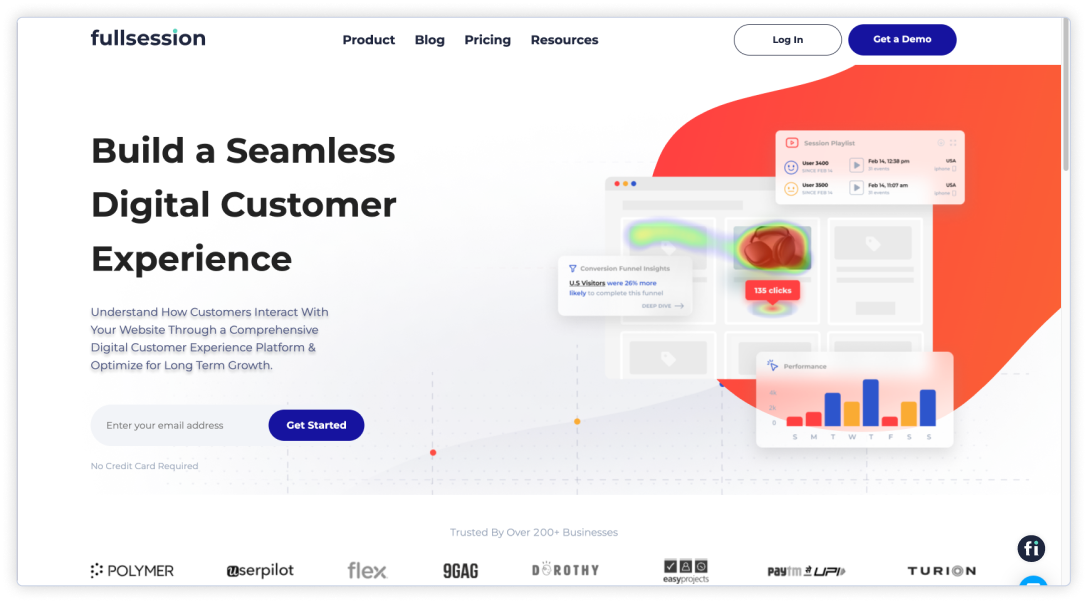
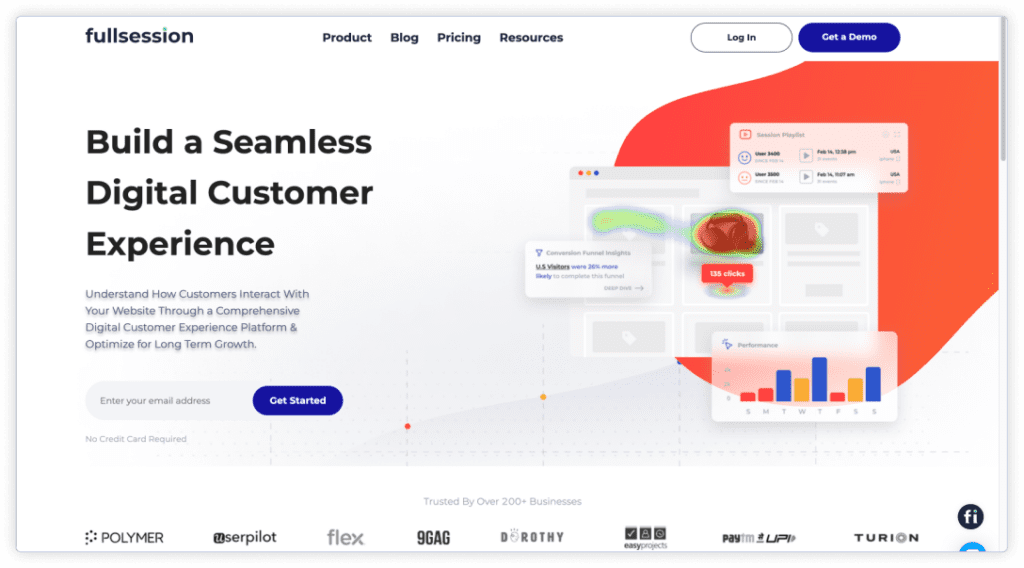
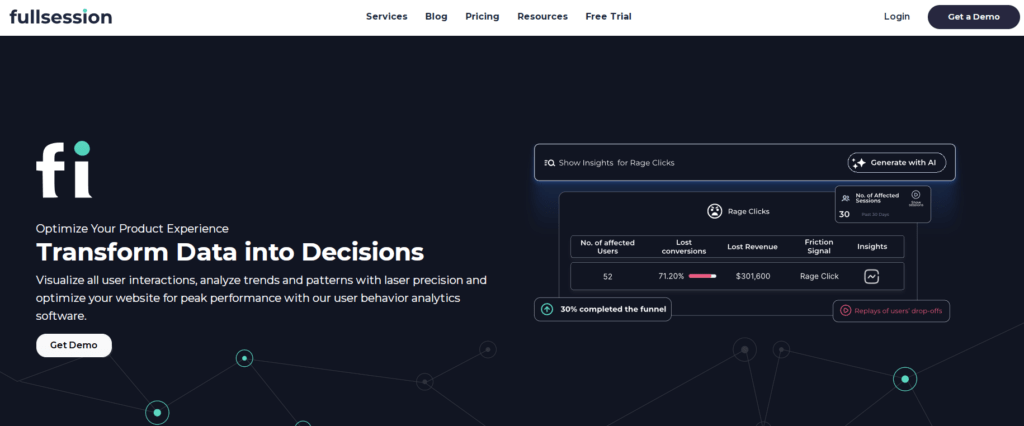
For example, FullSession helps you capture the entire user journey, visualize all user interactions, analyze trends and patterns in their behavior, and optimize your website, web app, or landing page for peak performance.
Start a free trial or book a demo to learn more.
However, choosing the best website visitor tracking tools can take time due to feature overload, ease of implementation, data accuracy and reliability, privacy and compliance concerns, scalability and customization needs, and cost considerations.
In this article, we’ll guide you through the best website visitor tracking software to help you make the right choice.
Key Takeaways
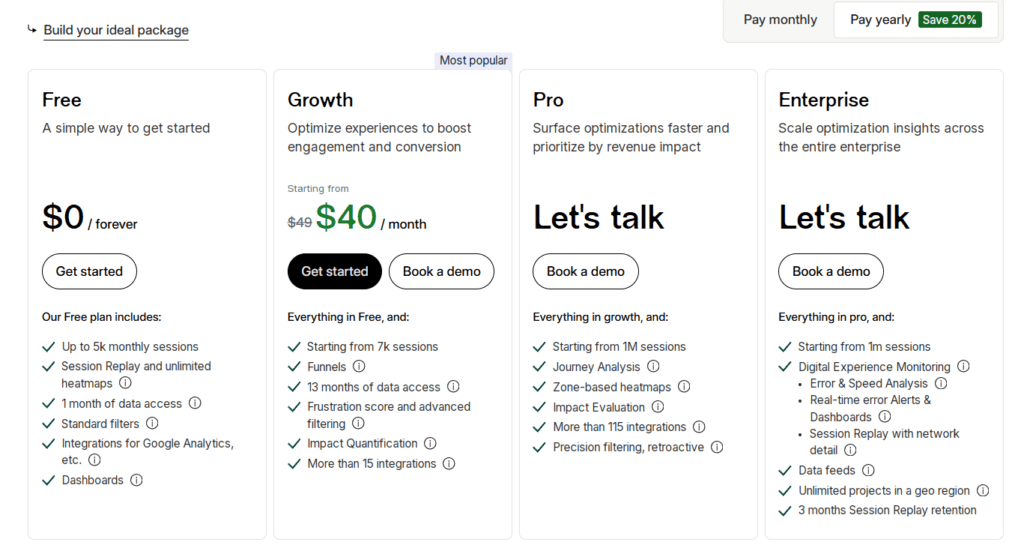
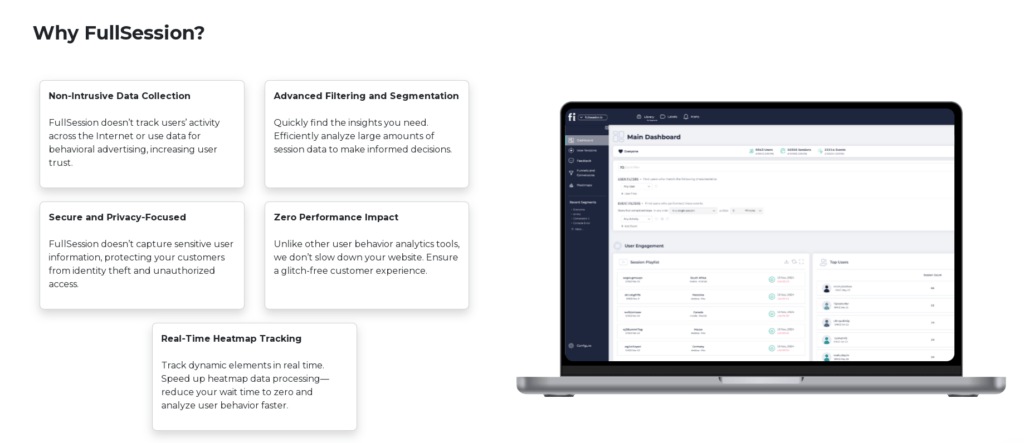
- FullSession is a user behavior analytics software that provides visual insights to help you optimize your website for better performance. It includes features like session recordings and replays, interactive heatmaps, customer feedback tools, conversion funnel analysis, and error tracking, which help you improve user experience without affecting site performance. FullSession is fully compliant with GDPR, CCPA, and PCI standards. Pricing starts at $39/month, with a 20% discount for annual plans. Book a demo today to see how it works!
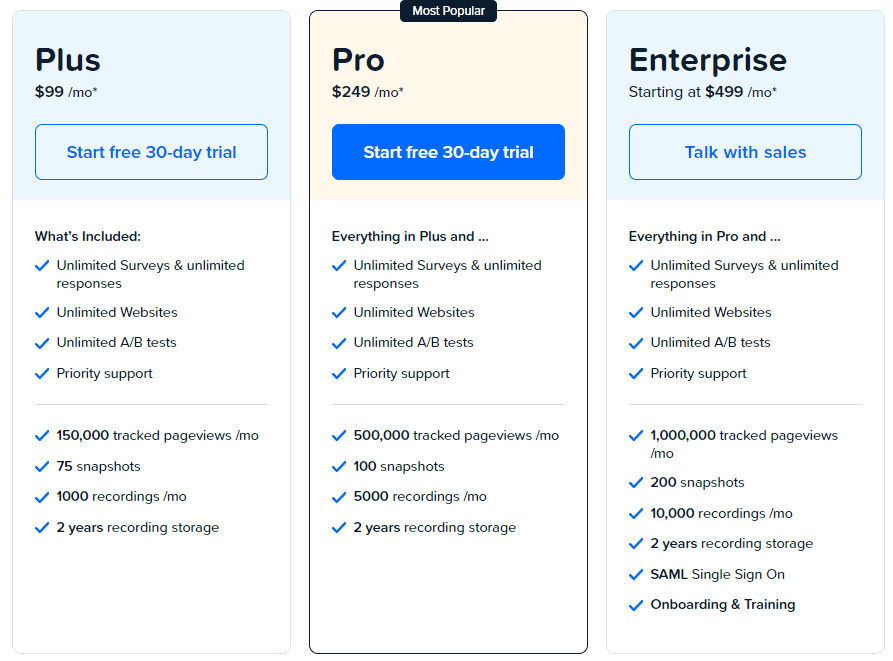
- Salespanel is a lead-tracking tool designed for B2B businesses to track visitor activity and qualify leads. It offers features like lead scoring, real-time visitor analytics, CRM integration, and email tracking to optimize sales efforts. However, it can be expensive for smaller businesses, with plans starting at $99/month.
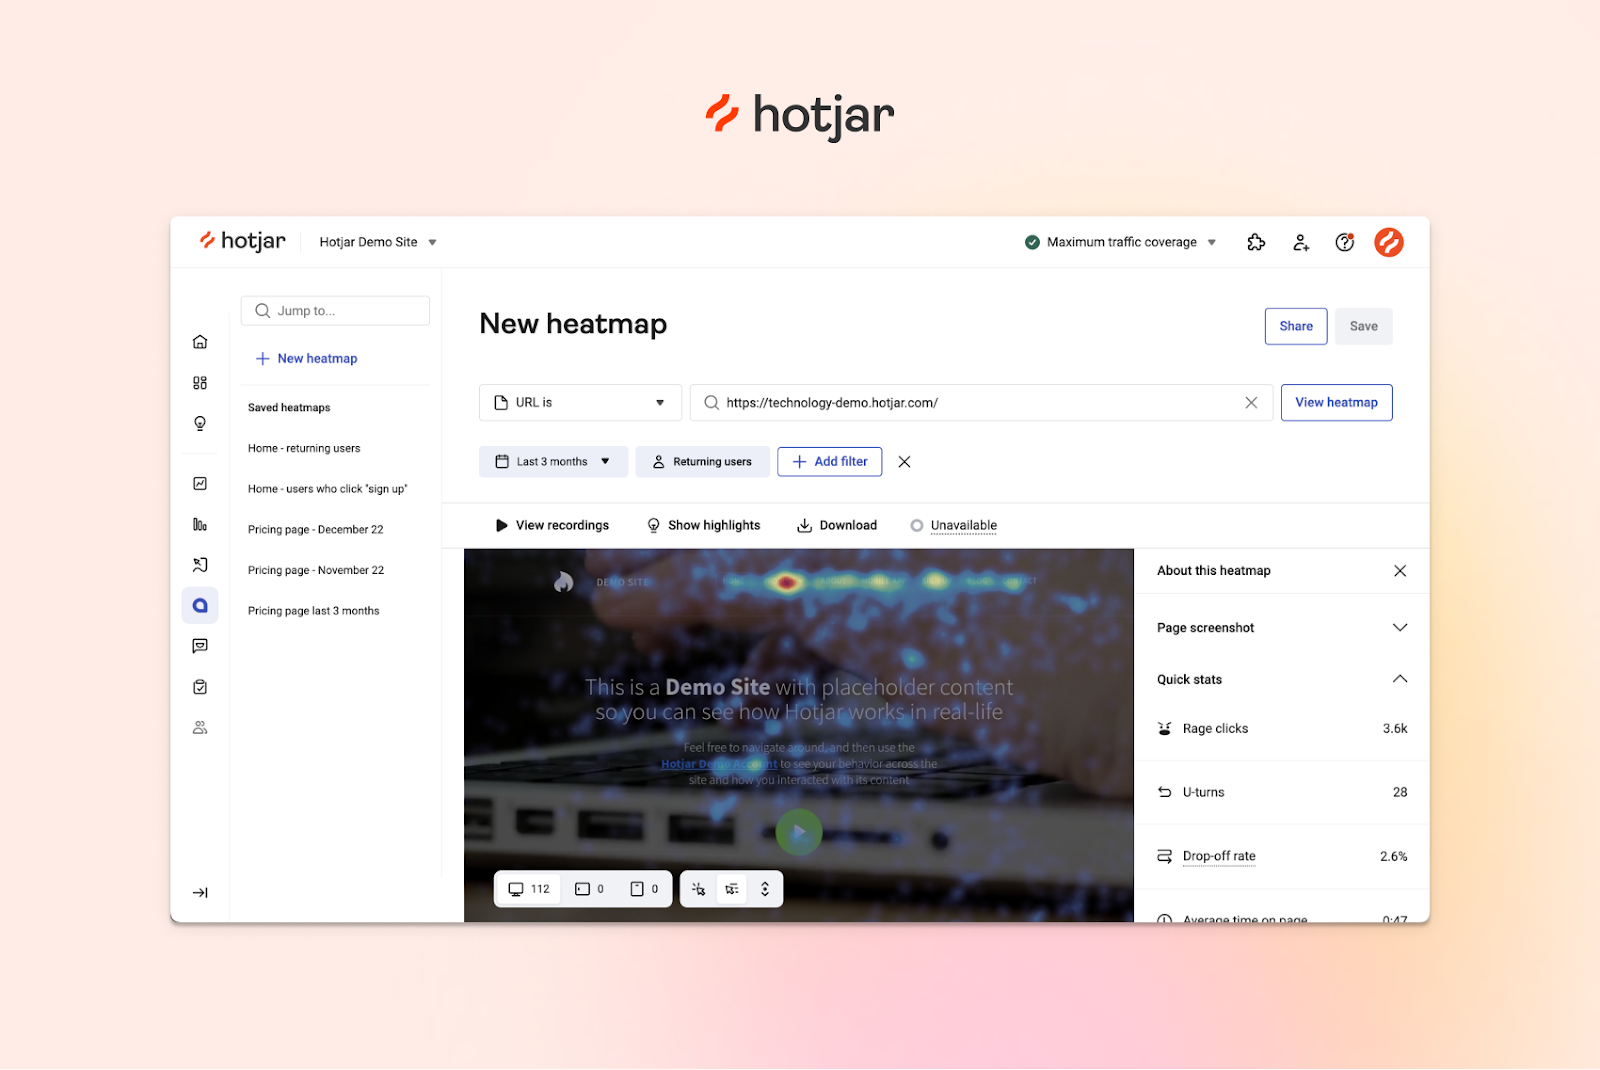
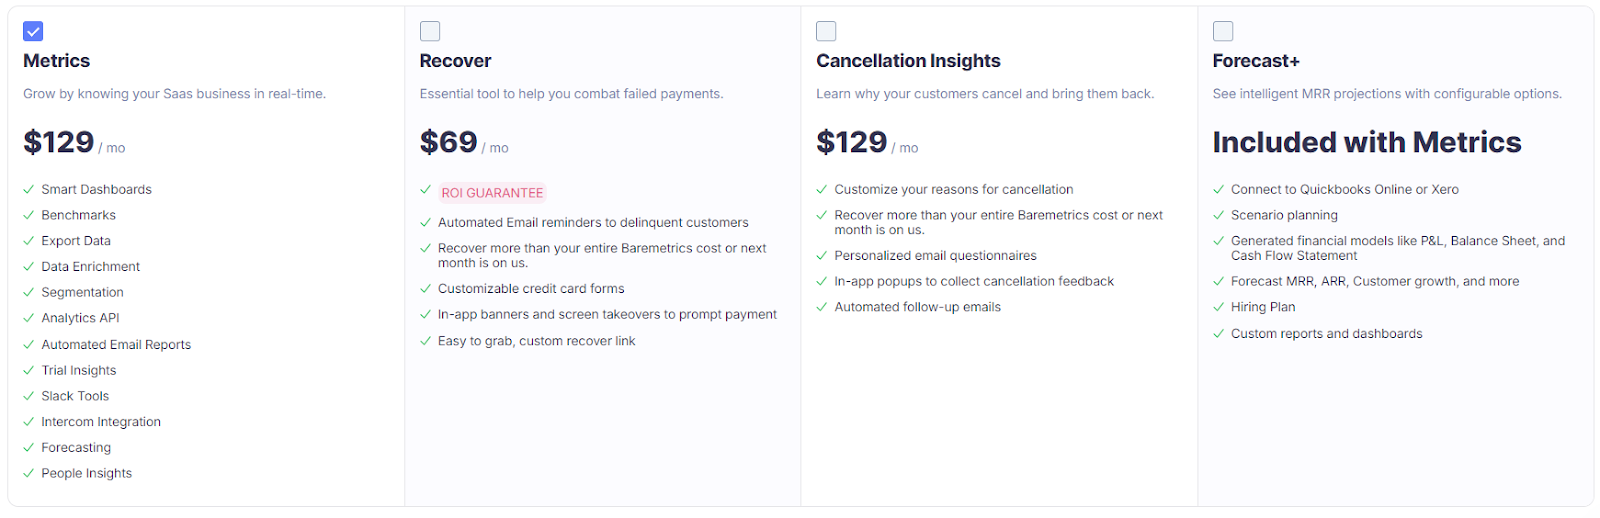
- Mouseflow is a digital experience analytics tool that tracks and analyzes website visitor behavior with session recordings, heatmaps, and form analytics. Its visual approach helps businesses understand user behavior and optimize website usability. Mouseflow starts at $39/month, though higher-traffic sites may find it expensive.
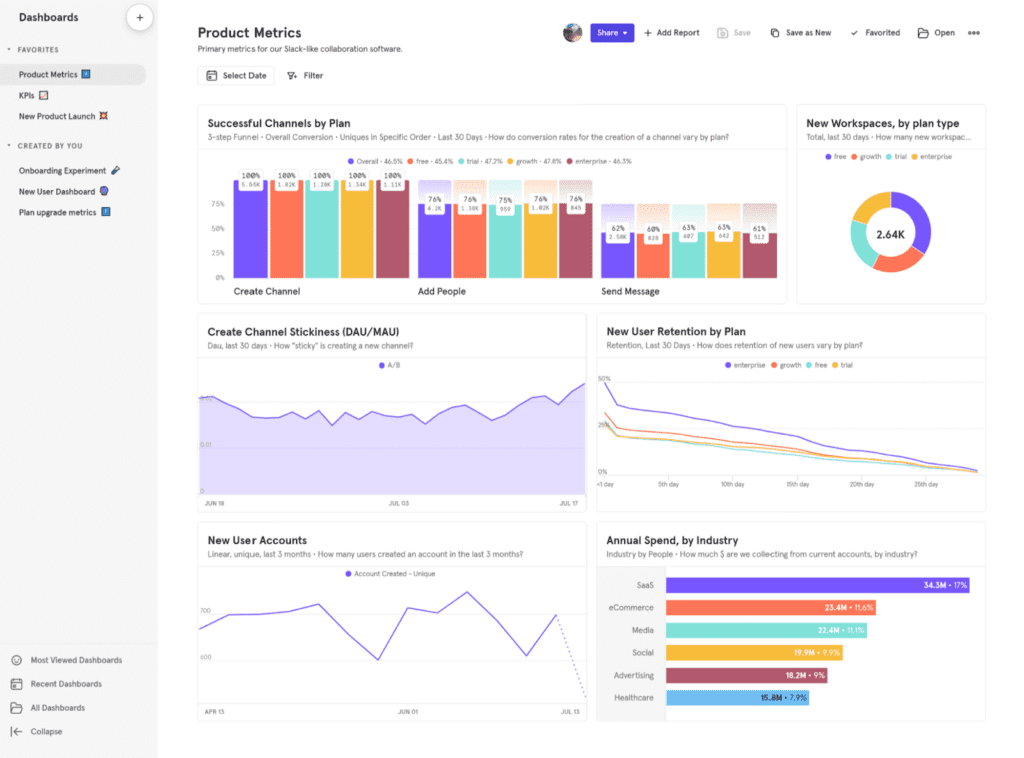
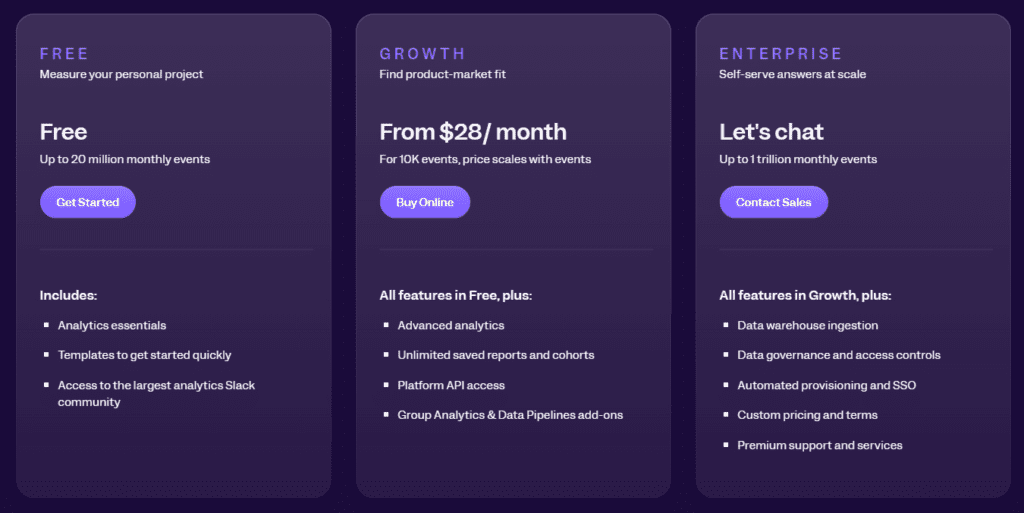
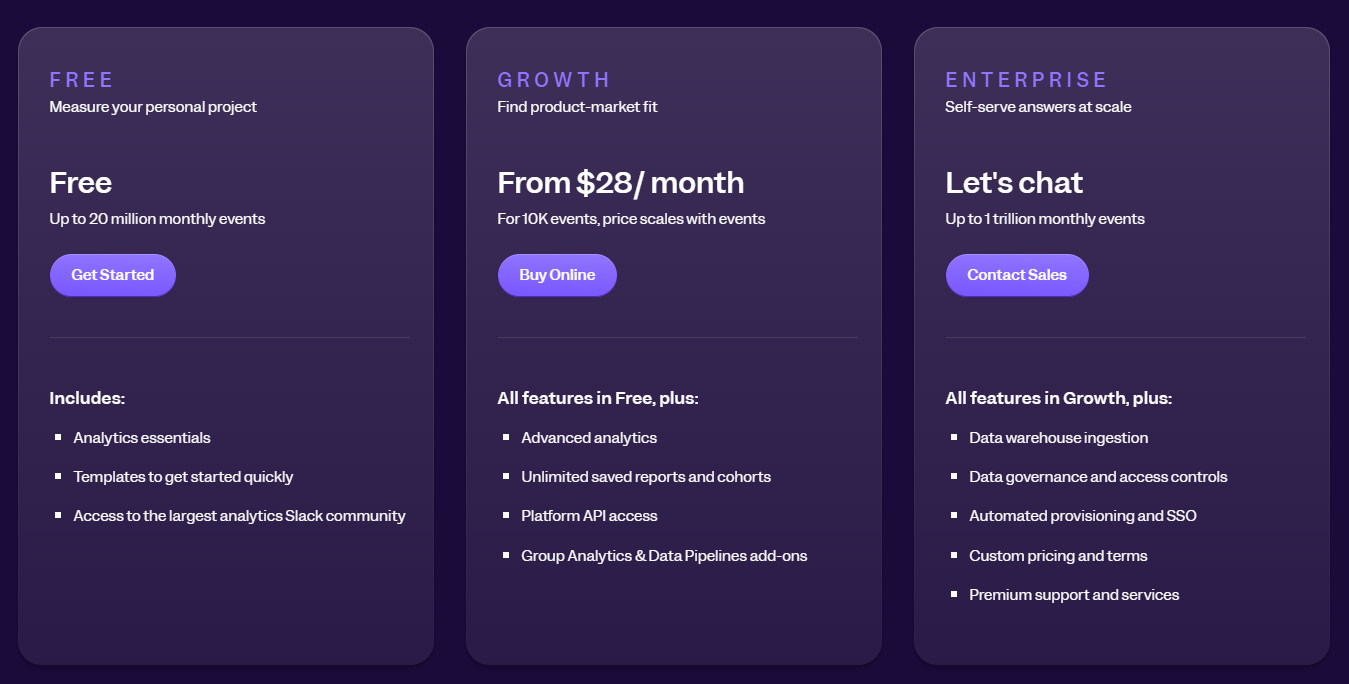
- Mixpanel is a product analytics tool that tracks user actions on both websites and mobile apps. It includes features like event tracking, funnel analysis, cohort analysis, and A/B testing to help businesses understand user behavior and improve retention. While powerful, it can be complex to set up, with paid plans starting at $28/month after a free plan for up to 1,000 tracked users.
- Ruler Analytics is a marketing measurement and attribution tool that tracks customer journeys from initial touchpoint to conversion. It ties marketing efforts directly to revenue with features like multi-touch attribution, call tracking, and CRM integration. Ruler Analytics can be costly, starting at £199/month, but it’s valuable for businesses needing detailed conversion tracking and revenue attribution.
- Smartlook is a product analytics tool that tracks user behavior on both websites and mobile apps. It provides insights through session recordings, heatmaps, event tracking, and funnel analysis. While affordable, with plans starting at $55/month, some advanced features are only available in higher-tier plans.
- Lead Forensics is a B2B lead generation tool that identifies anonymous website visitors and provides contact details for sales follow-up. Key features include visitor identification, lead scoring, real-time alerts, and CRM integration. However, its pricing model is custom and may not be affordable for smaller businesses. A demo is available to explore the platform’s capabilities.
Here’s a closer look at each of these website visitor tracking tools.
Start a Free Trial to Experience FullSession
See how to transform user data into actionable insights for peak website performance.
Best Website Visitor Tracking Software Right Now
Understanding how visitors interact with your website is the best way to improve the user experience and increase conversions.
Here are the top tools available to give you real-time insights and help optimize your site’s performance:
- FullSession (Get a demo)
- Salespanel
- Mouseflow
- Mixpanel
- Ruler Analytics
- Smartlook
- Lead Forensics
1. FullSession
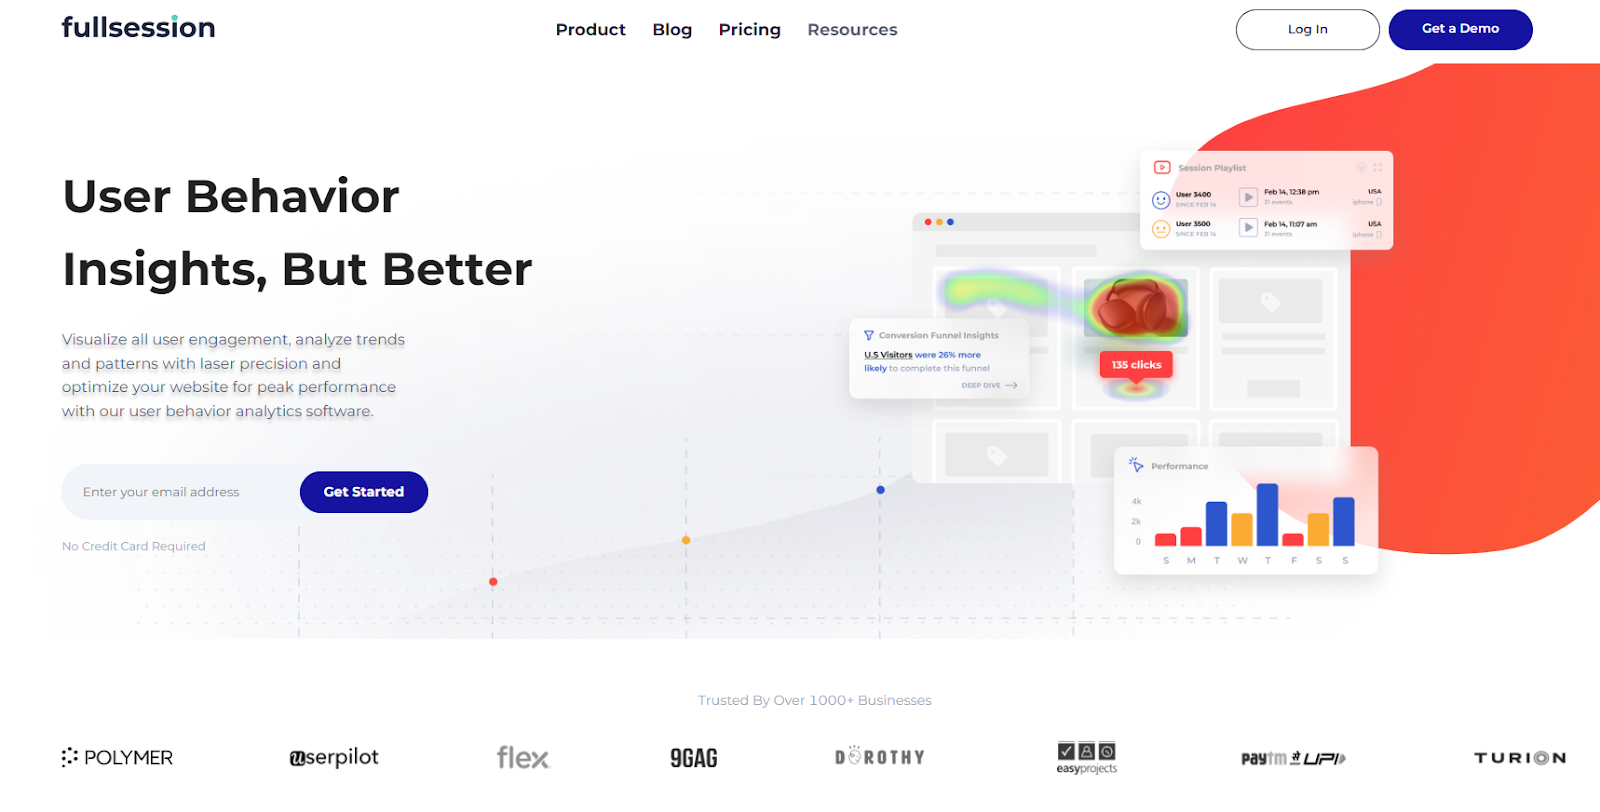
FullSession is an advanced user behavior analytics software that excels at tracking every detail of visitor activity on your website.
It provides a 360-degree view of how users interact with your site, letting you dive deep into specific behaviors and engagement patterns so you can maximize performance and conversion rates.
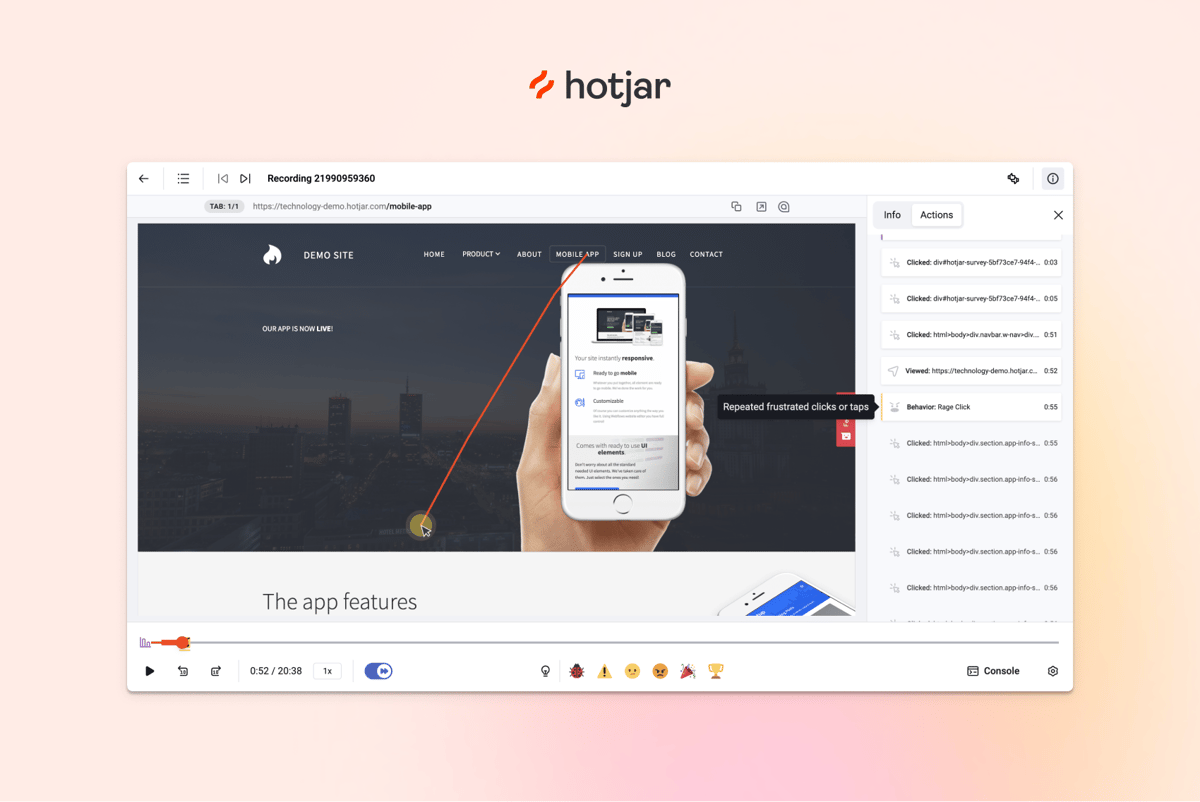
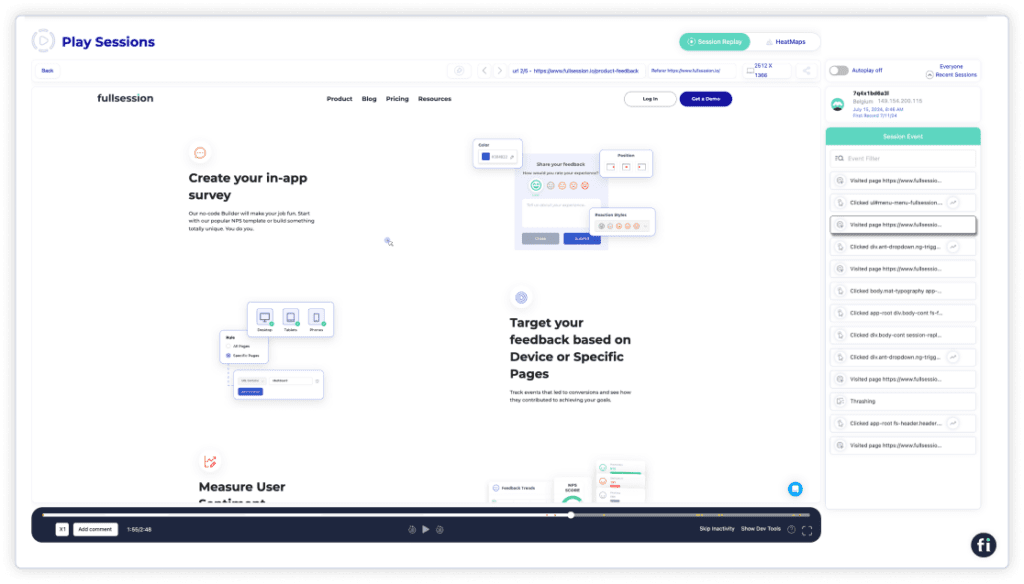
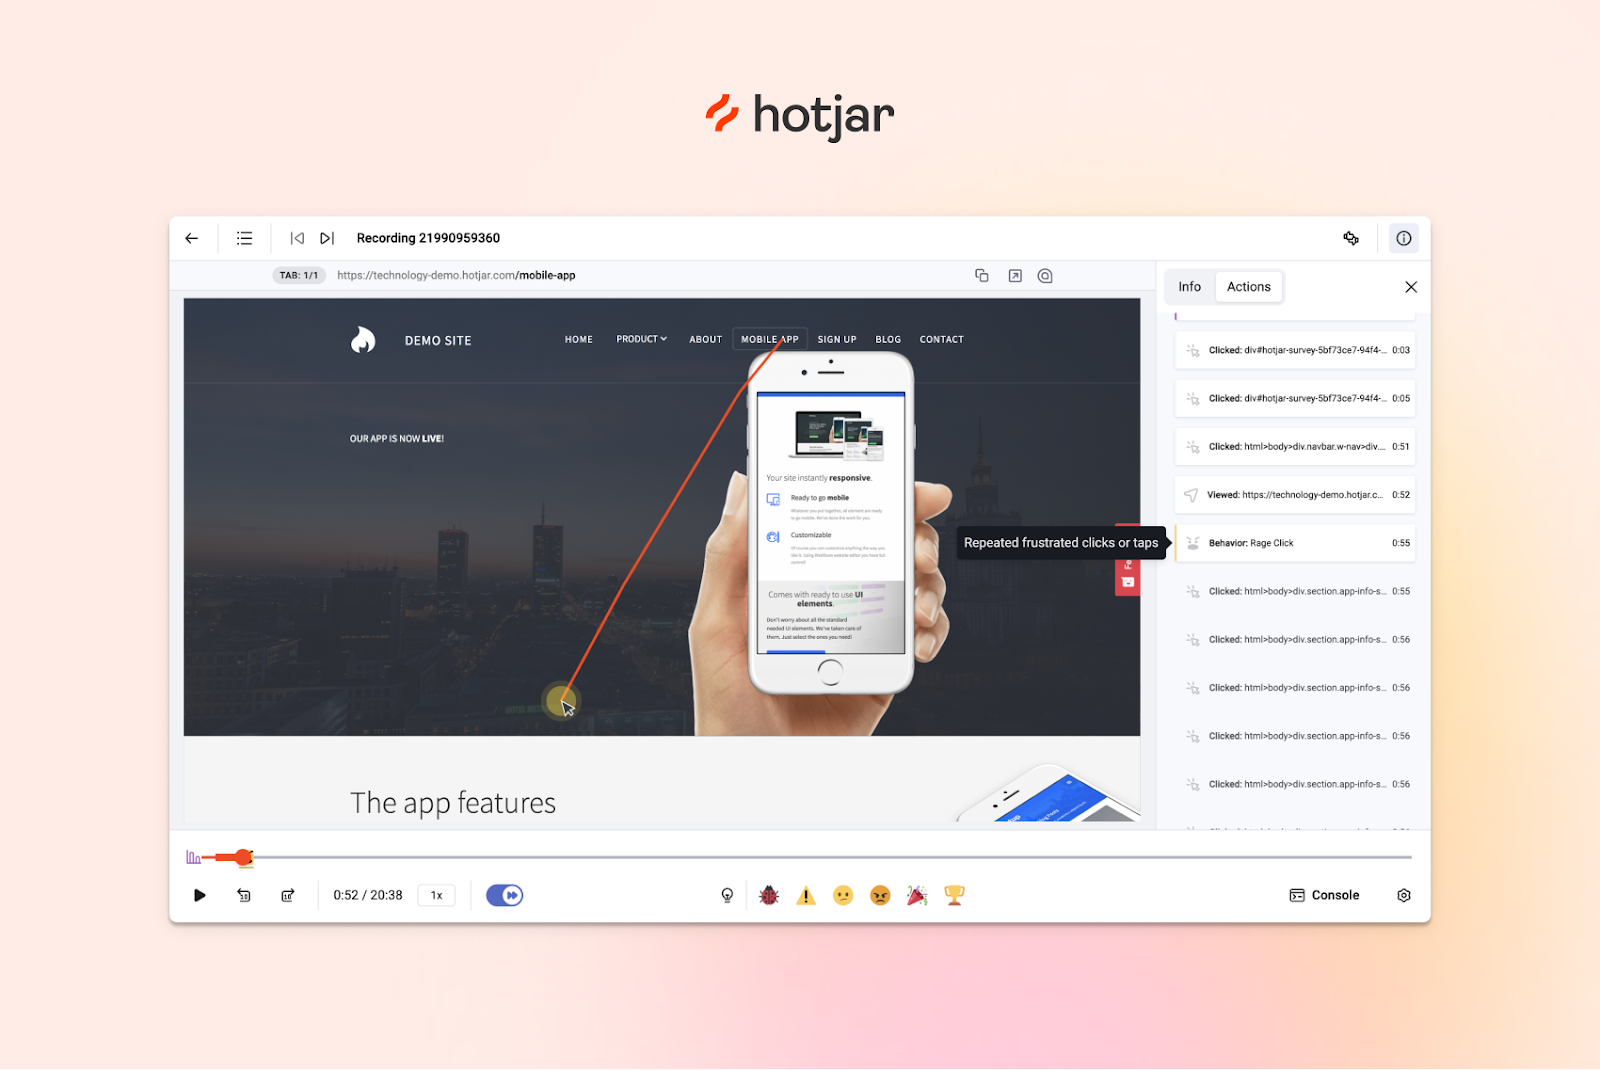
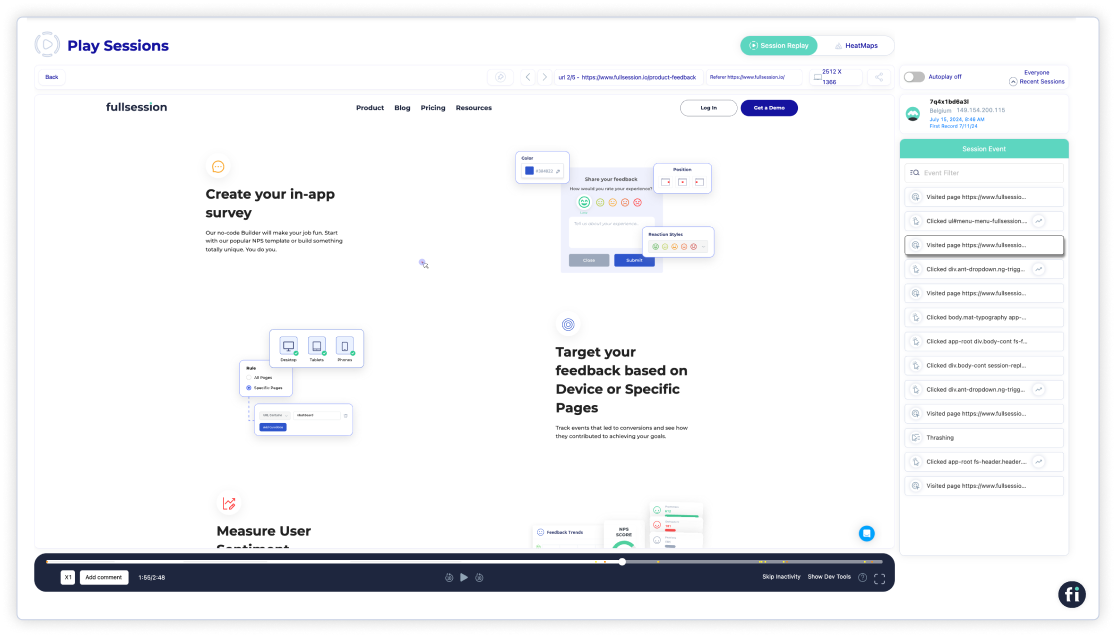
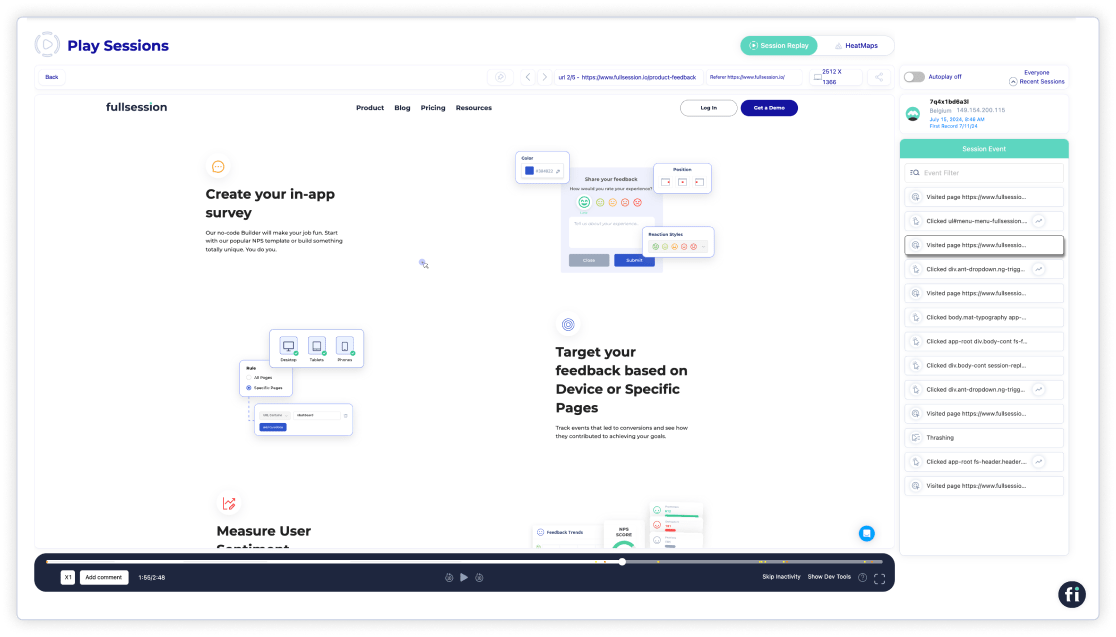
With real-time session replays, you can see how users move through your site, which buttons they click, where they pause, and even where they get stuck.
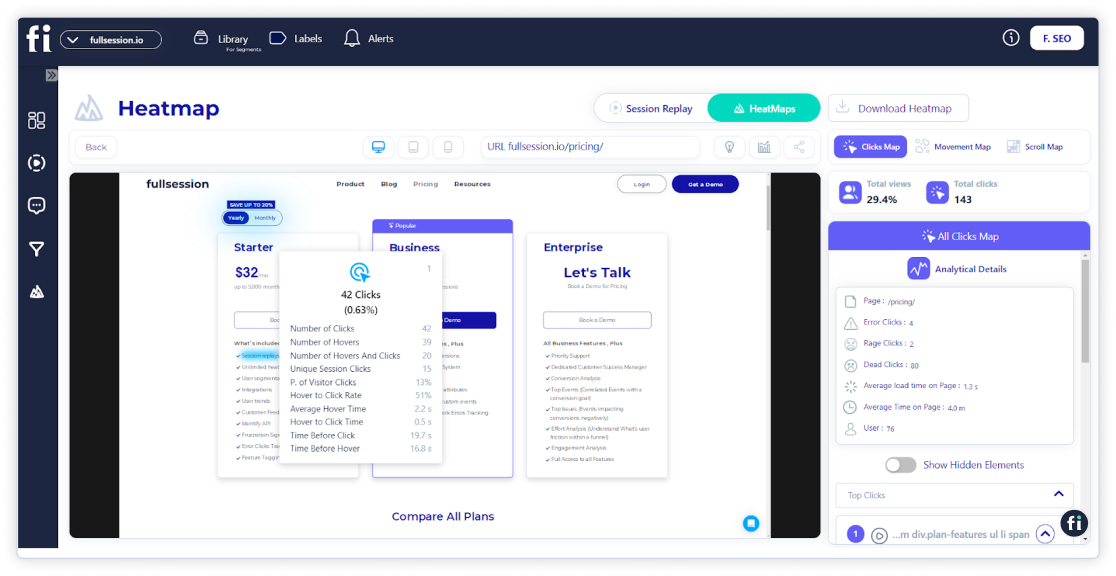
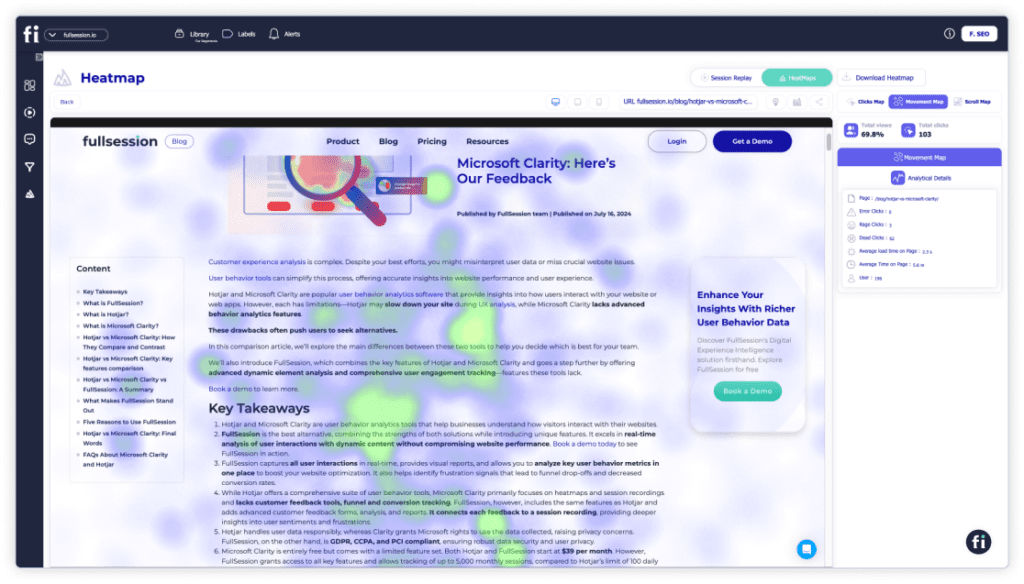
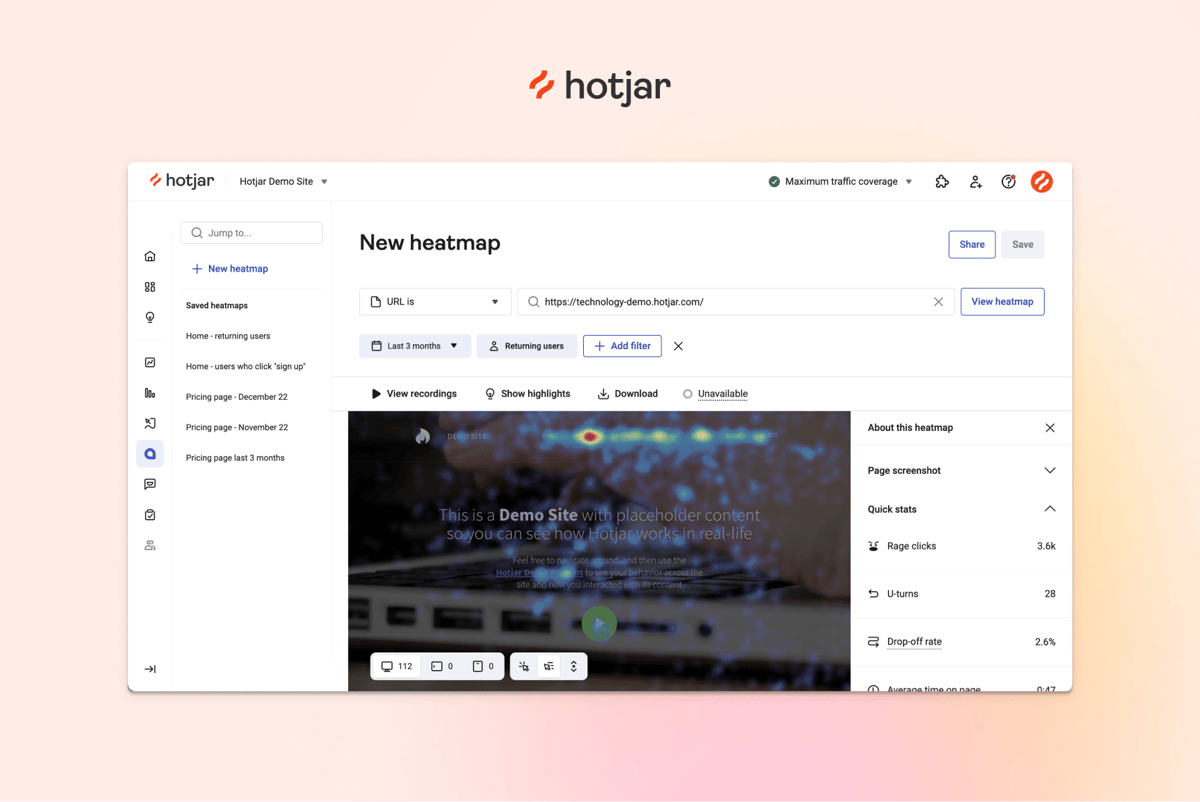
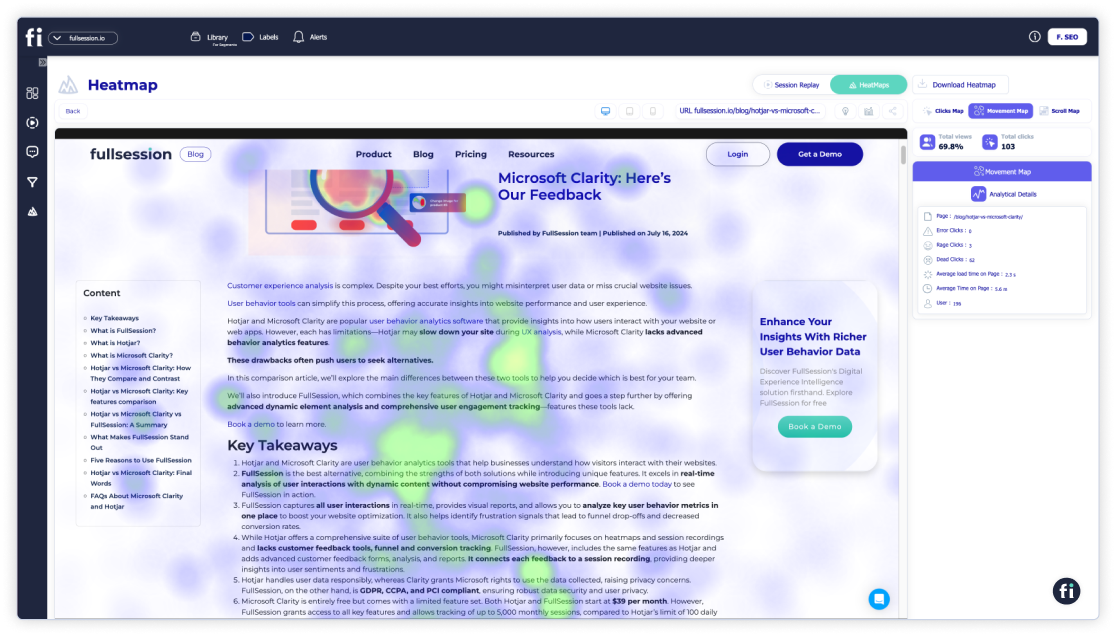
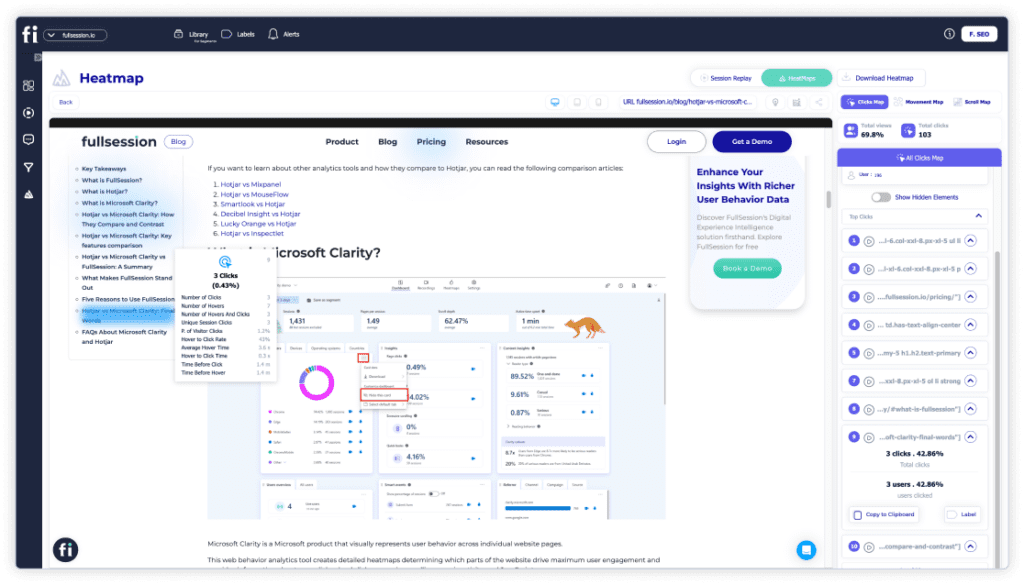
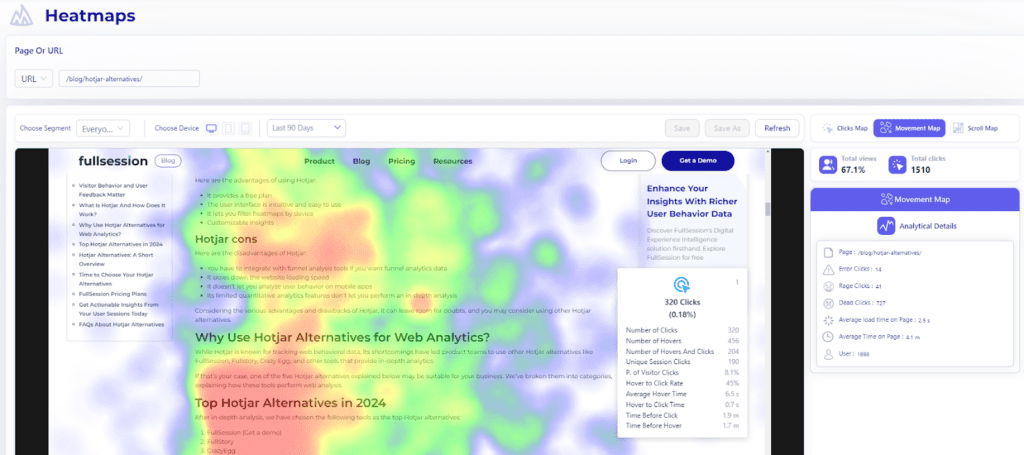
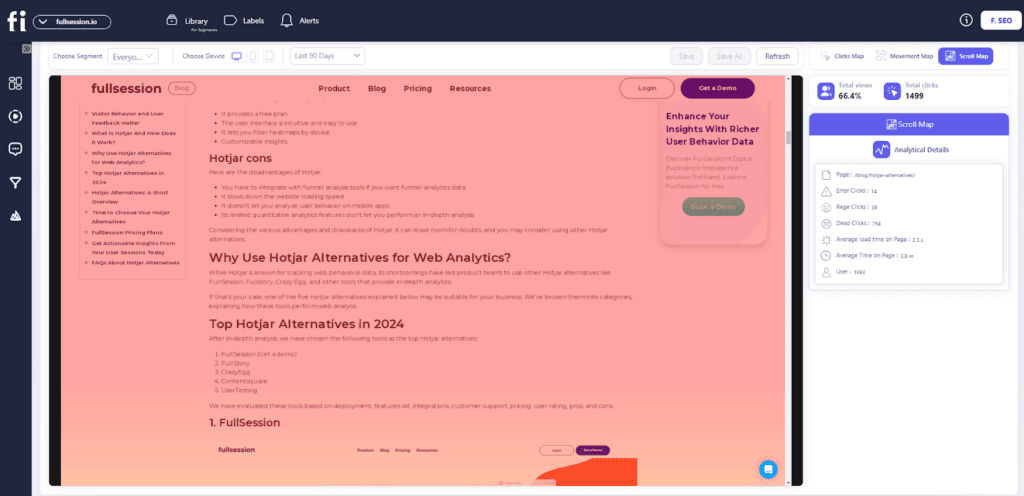
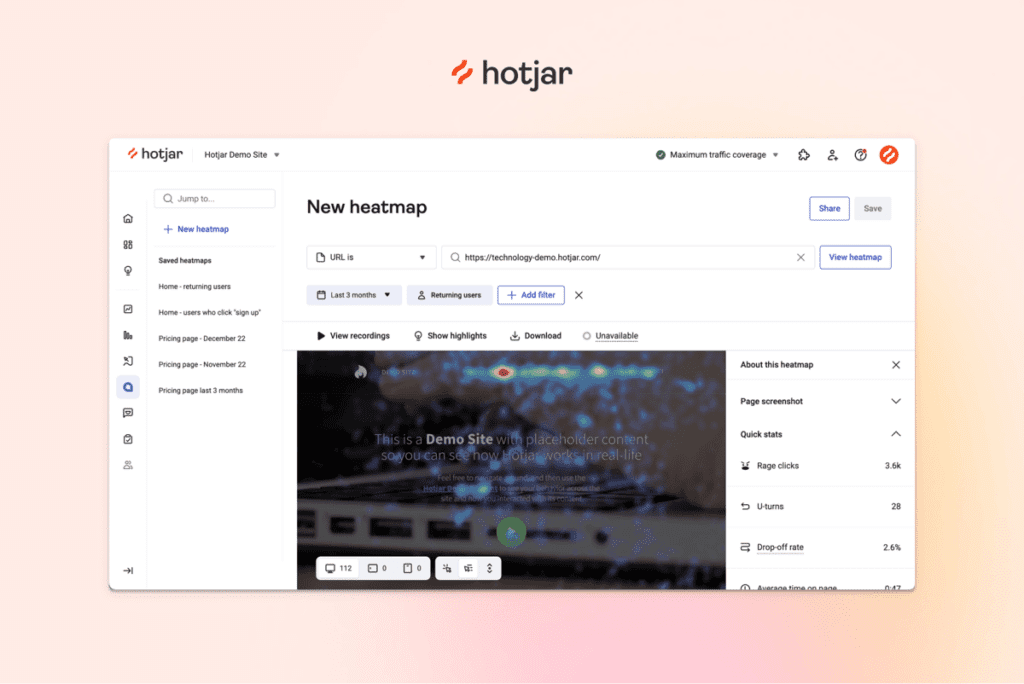
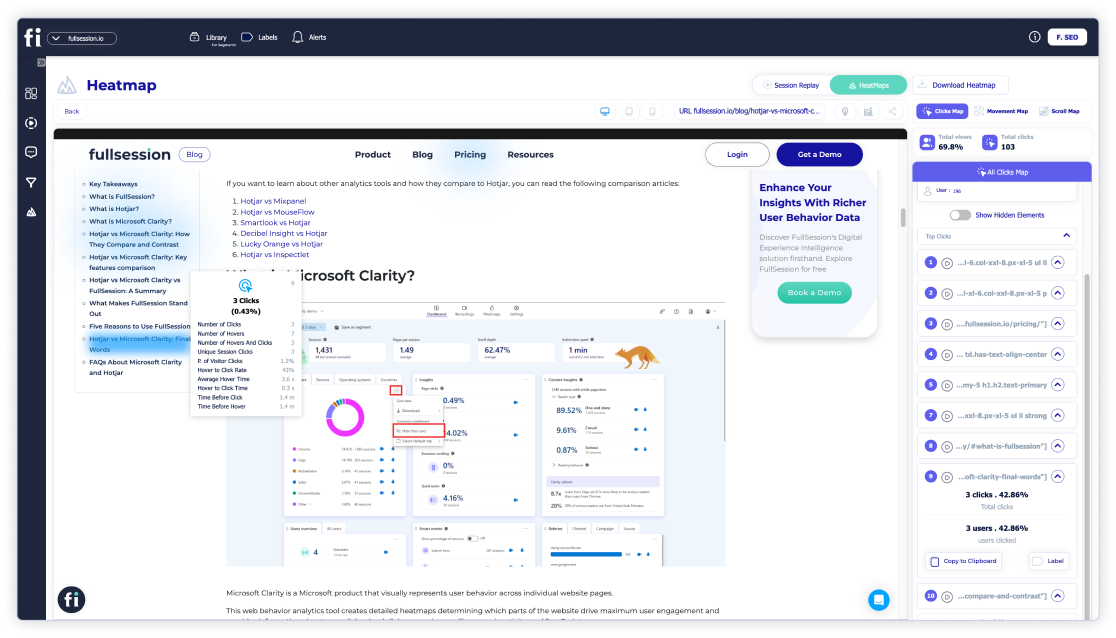
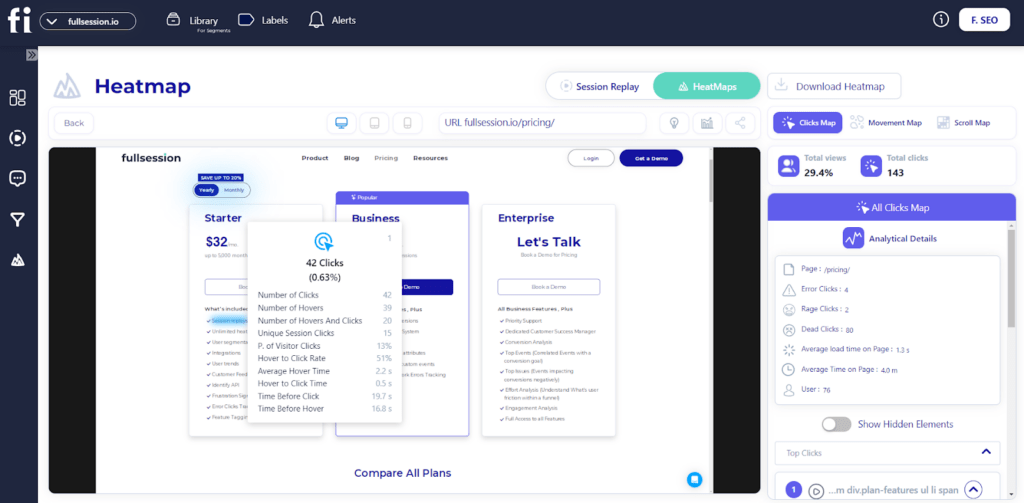
Its interactive heatmaps show exactly which areas of your site are underperforming or getting the most attention. This lets you see at a glance what’s working and where adjustments are needed.
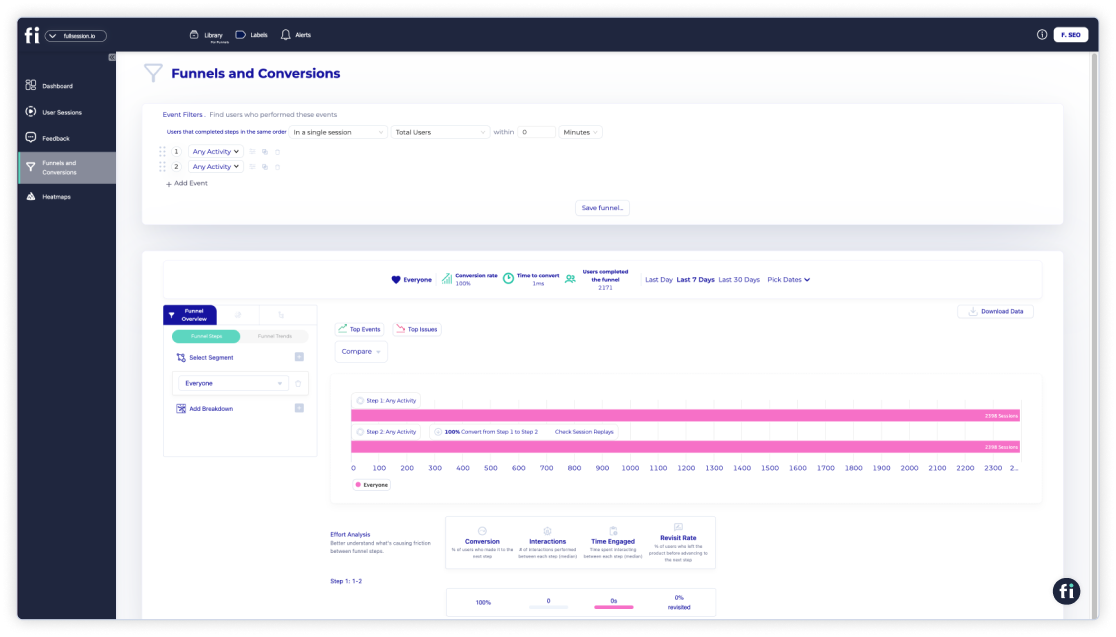
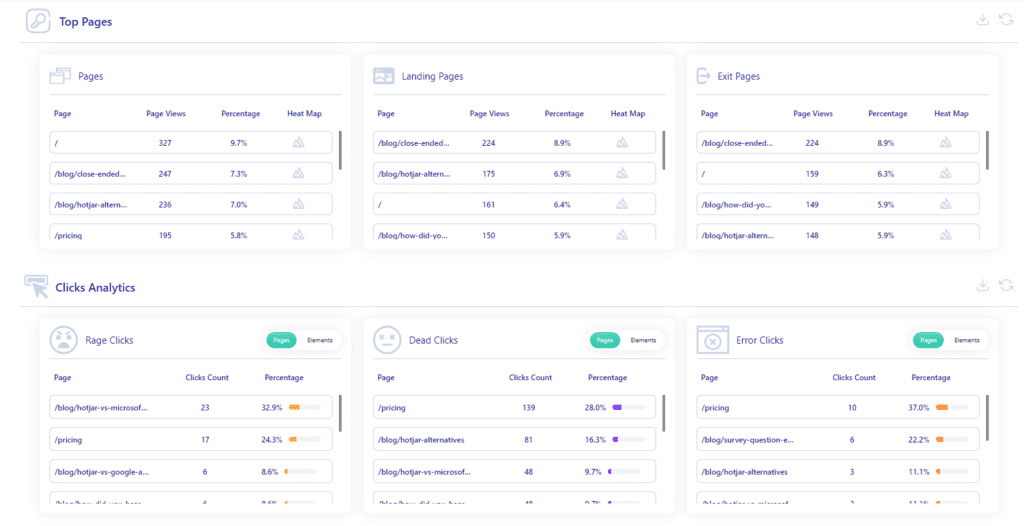
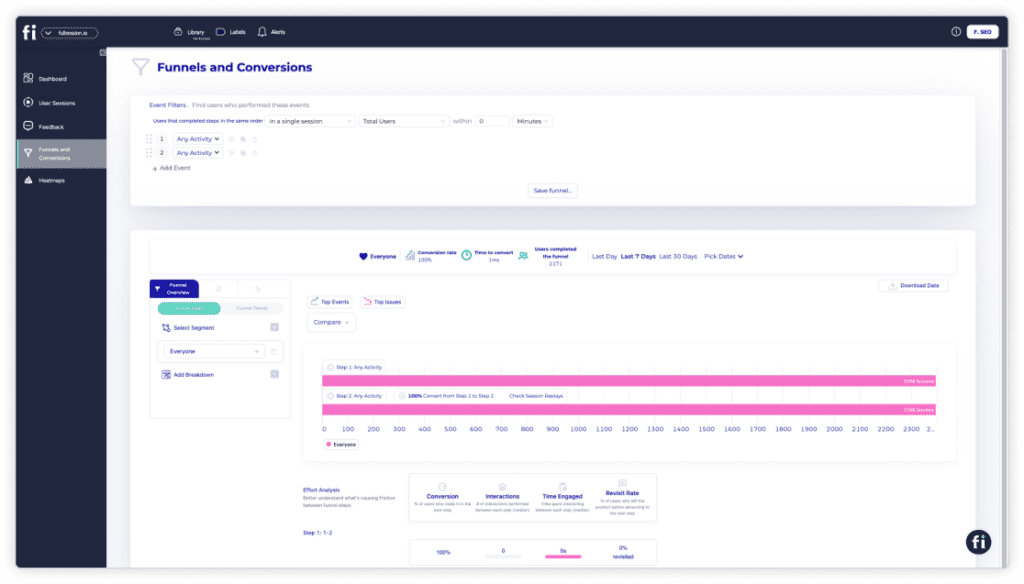
FullSession also offers conversion funnel analysis to help you remove conversion funnels and optimize touchpoints in the user journey. It also has error tracking, which can help detect problems that can lead to funnel abandonment.
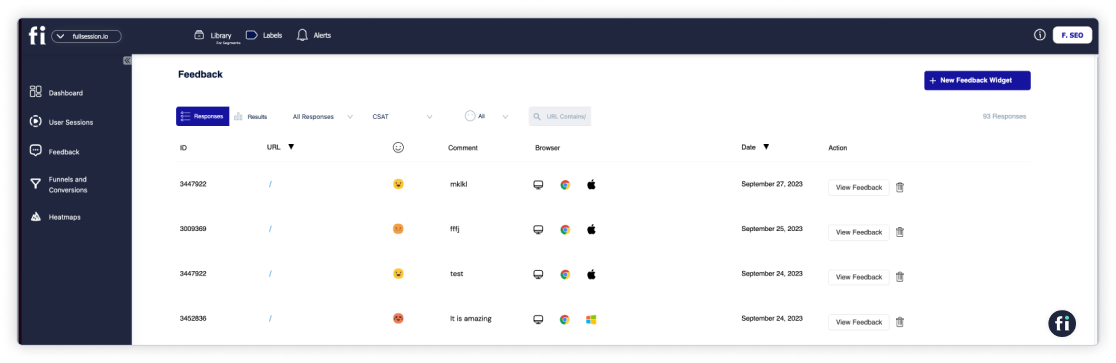
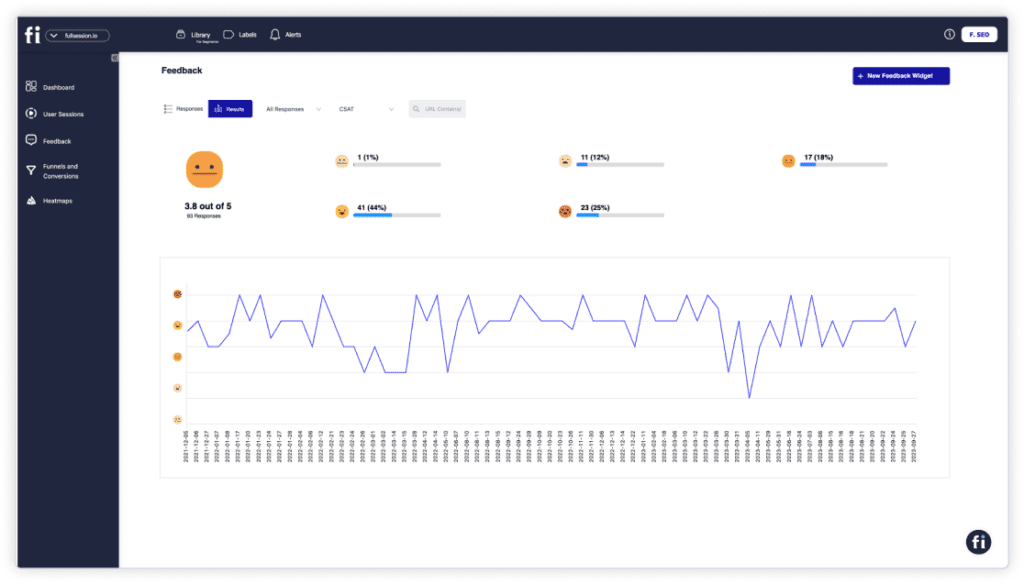
FullSession lets you create and customize website feedback forms to gain direct insights from your visitors.
Another key strength of FullSession is its ability to track user activity while prioritizing data security and privacy, which helps ensure GDPR, CCPA, and PCI compliance.
Start a free trial or book a demo now to learn more.
Best for
FullSession is perfect for businesses of all sizes that want detailed insights into user activity.
It’s especially useful for teams in product development, UX/UI design, customer support, and marketing who need actionable data to optimize user experiences, increase retention, and boost platform performance.
Key features
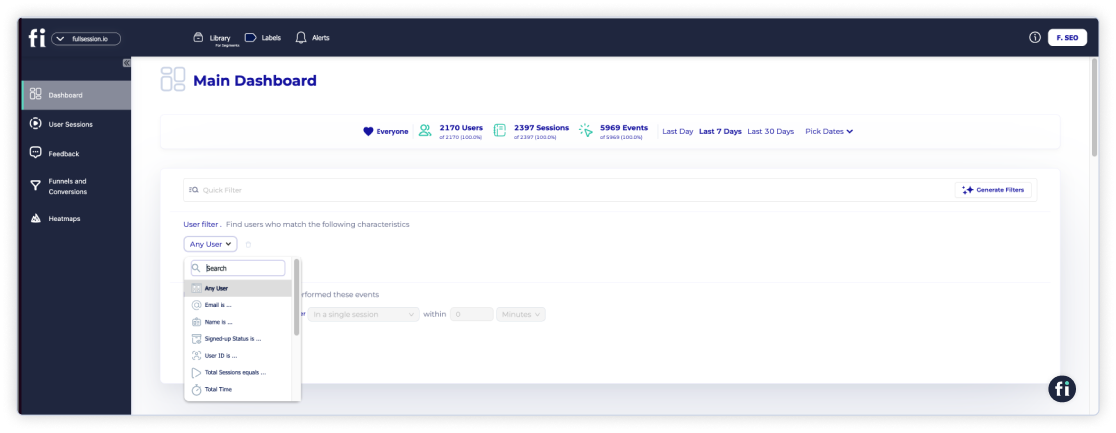
- Advanced user and event segmentation: Use filters like demographic data and specific events to find the particular website visits you’re looking for. Break down user activity into specific groups to uncover trends and improve the overall site experience.
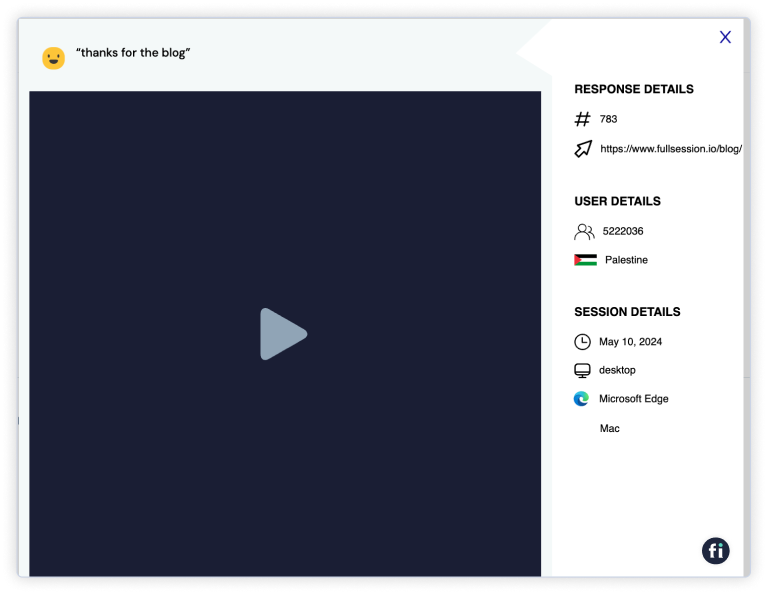
- Session recording and replay: Watch real user sessions in real time to see exactly how website visitors are navigating your site and interacting with key elements.
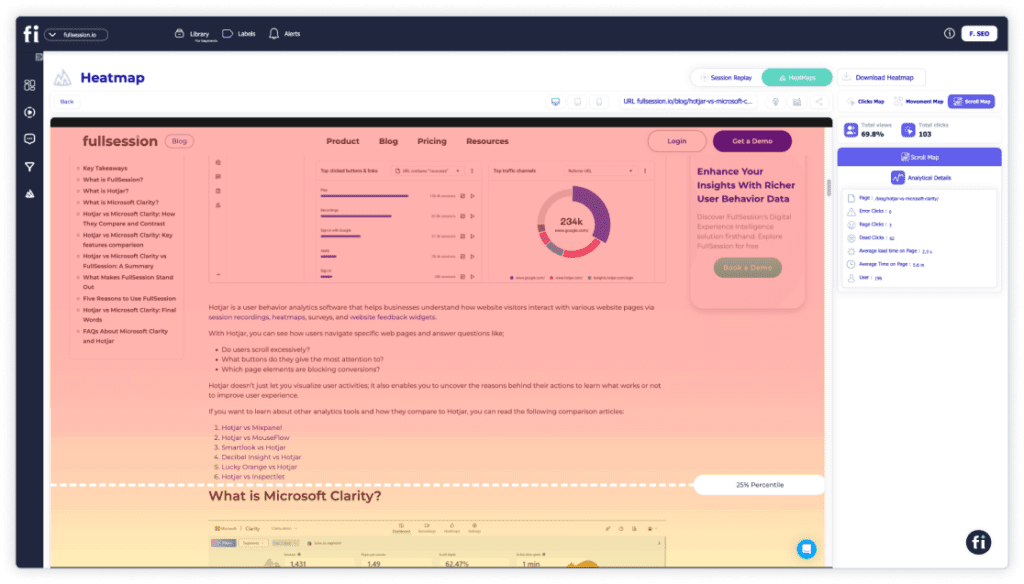
- Interactive heatmaps: Get clear visual data on where users scroll, click, or hover their mouse to pinpoint the most engaging areas of your site.
- Custom feedback tools: Gather direct user feedback through website forms and match it with session recordings to get context on user activity.
- Conversion funnel optimization: Visualize where users drop off during their journey and identify touchpoints that need improvement.
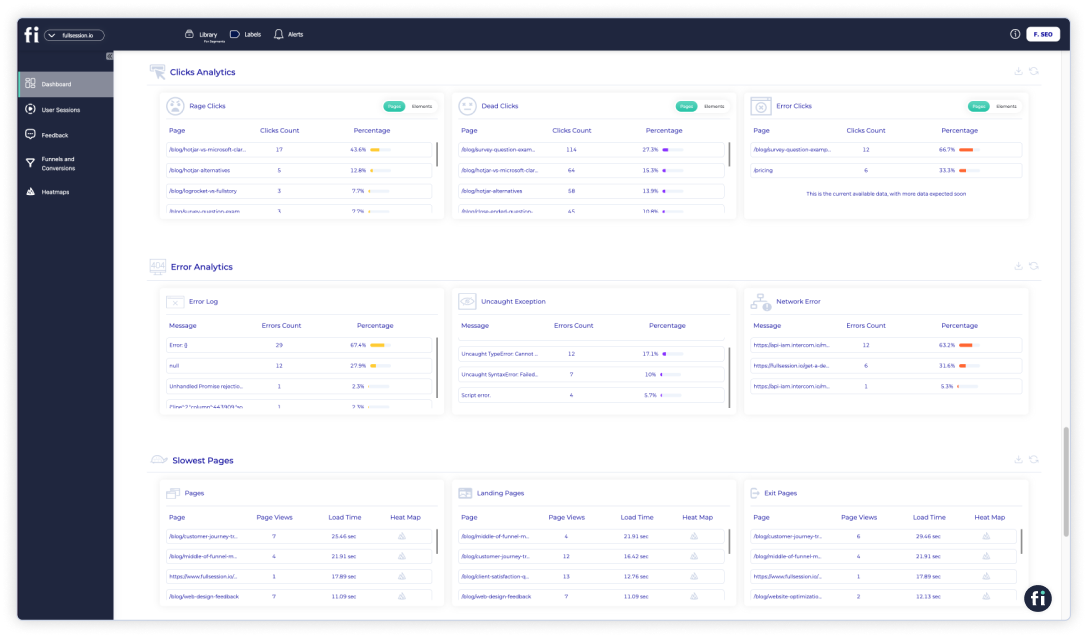
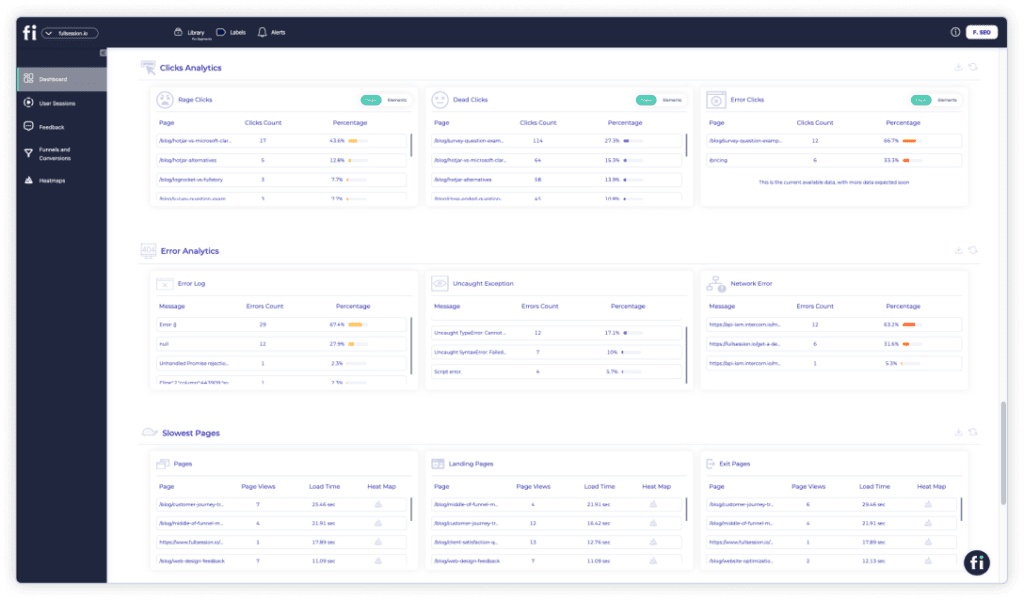
- Error analysis: Catch errors like JavaScript issues or failed API calls that could impact user experience and lead to lost conversions.

Supported platforms
FullSession supports tracking user behavior on web platforms and can record mobile web user interactions.
Integrations
This visitor tracking tool makes it easy to streamline your workflows with a variety of integration options.
Whether you’re using APIs, webhooks, Zapier, or native integrations, FullSession connects smoothly with your existing tools, automating tasks and keeping your data in sync across all systems.
It works seamlessly with popular platforms like BigCommerce, Wix, Shopify, and WordPress, which allows you to set it up quickly and get your operations running efficiently in no time.
Customer support
FullSession offers live chat and email support, along with a robust help center. This ensures you can get quick assistance whenever you need help tracking user activity or resolving issues.
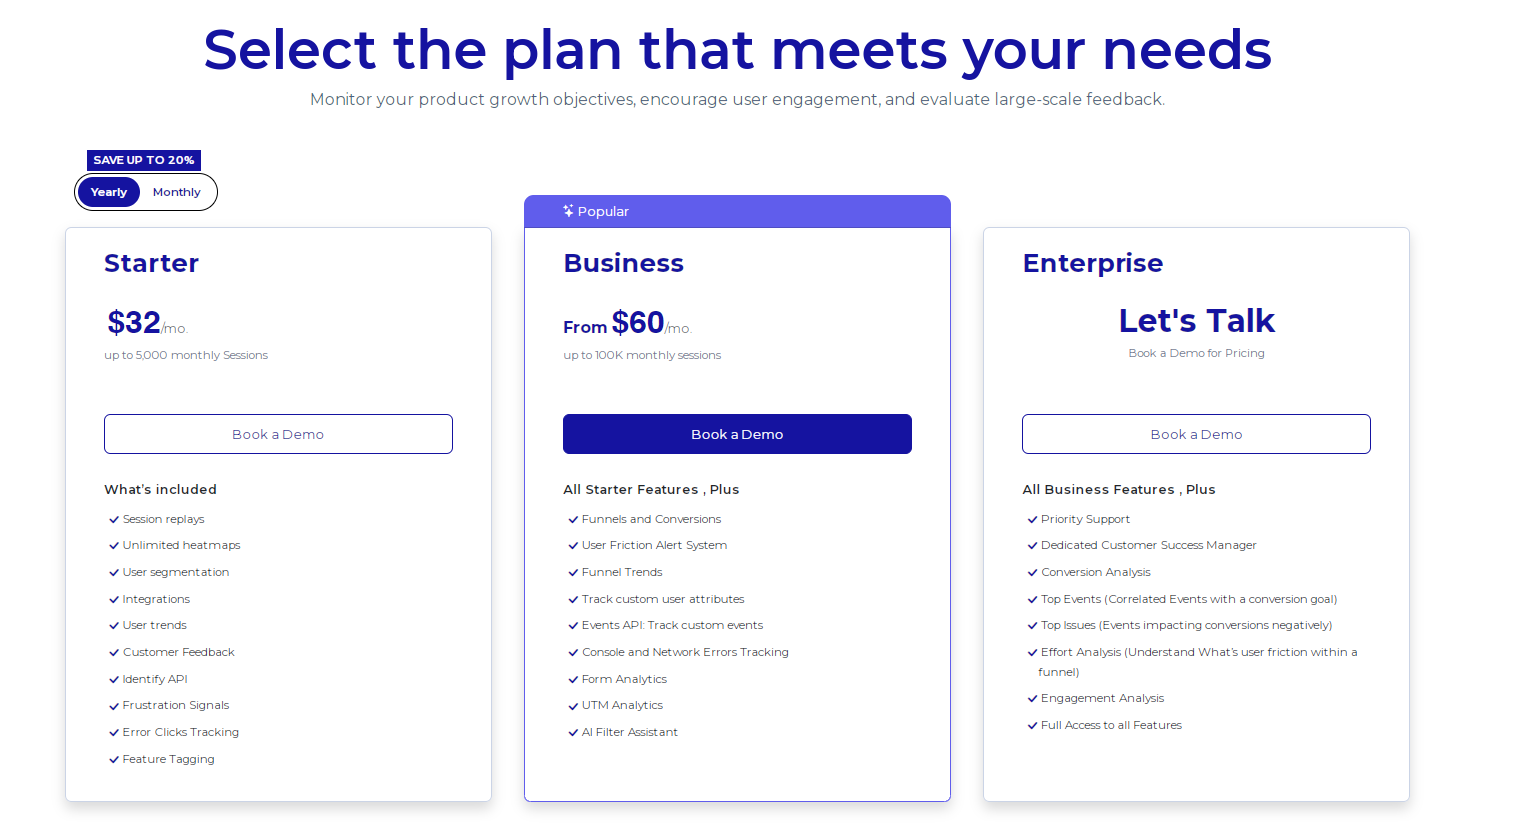
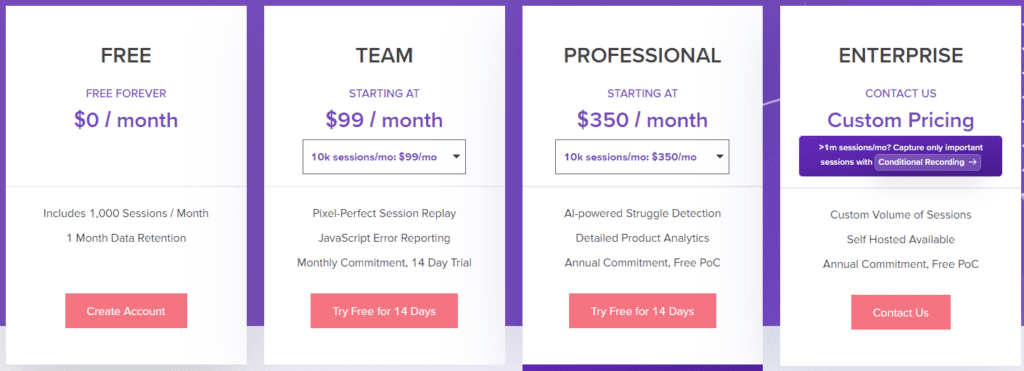
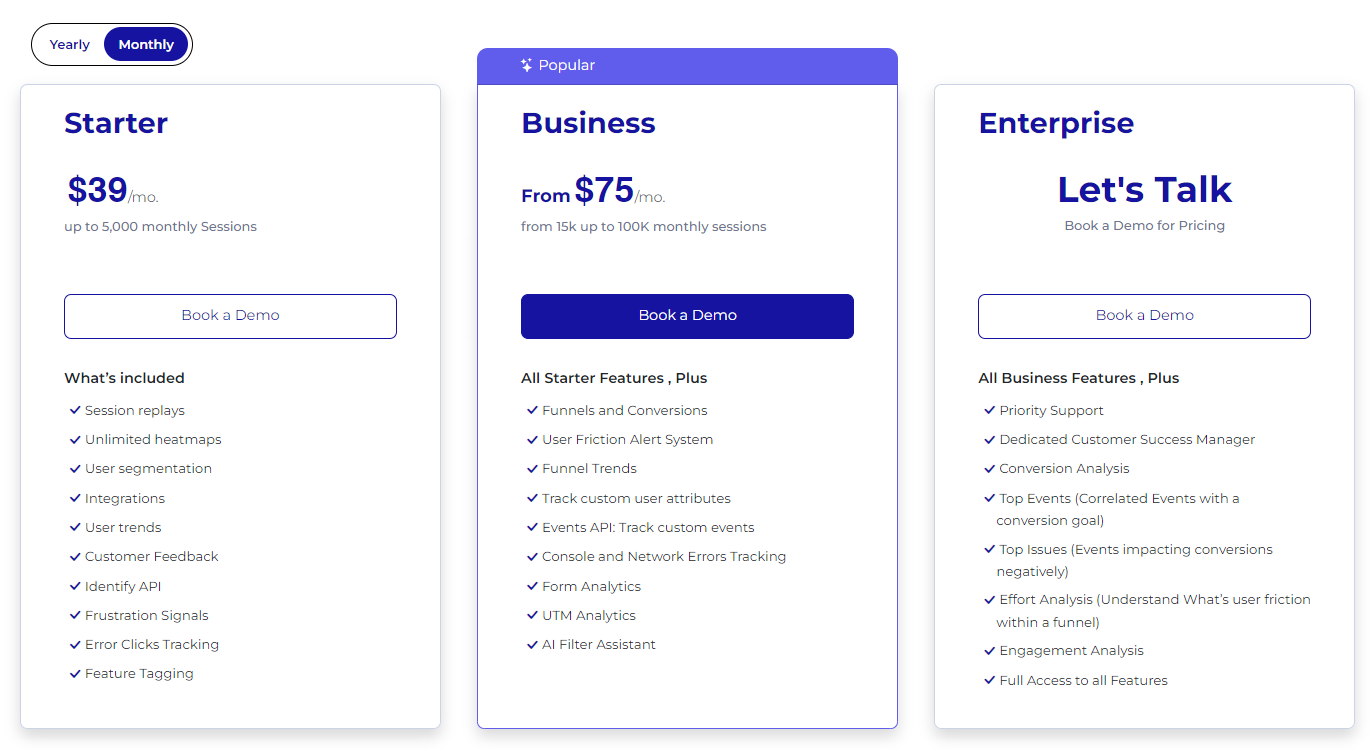
Pricing
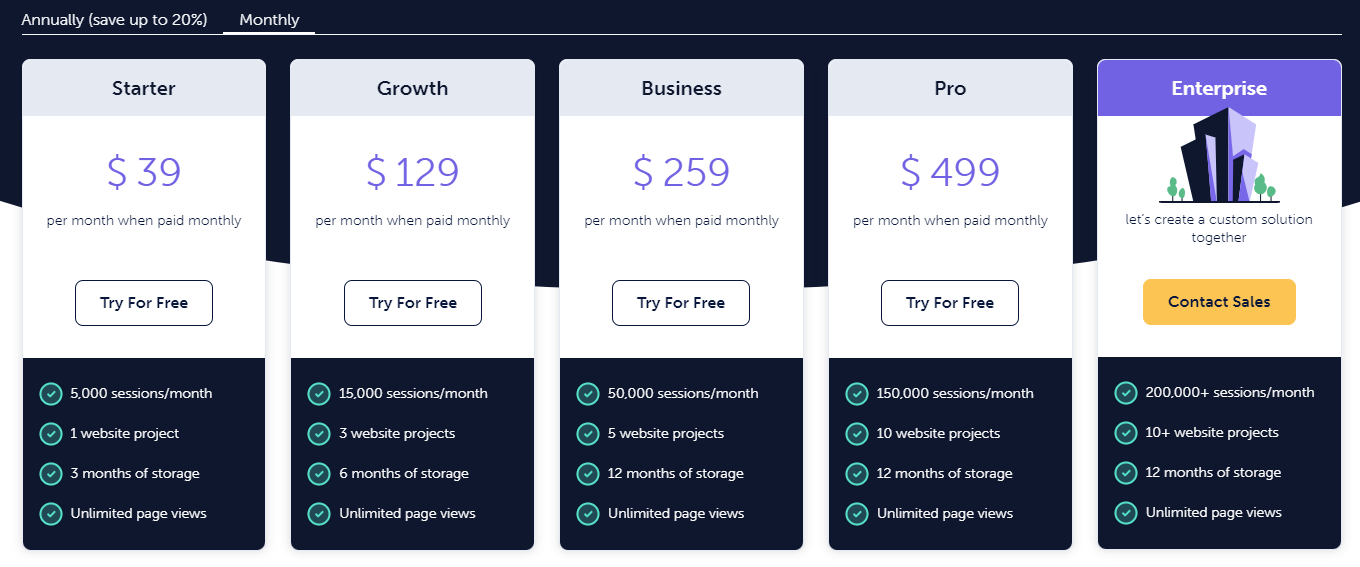
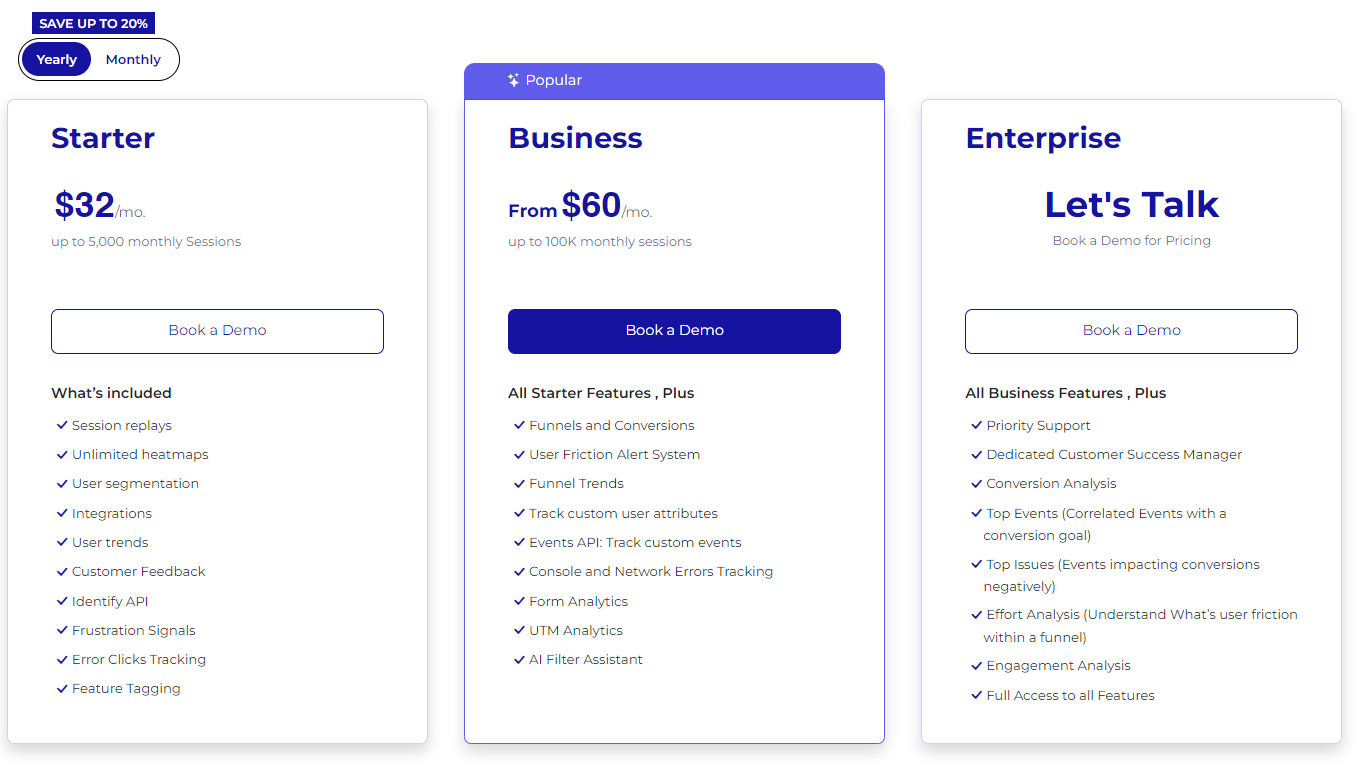
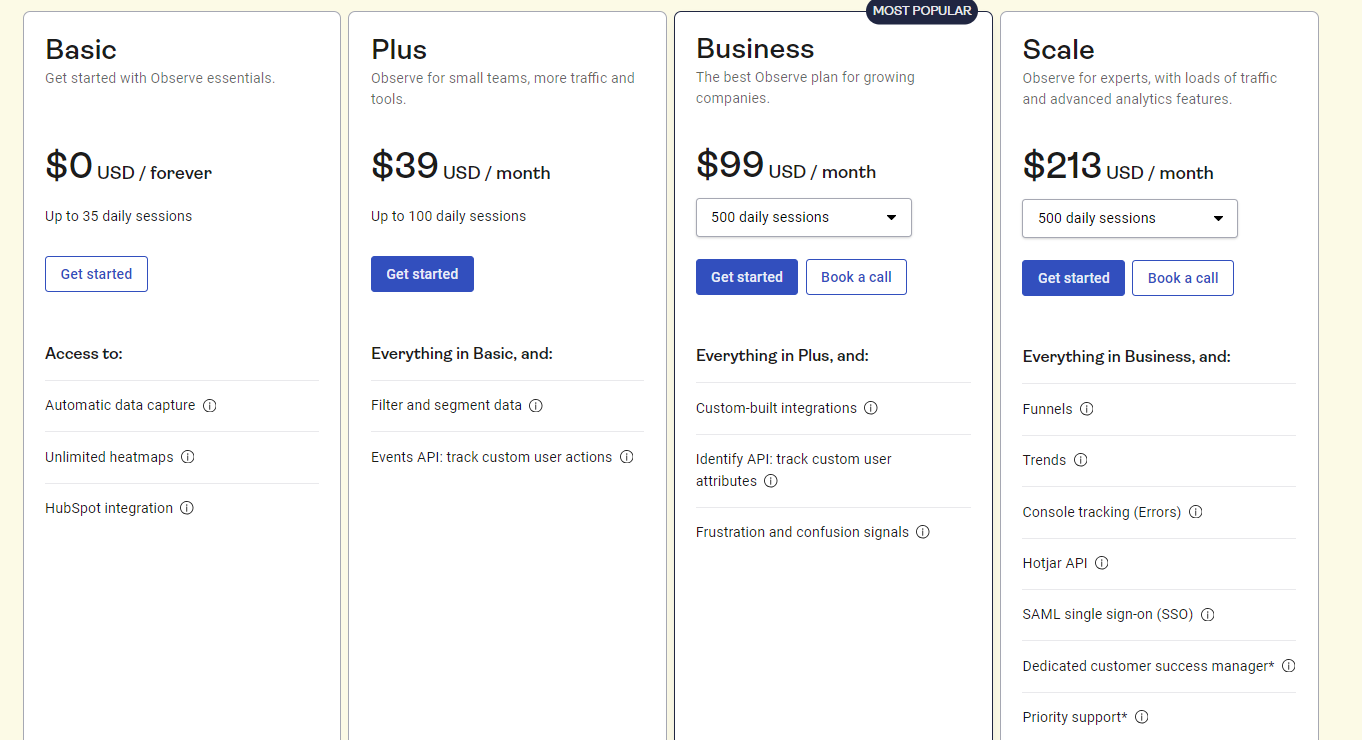
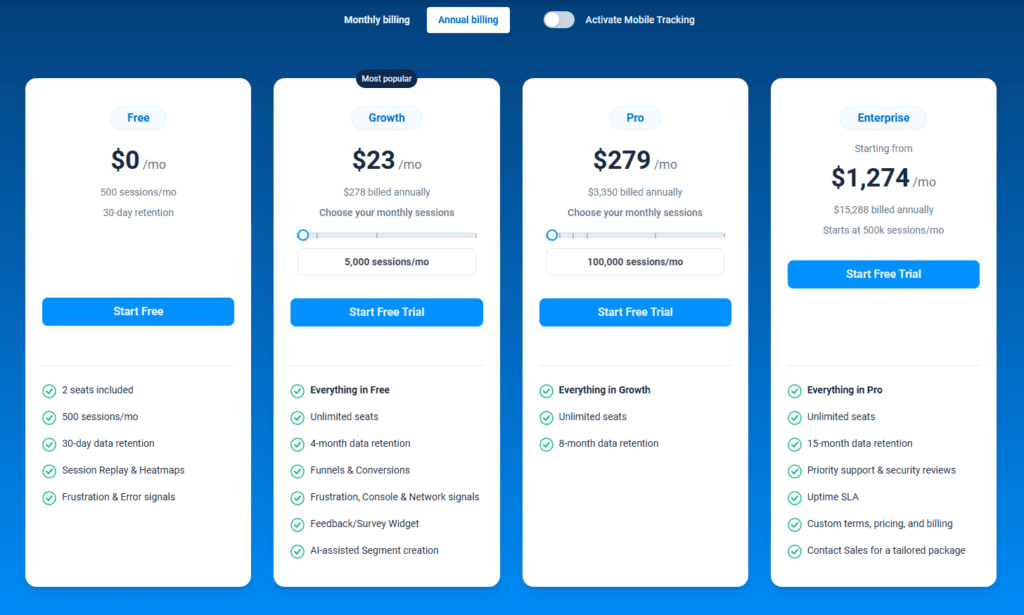
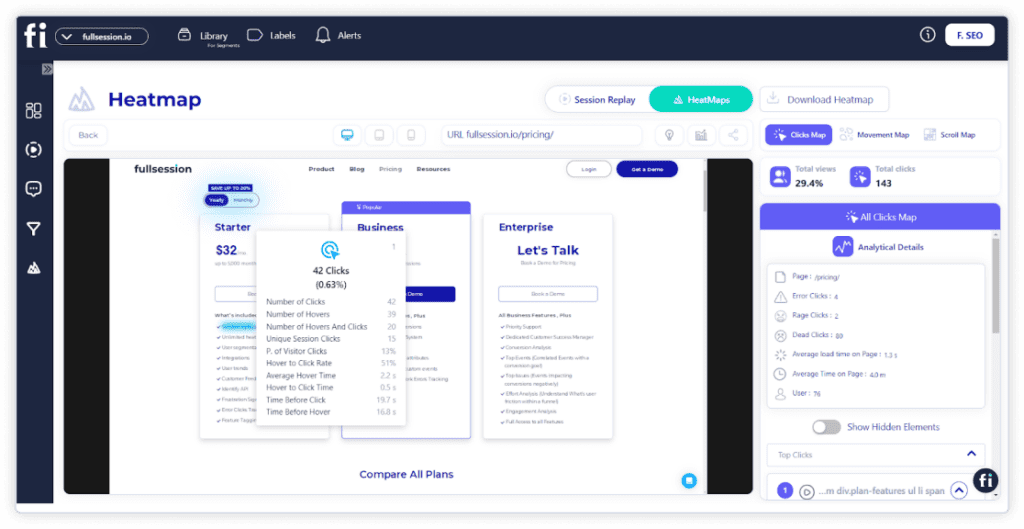
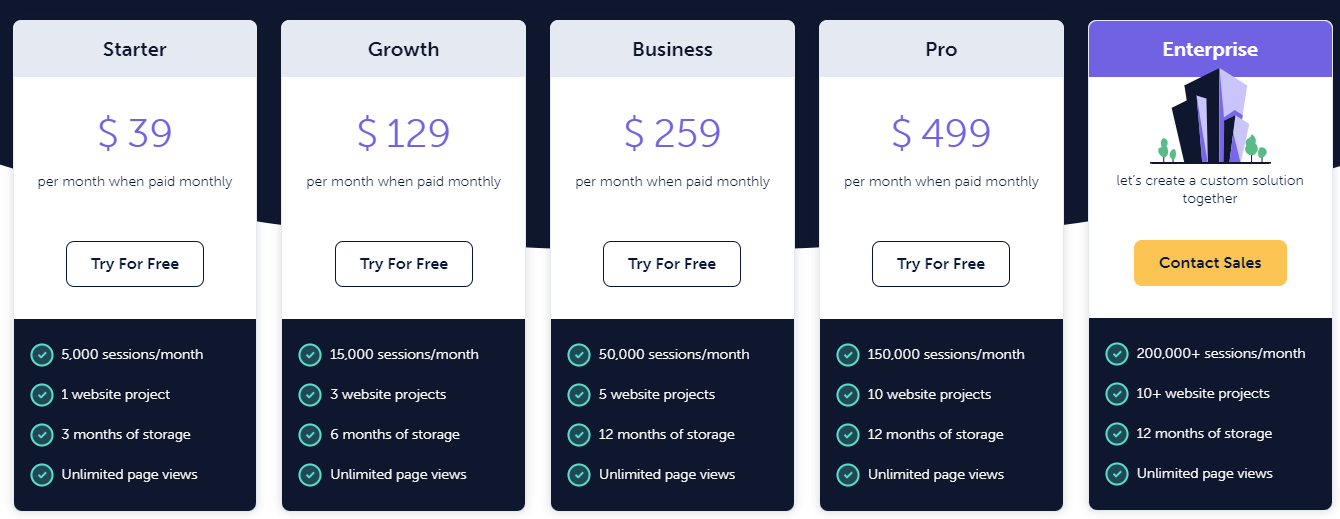
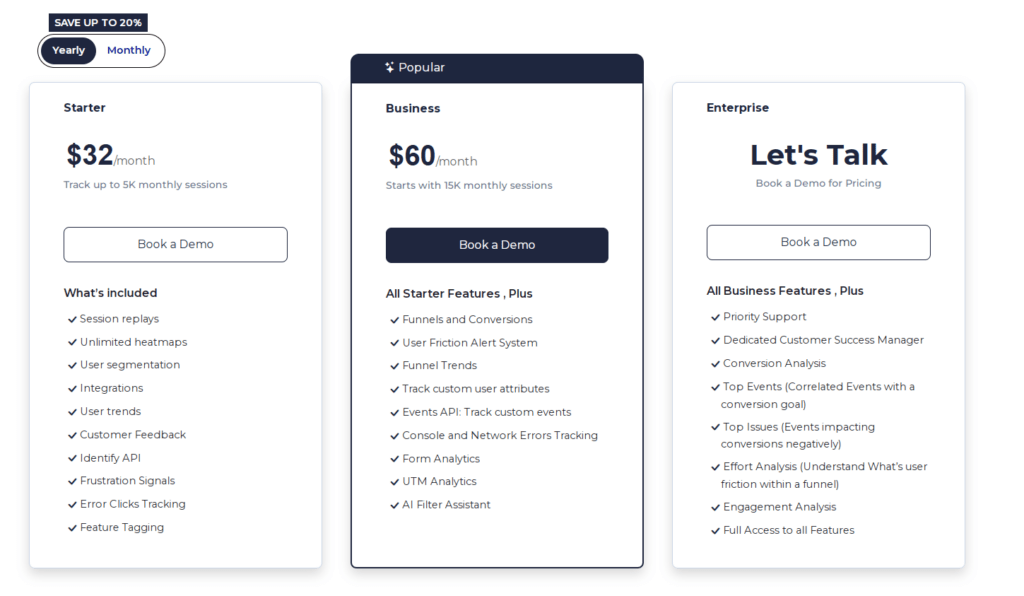
FullSession provides a free trial and pricing plans that fit businesses of all sizes. Starting at $39 per month, the Starter plan gives you unlimited heatmaps and up to 5,000 session recordings per month. If you opt for an annual subscription, you can save 20%, making it just $32 per month.

Visit the Pricing page to learn more about the different plans and how they can fit your needs.
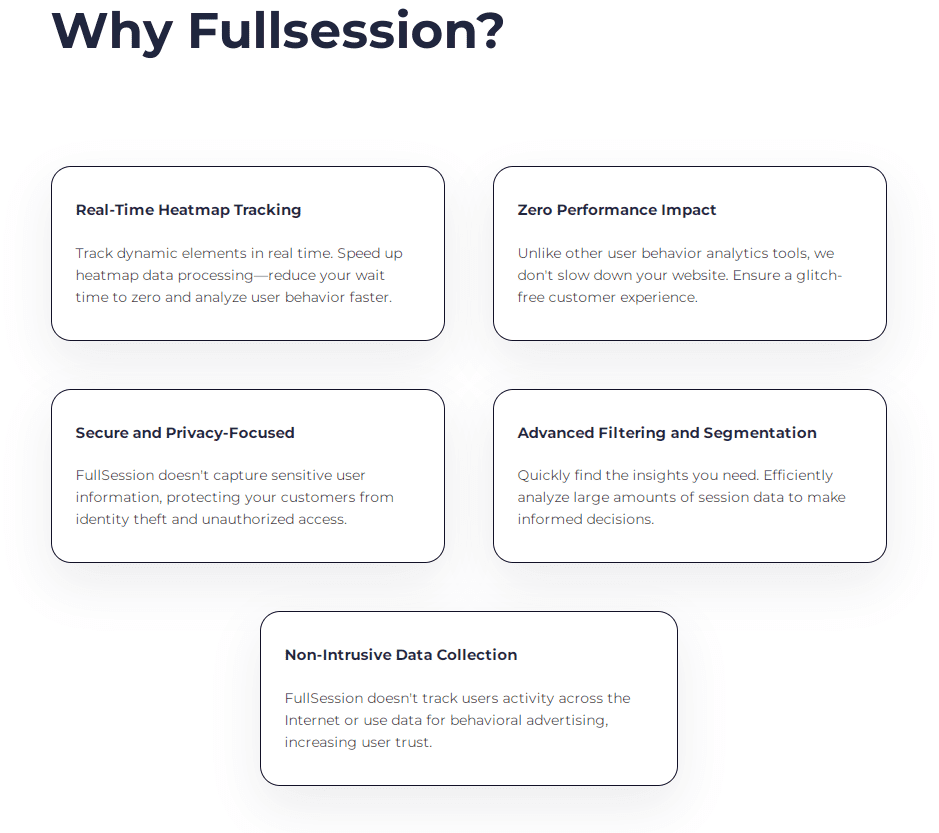
Pros
- Tracks visitor activity in real-time with individual user sessions
- Offers detailed heatmaps that highlight high-traffic areas
- Delivers fast and accurate insights without slowing down your site
- Prioritizes user privacy, excluding sensitive data from recordings
- Efficiently handles large amounts of data for quick analysis
- Centralizes data to help teams collaborate easily
- Easy-to-use interface with a dashboard that tracks all key metrics
Cons
- Does not track mobile apps
Start a free trial or book a demo to see how FullSession works.
2. Salespanel
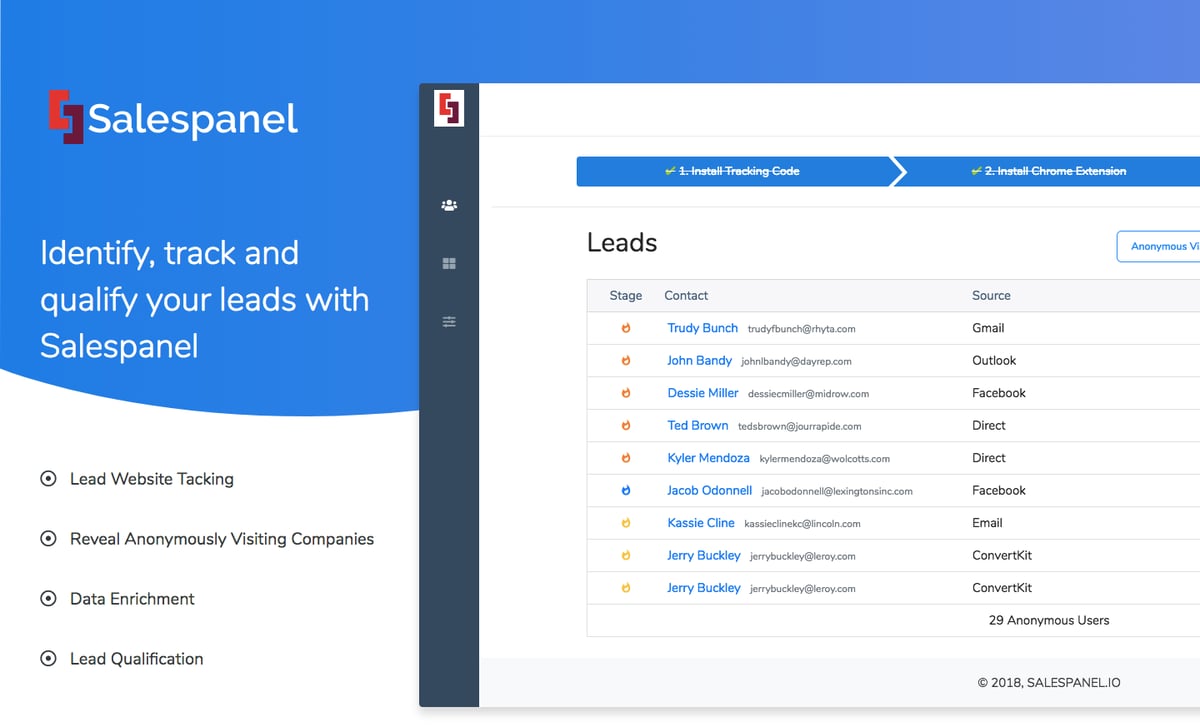
Image source: G2
Salespanel is a marketing analytics, account intelligence, and first-party intent data tracking software designed to help B2B businesses understand their audience, qualify leads, and optimize sales efforts.
It tracks companies visiting your website, monitors engagement, and gathers crucial data to help you identify high-quality leads.
User rating
Salespanel has an average user rating of 4.5 out of 5 stars based on 26 reviews on G2.
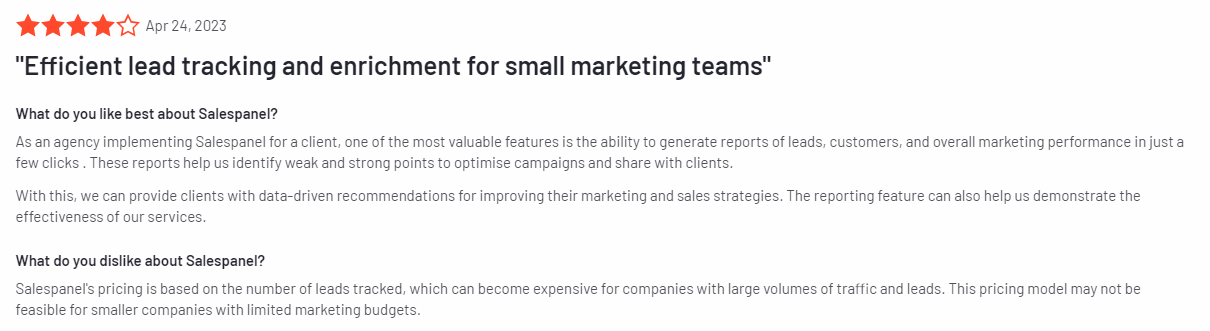
Image source: G2
Best for
Salespanel is suitable for B2B businesses, sales reps, and marketers looking to qualify leads based on website activity.
Key features
- Lead tracking and scoring: Track visitors on your website, qualify leads based on their behavior, and score them for better targeting.
- Real-time visitor analytics: Monitor visitor activity in real time, including page views, session times, and user behavior.
- Marketing automation: Automate lead qualification and nurturing workflows by integrating with marketing platforms.
- CRM integration: Connect with popular CRMs like HubSpot and Salesforce to sync lead data and automate sales processes.
- Segmented reports: Create detailed reports based on specific user behaviors, such as engagement levels or conversion likelihood.
- Email and campaign tracking: Measure the effectiveness of email campaigns by tracking user interactions and engagement with your emails.
Supported platforms
Salespanel supports tracking on all major web platforms, including desktop and mobile versions of websites.
Integrations
Salespanel integrates with popular marketing platforms and CRMs like HubSpot, Salesforce, and Pipedrive. It also connects with tools like Zapier for seamless data flow across systems.
Customer support
Salespanel provides live chat support, email support, and an extensive knowledge base with guides and tutorials to help users make the most of the platform.
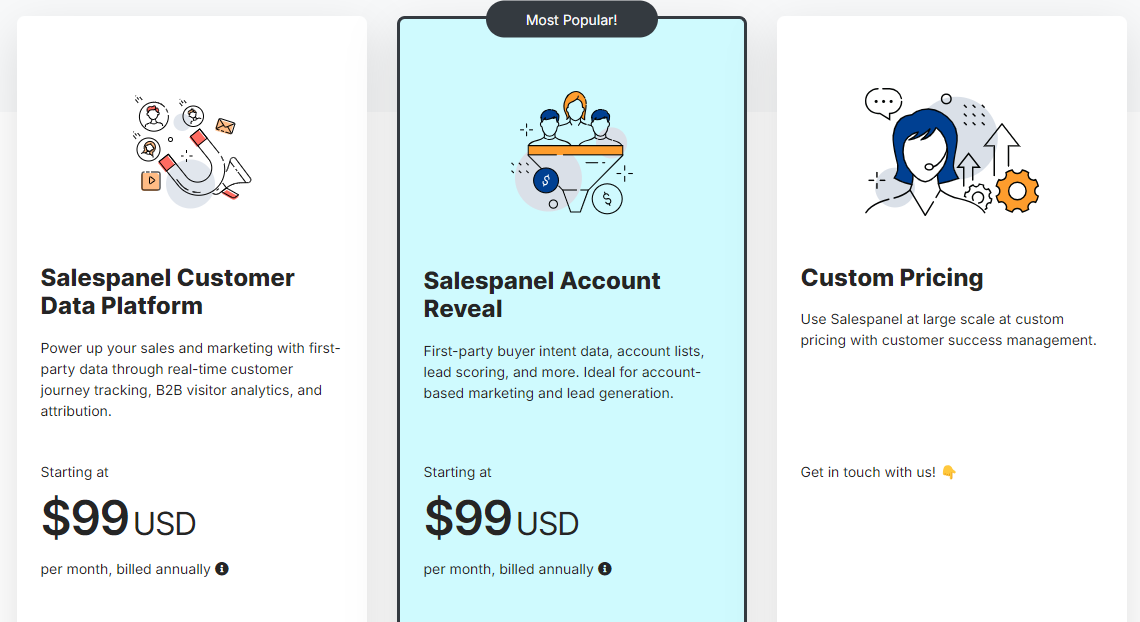
Pricing
Salespanel offers a free trial for new users, with paid plans starting at $99 per month. Pricing is based on the number of tracked visitors and features included.
Pros
- Provides real-time visitor tracking and lead scoring
- Integrates well with popular CRMs and marketing tools
- Offers detailed reports on lead activity and engagement
- Supports marketing automation and sales process optimization
- Easy-to-use interface with a clean dashboard
Cons
- Pricing can be high for smaller businesses
- Learning curve for users unfamiliar with visitor analytics
- Lacks some advanced features found in more comprehensive analytics tools
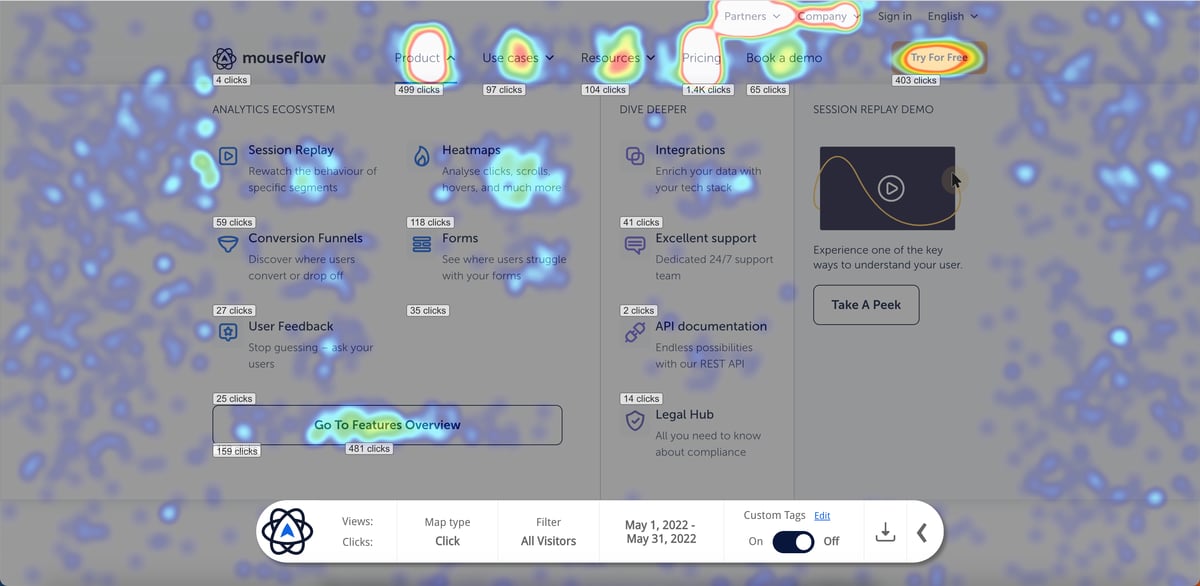
3. Mouseflow

Image source: G2
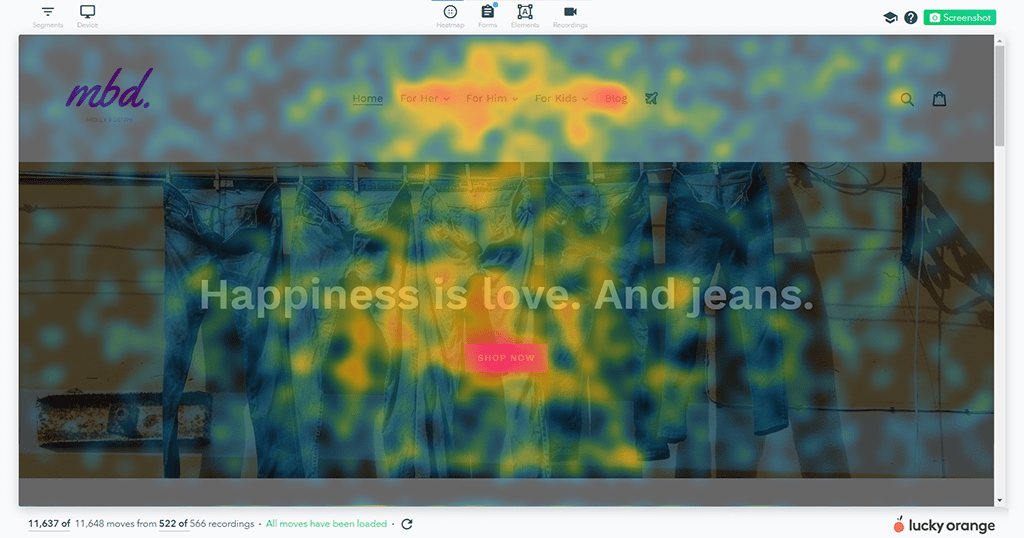
Mouseflow is a digital experience analytics platform designed to track and analyze website visitor behavior in detail. Mouseflow allows you to see exactly how users engage with your site through session recordings and heatmaps.
User rating
Mouseflow has an average user rating of 4.6 out of 5 stars based on 630 reviews on G2.
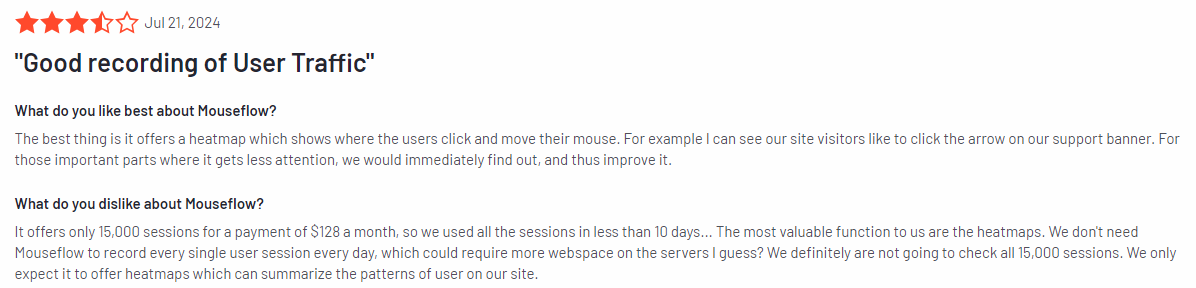
Image source: G2
Best for
Mouseflow is suitable for businesses of all sizes that want to understand user interactions, improve website usability, and optimize conversion rates.
Key features
- Session recordings: Watch real-time recordings of user sessions to see how visitors navigate your website and identify any pain points.
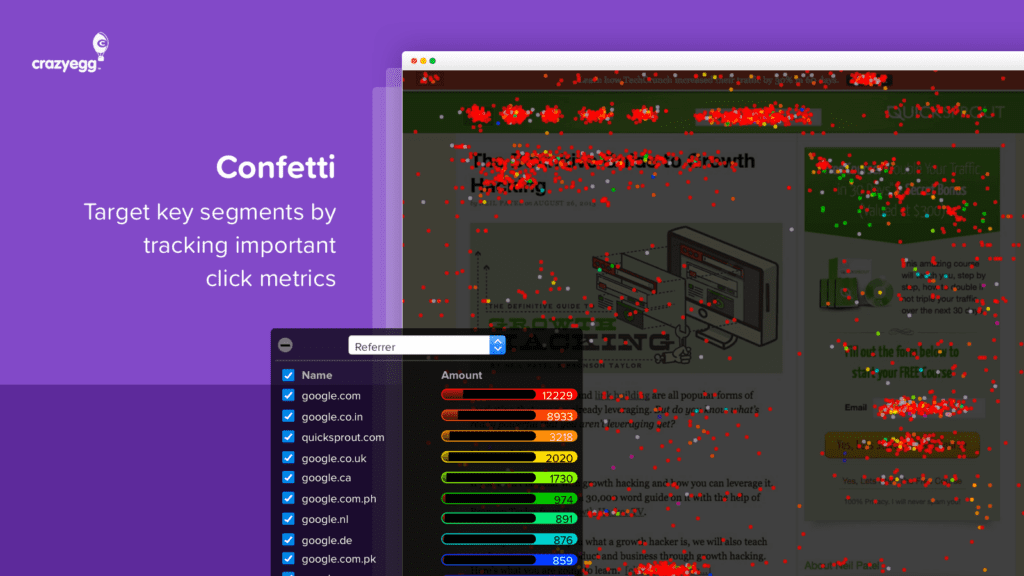
- Heatmaps: Visualize user interactions with click, scroll, and movement heatmaps to understand which areas of your site are most engaging.
- Form analytics: Analyze how users interact with forms, see where they drop off, and optimize your forms for better conversion rates.
- Funnel analysis: Track user progress through conversion funnels to identify drop-off points and optimize key steps in the user journey.
- User feedback tools: Collect feedback from users with surveys and polls to gain valuable insights into their experiences.
- Error tracking: Automatically detect and log errors, such as JavaScript issues, that can impact user experience.
Supported platforms
Mouseflow supports tracking on all major web platforms, including both desktop and mobile versions of websites.
Integrations
Mouseflow integrates with tools like Google Analytics, HubSpot, WordPress, Shopify, and many more.
Customer support
Mouseflow provides email support and an extensive knowledge base. Users on higher-tier plans also get priority support to resolve issues faster.
Pricing
Paid plans start at $39 per month and scale depending on the number of recorded sessions and features required. For the starter plan, you get basic website analytics tools like session recordings and heatmaps.
Pros
- Offers detailed session recordings and heatmaps to understand user behavior
- Includes funnel analysis to track and optimize conversions
- Provides form analytics to improve form usability and reduce drop-offs
- Easy to integrate with popular marketing tools and platforms
Cons
- It can become expensive for larger sites with high web traffic
- Some advanced features may require higher-tier plans
- Limited custom reporting options
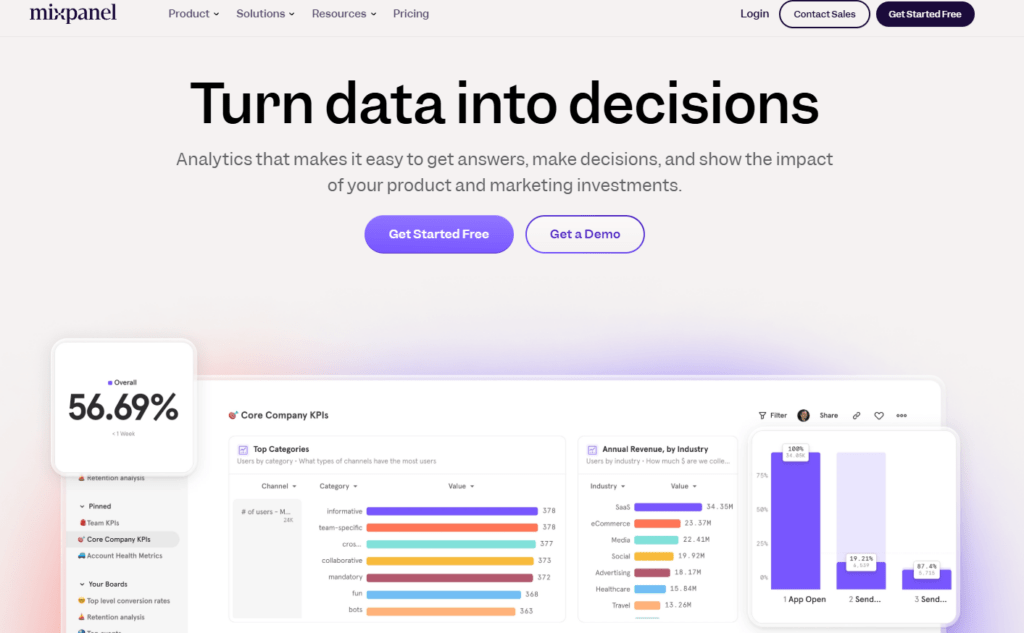
4. Mixpanel

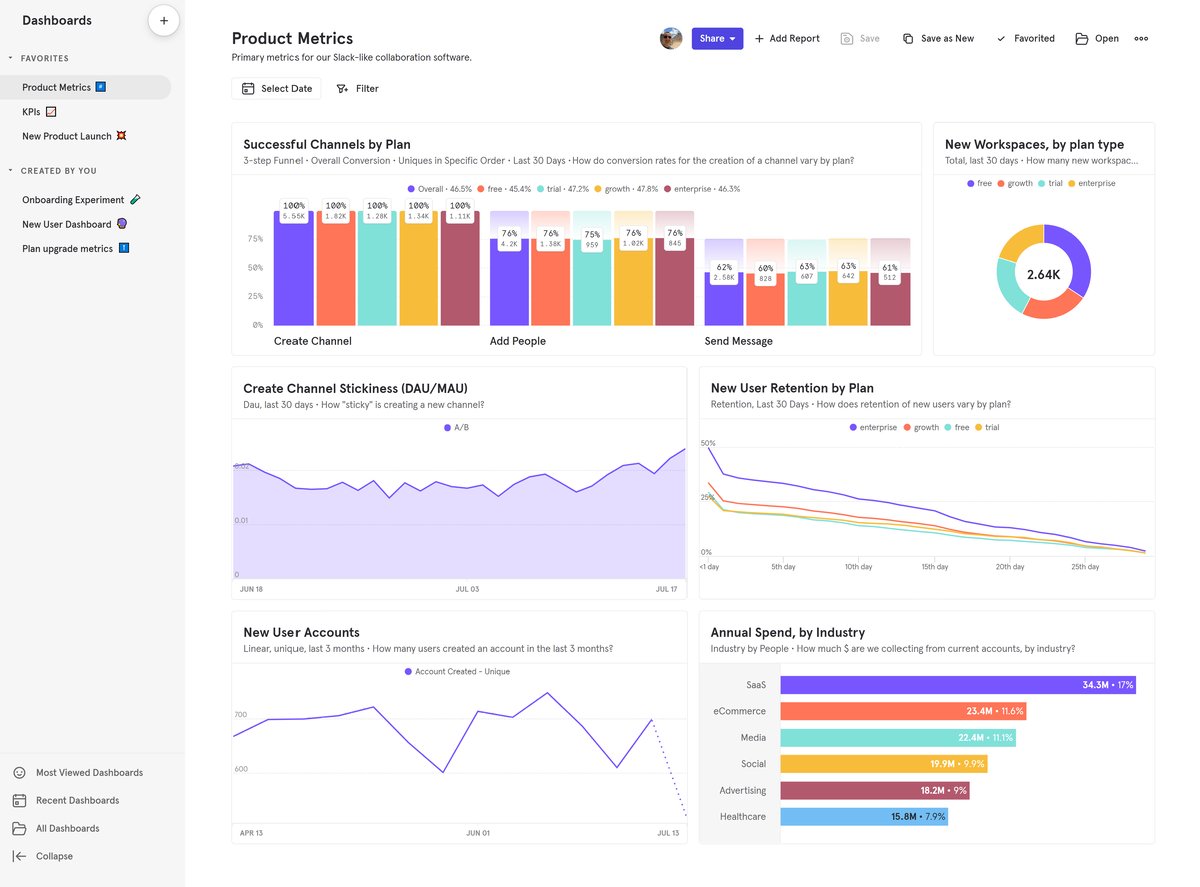
Image source: G2
Mixpanel is a product analytics tool that helps businesses track and analyze specific user actions across websites and mobile apps.
It emphasizes event-based tracking, which allows companies to monitor detailed user behaviors and interactions.
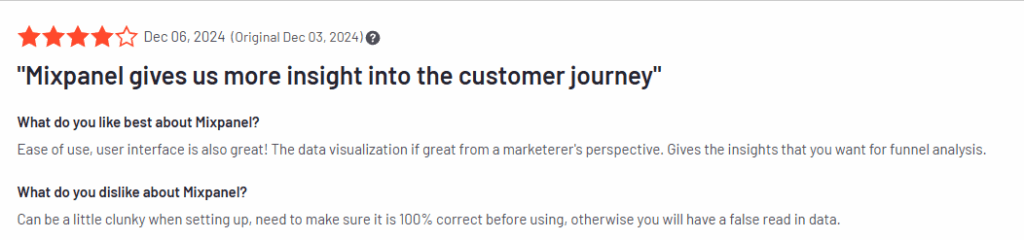
User rating
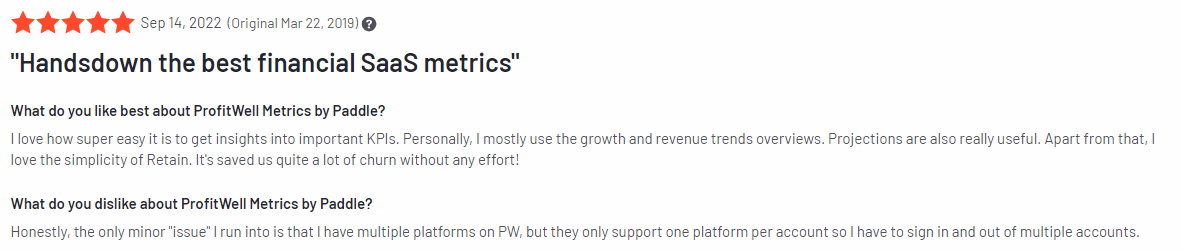
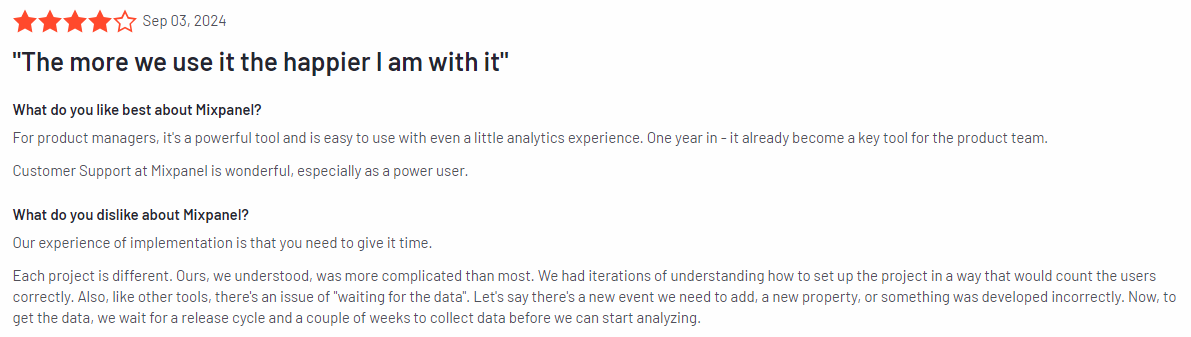
Mixpanel has an average user rating of 4.6 out of 5 stars based on 1,124 reviews on G2.
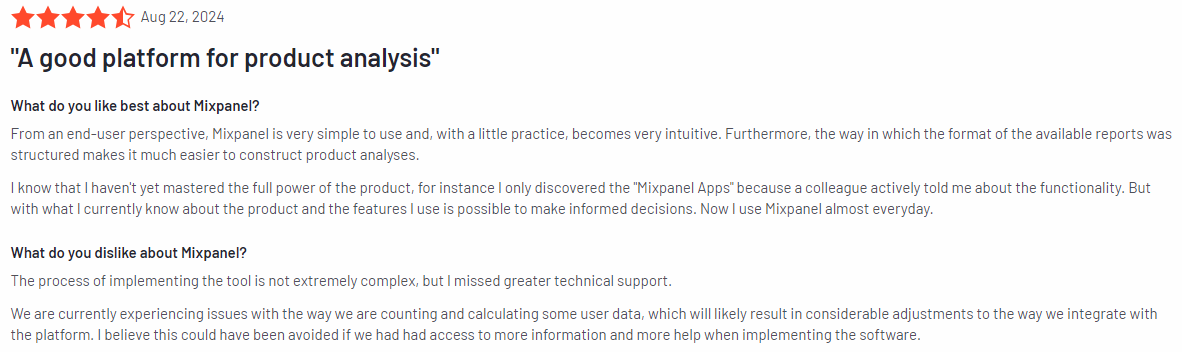
Image source: G2
Best for
Mixpanel is suitable for product teams, marketers, and data analysts who need to track user interactions on both websites and mobile apps.
Key features
- Web visitor tracking: Monitor specific user actions like clicks, form submissions, and interactions with key product features to gather detailed data.
- Funnel analysis: Visualize and analyze where users drop off in critical processes and optimize each step to improve conversions.
- Cohort analysis: Group users based on their behavior over time, allowing you to track how different segments engage and progress.
- A/B testing support: Test different variations of your website or app to see which performs best to help you make informed decisions for improvements.
- Retention tracking: Measure how well you’re retaining users over time and identify what’s driving users to come back or drop off.
- Custom reports: Create custom reports based on user actions and engagement metrics that are most relevant to your business needs.
Supported platforms
Mixpanel supports tracking on both web and mobile platforms.
Integrations
Mixpanel integrates with a wide variety of tools, including CRMs, marketing automation platforms, and cloud services. It connects easily with tools like Survicate, Segment, and HubSpot, allowing for smooth data flow and workflow automation.
Customer support
Mixpanel offers customer support through email and a detailed help center. It also provides onboarding services for businesses on higher-tier plans to ensure teams get the most out of the platform.
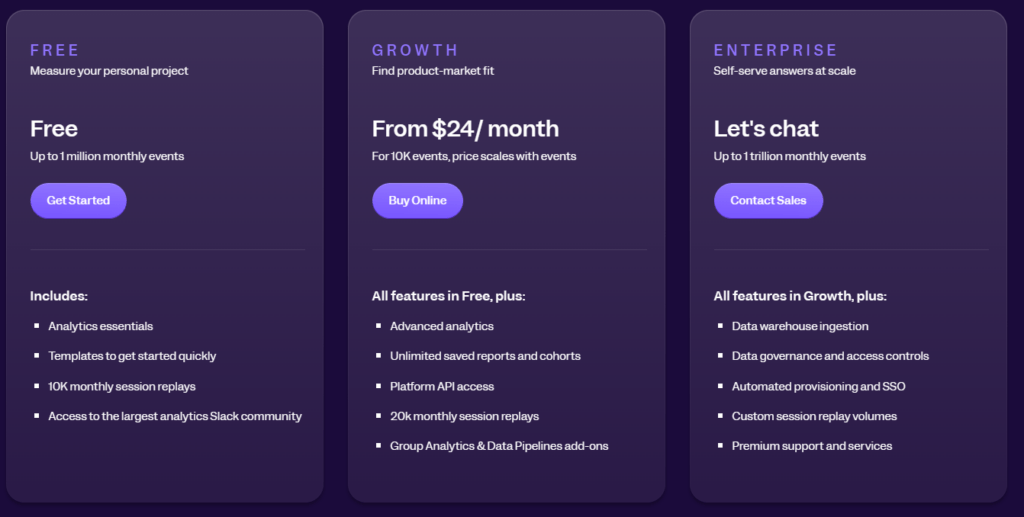
Pricing
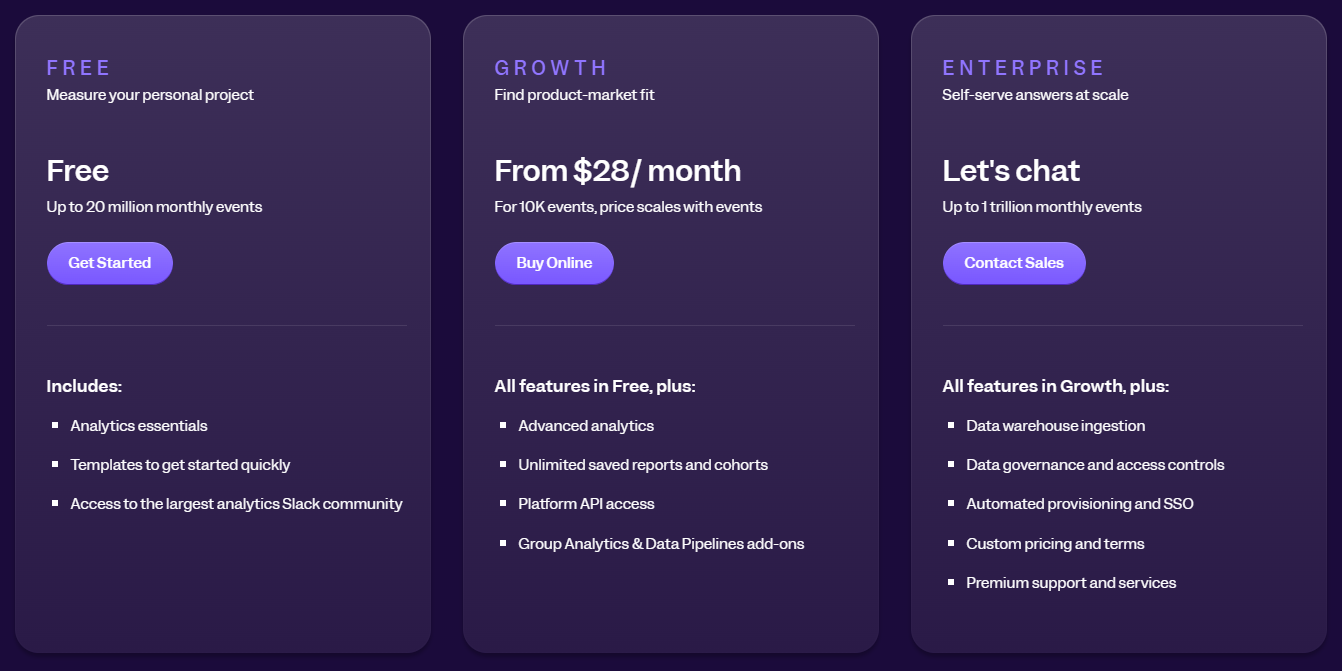
Mixpanel offers a free plan that includes up to 1,000 tracked users per month. Paid plans start at $28 per month, offering more advanced features and higher limits on tracked users and events.
Pros
- Highly customizable event tracking for deep user behavior analysis
- Supports mobile and web tracking, making it versatile for businesses across platforms
- Cohort analysis and funnel tracking for detailed user engagement insights
- A/B testing features for optimizing website and app performance
- Scalable pricing plans that accommodate businesses of all sizes
Cons
- It can be complex to set up for users unfamiliar with event-based tracking
- Advanced features may require a higher-tier plan, increasing costs for small businesses
- Requires time to fully leverage data that Mixpanel offers
5. Ruler Analytics
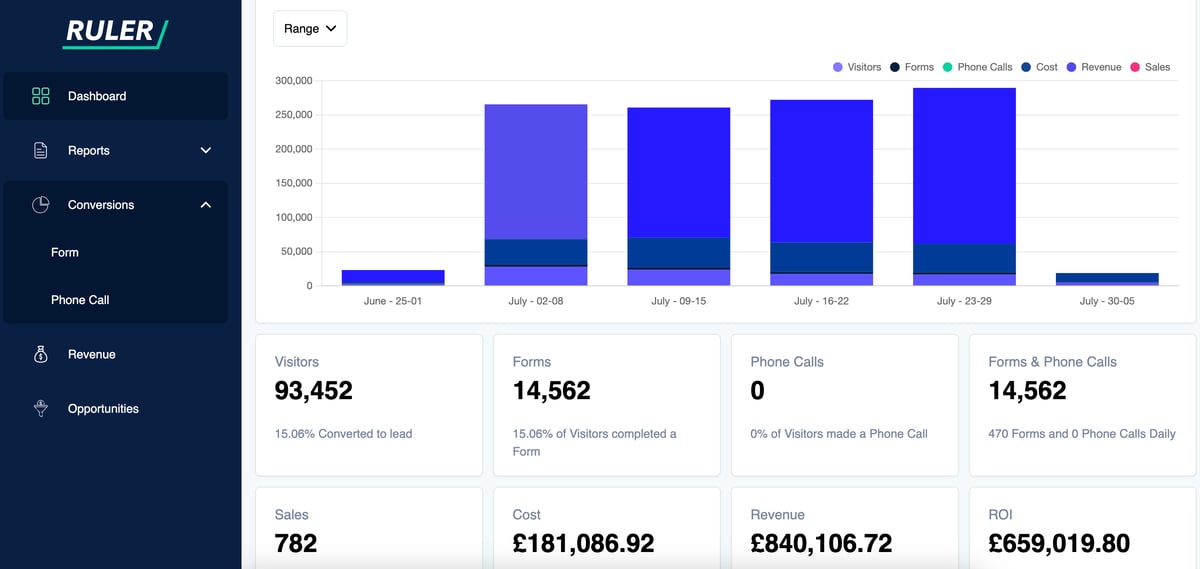
Image source: G2
Ruler Analytics is a conversion tracking and marketing attribution platform that helps businesses understand the full customer journey, from the initial touchpoint to conversion.
By connecting marketing activity with actual revenue it allows businesses to see which campaigns are driving the best results and where improvements can be made.
User rating
Ruler Analytics has an average user rating of 4.6 out of 5 stars based on 29 reviews on G2.
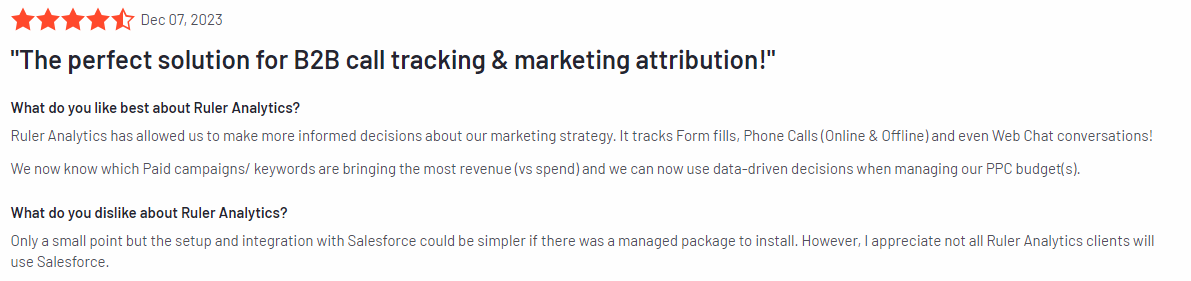
Image source: G2
Best for
Ruler Analytics is suitable for digital marketers, agencies, and businesses that rely heavily on tracking data from customer touchpoints across various channels.
Key features
- Multi-touch attribution: Track the entire customer journey, from the first interaction to conversion, across multiple channels.
- Conversion tracking: Connect leads generated through your website back to the original marketing source, giving you a clear view of what’s driving conversions.
- Revenue attribution: Tie marketing strategies directly to revenue, allowing businesses to see which campaigns are generating the most profit.
- CRM integration: Sync your leads and sales data with CRMs like Salesforce and HubSpot, closing the gap between marketing and sales teams.
- Call tracking: Capture inbound call data and attribute phone calls to specific marketing campaigns for more complete reporting.
- Customizable reports: Generate detailed, customizable reports to track KPIs and performance metrics that are most relevant to your business.
Supported platforms
Ruler Analytics supports tracking on all major web platforms, including desktop and mobile versions of websites.
Integrations
Ruler Analytics integrates with a range of platforms, including Google Ads, Facebook, Salesforce, Google Analytics, and other marketing tools. It also works with CRMs and call tracking software, which provides comprehensive data synchronization and reporting.
Customer support
Ruler Analytics offers email and live chat support for users, along with an extensive knowledge base. Users on higher-tier plans may receive additional support options for more personalized assistance.
Pricing
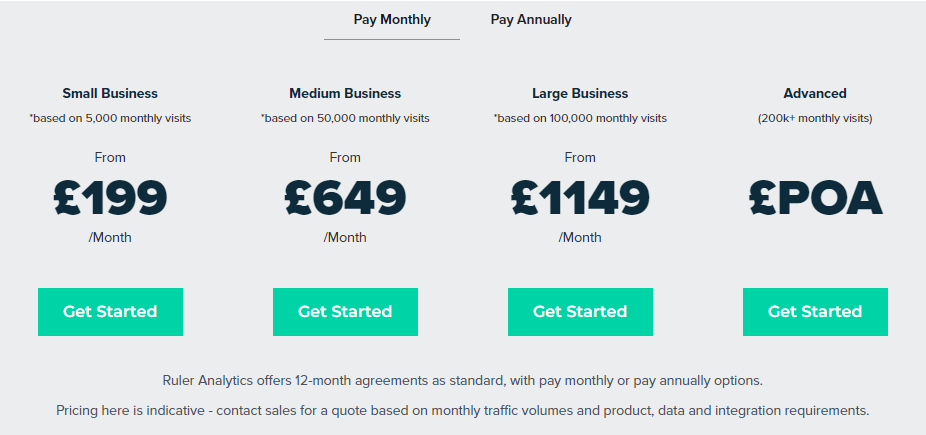
Ruler Analytics offers a pricing model that scales based on the size of your business and the features you need.
Pricing starts at £199 per month for up to 5,000 monthly visits, with higher-tier plans offering more advanced features like additional integrations and reporting options.
Pros
- Provides detailed multi-touch attribution to track the complete customer journey
- Integrates with popular CRMs and marketing tools, offering smooth data flow
- Links marketing activities directly to revenue for clearer ROI tracking
- Includes call tracking to connect inbound phone leads with campaigns
- Customizable reporting tailored to specific business needs
Cons
- Higher starting price compared to some other analytics tools
- It may require some setup time to fully integrate with existing systems
- Smaller businesses might find the cost too high for their needs
6. Smartlook
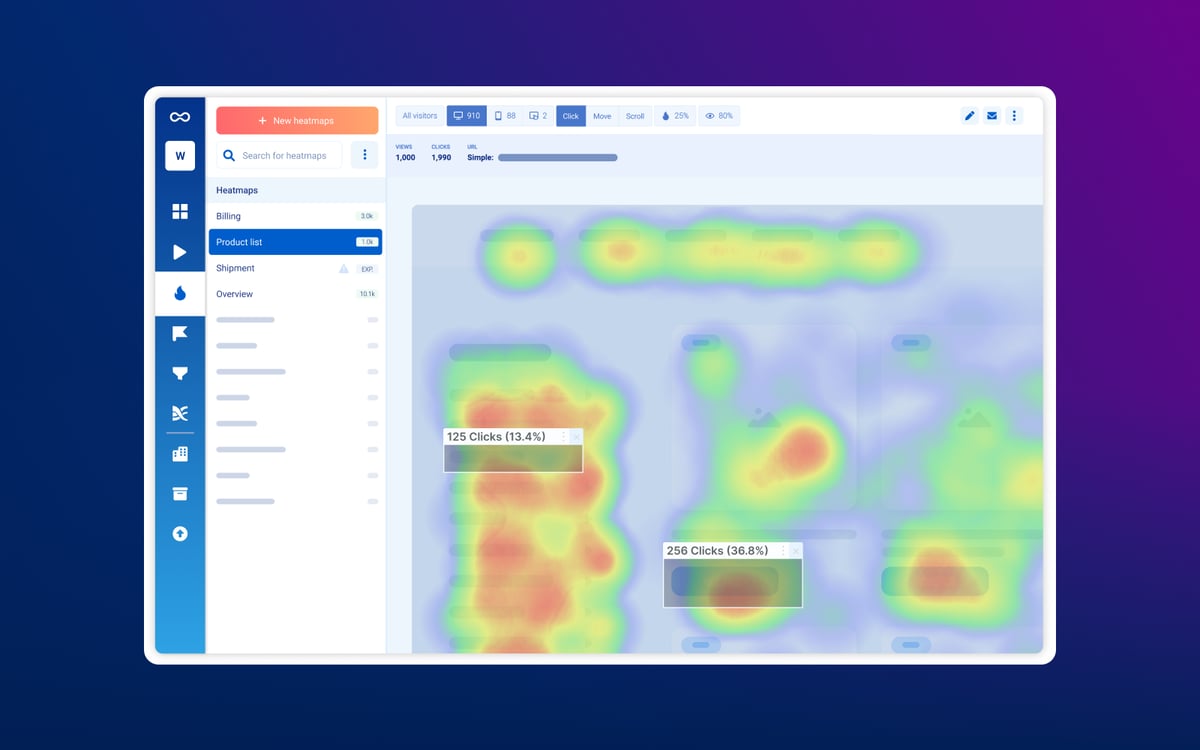
Image source: G2
Smartlook is a product analytics tool that focuses on delivering insights through session recordings, heatmaps, and event tracking.
What sets Smartlook apart is its ability to track both web and mobile app user behavior, which makes it a versatile tool for businesses that need insights across multiple platforms.
User rating
Smartlook has an average user rating of 4.6 out of 5 stars based on 870 reviews on G2.
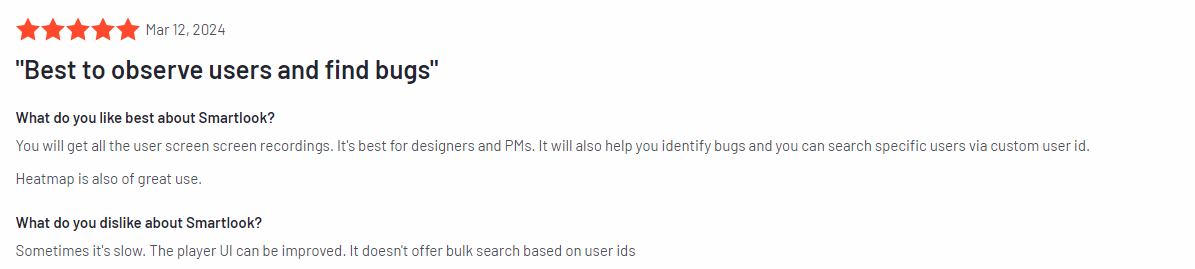
Image source: G2
Best for
Smartlook is for teams that need flexible, data-driven insights to refine their marketing strategies and improve product development, especially marketing and product teams.
Key features
- Session recordings: Replay user sessions to see exactly how visitors interact with dynamic elements on your site or app, using filters to locate specific sessions based on events, errors, or user actions for deeper analysis.
- Heatmaps: Visualize user behavior through click, scroll, and movement heatmaps, including dynamic elements like drop-downs and carousels, to understand engagement on more complex page components.
- Event tracking: Retroactively track specific user actions, such as clicks, form submissions, or interactions with dynamic content, without needing to predefine events.
- Funnels: Set up conversion funnels retroactively to analyze historical user behavior and pinpoint where users drop off in key processes.
- Mobile app analytics: Track user behavior on iOS and Android apps, capturing in-app gestures like taps and swipes, providing a complete view of user interactions across both platforms.
- Automatic issue detection: Detect issues such as rage clicks or broken elements to quickly address user frustrations.
Supported platforms
Smartlook supports tracking on both web and mobile platforms, including desktop, iOS, and Android apps.
Integrations
Smartlook integrates with a wide range of tools, including Optimizely, Slack, HubSpot, and more.
It also supports webhooks and APIs for custom integrations to ensure seamless data flow between Smartlook and your existing tools.
Customer support
Smartlook offers email support, along with a detailed knowledge base and video tutorials. Users on premium plans can also receive priority support.
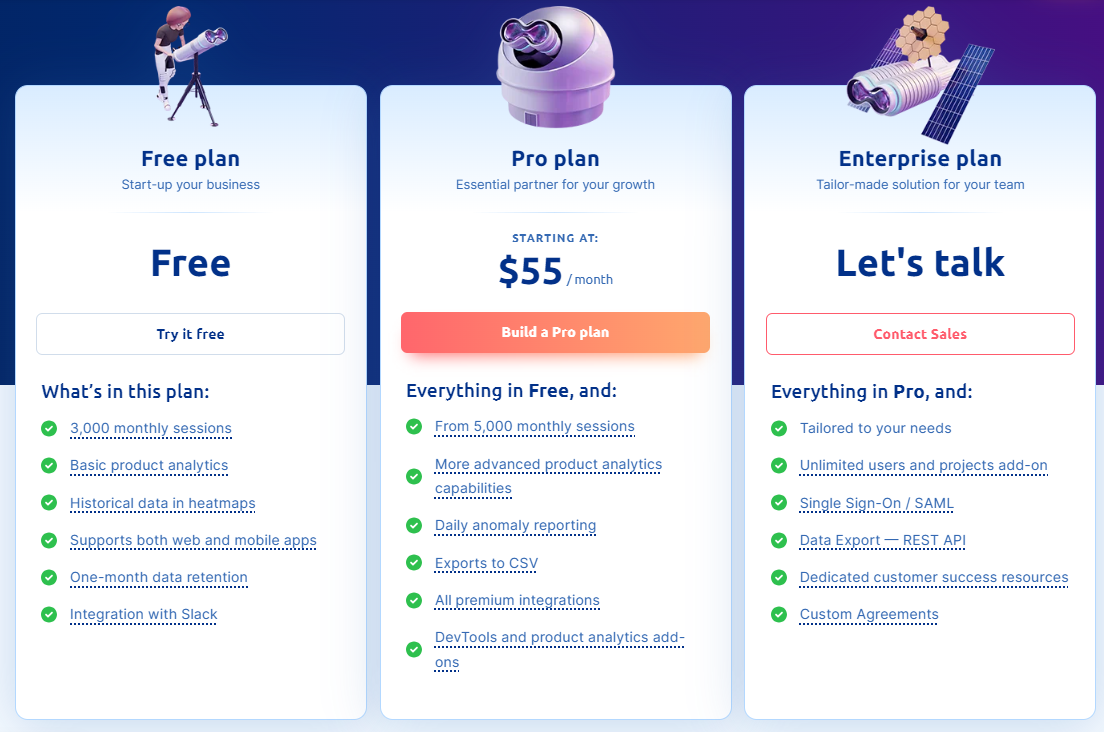
Pricing
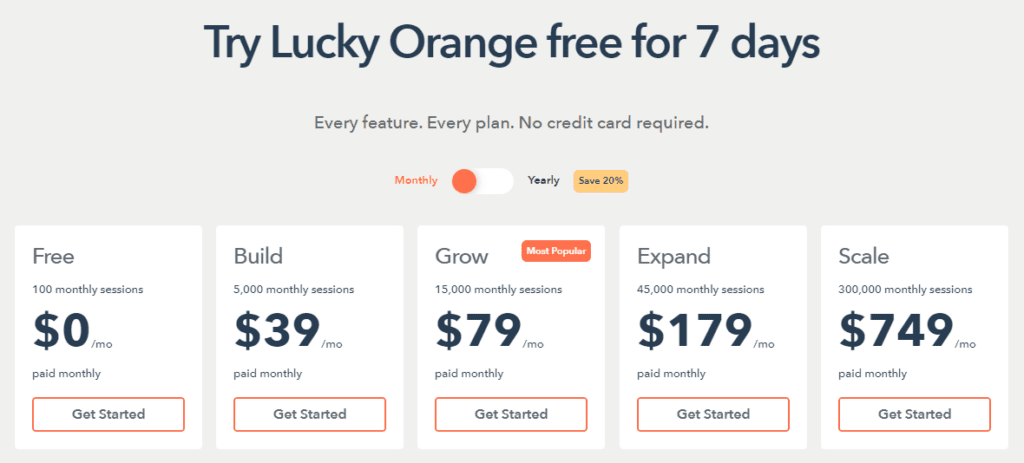
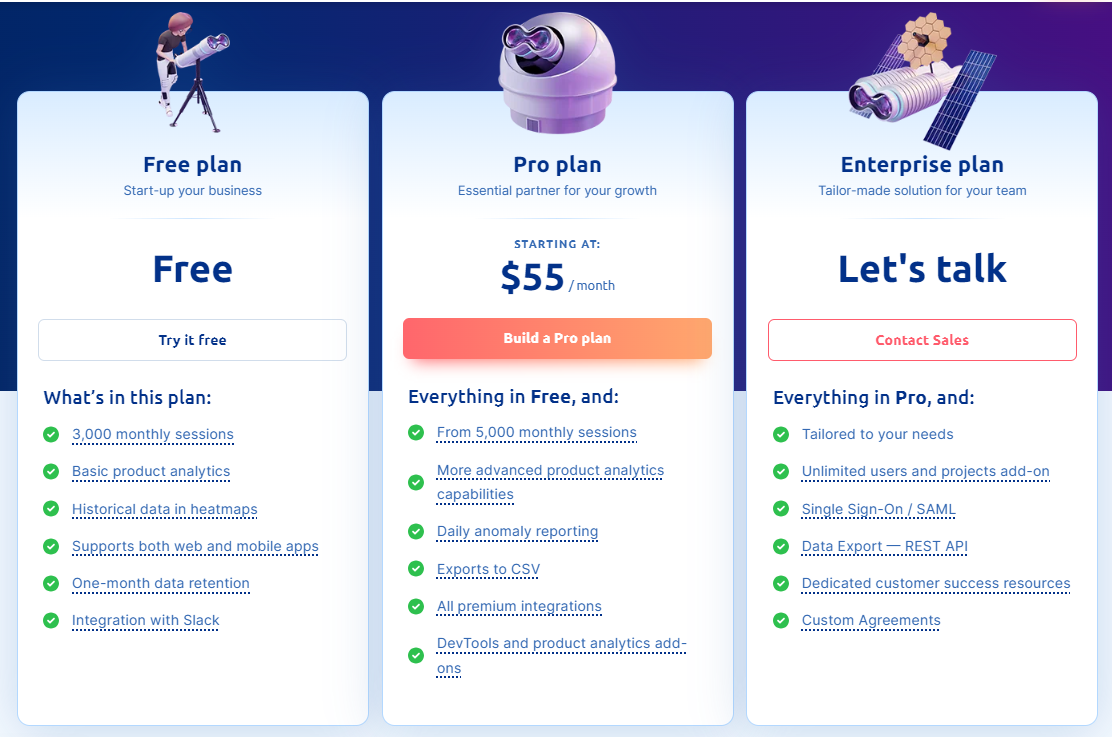
Smartlook offers a free plan with limited features, including 3,000 sessions per month. Paid plans start at $55 per month and include additional features like unlimited heatmaps, up to 5,000 monthly sessions, and advanced integrations.
Custom pricing is also available for larger businesses with more complex needs.
Pros
- Tracks user behavior on both websites and mobile apps
- Offers session recordings and heatmaps for detailed insights
- Easy-to-use interface with minimal setup required
- Affordable pricing options with a free plan available
- Automatically detects issues to improve user experience quickly
Cons
- Some advanced features are only available in higher-tier plans
- Limited customization for reporting
- It can become costly for larger businesses with high traffic
- Sometimes lacks explanations for errors
- Occasional bugs or glitches with session recordings and UI, according to some users
7. Lead Forensics
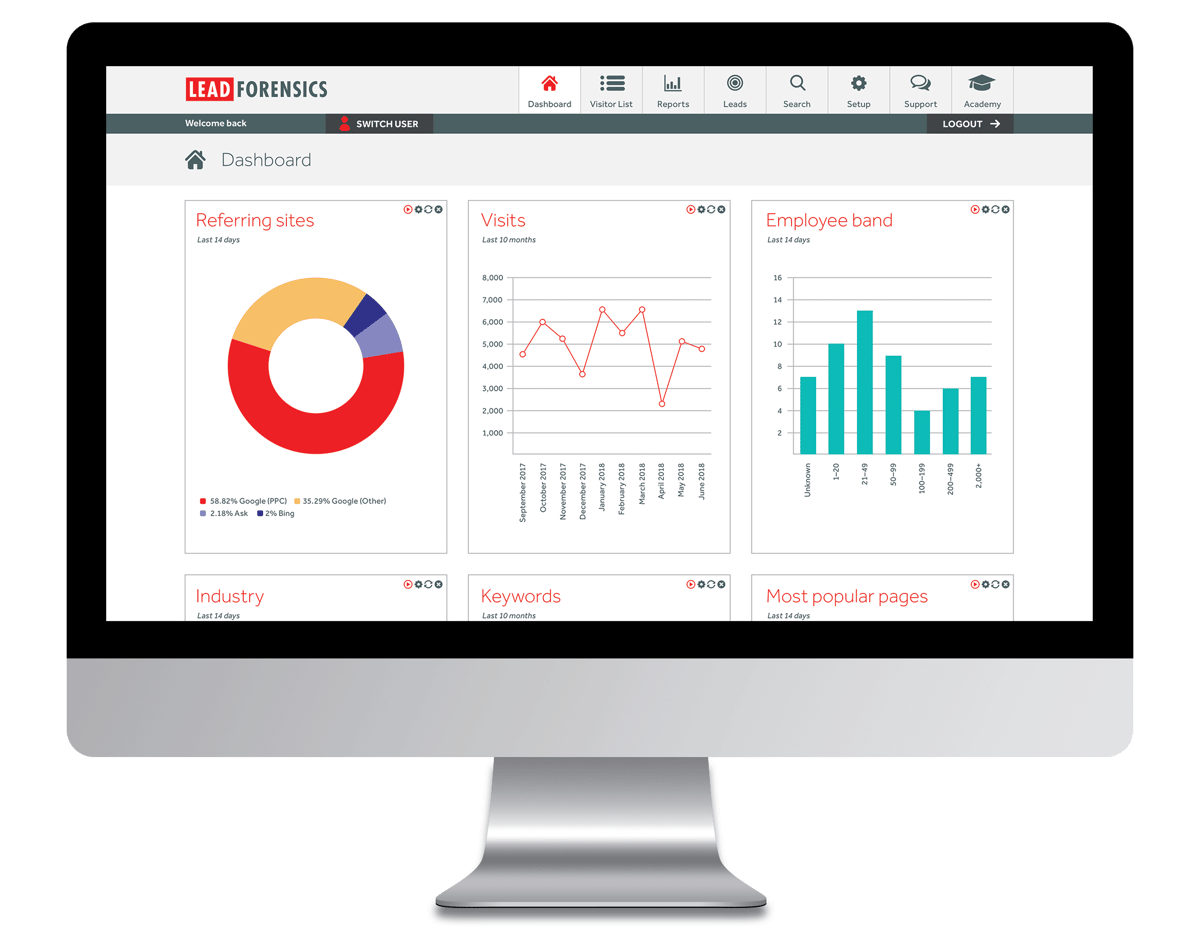
Image source: G2
Lead Forensics is a B2B lead generation and website visitor monitoring tool designed to help businesses identify anonymous website visitors.
By uncovering the company names and contact details of site visitors, Lead Forensics provides actionable data for sales and marketing teams to follow up on potential leads.
User rating
Lead Forensics has an average user rating of 4.3 out of 5 stars based on 706 reviews on G2.
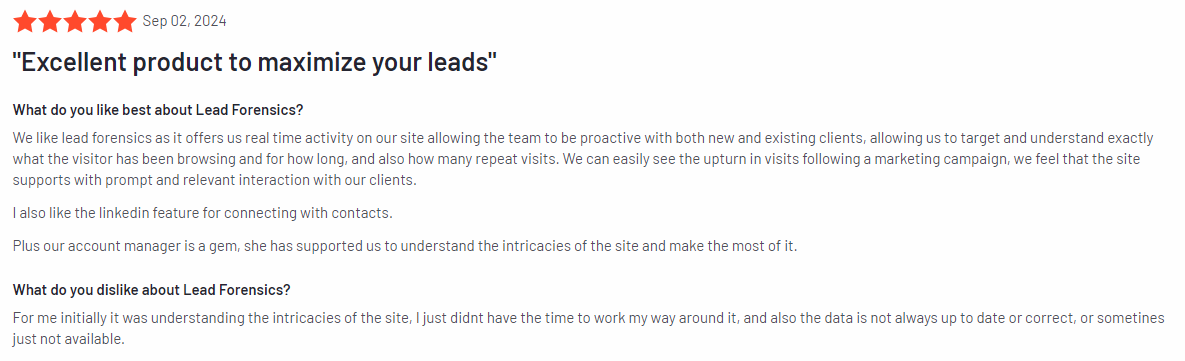
Image source: G2
Best for
Lead Forensics is suitable for B2B businesses, sales teams, and marketing departments looking to identify and reach out to anonymous website visitors.
It’s useful for businesses with a heavy focus on lead generation, prospecting, and sales conversions from different website traffic sources.
Key features
- Visitor identification software: Identifies anonymous website visitors and provides company names, contact details, and other useful data for your lead generation efforts.
- Lead scoring: Scores website visitors based on their activity, helping prioritize high-quality leads for immediate follow-up.
- Real-time alerts: Notifies you in real-time when key prospects visit your site, which can lead to faster and more targeted engagement.
- CRM integration: Integrates with popular CRM systems like Salesforce and HubSpot, making it easy to manage leads and automate follow-up processes.
- Detailed analytics: Provides insights into visitor behavior, including pages visited, time spent, and engagement levels, to help you understand lead intent.
- Custom reporting: Offers tailored reports on visitor behavior and lead generation metrics to help businesses measure the effectiveness of their efforts.
Supported platforms
Lead Forensics supports tracking on all major web platforms.
Integrations
Lead Forensics integrates with CRMs and marketing automation platforms, including Salesforce, HubSpot, and Zoho CRM. Like the other visitor identification tools on this list, it also supports other tools through API integration for easy data flow between systems.
Customer support
Lead Forensics provides customer support through live chat, phone, and email. Additionally, users have access to a comprehensive help center with guides and best practices.
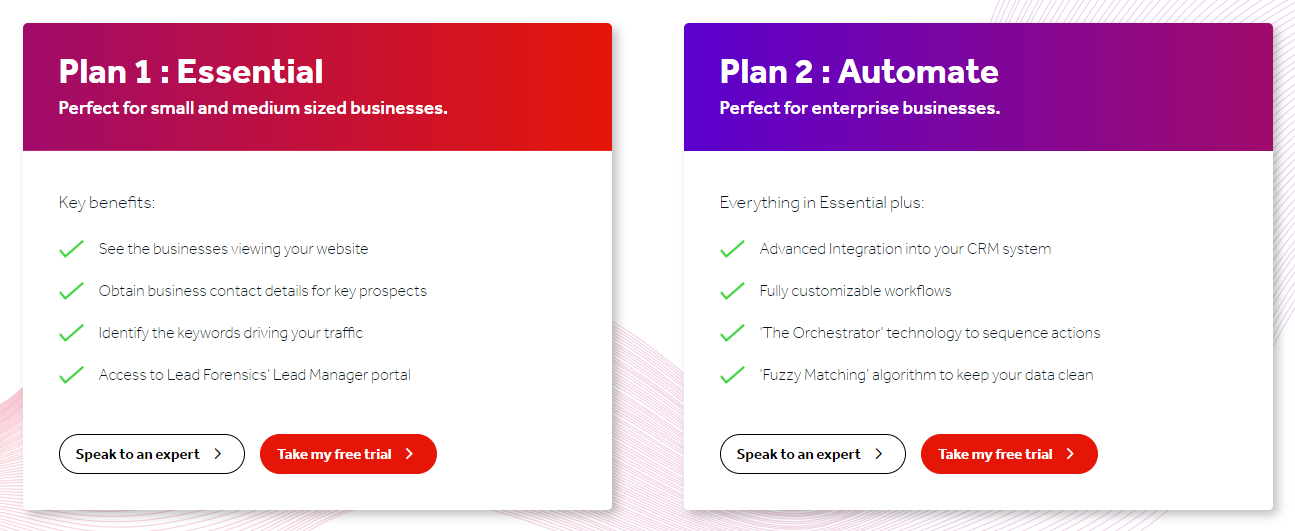
Pricing
Lead Forensics operates on a custom pricing model based on the size of your business and specific needs. Interested users can contact the sales team for a tailored quote. It offers a demo to help businesses understand the platform’s capabilities before committing.
Pros
- Identifies anonymous website visitors, turning them into actionable leads
- Real-time alerts allow for immediate engagement with potential customers
- Integrates with popular CRM and marketing tools
- Offers detailed visitor analytics and lead scoring for better prioritization
Cons
- Custom pricing may be a barrier for smaller businesses
- Limited to identifying B2B leads, which might not suit B2C businesses
- Some users may find the platform’s interface a bit dated
Best 7 Website Visitor Tracking Software Comparison Table
Below is a comparison of key features across some of the best tools available. This table will help you see at a glance how these tools measure up, making it easier to decide which one fits your needs.
| FullSession | Salespanel | Mouseflow | Mixpanel | Ruler Analytics | Smartlook | Lead Forensics | |
| Real-time session recordings | ✔ | ✘ | ✘ | ✘ | ✘ | ✔ | ✘ |
| Heatmaps | ✔ | ✘ | ✘ | ✘ | ✘ | ✔ | ✘ |
| User feedback tools | ✔ | ✘ | ✘ | ✘ | ✘ | ✘ | ✘ |
| Conversion funnel analysis | ✔ | ✘ | ✔ | ✔ | ✘ | ✔ | ✔ |
| Error tracking | ✔ | ✘ | ✘ | ✘ | ✘ | ✔ | ✘ |
| CRM integration | ✔ | ✔ | ✘ | ✔ | ✔ | ✔ | ✔ |
| Mobile app tracking | ✘ | ✘ | ✘ | ✔ | ✘ | ✔ | ✘ |
| Monthly pricing | $39 | $99 | $39 | $28 | £199 | $55 | n/a |
Best 7 Website Visitor Tracking Software: Our Verdict
If you’re looking for the best tool to track users visiting your website, FullSession is a standout choice. You can evaluate all features during a free trial. Sign up now.
It tracks dynamic elements in real time so you get detailed insights into how visitors interact with every part of your site.
Plus, its heatmap processing is lightning-fast, so you get all the data you need without slowing down your website.
FullSession also puts privacy first by excluding sensitive data from recordings, keeping you compliant with regulations like GDPR and CCPA.
Handling large amounts of data is a breeze with FullSession, and it quickly reveals key insights that can help you make smarter decisions.
One of its strengths is that it limits tracking to your own site, which ensures that your users’ data isn’t misused.
On top of that, FullSession makes cross-team collaboration easy, bringing together product, marketing, and support teams on one platform.
Book a demo now to see how FullSession can help you optimize your site and boost your business.
Conclusion About Best 7 Website Visitor Tracking Software
Website visitor tracking tools are a must-have for any online business wanting to understand how users are interacting with their site.
These tools give you the insights you need to spot what’s working, what’s not, and where improvements can be made.
Whether you run an e-commerce store, a blog, or a SaaS platform, having a reliable way to track visitor behavior can help boost engagement, improve the user experience, and increase conversions.
While all the tools we’ve discussed have their strengths, FullSession really stands out for its real-time website tracking, fast heatmaps, and strong focus on user privacy. It’s an all-in-one solution that not only helps you understand your visitors but also protects their data.
Get a demo now to see how FullSession can make a difference for your business.
FAQs About Best Website Visitor Tracking Software
Which tool is best for website visitor tracking?
FullSession is the best tool for tracking visitors on your site and analyzing their actions. It offers real-time session recordings, heatmaps, and powerful analytics to help you understand how visitors interact with your site, all while protecting user privacy.
How do I track visitors on my website?
You can track visitors on your website by using tracking software like FullSession. These tools allow you to monitor user sessions, capture interactions with key elements, and view heatmaps to see where visitors click and scroll.
This gives you actionable insights into user behavior, helping you optimize your website for better performance and engagement.
How to collect visitor data from a website?
To collect visitor data, you’ll need a tool like FullSession that tracks and records user sessions. It gathers data on how long users stay on each page, which buttons they click, and where they navigate.
Tools like FullSession ensure data collection is done in compliance with privacy laws, and you can use the insights to improve your website’s usability and conversion rates.
How to follow up with website visitors?
To follow up with website visitors, you can use lead tracking tools that integrate with your CRM, like FullSession. By identifying key visitors based on their behavior, you can segment them for targeted email campaigns or personalized outreach.
FullSession helps you qualify leads and determine the best strategies for re-engaging high-potential customers.
How does visitor tracking software work?
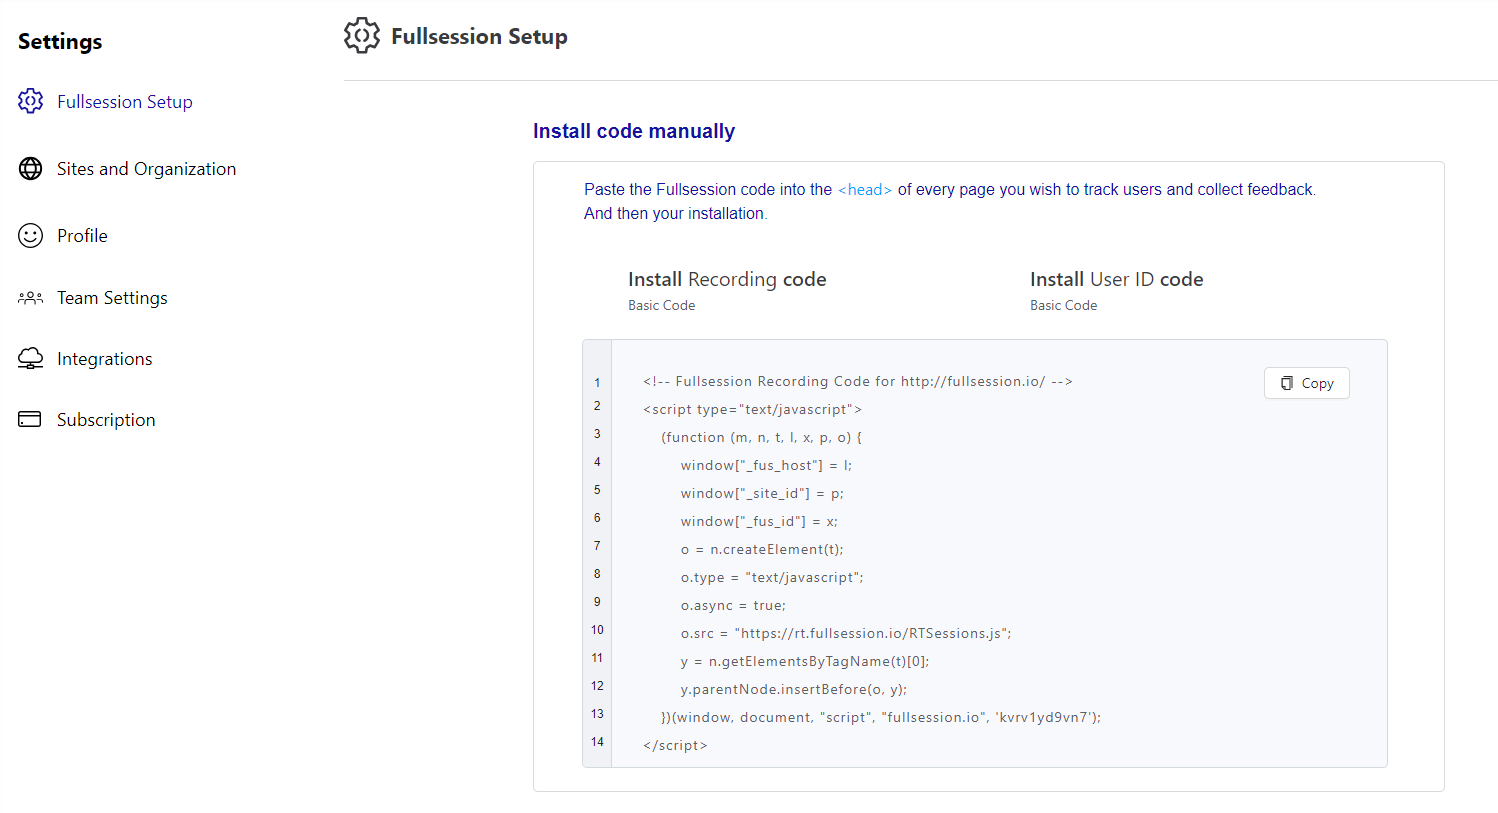
Visitor tracking software works by monitoring and recording user behavior as they interact with your website. It tracks details like where users click, how far they scroll, which pages they visit, and how long they stay on each page. Tools like FullSession use cookies or scripts embedded on your site to capture this data in real time.
The software then provides insights through session recordings, heatmaps, and reports, allowing you to analyze visitor behavior, identify problem areas, and optimize your website for better engagement and conversions.
What are the key performance indicators you need to track?
Key performance indicators (KPIs) for tracking website visitor performance include session duration, which shows how long users stay on your site, and bounce rate, which measures the percentage of visitors who leave without interacting.
Other important KPIs are page views, conversion rate, click-through rate (CTR), and user engagement (actions like clicks and scrolls). Both new and traditional analytics tools like FullSession track these KPIs in real time, giving you insights to improve site performance and user experience.
What is customer journey tracking and why is it important?
Customer journey tracking monitors the entire path visitors take on your website, from their first interaction to conversion. It’s closely related to visitor tracking, as it helps you understand how users engage with different touchpoints.
This insight is important because it highlights where users drop off, what drives engagement, and where improvements are needed to maximize conversions.


![Hotjar vs Crazy Egg vs Mouseflow vs FullStory [Ultimate Comparison]](https://www.fullsession.io/wp-content/uploads/2021/09/Hotjar-vs-Google-Analytics-Hotjar-vs-Crazy-Egg-vs-Mouseflow-vs-FullStory.webp)