
Keeping customers happy and engaged is essential to the success of any business. However, keeping them as loyal customers requires much effort.
For this reason, companies must conduct a customer churn analysis and keep a finger on their churn rate – a statistic that shows the percentage of customers who stopped making purchases from a company.
It’s a crucial indicator of how well your business is performing. It gives you a clue on what’s not working with your customer retention strategy and can indicate other business model issues.
To conduct customer churn analysis, you need specialized tools that help you collect user behavior data. FullSession, our UX analytics tool, gives you access to session recordings and replays, website heatmap tools, and website feedback forms to help you understand where your customers experience issues while using your product and how these issues reflect on your churn rate.
To see how FullSession works, create an account, start your 14-day free trial, or schedule a demo today.
In this article, we will discuss customer churn analysis, share its benefits and warning signs, explain how to conduct your analysis, and discuss how FullSession helps you in the process.
Let’s start by defining the customer churn analysis.
What is customer churn?
Customer churn, also known as customer attrition, is the term used to describe a customer’s decision to leave your business. Churn occurs when customers stop using your product or service – for example, they stop paying subscriptions or using your service altogether.
Many factors can cause customer churn – changes in customer needs, business environment changes, lack of value, product features, poor customer service, and more.
Let’s explain how customer churn affects your business.
Why does customer churn matter?

Image source: Pexels
Customer churn is one of the most immediate ways to measure the health of a company.
The loss of any customer represents a loss of revenue and opportunity and can be challenging to manage. Additionally, acquiring a new customer is usually more expensive than retaining one you currently have.
When a customer leaves, it can disrupt the flow of orders and sales, resulting in lost profits and damaged brand integrity. At the same time, there are costs associated with managing churn: account managers must spend time on follow-up calls, process refunds or cancellations, or take other measures to minimize attrition.
To understand what your churn rate means for the company, you must thoroughly analyze all the essential data.
What is customer churn analysis?
You can use customer churn analysis to evaluate user behavior and determine patterns to predict future churn.
The goal is to identify any possible causes for an increase in the customer churn rate and then take appropriate measures to prevent it.
It is important to remember that the analysis will never be 100% accurate. Still, it provides a good baseline for determining your business performance when predicting and preventing churn.
Five benefits of customer churn analysis

Image source: Pixabay
There are many benefits to conducting customer churn analysis. Here are some of them:
- Measuring company performance against key business objectives – churn analysis provides data that lets you see how your company is doing.
- Identifying areas for improvement – you can see what doesn’t work to implement necessary changes.
- Improving customer retention rate – analyzing churn helps you understand what you need to do to improve your customer retention rate.
- Identifying problems in the funnel – you can also find and remove problems with your sales funnel.
- Reduce costs associated with attrition – analyzing churn lets you understand what causes customer attrition and reduce its costs.
What patterns should you pay attention to during the customer churn analysis? Let’s discuss this.
Four warning signs in customer churn analysis
When analyzing customer churn, it is essential to look for changes in customer behavior that suggest problems. These include the following:
- Customers are complaining more frequently
- Customers are canceling their service more often
- The number of customers using the service is decreasing
- The number of new customers signing up for the service is decreasing
By analyzing data carefully, you can identify which customers are most likely to leave your business and figure out how to keep them coming back.
Customer churn vs customer retention: How they relate
Churn and retention are often mistaken because they deal with the same situation: people leaving your business. However, churn differs from retention because it measures the percentage of customers who have abandoned your service within a specific period.
Retention, however, measures how many existing customers renew their subscriptions over time. So, these metrics are two sides of the same coin. They’re closely tied. You need to understand what drives your retention to optimize your churn and vice versa.
Two types of customer churn
There are two main types of customer churn: voluntary and involuntary.
Voluntary customer churn refers to customers who decide to leave on their terms. Involuntary customer churn occurs when customers have to cancel their subscriptions due to a non-payment issue or other reasons, such as an expired credit card.
Given the importance of keeping customers happy, it’s essential to understand what causes them to leave. Understanding which customer churn you’re dealing with can help you prioritize your efforts and improve your overall retention rates.
What stats show us about customer churn
Here’s what statistics tell us about customer churn, its analysis, optimization, and importance for healthy business operations:
- Customer churn costs companies in the USA around $136 billion a year. (CallMiner)
- Managing customer expectations and solving customer issues during first-time interactions can reduce churn by 67%. (Kolsky)
- 69% of respondents are more likely to shop more frequently at retailers with consistent customer service. (Forrester)
- For 32% of people, just one bad experience is enough to turn away from a brand, despite previously exemplary customer service. (PWC)
- 92% of SaaS companies that grew less than 20% per year fail. Churn reduction and customer retention optimization strategies are crucial. (McKinsey)
Since you now understand the importance of customer churn, let’s discuss the optimal process to conduct your analysis.
Eight steps to conduct a customer churn analysis

Image source: Unsplash
You must take several steps to conduct a successful customer churn analysis and get the best quality data. Let’s discuss each step in more detail.
Step 1: Define what constitutes churn
The first step is to define what constitutes churn in your particular scenario. Is it just customers who cancel their subscriptions because of their decision, or do you want to measure and analyze involuntary churn too?
What about users who pause their accounts for financial reasons? Answering these questions will give you a clear picture of your current situation.
Step 2: Determine a timeframe for your churn calculation
You also need to specify what timeframe you want to evaluate for your churn calculation. As we’ve mentioned, 5% annual churn is very different from 5% monthly churn.
Step 3: Collect the data you need to perform the analysis
Now, it’s time to collect the data you’ll need for your analysis. You should be able to get the basic numbers from your day-to-day operations and financial reports depending on the timeframe.
Don’t stop there. Invest in a tool that lets you track different engagement metrics and provides behavioral analytics, such as our FullSession. Schedule a demo to evaluate all features.
Step 4: Calculate customer churn rate
The next logical step is calculating your churn rate. The basic formula looks like this:
Lost Customers ÷ Total Customers at the Start of the Period) x 100.
Calculate your rate as a percentage and compare it against the industry average.
Step 5: Calculate the financial impact of churn
The exact financial impact of customer churn will depend on your particular business situation and other metrics and key performance indicators, such as customer lifetime value.
Consider the lost subscriptions, what you paid to keep the client, and the money you will pay for acquiring a new user to recuperate the losses.
If you want to look at the broader perspective, you can calculate your revenue churn for the period you’re analyzing. To do that, start with the following:
- Determine your recurring revenue at the beginning of a month, quarter or year.
- Subtract the revenue you had at the end of the period from the revenue you had at the beginning of the same period.
- Subtract revenue that comes from new customers and bonus revenue that doesn’t come from standard operations. You only want to look at revenue lost due to churn.
- Divide the result by the total revenue you had at the beginning of the period.
- Calculate the percentage value.
For example, if you lost $50,000, and your total revenue at the beginning of the period was $500,000, you have a 10% revenue churn. Negative revenue churn means you gained, not lost, revenue.
By tracking churn rates over time, you can identify areas you need to improve to keep your customers happy and reduce churn rates in the long term.
Step 6: Identify the reasons customers are churning
Now, it’s time to analyze the data and the reasons behind customers churning. It’ll help you identify at-risk customers, and a behavior analysis tool such as FullSession can be beneficial here to give you all the necessary details about customer dissatisfaction.
Step 7: Summarize your findings and takeaways
When you have all the data you need and understand what’s going on with your customer base, summarize your findings, draw conclusions and create an action plan for solving all product issues.
Step 8: Create a plan to retain existing customers
The last step is to formulate a plan to help minimize your customer churn, so your company can stop losing users and revenue. It will ensure your business grows over time.
Since we explained the crucial steps in conducting a customer churn analysis, let’s briefly discuss customer behavior tracking and its importance in the analysis.
Why is customer behavior essential for customer churn analysis?
Understanding customer behavior helps you identify early warning signs that a customer may be at risk of churning.
For example, if a customer starts reducing their use of a product or service or begins engaging in less positive behaviors (e.g., complaining more frequently), this may indicate they are not as satisfied as they once were and are at risk of leaving.
Many factors can influence customer behavior, so tracking as much data as possible is essential. This data can come from surveys, customer feedback, heat maps, session recordings, and more.
By understanding what factors are causing customers to leave, you can take steps to address these issues and keep customers loyal.
To conduct such an analysis, you need to start using an advanced user behavior tool like FullSession. Let’s discuss what FullSession can do for your business.
How to reduce customer churn with FullSession
FullSession is our cloud-based platform that offers website visitor tracking tools.
It’s available as a SaaS and doesn’t affect your website performance while collecting product metrics for analysis. It gives you access to many useful features.
You can use it to watch session recordings and replays and analyze interactive heatmaps. You can read our guide on how to read a heatmap for more information.
You can also use FullSession for customer journey tracking and get customer feedback via customer feedback tools.
All data is easy to find thanks to advanced filtering and segmentation features.
Understand the reasons why users abandon your site
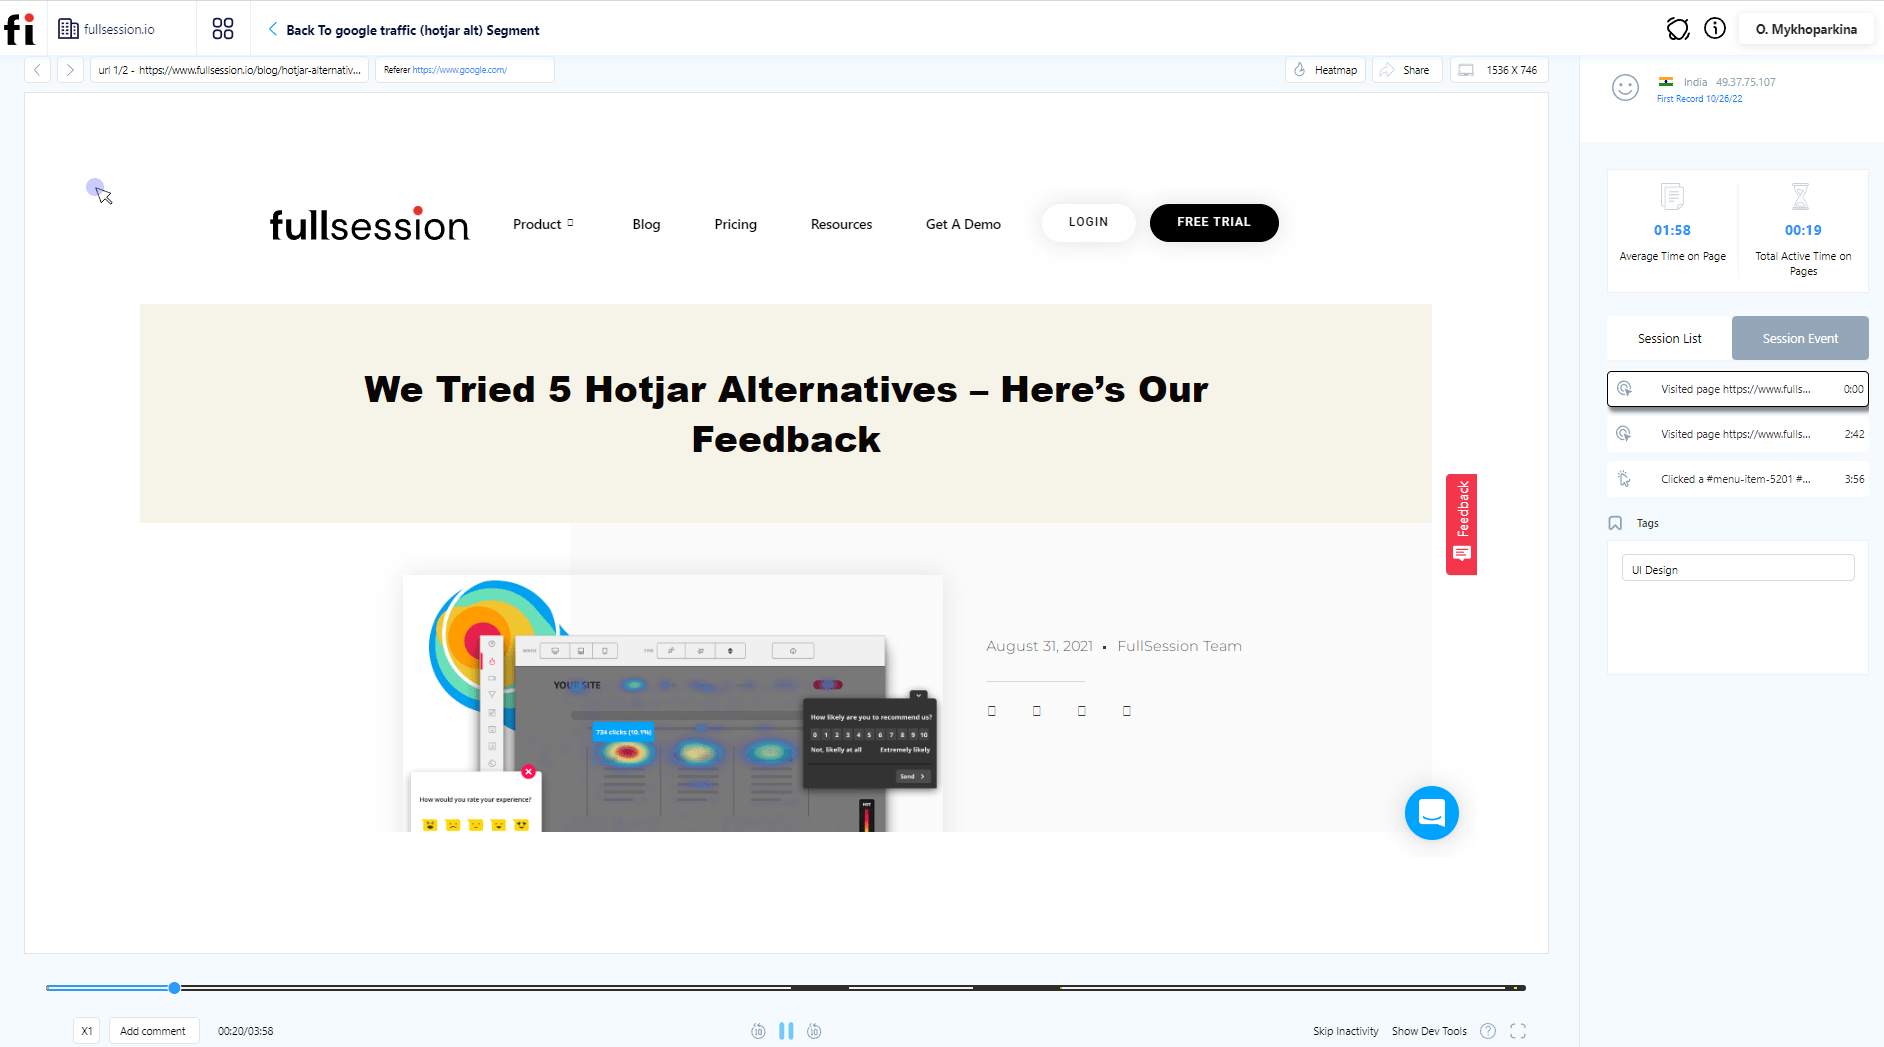
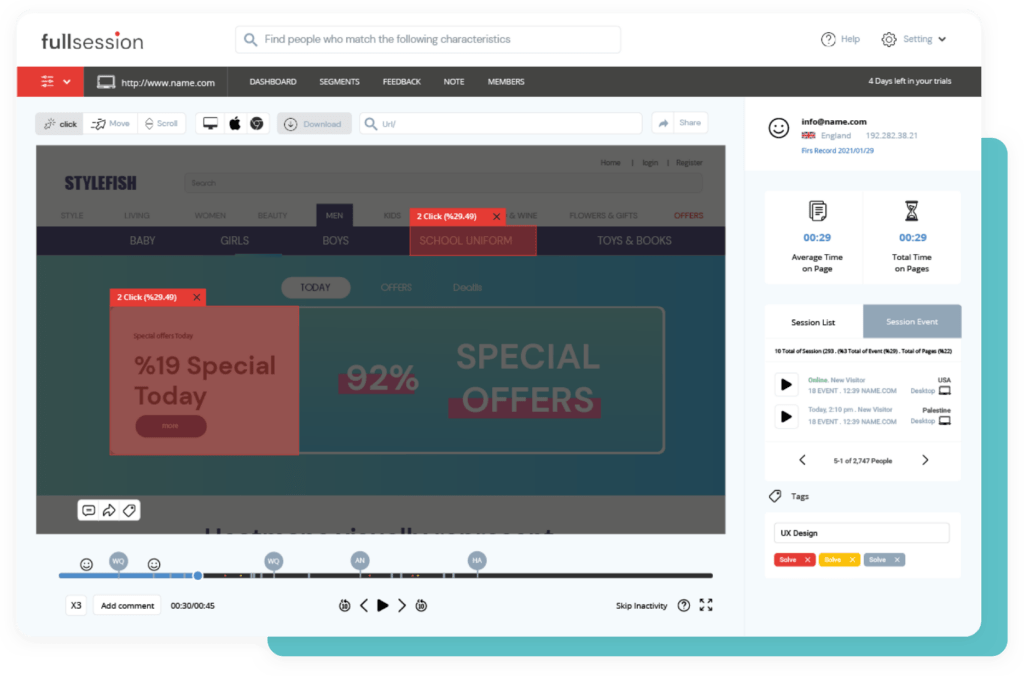
FullSession provides product analytics and helps you understand what motivates users to look for a different solution and leave your brand. You can watch session recordings and track issues that push your users to leave your website, web app, or landing page.
There is no need to watch the entire session replay. You can skip periods of inactivity, fast-forward and rewind session recordings to save time.
Identify usability issues and troubleshoot technical issues
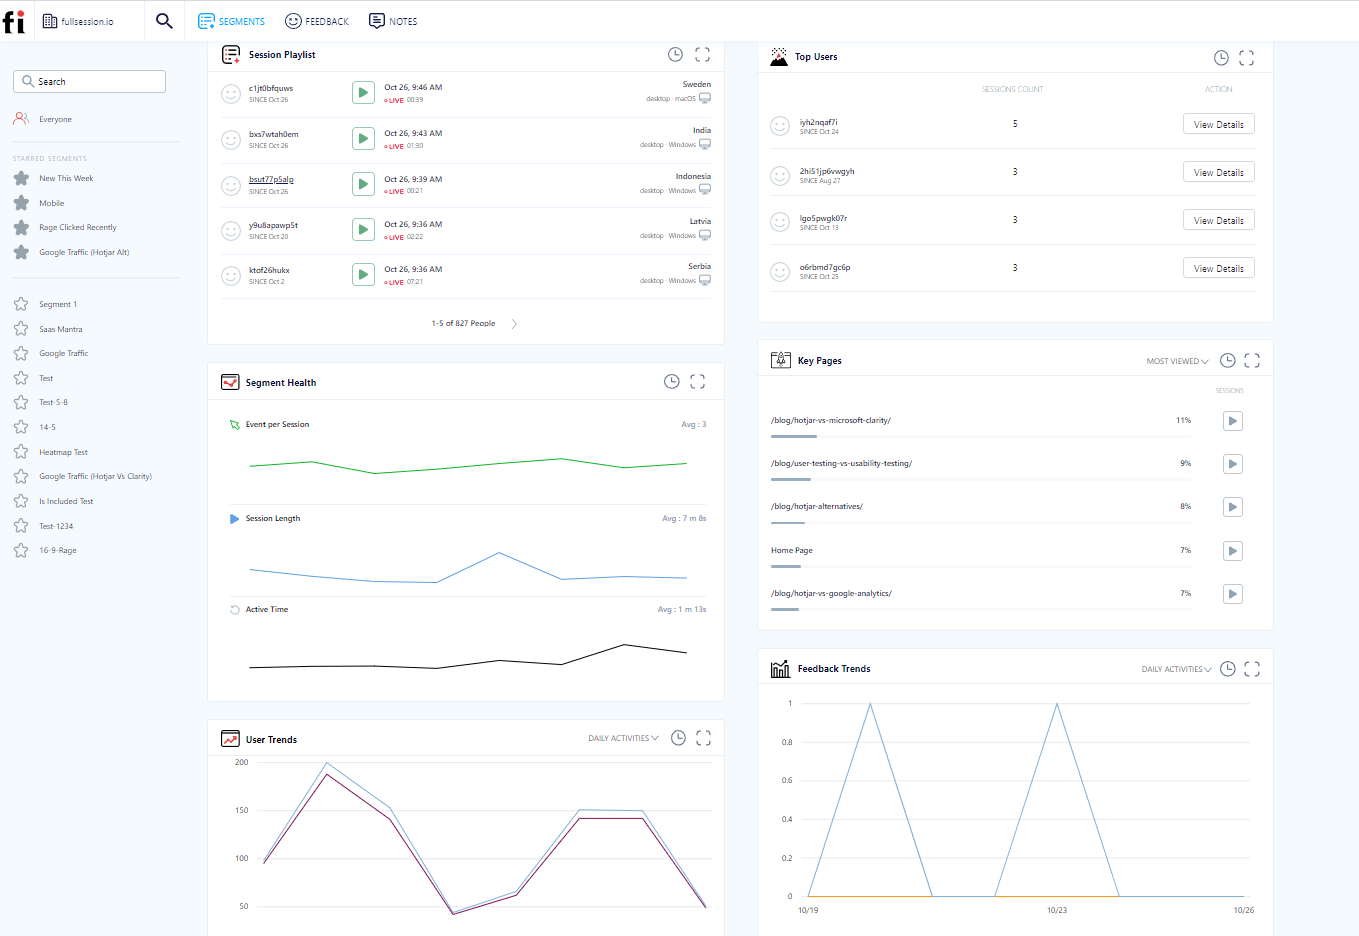
With FullSession, you identify various usability issues which stop people from performing desired actions on your website and evaluate the following data:
- Total time spent on pages
- Average time on page
- Segment health
- Error clicks
- Dead clicks
- Rage clicks
- Trashed cursor
- Page load time
- Exit page
- Device and browser breakdown
- Screen resolution breakdown
- Segment health
Identify user experience issues and frustration points
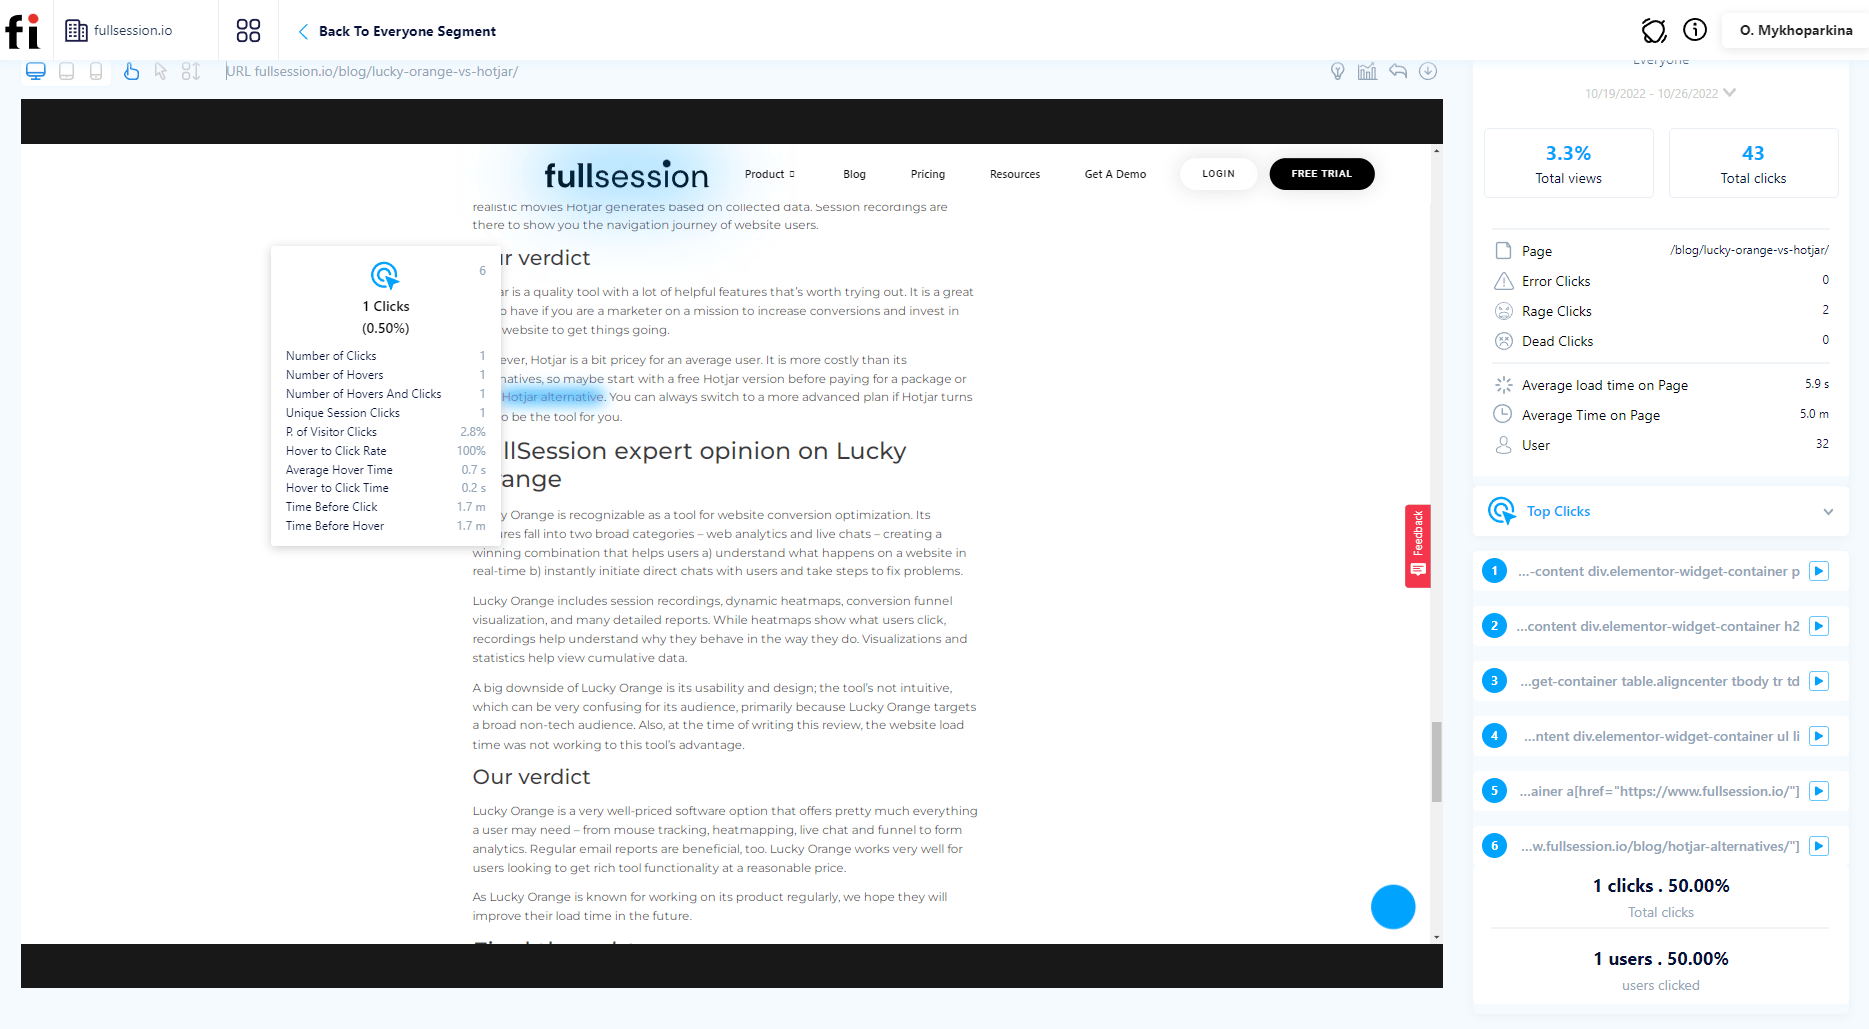
FullSession interactive heatmaps provide user behavior data in a graphic form. They are easy to understand and analyze. We provide you with three types of heat maps: click maps, movement maps, and scroll maps.
The first two heatmaps – click maps and movement maps – help identify user experience issues and track what makes customers churn. You can see what users tend to click on the page and which areas of the page they avoid or have problems with.
Clicks map example
Mouse movement heat map example
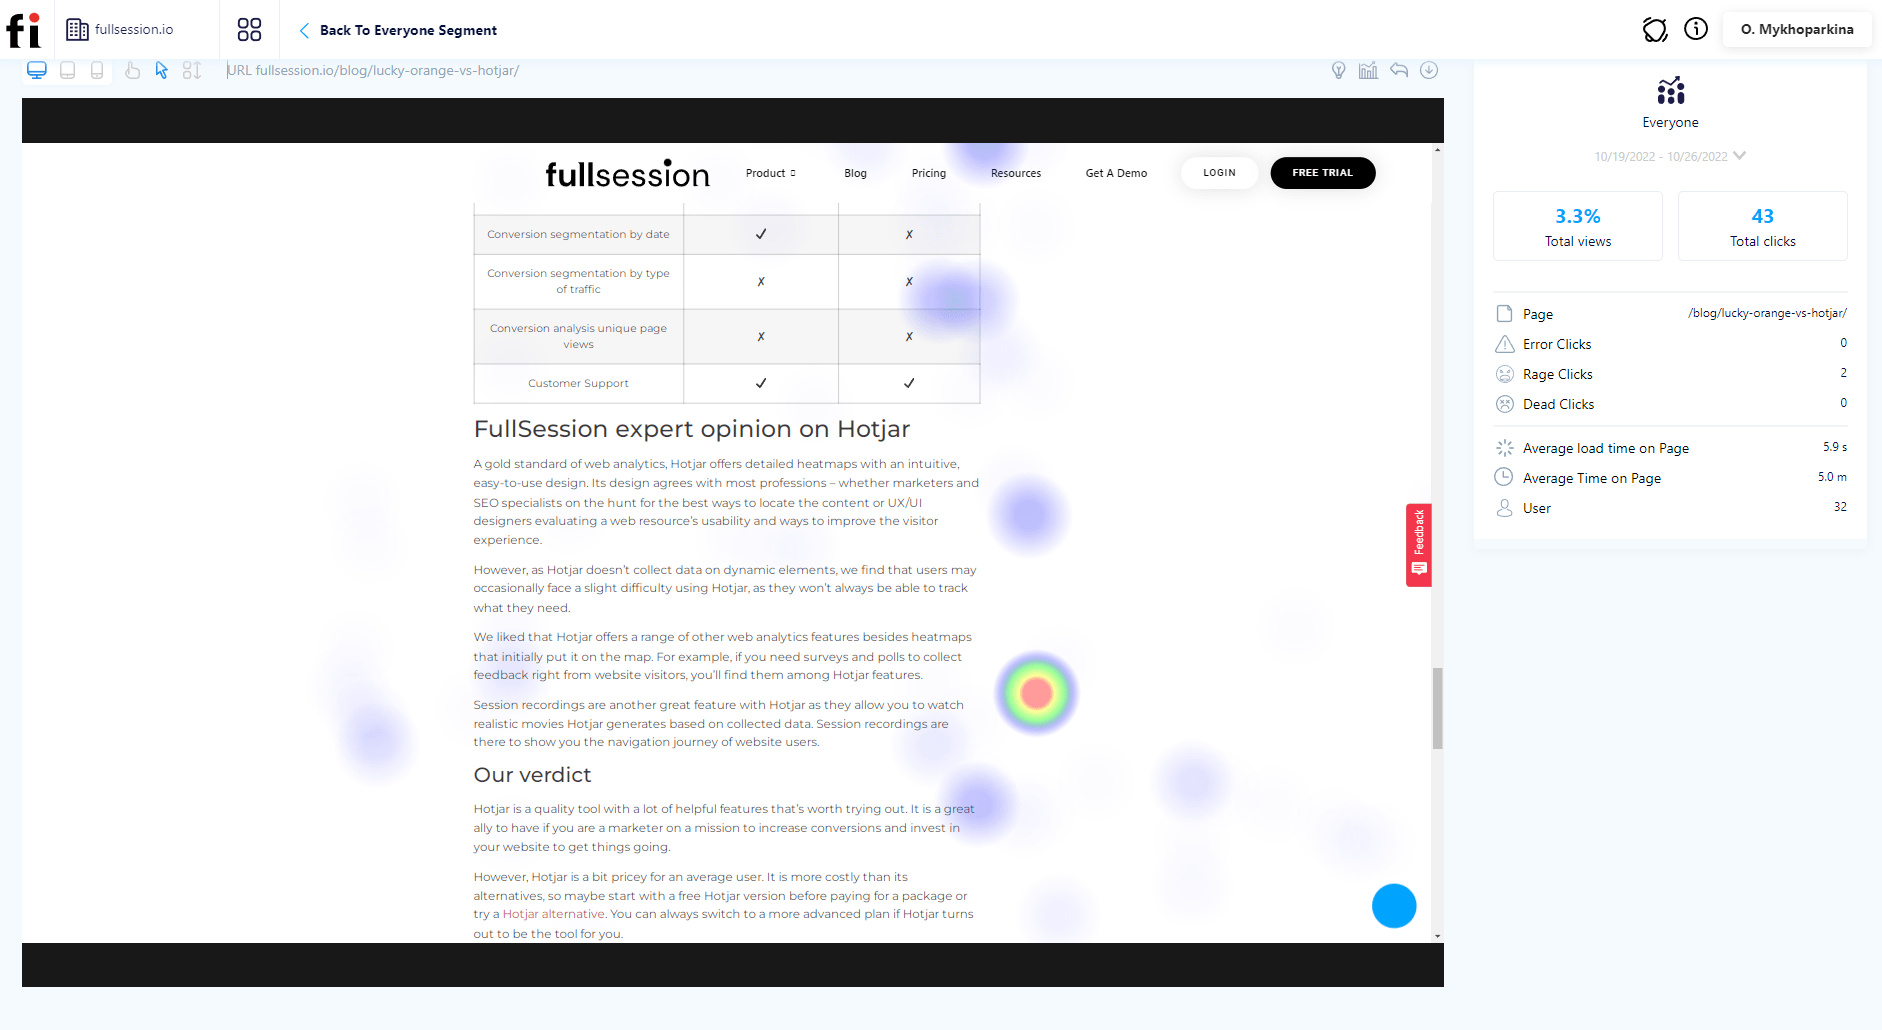
FullSession gives you access to information that lets you assess how attractive your website is to potential customers. You can view the following:
- Number of users who visited the page
- The average time on page
- The average load time on page
- User engagement on different devices
- The number of total clicks
- The number of total views
Improve your page layout and design
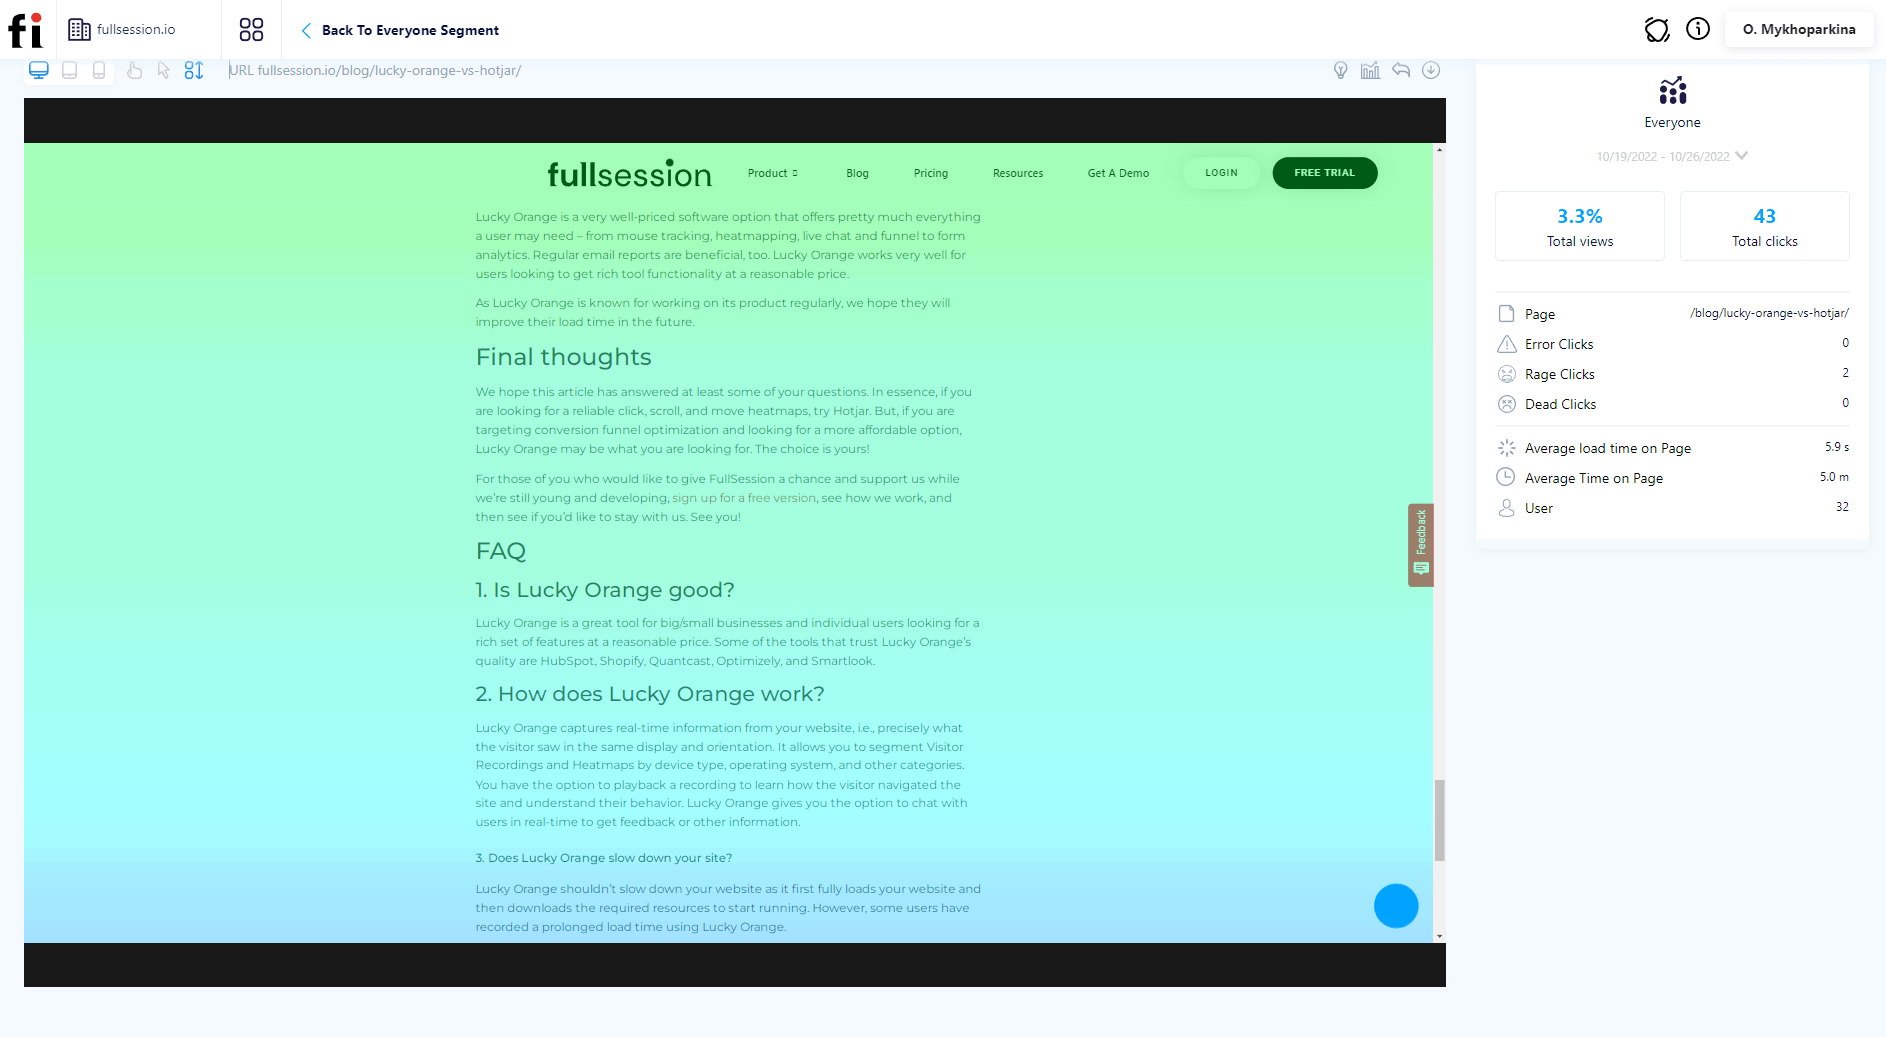
Scroll maps let you see how far users scroll down the page. It helps you avoid making the pages too long and place essential content elements like high-priority information, buttons, and CTAs in perfect spots to increase conversions.
Scroll map example
Optimize user journey
Heat maps and session recordings help you identify potential issues down the road. If you notice many people going toward a particular area of the page but then stopping before they complete their journey, that might indicate something needs to be fixed or clarified on the page because it hinders your conversion rate.
Identify low-performing content and track customer engagement
With FullSession, you can identify low-performing content driving low engagement and negative user experience. You can also track whether people stay on your site and look at what topics they search for to create more content that resonates with your customers.
Understand customer needs and expectations
Understanding the needs of your users is crucial for optimizing the user experience and reducing the churn rate. FullSession is very useful because it relies on data from real users instead of hired testers. Every piece of data you collect comes from your actual users, so you can evaluate their authentic experience with your website.
Gather customer feedback
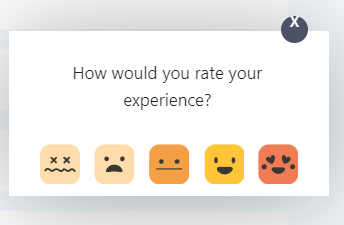
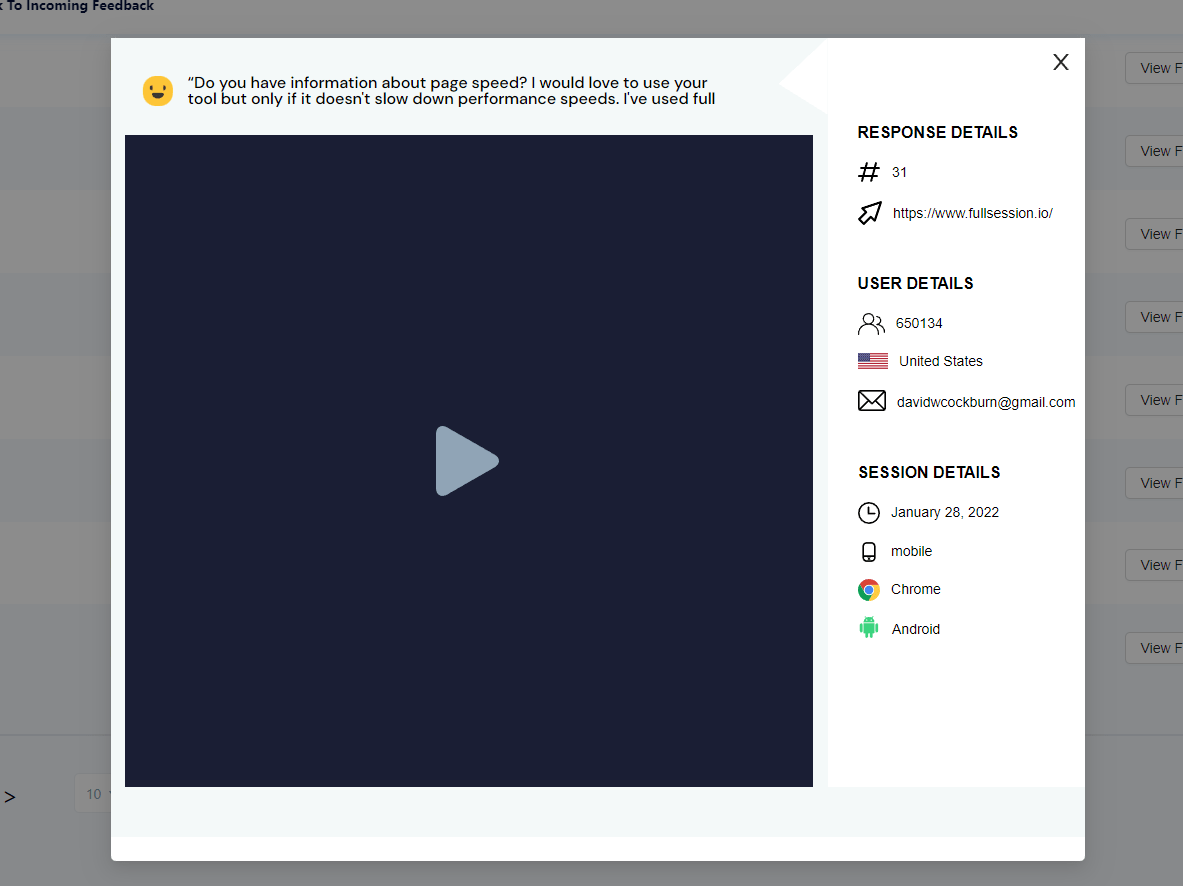
FullSession helps you get feedback directly from your users. You can customize each form and select the pages and devices to display the widget. Your customers can leave their feedback using emojis and answer your predefined questions.
To track each feedback, you can navigate to the Feedback section of the FullSession dashboard and see details such as:
- The user ID
- URL
- User sentiment
- User comment
- Browser
- Date of creation
- Feedback details
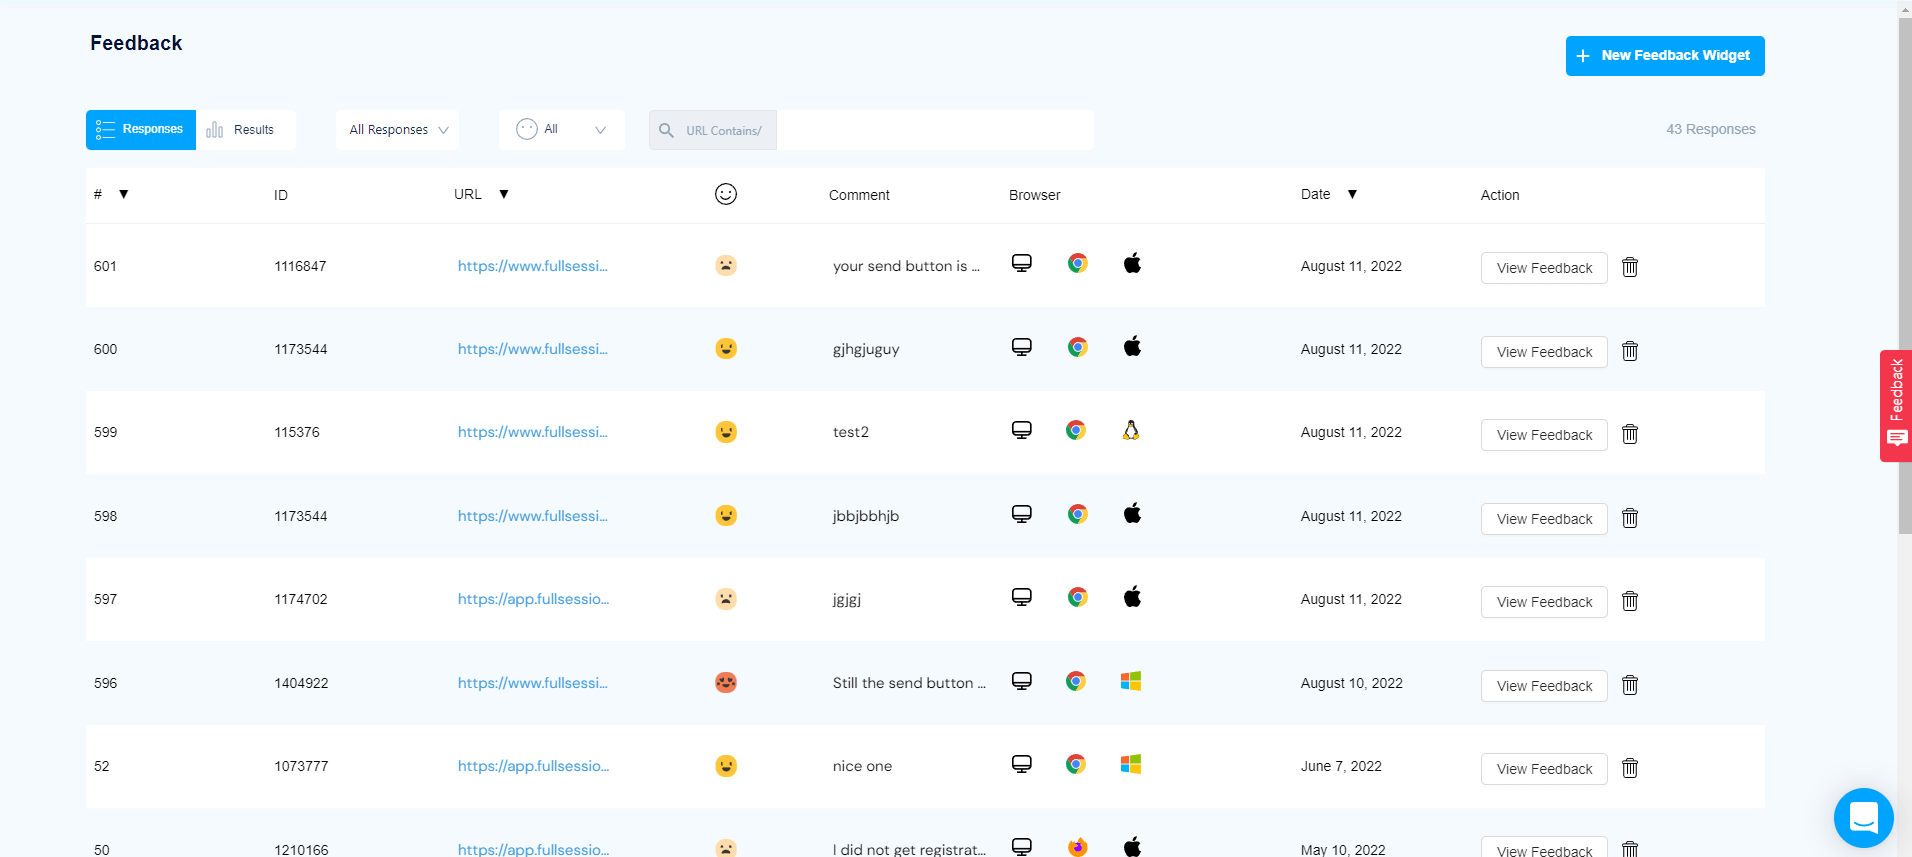
You will get the response, user, and session details for each feedback. What’s best, each feedback is connected to a session recording, so you can watch the replay and evaluate what happened to understand the user’s comment.
Improve your customer support
Statistics show that customer support is one of the most critical factors behind customer churn. With FullSession, you can provide data-driven customer support that offers personalized, tailored guidance and improves the overall user experience of each customer.
Keep users’ private information secure
FullSession doesn’t track or record users’ private details, such as typed passwords, credit card information, or other sensitive data. Our platform shows only the reconstructions of events during a session. You also can’t use FullSession for behavioral advertising purposes.
It means you can collect data essential for your business while caring for the privacy and security of your customers.
Visualize data in a way that is easy to understand
FullSession makes data more accessible with visual reporting. It communicates complex concepts clearly and efficiently to help you track changes over time. By looking at data visually, you can make better decisions based on what you see instead of just relying on percentages or numbers alone.
Identify trends and patterns in customer behavior
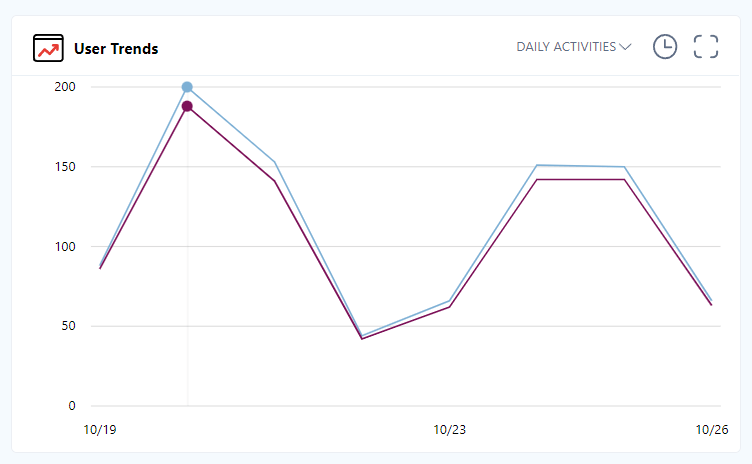
Trends and patterns help you identify what customers are doing on your website. If they’re using your site more often, you know they like it. If they’re visiting but not buying, you know you need to make your site more appealing.
By looking at trends, you can learn how often customers visit your site or what kind of content attracts them most. By looking at patterns, you can see how visitors engage with different parts of your site, such as product pages or checkout processes. These insights can help you create a strategy for improving customer engagement and retention.
As you can see, FullSession provides you with a wealth of data to learn more about your customers and their needs and presents this data in easy-to-digest reports.
It provides all the crucial user behavior tools you need to boost your customer churn analysis and make informed decisions about your strategy for reducing the churn rate.
How to start with customer churn analysis
Customer churn is a significant business issue that can seriously impact your company. It can lead to a loss of revenue and profits and reduced brand loyalty.
To solve this problem, you have to take a proactive approach. You need up-to-date, in-depth data, regular customer churn analysis, and a proper tool to collect all information on user behavior.
We are sure that FullSession is your best option to analyze churn effectively. It gives you access to session recordings and replays, along with three distinct types of interactive heatmaps. These are essential if you want to identify problems with user experience or usability and boost user engagement.
You can also use customer feedback forms to get additional feedback from your users. Our platform visualizes the data in a clear, graphic way and makes it easy to search through and organize, thanks to advanced segmentation and filtering options.
If you’re interested in FullSession, start your 14-day free trial, or contact us to get a demo.
FAQs about customer churn analysis
Here are answers to some of the most popular questions about customer churn.
Why is customer churn analysis important?
Customer churn is a significant issue for any business. A high churn rate can lead to lost revenue, lower customer satisfaction, and increased costs. Furthermore, it can indicate poor customer service or a poorly designed product.
What does 5% churn mean?
It depends on what period you are looking at. An annual churn rate of 5-7% is considered good – it’s what most businesses strive to achieve. However, a monthly churn rate of 5% is terrible news, and you need to act quickly to stop losing your customers.
What is a good churn rate for consumer?
Churn doesn’t affect customers directly, but companies with a low churn rate tend to have a better quality of services and customer support.
Mohamed oversees operations and finance at FullSession and has contributed to the company’s UX analytics knowledge base.