When planning the features of FullSession, our behavioral analytics software, we tested many other tools to learn more about their strengths and weaknesses because our goal was to build something even better with these lessons in mind.
In this blog post, we will explain the differences between Google Analytics and Hotjar, as many businesses are stuck between these two solutions. We will also explain why FullSession can be a good alternative.
FullSession helps you understand the reasons behind user actions via session recording and replay tools, website heatmap tools, funnel and conversion analysis, error tracking features and customer feedback tools.
You can schedule a demo to learn how our software helps you gather user behavior analytics data you can use to improve your web app, landing page, or website.
Start a Free Trial to Experience FullSession
Capture all user interactions, spot trends and patterns and drive improvements without compromising your website performance.
Let’s start with some basic information.
The Importance of Web Analytics
Google Analytics is one of the most important marketing tools. It helps you measure customer interaction with your website and tells you more about your customers’ needs, intentions, and goals.
Aside from tracking users’ behavior, you can see where you are losing customers in your sales funnel. You can make segmentation by sales conversion, upsell or cross-sell activities, traffic, bounce rate, and more.
By understanding what attracting your target audience is, how often they visit your site, and what they do on it, you can optimize your landing page or website and ultimately increase conversions. But is this enough to help you make informed decisions?
Learn more about user behavior
Data collected from analytics tools like Google Analytics let you know what’s working and what isn’t. Numbers can show you what people do on your site, but they can’t tell you why your users made the choices they did.
You need more information to understand what’s happening between events; in other words, between the lines.
By seeing how your users behave while interacting with your website, you’ll be able to get answers to questions you might not have thought of by looking at metrics alone, and that’s where the behavior analytics tools perfectly blend in.
Hotjar: The Behavior Analytics Solution
Between Google Analytics and Hotjar, deciding which is right for your business can be challenging.
While both are excellent tools for measuring user behavior on your site, some differences between them might make one more suitable than the other. Additionally, there are other Hotjar alternatives you should consider.
Hotjar is a behavior analytics platform that complements Google Analytics and other traditional analytics tools, providing in-depth analysis that you can’t derive from traditional data. With Google Analytics, you can see your metrics. With Hotjar, you can see why they’re happening.
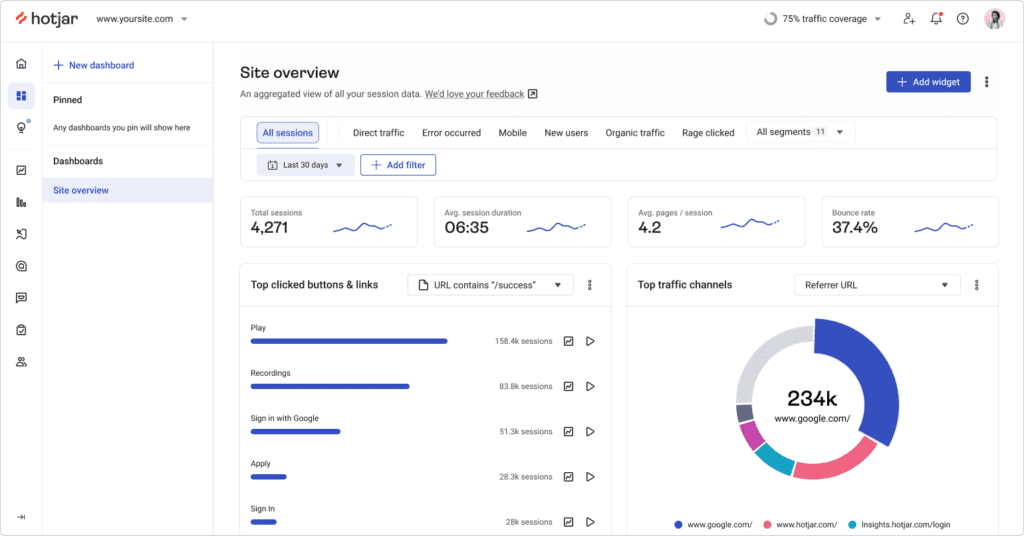
Hotjar has helpful features that let you track and analyze real-time website engagements. With heatmaps, user recordings, surveys, and user feedback services, you can make informed decisions about your website’s usability, navigation structure, content organization, and more.
We’ll go step-by-step through Hotjar and show you how to get the most out of it.
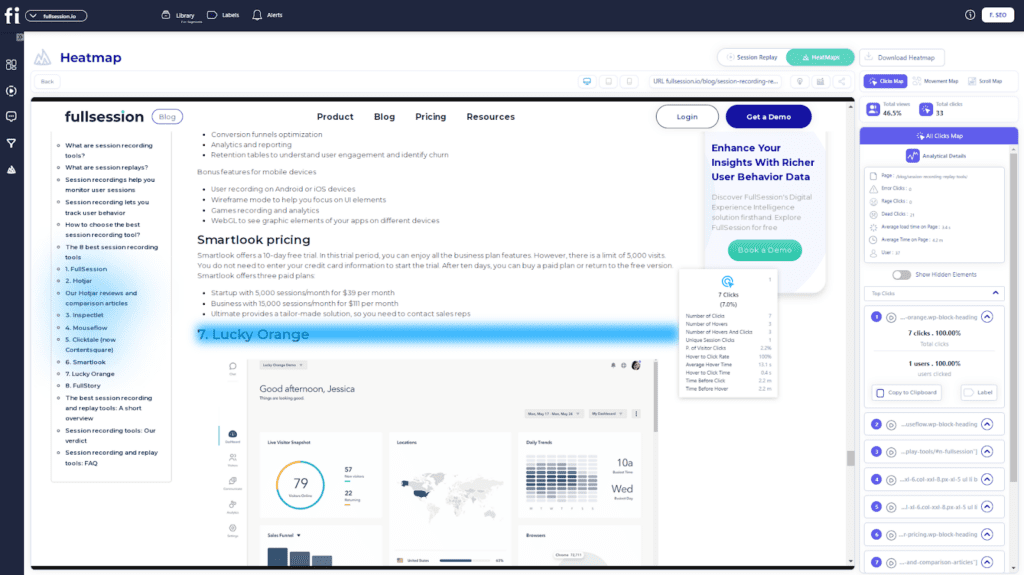
Keep an eye on customer interaction with heatmaps
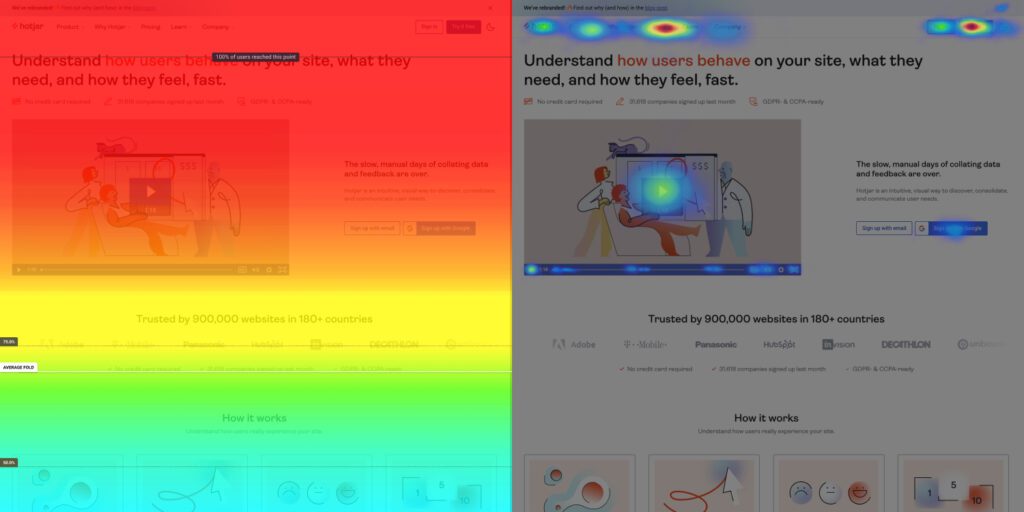
Hotjar is a unique heatmap software. Heat maps can take a visitor’s activity and translate it into a visual representation. This information is presented as a color: the warmer the color, the higher the activity.
Hotjar offers three types of heatmaps:
- Click heatmaps that show you where your visitors click the most.
- Move heatmaps that track visitors’ mouse movements while browsing your website.
- Scroll heatmaps that are very useful for landing page analysis and optimization.
What elements grab your potential customer’s attention? Heatmaps will help you clearly understand this question and create a website layout that keeps your potential customers engaged and entices them to come back.
Hotjar heatmaps help you learn:
- Where your users drop off in the conversion funnel
- Which page areas confuse or fail to keep users’ attention
- What they’re doing during A/B testing
- What page elements decrease conversion and engagement rates
- How users interact with website pages during real-time experiments
When testing your website on different devices, you can use Hotjar to switch between desktop, tablet, and mobile views to pinpoint which issues are device-specific.
Improve Your Website UX and UI
Learn how FullSession interactive heatmaps help you find cold spots and dead zones on your site.
See your site from a visitor’s point of view with session recordings
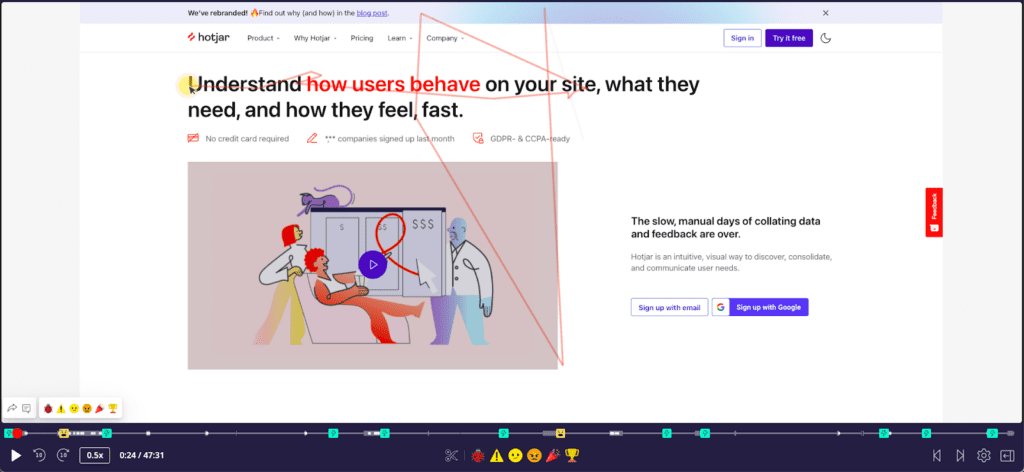
With visitor recordings, you can watch real users interact with your product as they would in the real world. From clicking to scrolling to hovering, you can see everything a user does on your website’s pages.
Hotjar helps you understand why your visitors are navigating away from the page so you can find frustration points driving them away. Spot problems, pause the recording to view it from any angle, or zoom in on the page to see what’s going on. It will help you improve your site with each video.
You can also add tags or notes to your session recordings. These can be used to mark important events or gather feedback from your team.
Hotjar also provides advanced segmentation options, letting you view data through many lenses. You can record user activity easily and filter your session recordings by specific visitor types.
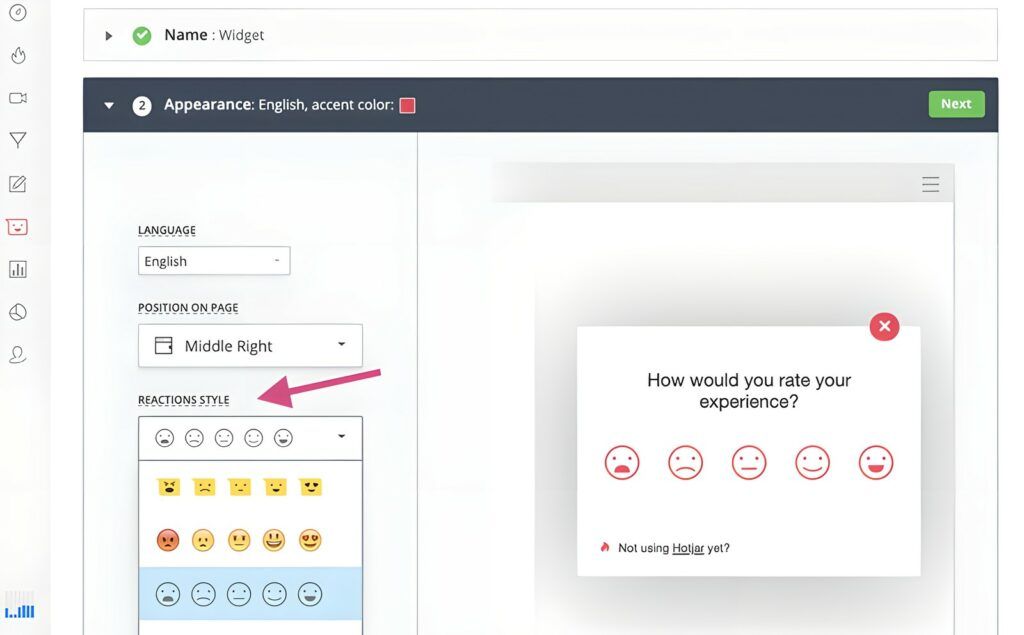
Know what your customers want with user surveys
With Hotjar user surveys, you can easily create a list of questions and place it on your website. As your visitors take the survey, the software records users’ words, providing you with direct feedback.
With this qualitative data, you will know what to improve next on your website. Depending on your needs, you can start from scratch or choose a template.
If you ask users what they love the most about your website or app or what issues they might have, you will gain insight into customer experience and help your development team improve your product.
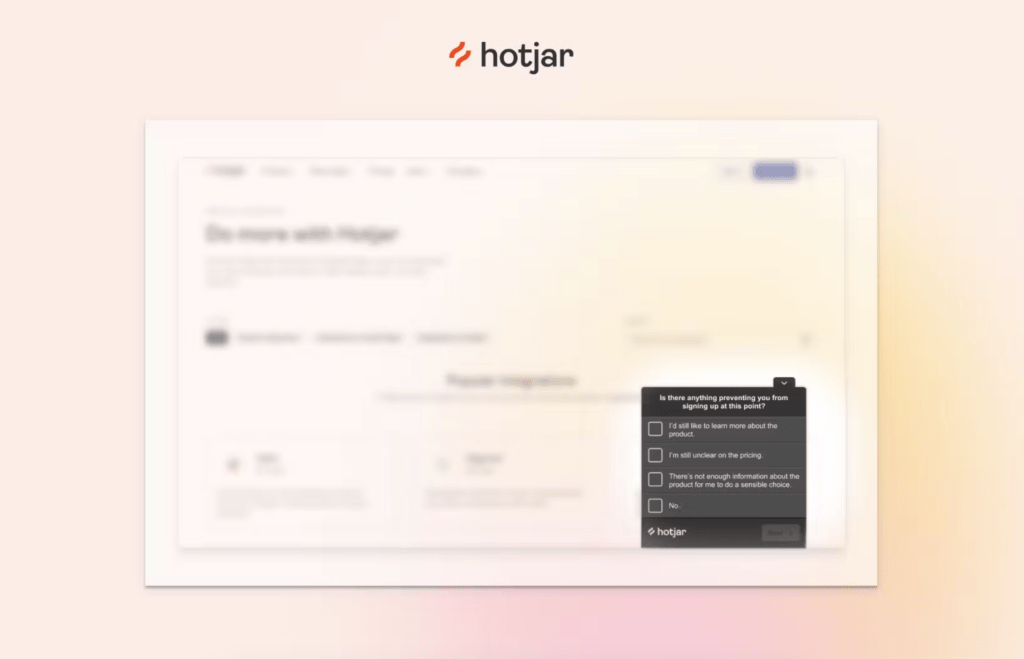
Make your customers happy with user feedback
With Incoming Feedback, you can engage with your users at a micro-level. Hotjar offers a real-time suggestion box that lets you follow individual visitors as they move across your website, pages, forms, or images.
You’ll be able to record your users’ comments and complaints, know whether they’re thrilled or not quite satisfied, and capture any problems that might arise.
This level of engagement brings your company and your users on the same page, building trust and loyalty in the process. If you want to improve your website for happier users, Hotjar’s Incoming Feedback will enable you to get there faster.
Hotjar bonus features
Hotjar is easy to set up and use – it doesn’t require additional software and comes with detailed instructions and video tutorials.
The platform also has an intuitive dashboard. The interface is clean and well-organized, making it easy for users to get started and discover what Hotjar can do. There isn’t a large learning curve, and anyone can set it up.
With Hotjar, you can:
- Invite unlimited team members and clients to use the software free of charge
- Target your users smarter
- Collect feedback in more than 40 languages
- Use all features on desktop devices or mobile devices
- Protect your website users with privacy features
- Export and share feedback in CSV or XLSX
- Install and use the solution on all major platforms
- Integrate the solution with major tag managers like Google Tag Manager
- Optimize your ad campaigns
- Have reliable customer support
- Collect qualitative and quantitative data with ease
- Customize an External Link survey, a Full Screen survey, etc.
Whether you’re working on your first digital product or running a massive campaign, your company can track and access data points to implement design changes. And that data is fun to look at, too!
Hotjar vs Google Analytics: What is the Difference?
There is no need to abandon Google Analytics to start using Hotjar or vice versa. Hotjar is an alternative, not a replacement, for your Google Analytics account. You can use both tools, as they serve different purposes.
While Google Analytics is an in-depth tool for tracking metrics, from a site’s traffic levels to shopping cart abandonment, Hotjar offers a more user-centric approach.
It helps you receive customer feedback and make necessary changes to your landing page or website based on their comments.
FullSession: The Best Alternative
Learn how to visualize, analyze, and optimize your site with FullSession.
Hotjar vs Google Analytics: When to use each
Google Analytics is an essential tool that every business should be using to collect data and access information. You can use Google Analytics to get details about user acquisition, demographics, traffic sources, website metrics, ad campaign results, and more.
It is best suited for individuals or SME businesses that require basic data because it lacks many of Hotjar’s advanced features.
On the other hand, Hotjar can help you analyze and optimize your landing pages, websites, or conversion funnels with features like Heatmaps and Recordings. It also specializes in improving user experience by gathering feedback with Polls, Surveys, and Form Analytics.
It is best suited for large enterprises that need advanced functionalities or employees working as Product Managers, Product Designers, or Researchers.
Google Analytics vs Hotjar: Learning curve
Using Google Analytics requires preparation for a significant learning curve, which is one of its main disadvantages. While the data is straightforward to interpret, using it properly requires much time and effort.
The customization and depth it offers are extensive, but gathering and deciphering different metrics and optimizing your performance based on them is a process you must learn.
Compared with other tools, Hotjar lets users add it to their websites with the click of a button. The entire process takes just a few minutes, making it easy for businesses to add the code to their website and start surveying and tracking their customer behavior quickly and effectively.
Hotjar vs Google Analytics: Integrations
Hotjar offers more integrations than Google Analytics. With more ways to add real-time evaluation and deeper integration with other major platforms, you can see data from all sources in one place, eliminating the need for multiple tools. It will help you find the insights you need faster.
With this software’s wealth of information, there’s almost no limit to what you can learn about your customers. It gives business owners who use multiple platforms more flexibility in everyday work.
Google Analytics vs Hotjar: Pricing
You can use Google Analytics free of charge as an offer you won’t find in many other places. There are no upgrades, no hidden fees, and no catch. You can set up a free account with no credit card information required after signing up for a free Google account.
What is less known is that Google Analytics has a paid version called Google Analytics 360 that starts at $50,000/year. This enterprise version provides an advanced interface that allows large businesses to conduct more in-depth analyses.
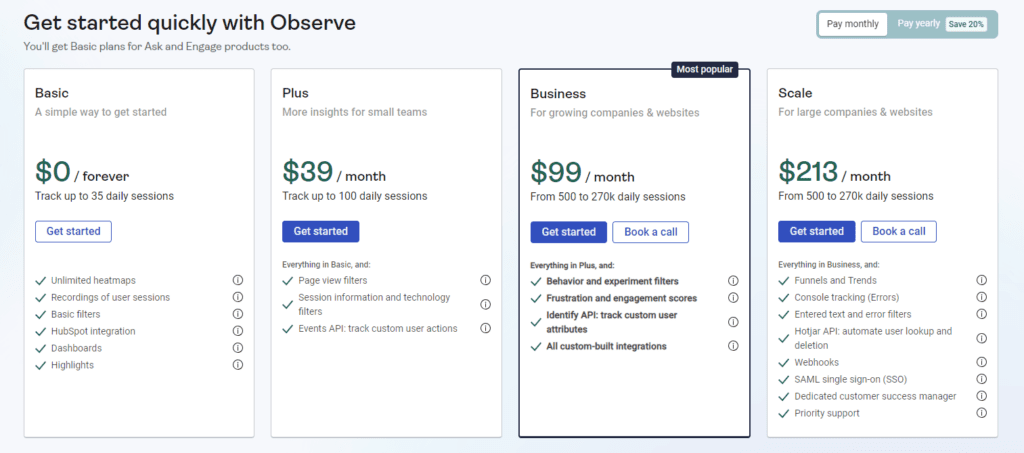
On the other hand, Hotjar offers a basic package that lets you capture up to 1,000 pageviews/heatmap free of charge. In case you are satisfied with the software, you can choose paid upgrades anytime:
Hotjar provides three paid plans—Observe, Ask, and Engage. The Observe plan helps you track customer events using web analytics features like heatmaps and session recording. It includes:
- Basic—costs $0 and allows you to track up to 35 sessions/day
- Plus—costs $39/month and lets you track up to 100 sessions/day
- Business—starts from $99/month and lets you track 500 to 270,000 daily sessions
- Scale—starts at $213/month and lets you track 500 to 270,000 daily session recordings
The Ask plan lets you discover how your users feel and what they have to say via the feedback tool. It is divided into:
- Basic—costs $0 with access to 20 monthly responses
- Plus—costs $48/month with access to 250 monthly responses
- Business—starts from $64/month and lets you receive 500 to 100,000 monthly responses
- Scale—starts at $128/month and offers access to unlimited monthly responses
Lastly, the Engage plan allows you to automate recruitment, scheduling, and hosting for moderated user interviews. It is divided into:
- Basic—costs $0 with access to 3 interviews/month from your own network
- Plus—costs $39.2/month with access to up to 3 interviews/month from the Hotjar participant pool and unlimited interviews from your own network
- Business—starts from $440/month with access to 12 interviews/year from the Hotjar participant pool and unlimited interviews from your own network
- Scale—offers customized pricing and access to 20 interviews/month from the Hotjar participant pool and unlimited interviews from your own network
Hotjar vs FullSession: What We Do Better
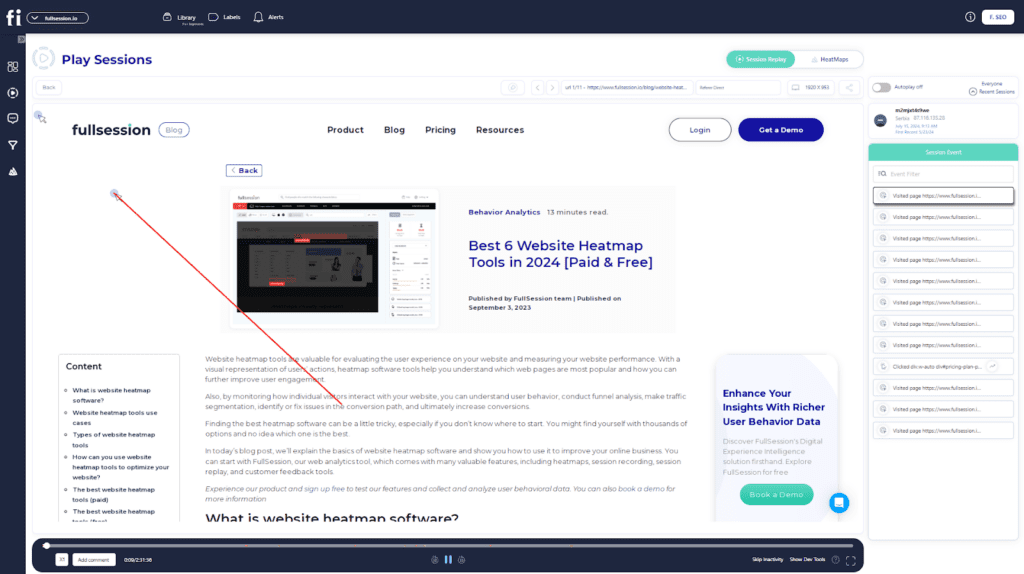
FullSession is a user behavior analytics tool offering comprehensive features to capture and analyze all user interactions, enabling you to optimize your website.
Some of the key components include:
- Session recordings and replays
- Website feedback forms and reports
- Click, mouse movement, and scroll heatmaps
- Funnel and conversion tracking
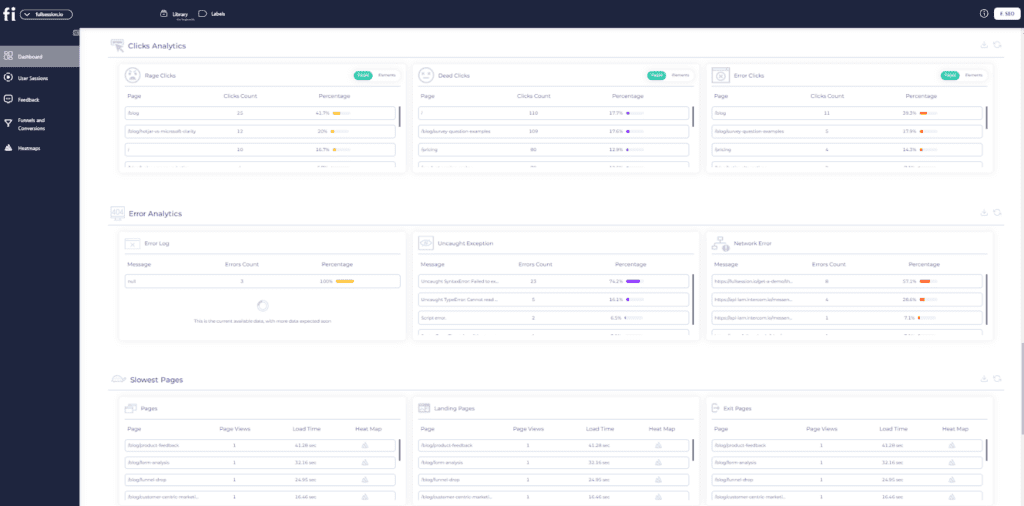
- Error analysis
- Advanced user and event filtering options
You don’t need to download any additional plugins to use our service. Instead, you can start recording sessions immediately to track your users’ behavior.
Start a free trial or book a demo to evaluate all features.
How we compare
We looked into Hotjar’s features, compared them with our solution, and researched its core competencies. Here is what we found out:
- FullSession uses broader analytics tools to analyze visitor behavior, allowing you to assess better where friction points occur and how to solve them.
- FullSession provides insights into the impact on conversion rates and dropouts in the sales funnel.
- With advanced filtering options, you can quickly find sessions that raise an eyebrow and dig deeper so you can create a better experience for your customers.
- FullSession will help you identify significant events in one session to save time and reduce the noise.
- FullSession funnels offer an in-depth analysis of user journeys, allowing you to monitor, comprehend, and optimize every stage of your conversion funnel.
- Error analysis will help you identify, analyze, and resolve errors impacting user experience by leveraging data on error clicks, network errors, console errors, error logs, and uncaught exceptions.
Also, we found one significant difference in website performance. If you use Hotjar, your website will slow down significantly, making the data gathered and analyzed unimportant because it will take forever to load.
On the other hand, FullSession allows you to conduct the right customer experience analysis without affecting the site’s performance.
Get a demo to learn more.
Why FullSession is the Best Analytics Tool of 2024
When optimizing your website and enhancing user experience, FullSession stands out as the best option.
Unlike other behavioral analytics tools, FullSession provides a comprehensive suite of features that give you a complete picture of your user journeys without the huge learning curve.
From detailed funnel analysis and real-time visitor tracking to robust heatmaps, website feedback forms, and session recordings, FullSession covers all bases to help you understand and improve every aspect of your site.
FullSession’s unique advantage lies in its ability to offer actionable insights without compromising website performance. Its efficient design ensures your site remains fast and responsive while you gather invaluable data.
The intuitive interface makes it easy to navigate and leverage these insights, whether you’re a seasoned analyst or just getting started!
FullSession Pricing Plans
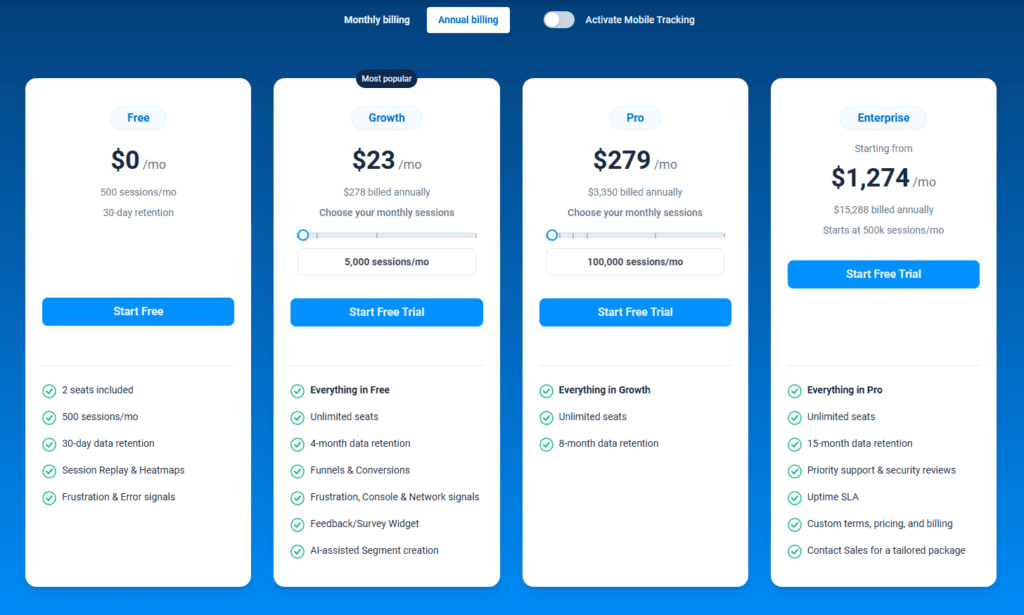
The FullSession platform offers a 14-day free trial and three paid plans: Starter, Business, and Enterprise. A yearly subscription can save you up to 20%!
Here are more details on each plan.
- The Free plan is available at $0/month and lets you track up to 500 sessions per month with 30 days of data retention, making it ideal for testing core features like session replay, heatmaps, and frustration signals.
- The Growth Plan starts from $23/month (billed annually, $276/year) for 5,000 sessions/month – with flexible tiers up to 50,000 sessions/month. Includes 4 months of data retention plus advanced features like funnels & conversion analysis, feedback widgets, and AI-assisted segment creation.
- The Pro Plan starts from $279/month (billed annually, $3,350/year) for 100,000 sessions/month – with flexible tiers up to 750,000 sessions/month. It includes everything in the Growth plan, plus unlimited seats and 8-month data retention for larger teams that need deeper historical insights.
- The Enterprise plan starts from $1,274/month when billed annually ($15,288/year) and is designed for large-scale needs with 500,000+ sessions per month, 15 months of data retention, priority support, uptime SLA, security reviews, and fully customized pricing and terms.
Complete Your Analytics Stack With FullSession
Setting up your web analytics dashboard with FullSession takes less than 5 minutes, and it’s completely free!
Get a demo now.
FAQs About Hotjar and Google Analytics
Can Hotjar replace Google Analytics?
Hotjar is not a complete Google Analytics replacement. Google Analytics provides comprehensive quantitative data on website traffic and performance, while Hotjar offers qualitative insights into user behavior through heatmaps, session recordings, and feedback tools. Using both tools together gives a complete picture of your website’s performance.
Why is Hotjar better than Google Analytics?
Hotjar is better for visualizing user behavior with heatmaps and session recordings, allowing you to see exactly how users interact with your site. It also provides direct user feedback tools like surveys and polls, which Google Analytics lacks, offering a deeper qualitative understanding of user experience.
What is the disadvantage of Hotjar?
One disadvantage of Hotjar is that it has a data storage limit on its free and lower-tier plans, restricting long-term analysis. Additionally, it may not offer as detailed session replays or advanced segmentation as some competitors like FullStory.
What is Hotjar good for?
Hotjar is excellent for understanding how users interact with your website. It’s ideal for visualizing user behavior with heatmaps, capturing detailed session recordings, gathering user feedback through surveys and polls, and identifying areas for improvement to enhance user experience.
Does Google Analytics analyze Google ads?
Yes, Google Analytics can analyze Google Ads. By linking your Google Ads account with Google Analytics, you can track the performance of your ads, see how users interact with your website after clicking on an ad, and gain insights into conversion rates and user behavior.
Mohamed oversees operations and finance at FullSession and has contributed to the company’s UX analytics knowledge base.