
Product analytics tools help teams understand how users move through a product, which features drive adoption, where users drop off, and what changes improve activation, retention, and conversion.
But ‘best’ depends on your use case. Some product analytics platforms are strongest for event tracking and funnel analysis. Others are better for session replay, heatmaps, onboarding friction, in-app guidance, or customer success visibility.
In this guide, we compare the best product analytics tools in 2026 by use case, strengths, limitations, and team fit so you can choose the right software for product, growth, UX, or customer success.
Short answer: The best product analytics tools in 2026 include FullSession, Mixpanel, Amplitude, Pendo, Heap, Fullstory, PostHog, and Gainsight. The right choice depends on whether you need event-based analytics, behavioral diagnostics, feature adoption insight, or account-level product usage visibility.
Best product analytics tools at a glance
- FullSession — best for UX friction and journey diagnostics
- Mixpanel — best for event analytics and funnels
- Amplitude — best for advanced product analysis
- Pendo — best for feature adoption and in-app guidance
- Heap — best for fast setup and auto-capture

Image source: Freepik
What Are Product Analytics Tools?
Product analytics tools are software platforms that help teams measure how users interact with a product, website, or app. They track behaviors such as feature usage, funnel progression, retention, drop-off points, and conversion events so teams can improve onboarding, adoption, and user experience.
The strongest product analytics platforms do more than report numbers. They combine quantitative data such as events, funnels, and cohorts with behavioral context from user behavior tools such as session replay, heatmaps, and feedback. That helps teams understand both what happened and why it happened.
What Data Do Product Analytics Tools Collect?
Most product analytics tools collect five core types of data:
Event data
This tracks key actions such as signups, clicks, feature usage, purchases, and upgrades.
Funnel and conversion data
This shows where users move forward, where they abandon, and which steps create friction.
Retention and adoption data
This helps teams see whether users return, adopt core features, and reach activation milestones.
Session and behavior data
Tools with session replay and heatmaps show how users actually behave, including hesitation, repeated clicks, and navigation confusion.
Feedback and sentiment data
Some platforms also collect in-product feedback, survey responses, or qualitative signals that explain why a user struggled or dropped off.

Image source: Pixbay
How Do Companies Use Product Analytics Tools?
By tapping into product analytics, you can unlock valuable insights that inform your strategy. It’s about more than just tracking sales or identifying leads. It’s about using data to optimize every aspect of your business.
Imagine having the competitive edge you need to surge ahead in your industry. It starts with using these tools to maximum effect – and that’s exactly what the most successful businesses do.
Measuring Product Performance
What if you had a dashboard that not only tracks every sale but slices and dices the data to show you who your buyers are, where they come from, and what exactly they’re buying?
Product analytics tools allow you to monitor these metrics in real time and let you see which products are flying off the shelves and which might need a marketing boost.
Identifying Potential Customers
With product analytics, you’re not just seeing who’s buying. You’re discovering who could be buying. Identify customer lukewarmth with tools that pinpoint interested users who are still on the fence about making a purchase.
Armed with this information, you can craft targeted offers or campaigns that convert these on-the-fencers into loyal customers.
Measuring Marketing Effectiveness
What’s the ROI of your latest marketing campaign? Product analytics tools take the guesswork out of this equation.
Your users are telling you something – are you listening? By analyzing their behavior and engagement, you’ll pinpoint what’s working and what needs a tune-up. In turn, you can make sure that every dollar you spend is an investment towards greater returns.
Tracking Internal Performance
Beyond external metrics, product analytics can turn the microscope inward to analyze your product’s internal health.
From feature usage to load times, these insights help you understand the user journey on a granular level, allowing you to make precise improvements that improve the overall user experience.
Finding Problems
Before small issues become big headaches, product analytics tools flag anomalies and trends that could indicate problems. Whether it’s a sudden drop in user engagement or a glitch in the checkout process, you’ll have the data you need to intervene swiftly and effectively.
Look at all the ways product analytics tools can be applied, and it’s no surprise they offer so many benefits. The most critical ones are up next.
Benefits of Product Analytics Tools
- Better product decisions based on real user behavior
- Faster identification of friction, bugs, and conversion blockers
- Clearer visibility into onboarding, adoption, and retention
- Stronger alignment between product, UX, growth, and customer success teams
- More confident prioritization of product improvements
- Better customer experience through evidence-based optimization
Features to Look For in Product Analytics Platforms
When you’re on the hunt for a top-notch product analytics tool, there are a few key features you definitely want to keep an eye out for:
- User segmentation: This lets you break down data by specific groups, like age, location, or behavior. It’s super handy for tailoring your strategies to different audiences and seeing who loves your product the most (or least!).
- Event tracking and interactive event analysis: You’ll want a tool that can track specific actions users take, like signing up, clicking a button, or making a purchase.
- Funnel analysis: Check if the tool can analyze how users move through a set process, like making a purchase or signing up.
- Real-time data: In the fast-moving world of tech, old news is no news. A tool that updates data in real-time helps you make quick decisions and stay ahead of the curve.
- Heatmaps and session replays: Seeing exactly where users click, scroll, and spend their time on your page can be a goldmine.
- Integration capabilities: Your product analytics tool should integrate seamlessly with other software you’re using. Seamless integration means less hassle and more powerful insights when data from different sources interact.
- Customizable dashboards: Because one-size-fits-all rarely fits anyone! Being able to tweak your dashboard to show the metrics you care about most makes your life a lot easier.

Image source: Freepik
Best product analytics tools in 2026
Picture this: you have a product that users love, and you’re able to make data-driven decisions that propel growth. It all starts with picking the perfect analytics tool that translates user behavior into actionable insights.
Below, we’ve rounded up five stellar product analytics tools that are worth your attention.
1. FullSession
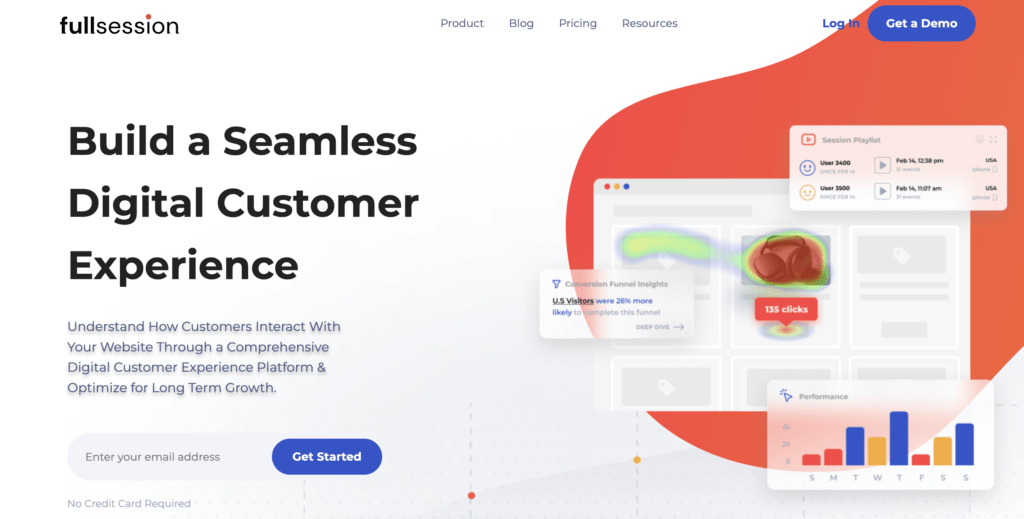
FullSession is more than just a behavior analytics tool—it’s your gateway to really understanding what makes your users tick. With FullSession, you can dive deep into customer sessions and capture every click, scroll, and interaction.
Forget about simply gathering data; what you really need are specific, actionable clues that reveal exactly where users are hitting roadblocks or feeling the thrill of success.
By applying these insights, you’ll craft a product that genuinely resonates with users, fostering a deeper connection and fueling a loyal following. And the best part?
FullSession does all this heavy lifting in the background and makes sure that your website’s performance remains smooth and speedy.
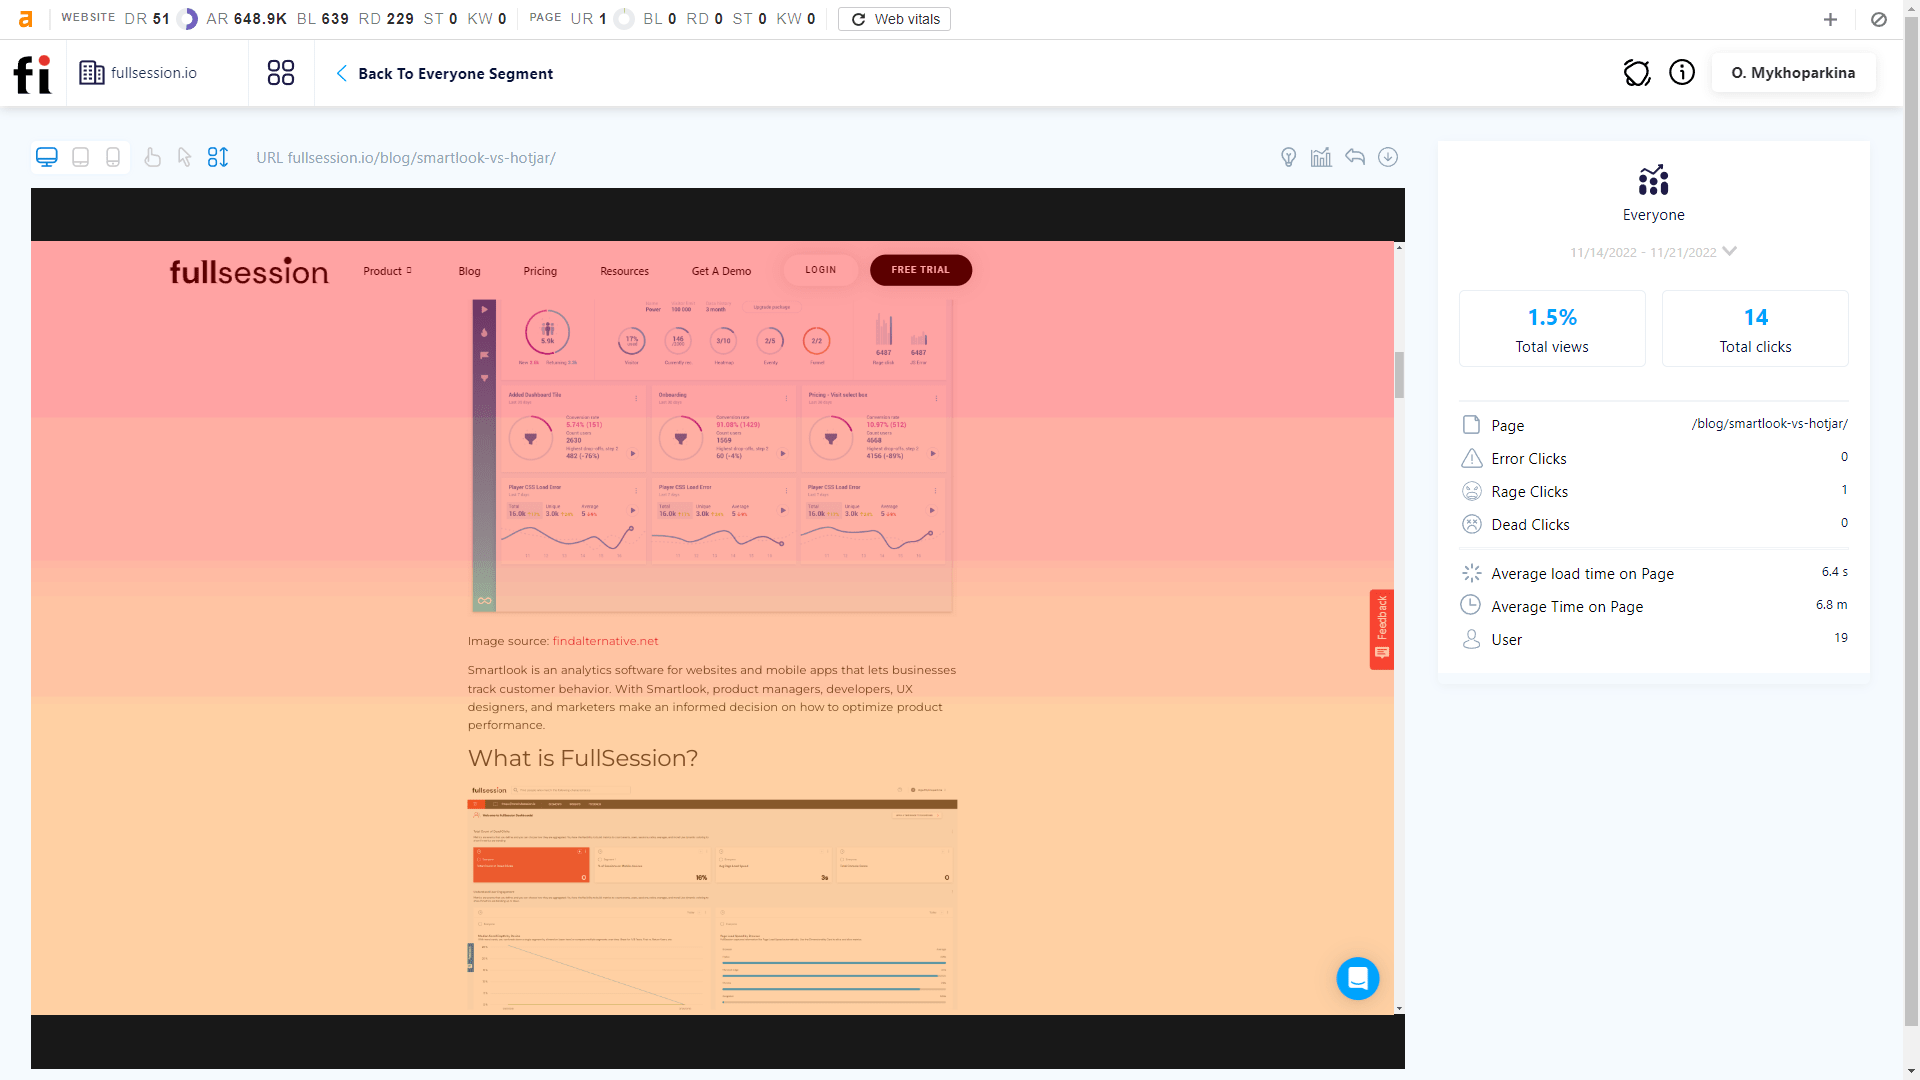
Session Replay
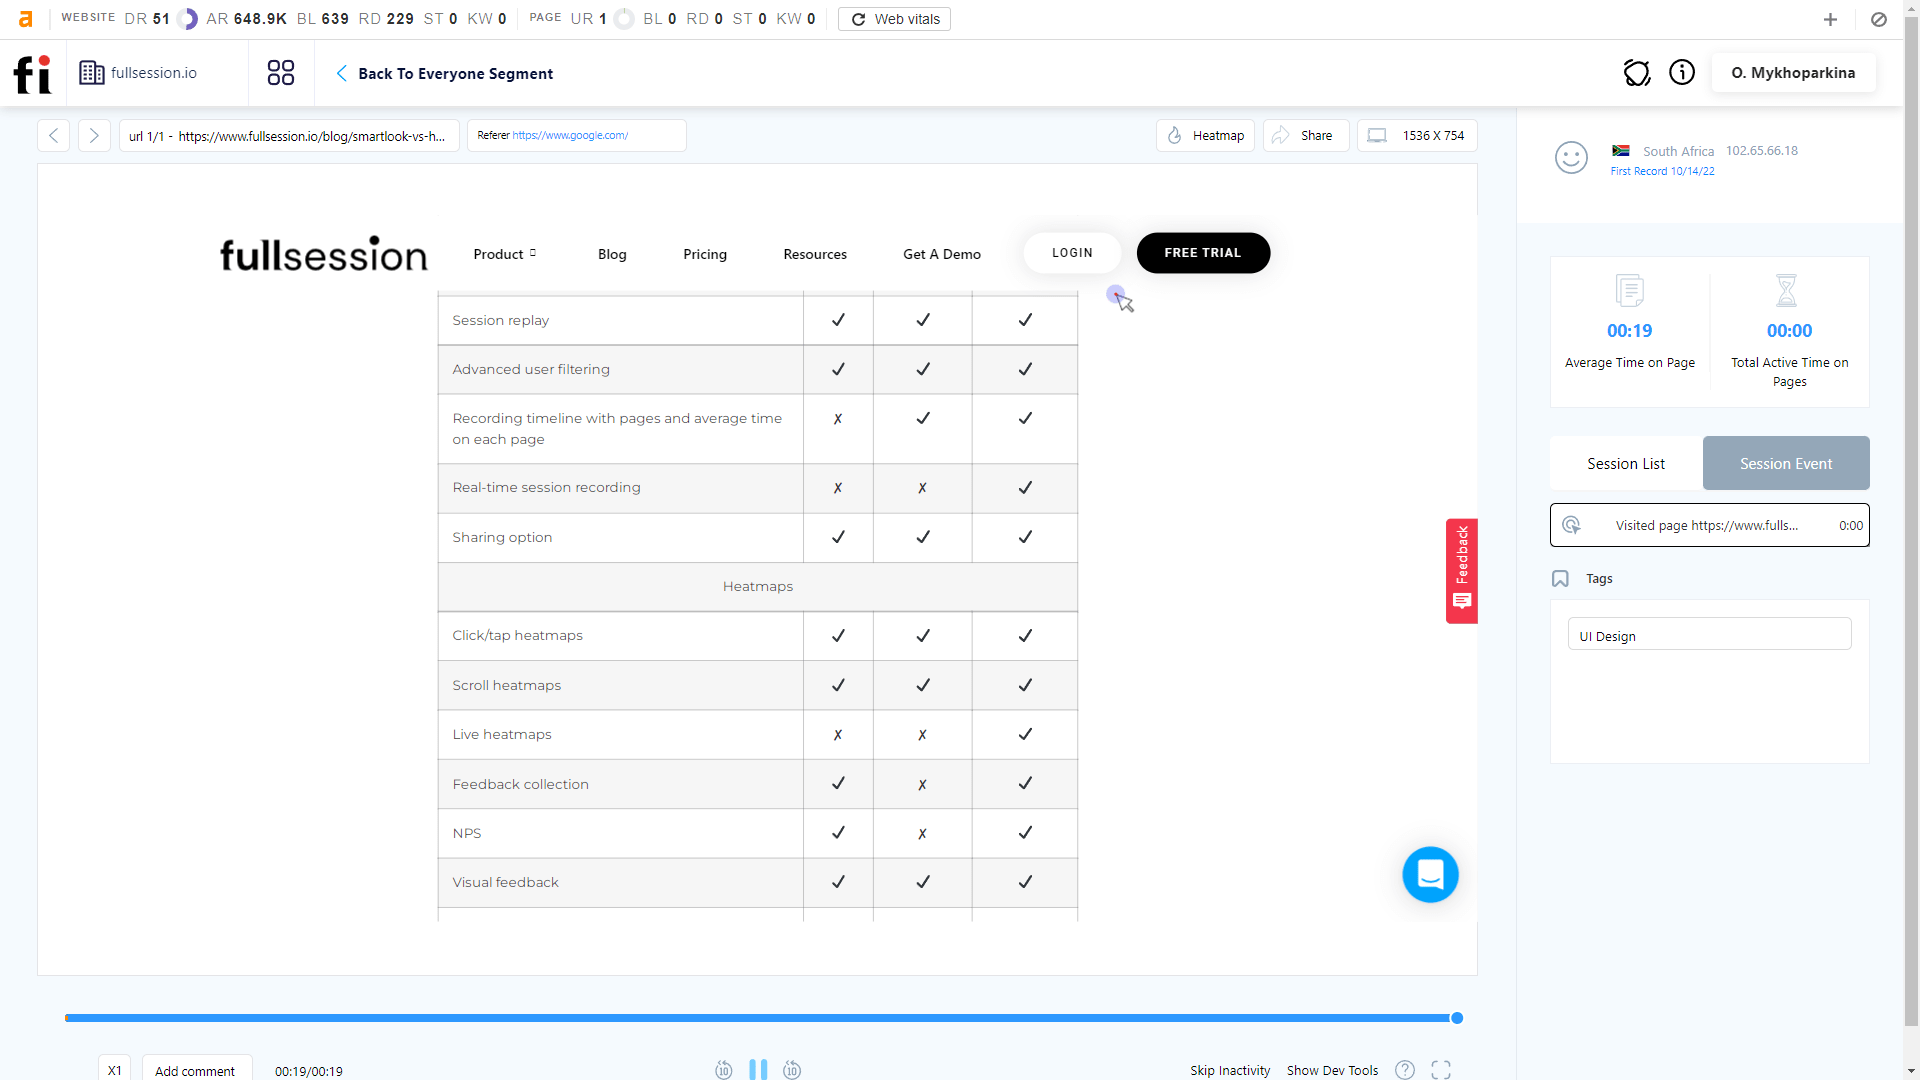
FullSession equips you with powerful session recording tools that let you observe how users engage with your website. Pull back the curtain on customer motivations: what captivates, what repels? Isolate the difficulties impeding your product’s progress, and devise a corrective course to reinvigorate its development.
Total clarity means saying goodbye to endless tweaks and hello to a webpage that truly represents you. Trim the fat, power up your message, and watch your audience respond.
Pro tip: You can monitor user activity in days, weeks, months, or even years. You can watch entire sessions, skip periods of inactivity, pause, fast forward, and rewind each session recording.
FullSession Session Recording and Replay Data
- User locations and IP addresses
- Visited URLs
- Visit sources
- Session list
- The session event data
- Screen resolutions
- Average time on page
- Total active time on pages
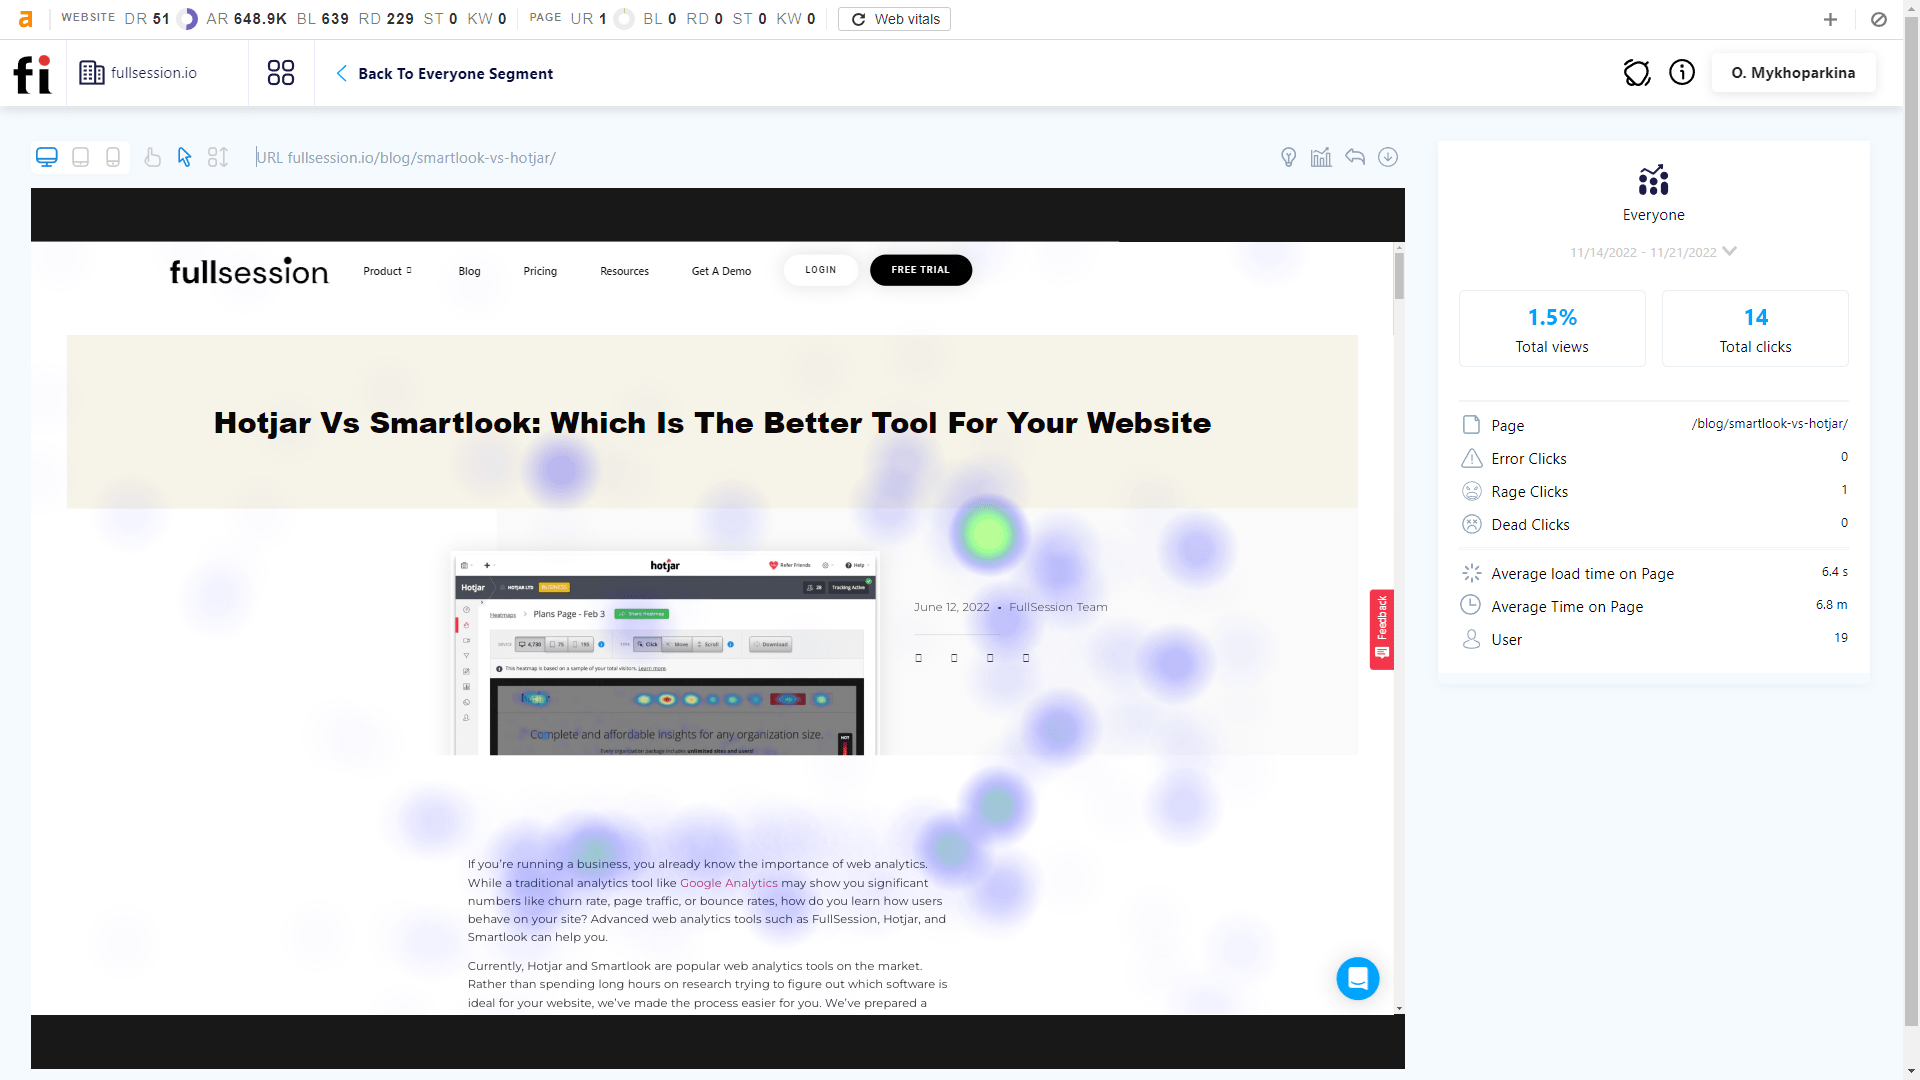
Interactive Heatmaps
If you’re keen on getting a deeper understanding of how users interact with your site, FullSession’s interactive heatmaps are just what you need. With tools that track cursor movements, clicks, and scrolling behavior, you can literally see the hotspots where users are most engaged and the cold spots where they’re not.
What’s crucial here is recognizing the exact spots where users struggle or get bored and making adjustments to get them back on track. Product interactions can make or break the user experience.
By digging into these interactions, you’ll uncover tangible ways to upgrade your product’s functionality and charm, essentially marrying form and function in a way that users will love.
Ready to see these tools in action? Explore these examples of FullSession’s interactive heatmaps in action, and see how they can help take your site to the next level.
Click maps
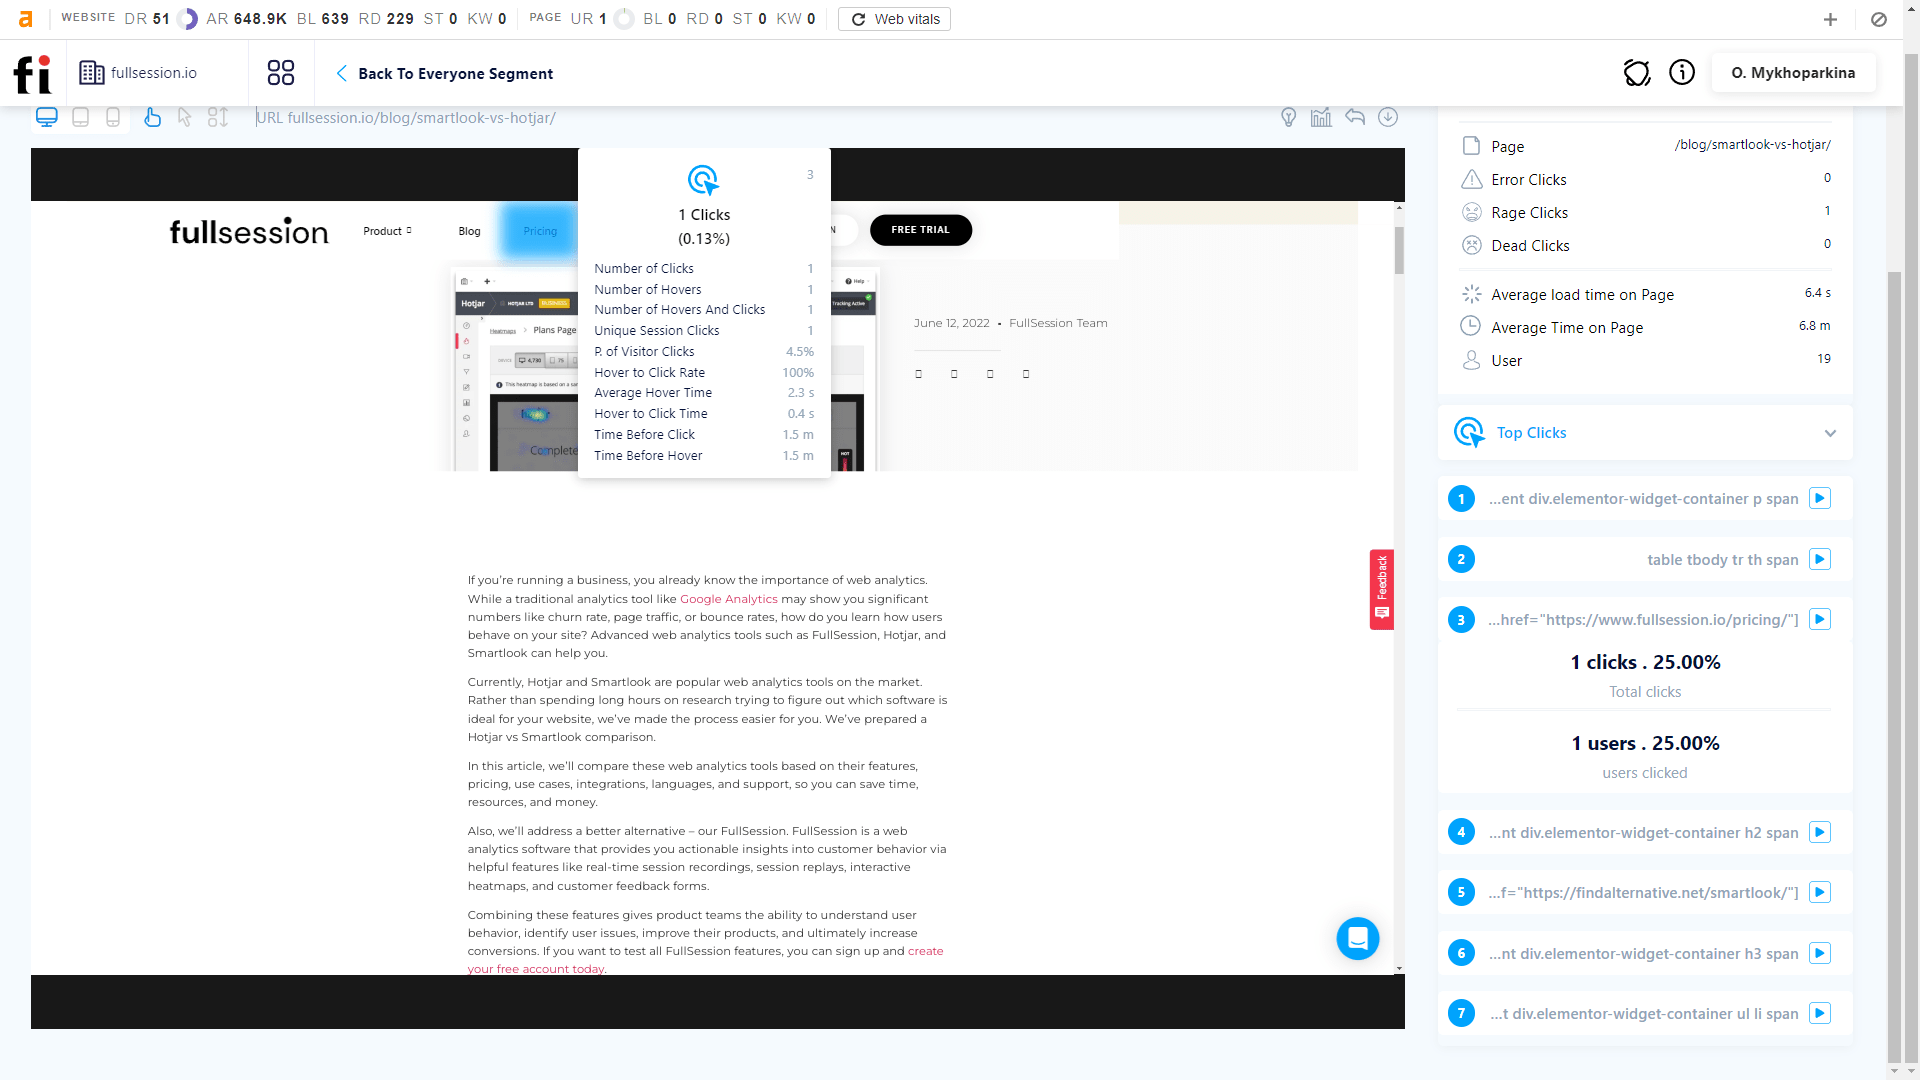
As the name suggests, click maps let you see what elements people click on the most on your web pages. Click tracking allows you to see what draws their attention.
Mouse movement maps
By mapping out cursor movements, you can see where users spend the most time and identify areas that may be causing confusion or frustration. An easy-to-navigate and understand website builds loyalty and trust, and this information is the first step in making that happen.
If you notice that users spend much time figuring out how to use a particular feature, you can make changes to make it more intuitive. Or, if you see users getting frustrated with a specific process, you can streamline it to make it more efficient.
Scroll maps
A scroll map represents how far users scroll down a page. It allows you to see which areas of the page are most popular and where users are most likely to scroll to.
You can use this information to place essential messages (such as a Call to Action) in the perfect spot. Scroll maps are handy for long pages, such as articles or product listings.
Customer Feedback Tools
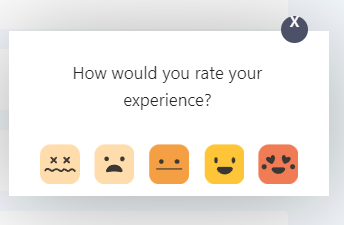
Customer feedback tools are your secret weapon in the quest to truly understand what your customers think and feel about your product—no need to shell out for pricey specialized NPS software.
What if you could finally get straight answers from your customers? A simple feedback form can be your ticket to a deeper understanding of what makes them tick. But why stop at forms?
Pair these insights with session recordings to watch your users in action. This dynamic duo of feedback and visual playback lets you dive deep into the customer experience, seeing firsthand where they thrive and where they struggle.
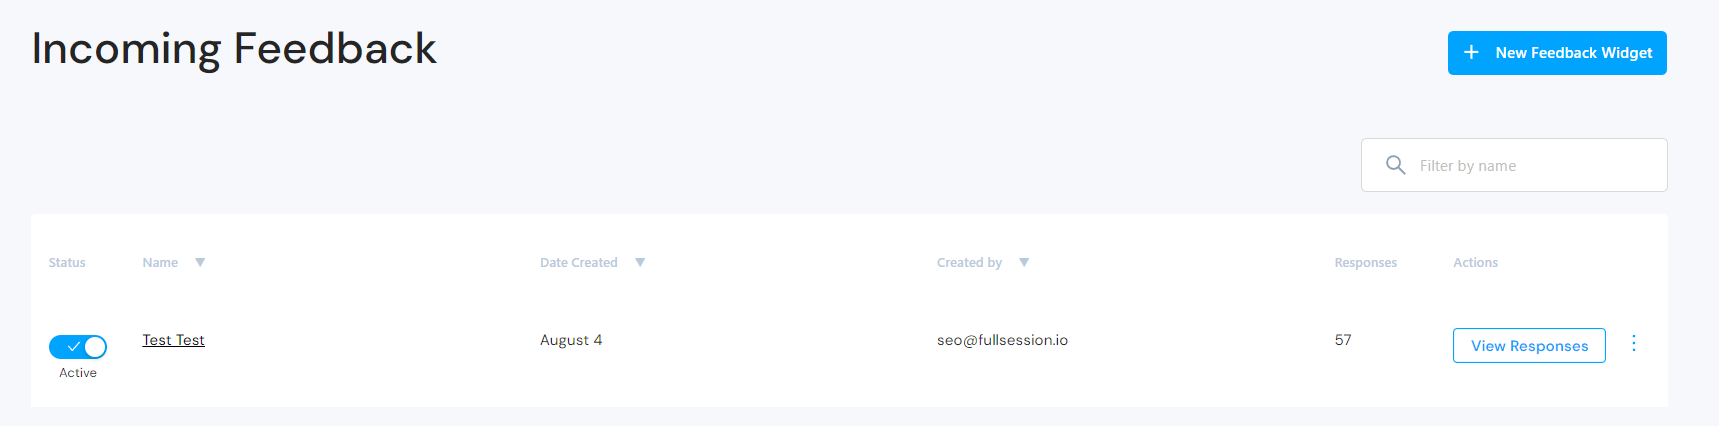
You can see all customer feedback on our dashboard, which makes tracking trends over time easy. The page offers various details, such as:
- Author’s identity
- Form’s name
- Creation date
- The number of responses
- Activity status
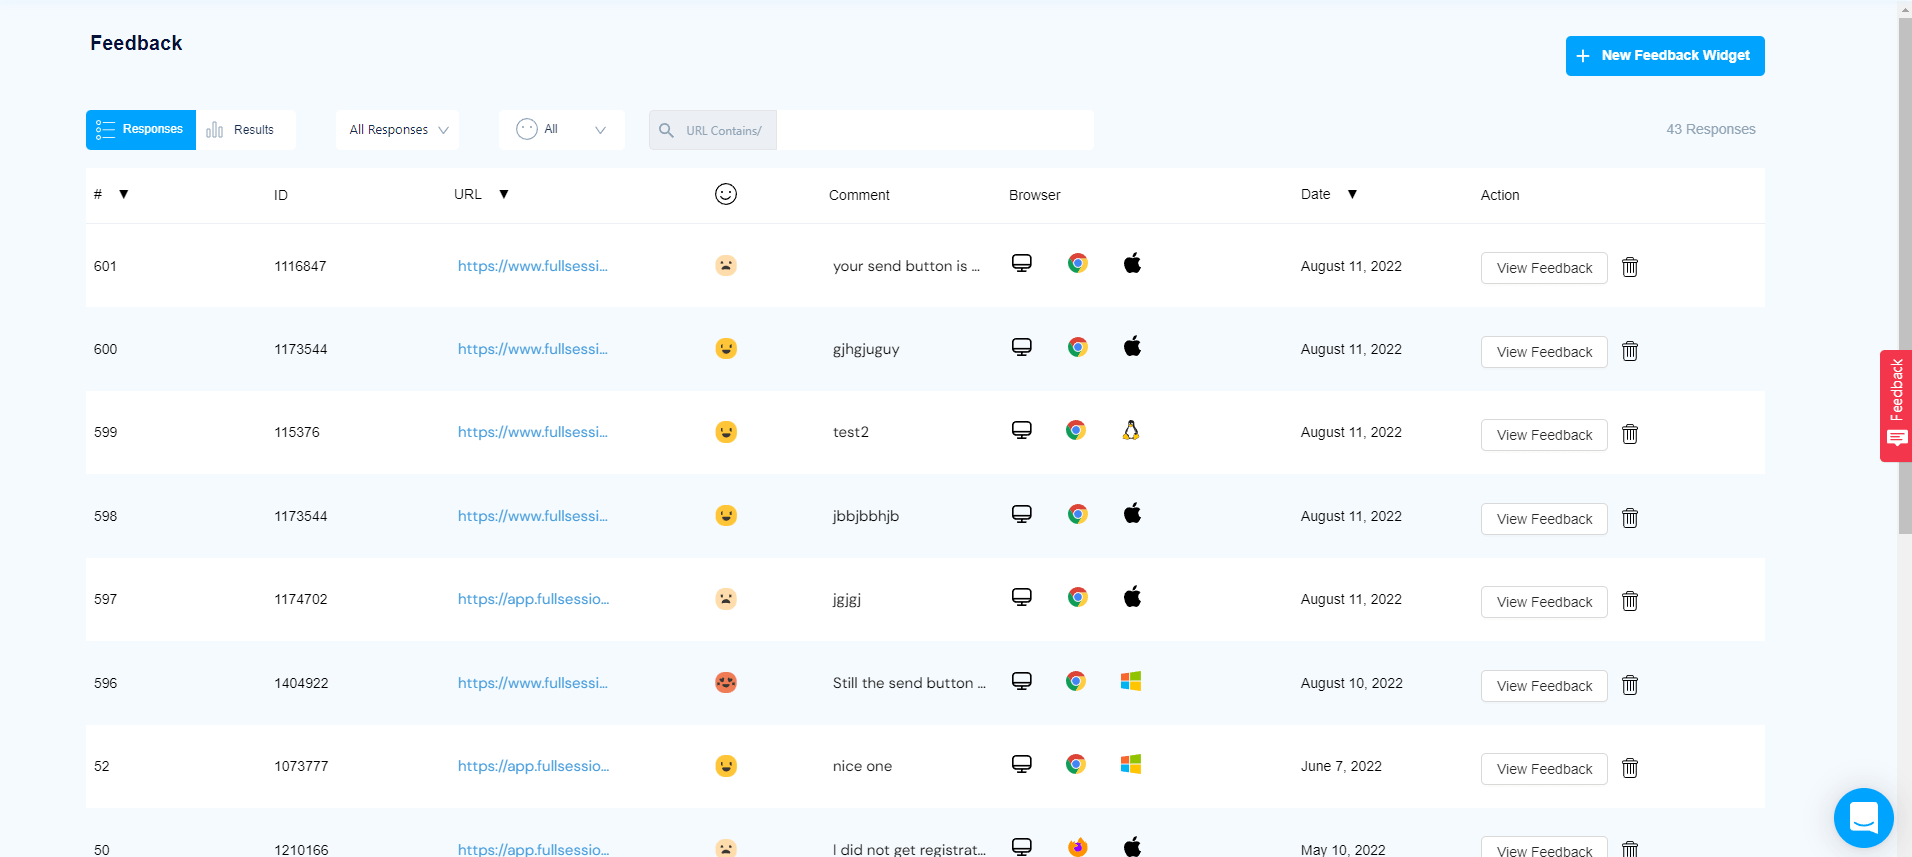
When monitoring your customer feedback forms, you’ll access even more details:
- Form’s ID
- URL
- Date
- User comments and individual feedback
- User sentiment (rating)
- Browser used
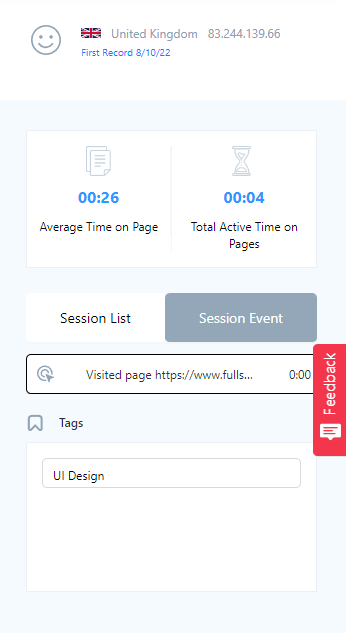
FullSession offers powerful segmentation and filtering features. You can find what you want to see during specific sessions with ease.
FullSession also offers a metrics page you can use to see website details, including
- % of sessions on mobile devices
- The number of dead clicks and error clicks
- Average page load speeds
- Median scroll depth
- Console errors
FullSession also helps with in-team and cross-team cooperation. You can leave notes to share information with other people.
You can use our platform to track conversion rates and other conversion-related data: % of converted users, time to convert, and more.
2. Auryc
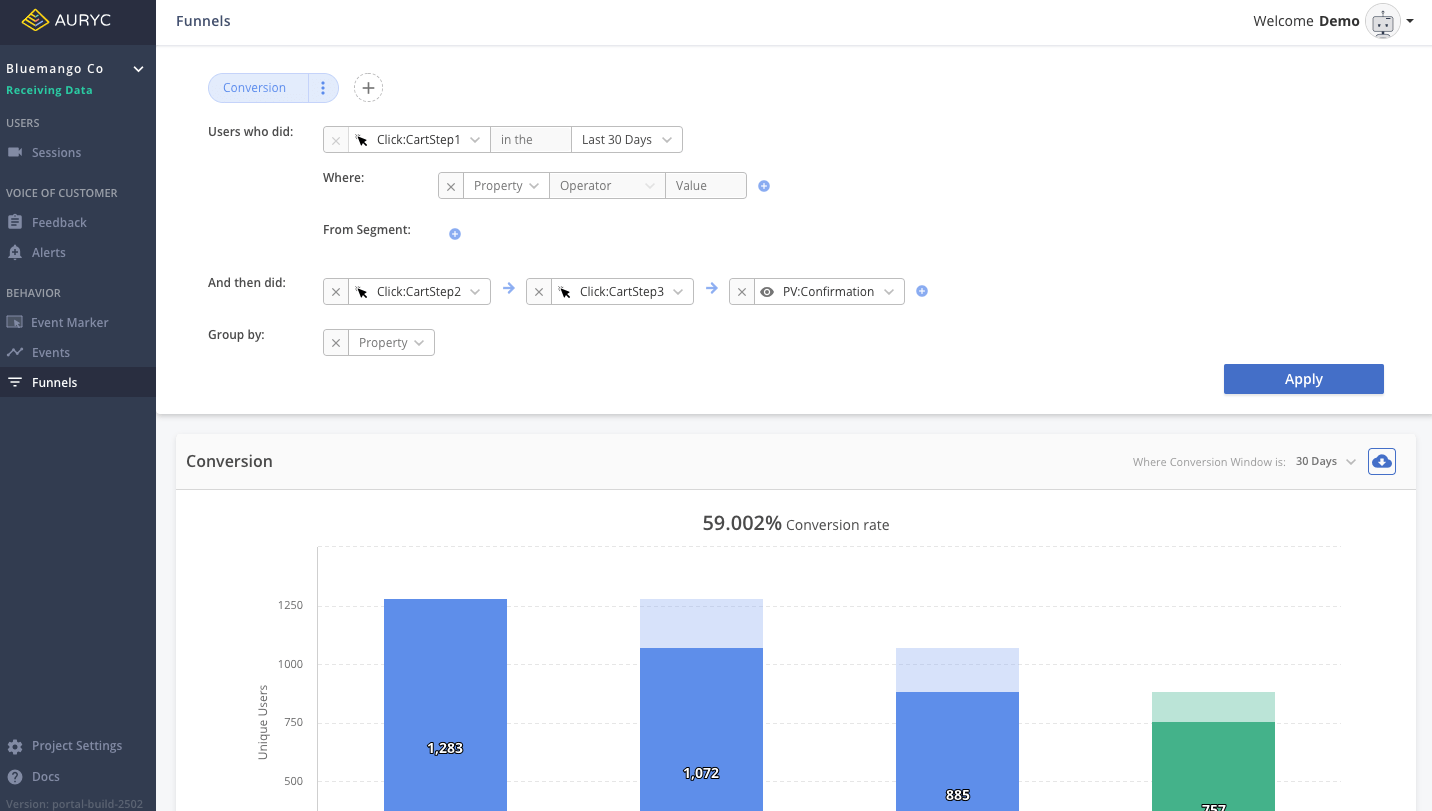
Image source: G2
From the moment users land on your site or launch your app, Auryc is there, capturing every click, swipe, and tap to help you build a richer, more intuitive experience. This powerful tool shows you exactly how users interact with your site.
With features like visual session replays, journey mapping, and super-clear heatmaps, you get the whole story of user experience.
What’s really great about Auryc is how it handles feedback. You can pop surveys and feedback forms right into the user flow, catching folks exactly when they’re most engaged. On the spot, you’ll receive informed feedback that enables data-driven refinements.
Who Uses It?
Various specialists can use Auryc: customer support teams, UX designers, marketers, product teams, finance, operations, and IT departments.
Features
- Session replay: Watch user sessions to see how users navigate your site.
- Voice of customer: Gather valuable feedback directly from customers using integrated feedback tools.
- Event marker: Analyze data on specific events retroactively to understand user actions better.
- Heatmaps: Track where users click, move, and scroll to see what captures their attention.
- Insights: Access advanced analytics and dynamic reporting for deeper understanding.
- Mobile app analytics: Utilize Auryc’s capabilities on mobile applications for consistent analysis across platforms.
- Smart funnels: Analyze and optimize your funnel to improve conversion rates.
- Smart path analysis: Track and understand user flows to enhance navigation paths.
- Reports: Create detailede-commerce and B2B reports to inform business decisions.
Pros
- Provides various kinds of data
- You can use it on mobile devices
Cons
- Videos can be memory-intensive
- Some users complain about the maturity of some of the features
3. Indicative
Image source: G2
With Indicative, the mystery of customer behavior dissolves, and you’re left with actionable ideas that show you care about the people behind the numbers.
This platform makes customer behavior analysis accessible to anyone, regardless of technical expertise – no SQL knowledge required.
Who Uses It?
Indicative is a tool for product managers, marketers, and data analysts.
Features
- Customer journey analysis: Delve into the paths your customers take, uncovering insights that can lead to more effective marketing and product decisions.
- Cohort analysis: Segment users based on behaviors and track how these groups evolve over time.
- Behavioral targeting: Personalize experiences based on user actions to increase engagement and conversion rates.
- Multi-path analysis: View and analyze the many different paths users might take within your app or site, helping to identify the most critical areas for improvement.
- Integration simplicity: Easily connect with existing data sources for seamless data synchronization and analysis.
- User segmentation: Create dynamic user segments based on real-time behavior to target with more personalized campaigns.
- Event tracking: Capture and analyze specific user actions to see what drives user engagement and retention.
Pros
- Users don’t need to know SQL to operate Indicative
- Offers in-depth insights into the paths customers take
- Features an intuitive dashboard that simplifies complex data analysis
Cons
- Some users may find the customization options for reports and dashboards limited compared to other more flexible platforms
- While providing significant value, the pricing can be a barrier for smaller companies or startups
- The sheer volume of data available can be overwhelming for users who are not used to working with complex analytics tools
4. Pendo
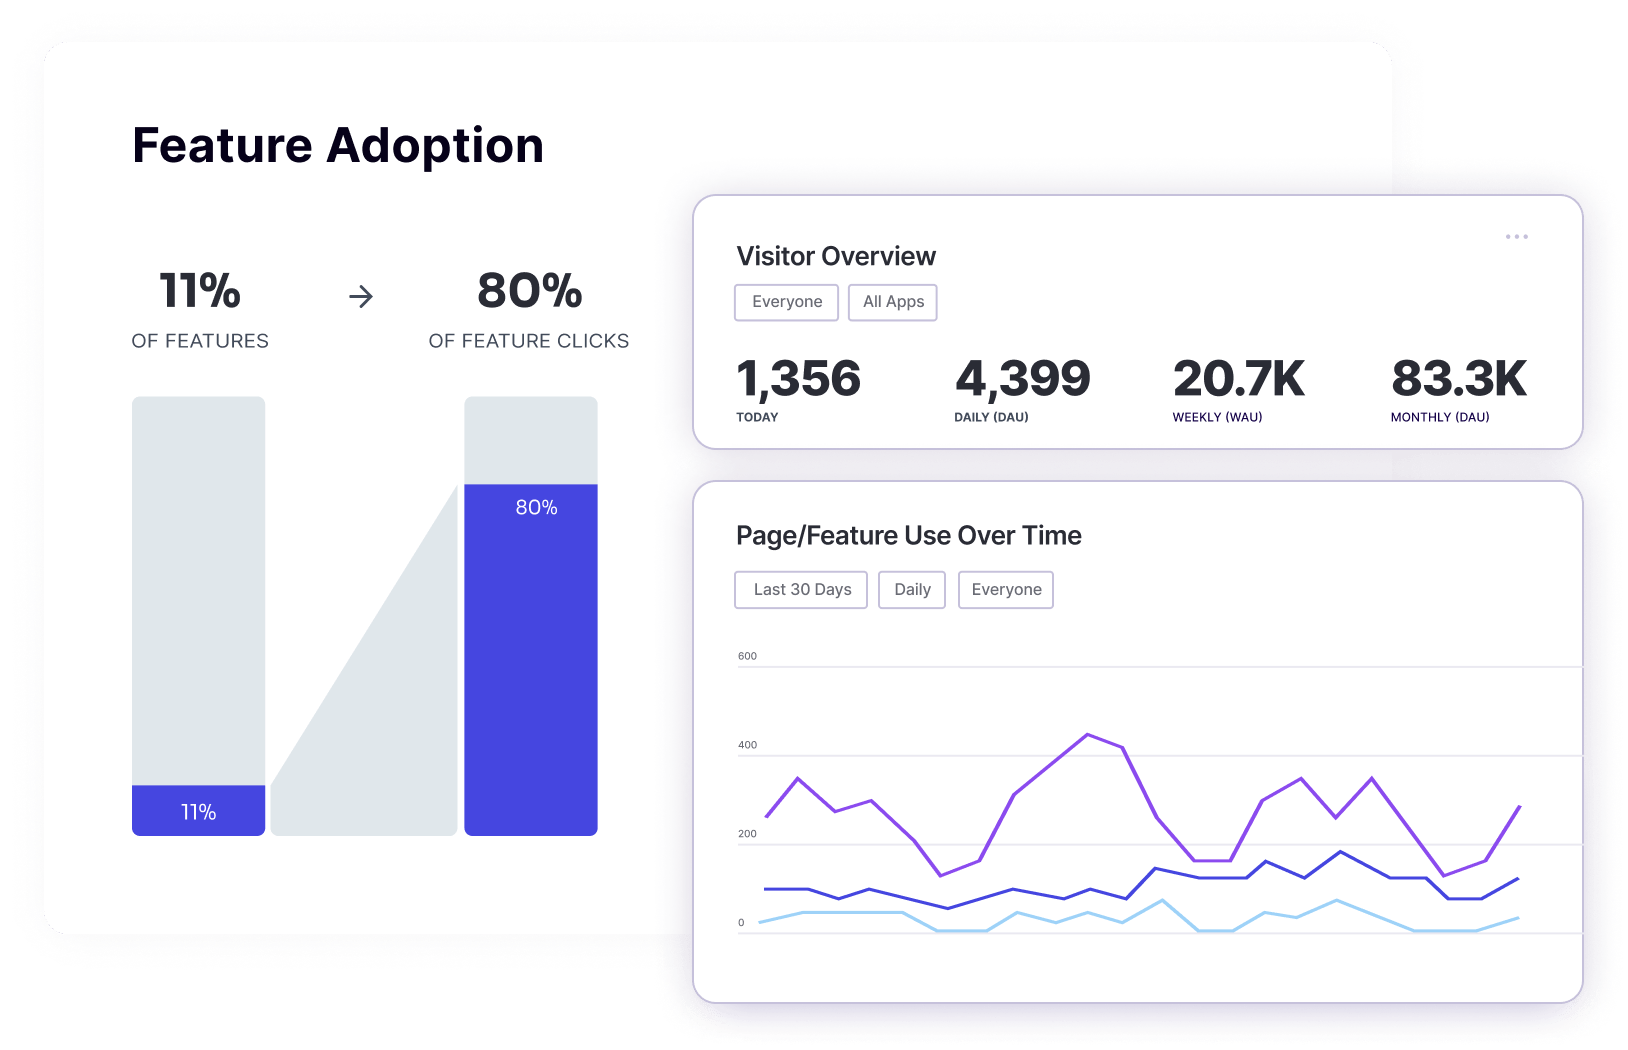
Image source: G2
What if you could pinpoint exactly what makes your users happy (or frustrated)? Pendo’s digital experience intelligence tool is designed to listen in on their thoughts, behaviors, and habits, so you can refine your product to their exact needs.
There are, in fact, two tools–Pendo Engage and Pendo Adopt–but they form one comprehensive solution.
Who Uses It?
Pendo can be used by many specialists, such as marketers, product managers, UX researchers, web designers, and others.
Features
- Analytics: Gain insights into feature adoption and user behavior to better understand engagement and improve user interaction.
- In-app guides: Assist users directly within your application to enhance their experience and your communication.
- Roadmapping: Strategically plan and visualize product development paths to align with business goals.
- Mobile support: Extend functionality to mobile websites and apps, ensuring a consistent user experience across all platforms.
- Voice of the Customer: Gather and analyze customer feedback to refine products and services in alignment with user needs.
Pros
- Roadmaps help guide the product in the right direction
- Supports mobile devices
Cons
- Some users complain about limited data visualization
- Some reviews mention bad web performance, which impacts user experience
- Expensive for what it does
- It could be more intuitive
5. GainInsight
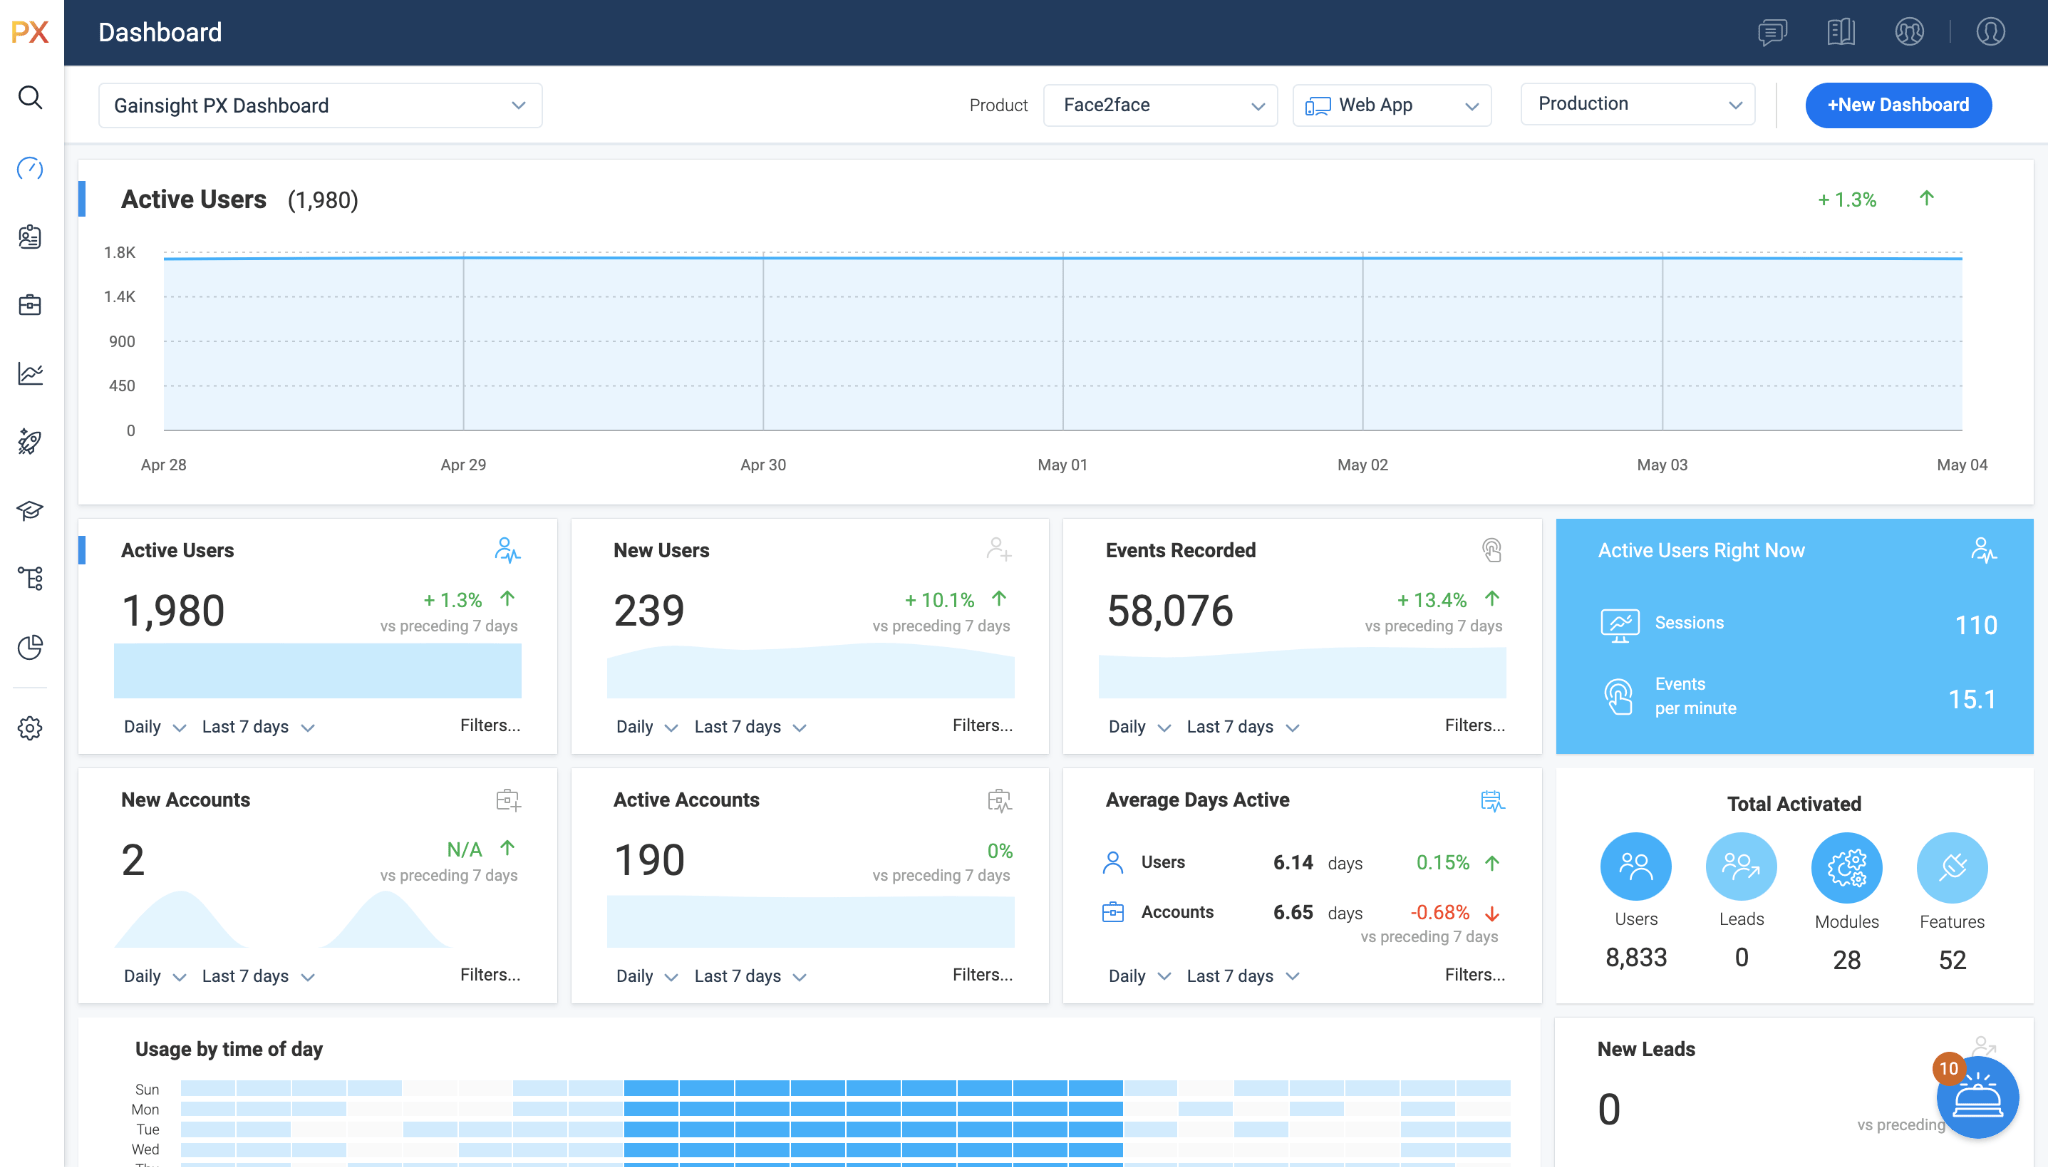
Image source: TrustRadius
Ever wonder what your users are really doing when they use your product? GainInsight is here to fill in the blanks, giving you a clear picture of their interactions.
Think of the platform as a three-legged stool, and each leg plays a vital role. Success hinges on three things: championing customer causes, spinning inspiring experiences, and harboring authentic, nose-to-the-grindstone familiarity.
Who Uses It?
GainInsight is for product teams, customer experience specialists, sales operatives, IT departments, community teams, and executives.
Features
- Advanced product analytics: Discover growth opportunities and delve into user paths and funnels to optimize user journeys.
- Native omnichannel engagement: Set up and customize in-app engagements, including onboarding checklists, to enhance user interaction across platforms.
- Closed-loop feedback: Deploy in-app surveys to collect extensive feedback, allowing for scalable and direct user insights.
- Product communication: Maintain an open line of communication with users, keeping them updated and engaged with your product developments.
- Horizon analytics: Monitor and analyze long-term trends with comprehensive data visualizations on dashboards.
- Success planning: Utilize GainInsight to refine and improve your product’s effectiveness and market fit.
Pros
- You can use it with SaaS services, desktop, and mobile devices
- Comprehensive and robust tool that lets you collect various kinds of data
Cons
- May have a complex setup process
- The depth of product analytics data can be overwhelming, especially for users who are not data-savvy
- Maintaining and making the most out of GainInsight can require substantial ongoing time and effort from your team
Product analytics tools comparison table
Use this table to compare each platform by core strength and team fit.
| Tool | Best for | Key strength | Watch-out |
|---|---|---|---|
| FullSession | UX, CRO, onboarding analysis | Replay, heatmaps, friction analysis | Less event-first |
| Mixpanel | Product and growth teams | Event tracking, funnels, retention | Requires clean event strategy |
| Amplitude | Mature product teams | Journey analysis, feature adoption | More advanced learning curve |
| Pendo | Adoption and in-app guidance | Guides, analytics, feedback | Pricing and complexity |
| Heap | Easier setup | Auto-capture and retroactive analysis | Governance can get messy |
Which product analytics tool should you choose?
The right product analytics tool depends on what your team needs to understand most.
- Choose FullSession if you need to see where users struggle, abandon, or experience friction across key journeys.
- Choose Mixpanel or Amplitude if your main priority is event-based product analytics, retention, and product growth reporting. If Amplitude feels too advanced, costly, or limited for teams that also need behavioral context, compare these Amplitude alternatives before making a final decision.
- Choose Pendo if you want analytics plus in-app guidance and adoption support. If pricing, setup complexity, or behavioral visibility are concerns, compare Pendo competitors before shortlisting a platform.
- Choose Heap if easier setup and auto-capture matter most.
For teams that care about user behavior, onboarding friction, conversion blockers, and experience-led optimization, FullSession is the strongest fit.
Want to evaluate FullSession?
If FullSession looks like the right fit for your team, review the latest pricing and plan details on the pricing page or book a demo for a guided walkthrough.
Start evaluating your product analytics stack
Before choosing a platform, define your main use case, shortlist the tools that fit your team, and compare them based on analytics depth, usability, implementation effort, and behavioral visibility.
FAQs About Product Analytics Tools
What are product analytics tools?
Product analytics tools help teams measure how users interact with a website, app, or digital product. They track feature use, funnels, retention, and friction so teams can improve onboarding, conversion, and adoption.
What is the difference between product analytics and web analytics?
Web analytics focuses more on traffic and acquisition. Product analytics focuses more on behavior inside the product, including activation, feature adoption, retention, and journey progression.
Which product analytics tool is best for startups?
For many startups, PostHog, Mixpanel, or Heap are strong starting points depending on technical comfort, event maturity, and speed-to-value needs. PostHog is often attractive for product-led teams, while Heap can reduce setup burden and Mixpanel is strong for event-first analysis.
Which product analytics tool is best for UX teams?
UX and conversion-focused teams usually benefit most from tools with session replay, heatmaps, and friction analysis. FullSession and Fullstory are often better fits than event-only platforms for this use case.
Which product analytics tool is best for feature adoption?
Pendo is a strong option when the goal is to measure feature adoption and improve it through in-app guides, onboarding, and product messaging.
Which product analytics tools are easiest to implement?
Tools such as Heap are often chosen for faster setup because they reduce the need to define every tracked event upfront.
Do you need both event analytics and session replay?
Often, yes. Event analytics tells you what happened at scale. Session replay helps explain why users struggled or dropped off.
What should you look for in product usage analytics software?
Look for event tracking, funnels, retention, segmentation, implementation fit, pricing logic, and if relevant session replay, heatmaps, in-app guidance, or account-level usage visibility.

Roman Mohren is CEO of FullSession, a privacy-first UX analytics platform offering session replay, interactive heatmaps, conversion funnels, error insights, and in-app feedback. He directly leads Product, Sales, and Customer Success, owning the full customer journey from first touch to long-term outcomes. With 25+ years in B2B SaaS, spanning venture- and PE-backed startups, public software companies, and his own ventures, Roman has built and scaled revenue teams, designed go-to-market systems, and led organizations through every growth stage from first dollar to eight-figure ARR. He writes from hands-on operator experience about UX diagnosis, conversion optimization, user onboarding, and turning behavioral data into measurable business impact.