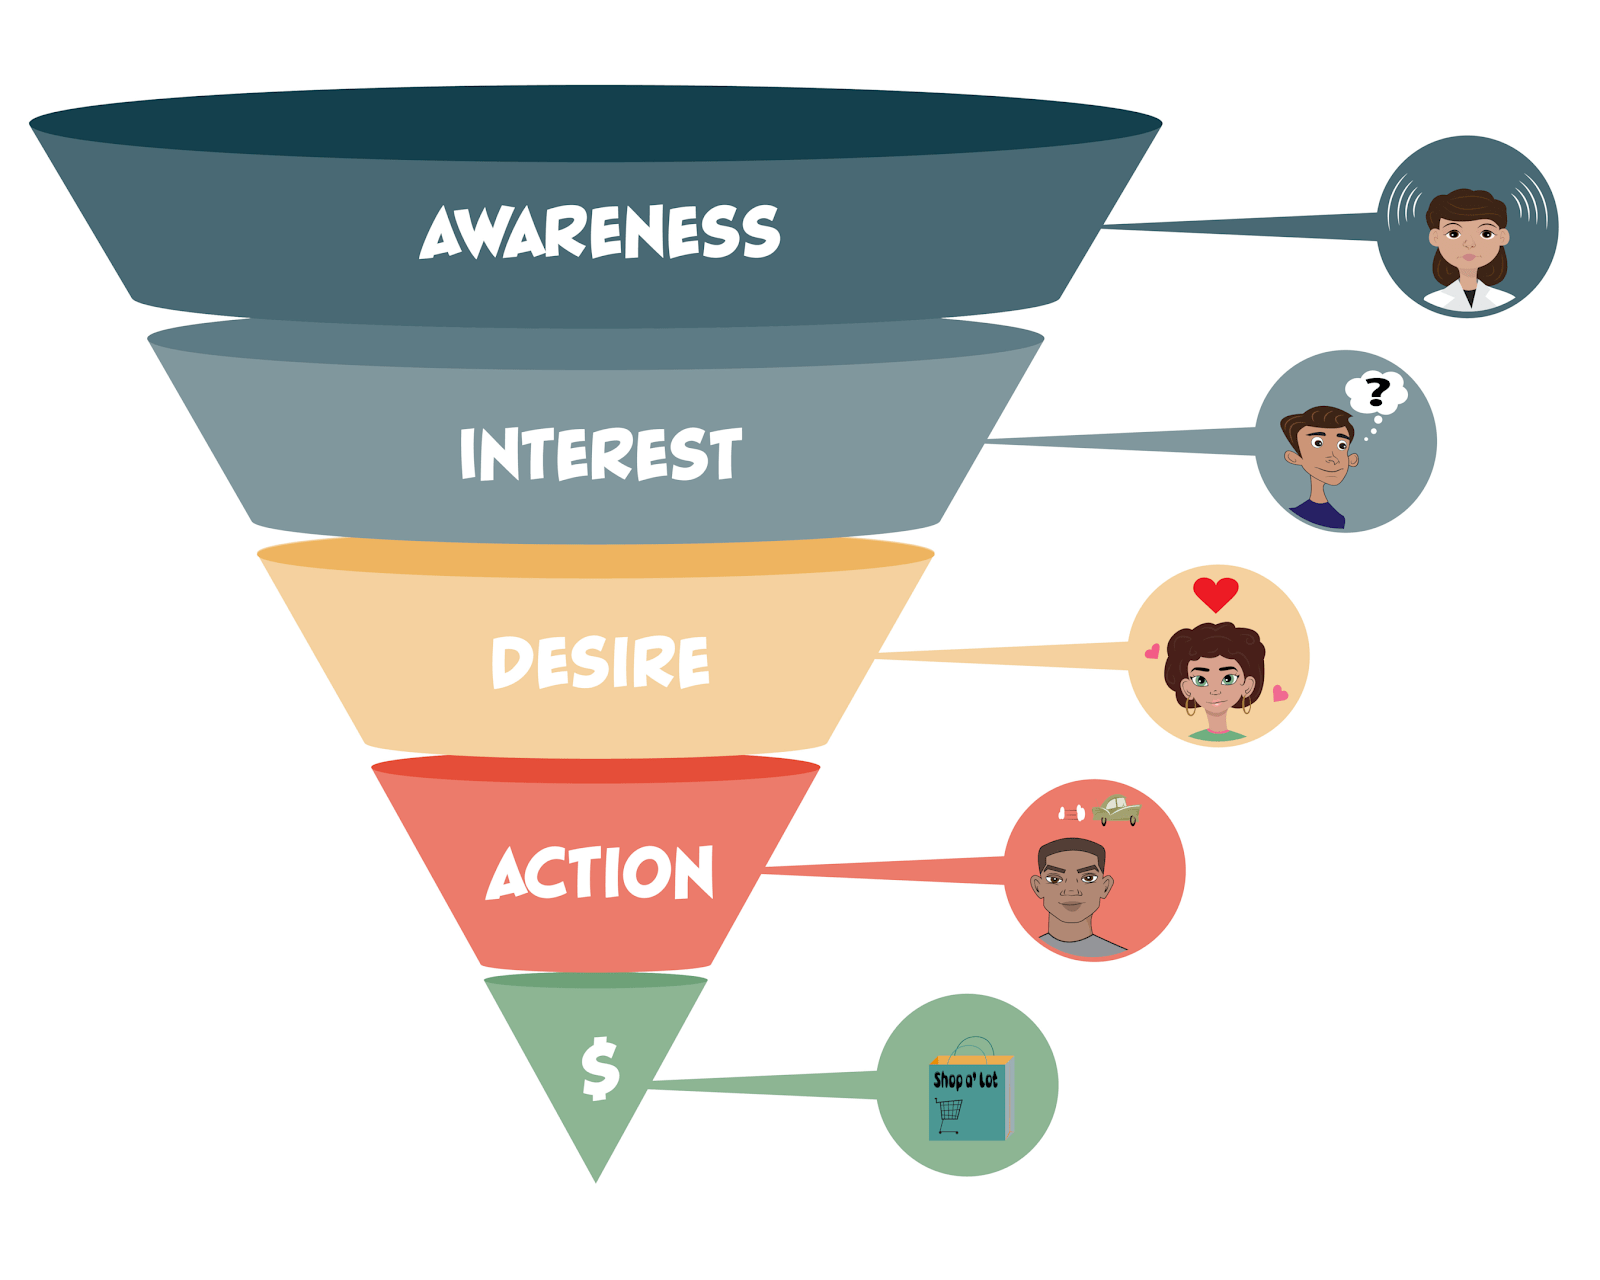
A retained user is someone you’ve satisfied so much that they keep coming back to your brand. In the same vein, a high user retention rate indicates a great number of satisfied customers and good customer loyalty.
However, it can take a while to reach that level of user retention that all businesses want. First things first, you have to measure how many users are actively using your product or service.
Let’s take a look at the basics of user retention, how to measure it, and the best ways to improve user retention for the long-term.
What is User Retention?
User retention is about how well a company or platform can keep its users coming back. It means making sure that users remain interested and engaged with what you offer and encouraging them to continue interacting with your product or service over time.
Essentially, it’s the measure of how effective a business is at maintaining a relationship with its users that keeps them returning regularly. This metric is important because it reflects the ongoing value users find in your offerings, which is vital for long-term success and stability.
User Retention vs. Customer Retention
User retention and customer retention are quite similar, but they focus on different parts of keeping people involved with a business.
User Retention is about how well a company keeps its users interested and coming back to interact with its product or service. It’s not just about the people who buy something; it includes everyone who uses the platform.
Whether they’re paying customers or not, their continued engagement is what counts here. This is especially important for apps and online services where active, consistent use can make or break their success.
Customer Retention zeroes in on keeping paying customers around and convincing them to keep buying your product or service. It revolves around maintaining relationships with the people who directly contribute to the business’s revenue.
Basically, while every customer is a user, not every user is a customer. User retention captures the broader audience—anyone who interacts with your service—while customer retention is focused on those who financially support the business. Both are key to a business’s growth, but they target different groups within your audience.

User Retention vs. Churn Rate
User retention rate and churn rate are polar opposites, but they are closely related.
User Retention highlights the positive aspect: it measures the percentage of users who continue to engage with a product or service over a specific period. It helps you understand how many users stick around after their initial contact or subscription.
High user retention means that a significant number of users find value in what you’re offering, which encourages them to return and engage regularly.
Churn Rate, on the other hand, focuses on the negative aspect: it measures the percentage of users who stop using a business’s product or service during a given time frame. A high churn rate is a warning signal that users are not finding enough value to continue their engagement, which may indicate potential issues with the product, pricing, customer service, or user experience.
A lower churn rate increases your chances of having a higher user or customer retention rate. Some amount of churn may be unavoidable, but you’ll want to minimize it as much as possible.
Why is User Retention So Important?
User retention can directly impact a business’s bottom line and overall growth. Here’s why focusing on retaining your users can help you grow and succeed:
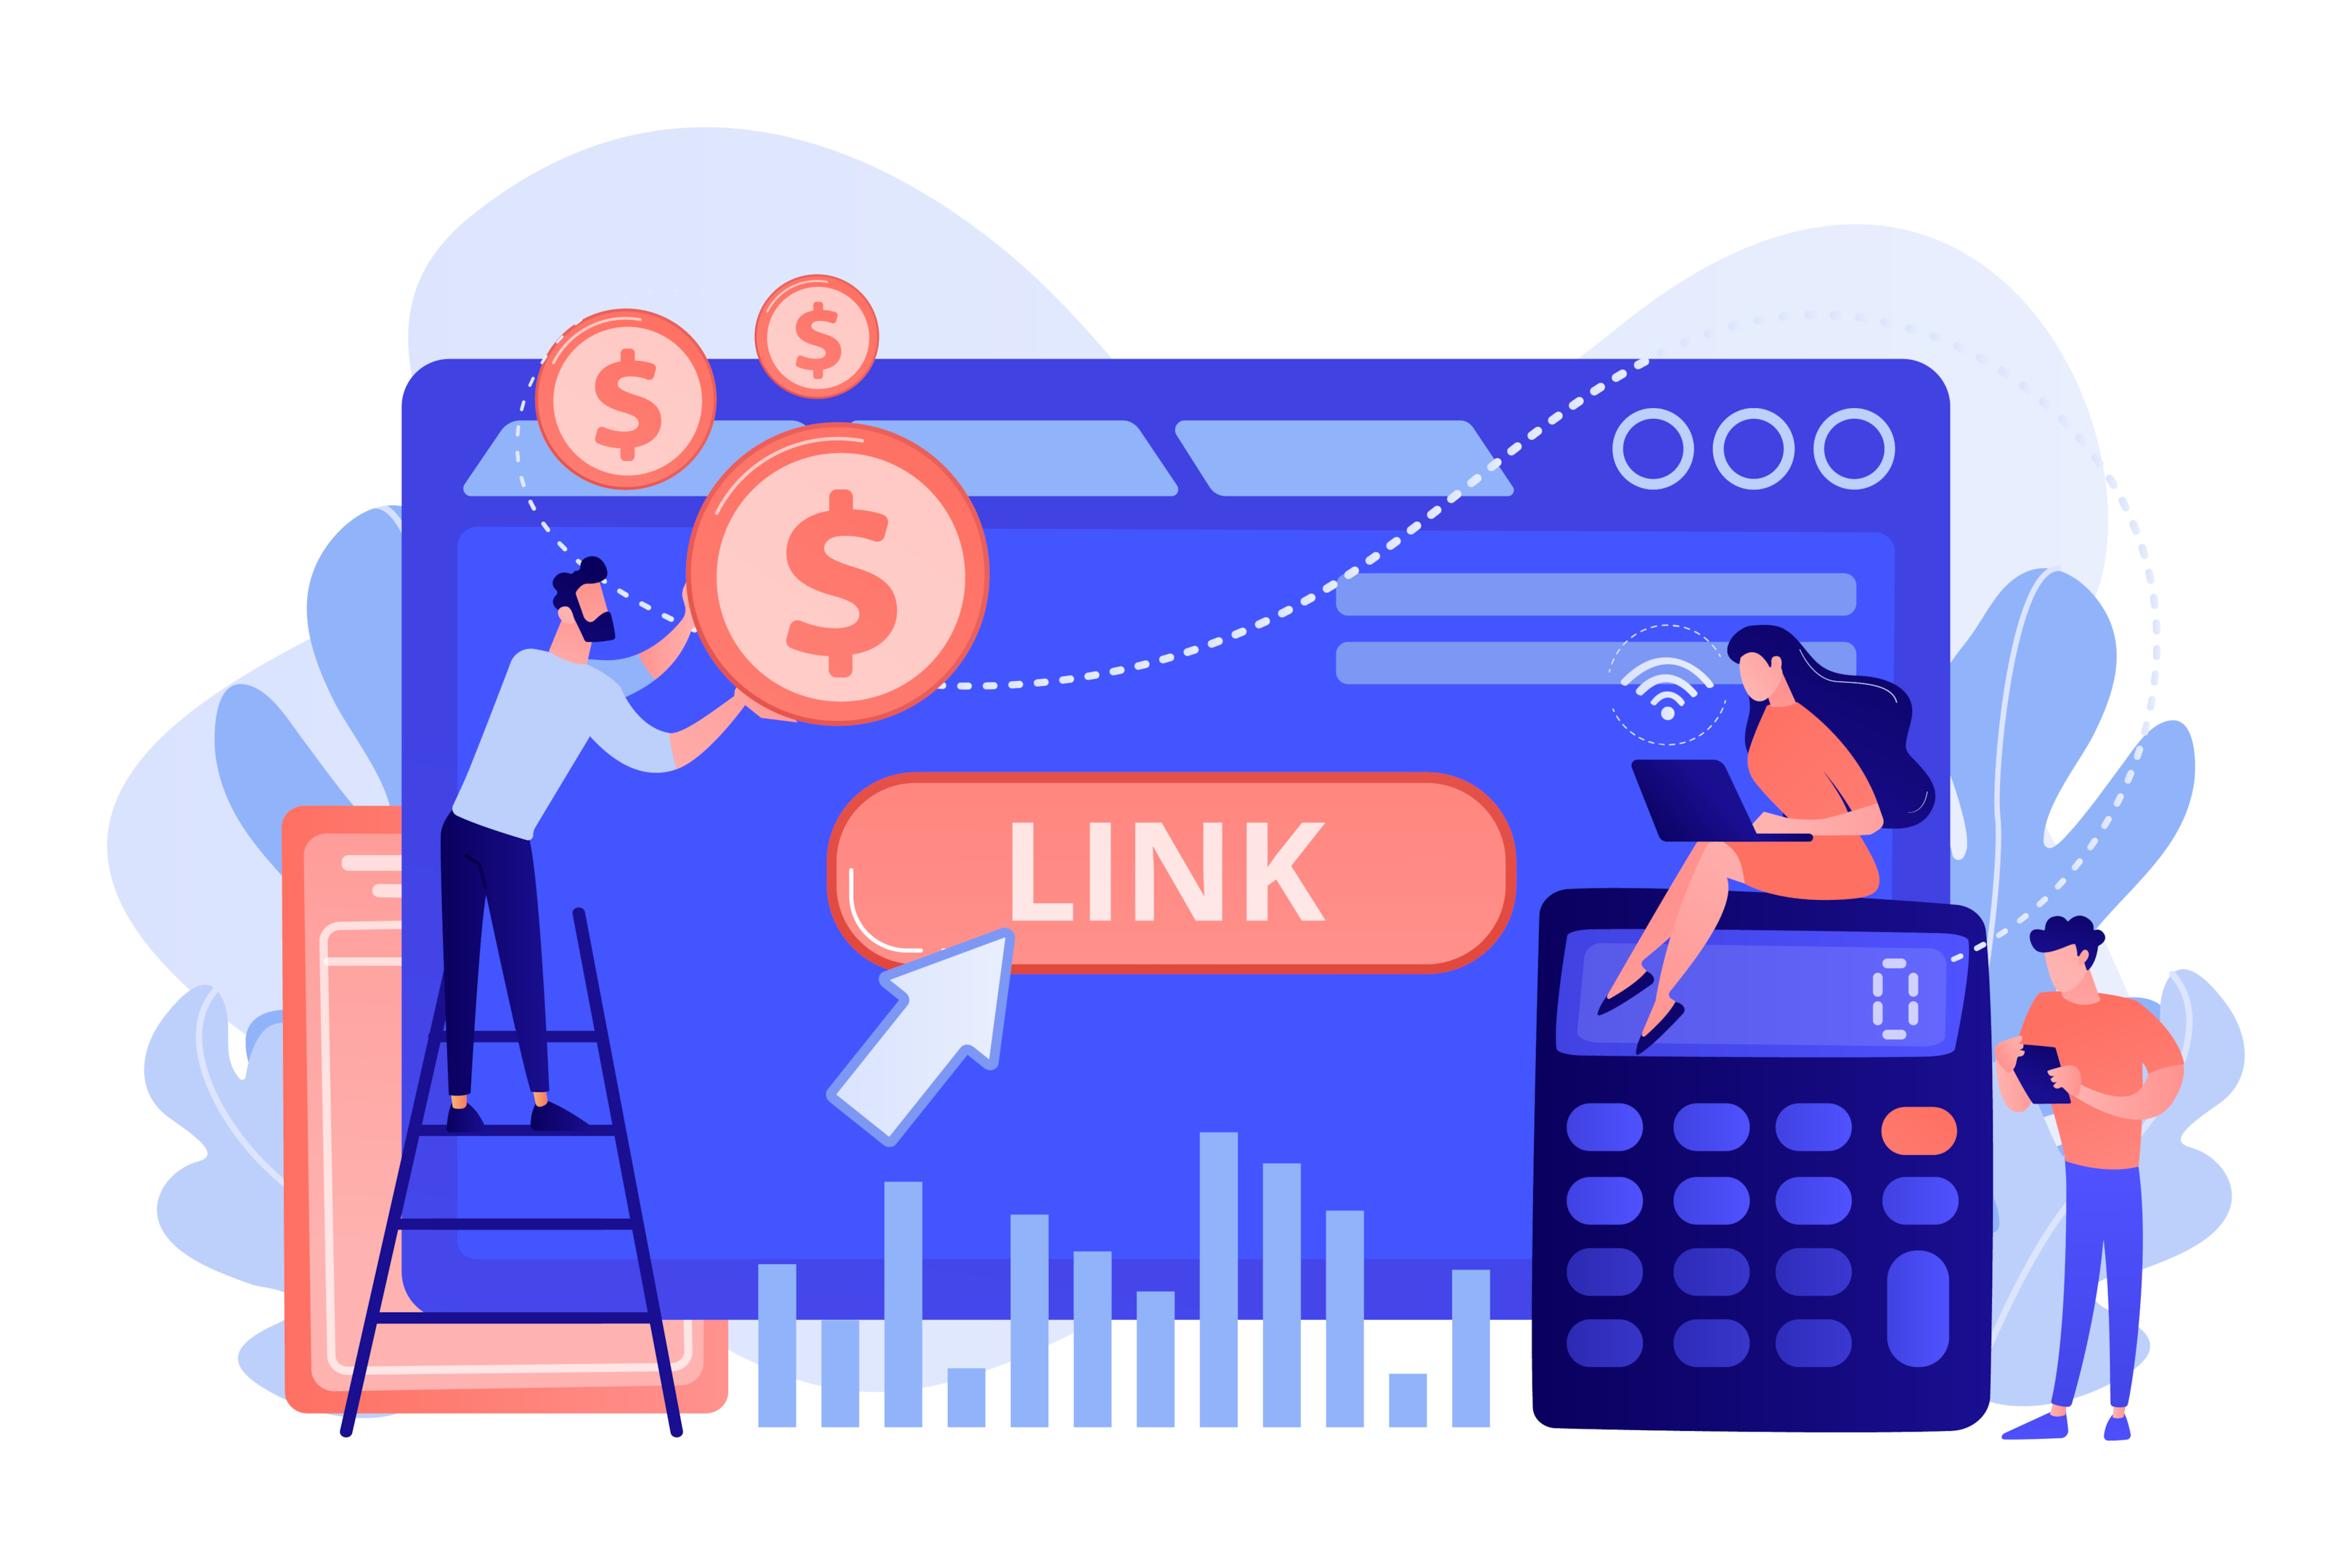
It’s Cheaper Than Customer Acquisition
First up, keeping an existing user is generally much less expensive than finding a new one. Studies and business analyses consistently show that the costs associated with marketing, advertising, and promotions to attract new customers can be steep.
When you shift focus to retention, you’re investing in the users who already know and use your product, which cuts down on the hefty expenses of winning over new clientele.
Retained Users Have a Higher Customer Lifetime Value
Users that stick around tend to spend more money over time. As they grow more comfortable and satisfied with your service or product, their trust in your brand increases, often leading to more frequent purchases and a willingness to try higher-priced offerings.
Increased customer lifetime value (CLV) is a high-priority metric because it maximizes your revenue significantly without the corresponding cost of acquiring a new customer.
Loyal Customers Are an Effective Marketing Tool
Don’t overlook the power of word-of-mouth. Loyal customers don’t just buy more; they often become advocates for your brand.
Happy and active users are likely to recommend your product to friends and family, write positive reviews, and share their experiences on social media. This organic marketing is cost-effective and tends to result in higher-quality leads, as a recommendation from a trusted friend or family member carries more weight than traditional advertising.
How to Measure User Retention
Measuring user retention is crucial for understanding how well your business keeps its customers coming back. Here’s a breakdown of how to do it effectively:
Choose Your Time Frame
First, decide on the time frame you want to analyze. This could be days, weeks, months, or even years, depending on the nature of your product or service and how frequently active users are expected to engage with it.
For mobile apps, you might look at daily or weekly retention, while subscription services might focus on monthly or yearly metrics.
Calculate Retention Rate
The retention rate is the percentage of users who return to your product or service after their first visit or purchase within your chosen time frame.
To calculate it, you need two numbers: the number of users at the start of the period and the number who are still active at the end of the period. The formula looks like this:
Retention Rate = (# of users at the end of the period ÷ # of users at the start of the period) x 100%

Use Cohort Analysis
Cohort analysis is a more detailed way to measure retention by grouping users based on their start date. This method allows you to track specific user groups over time and see how changes to your product or marketing strategies affect different cohorts.
For example, you might compare the retention rates of users who signed up after a major product update versus those who joined before to see if the update has improved user retention rates.
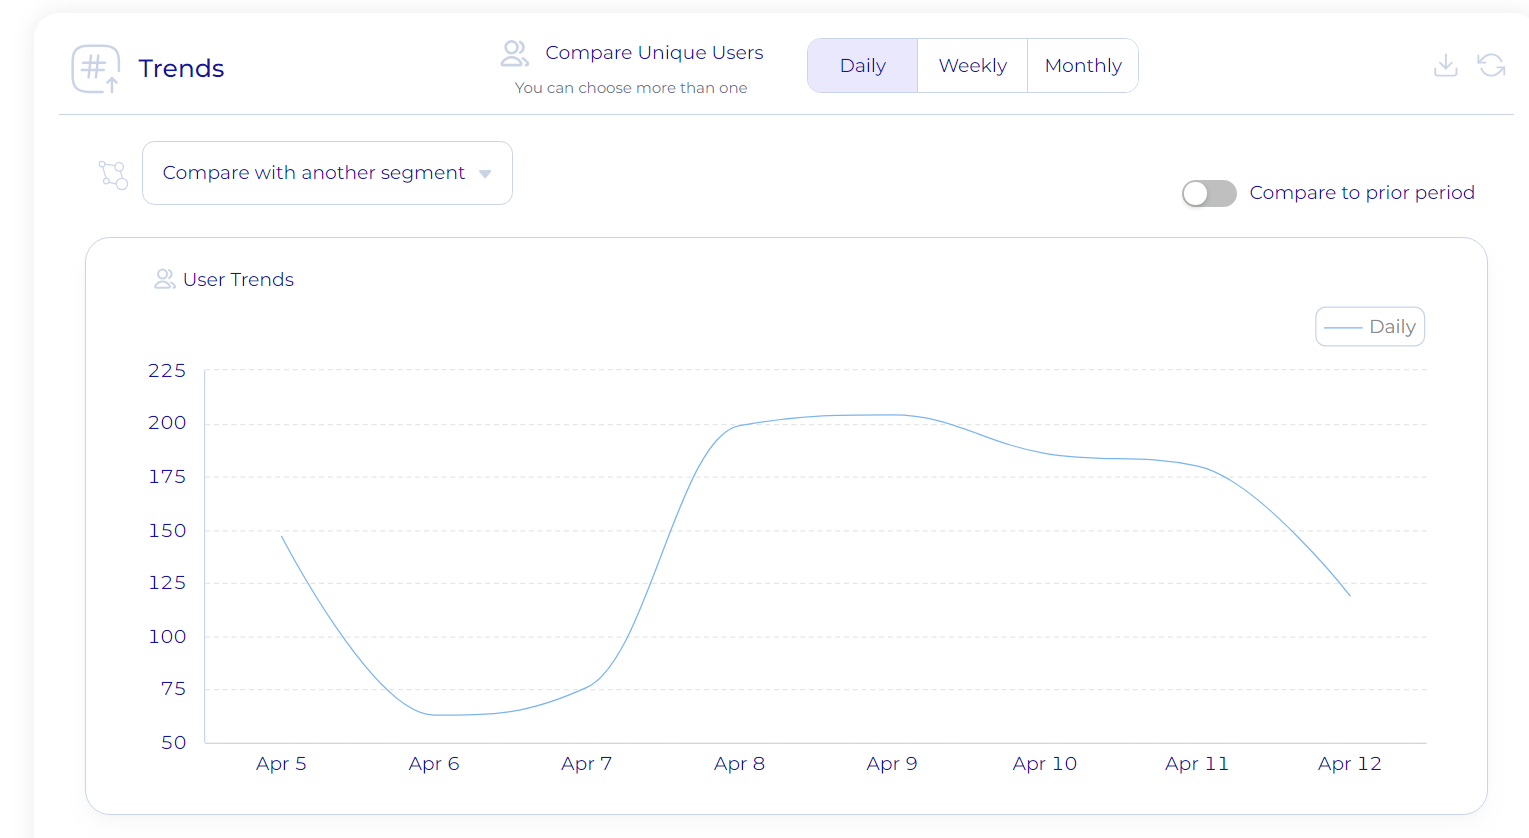
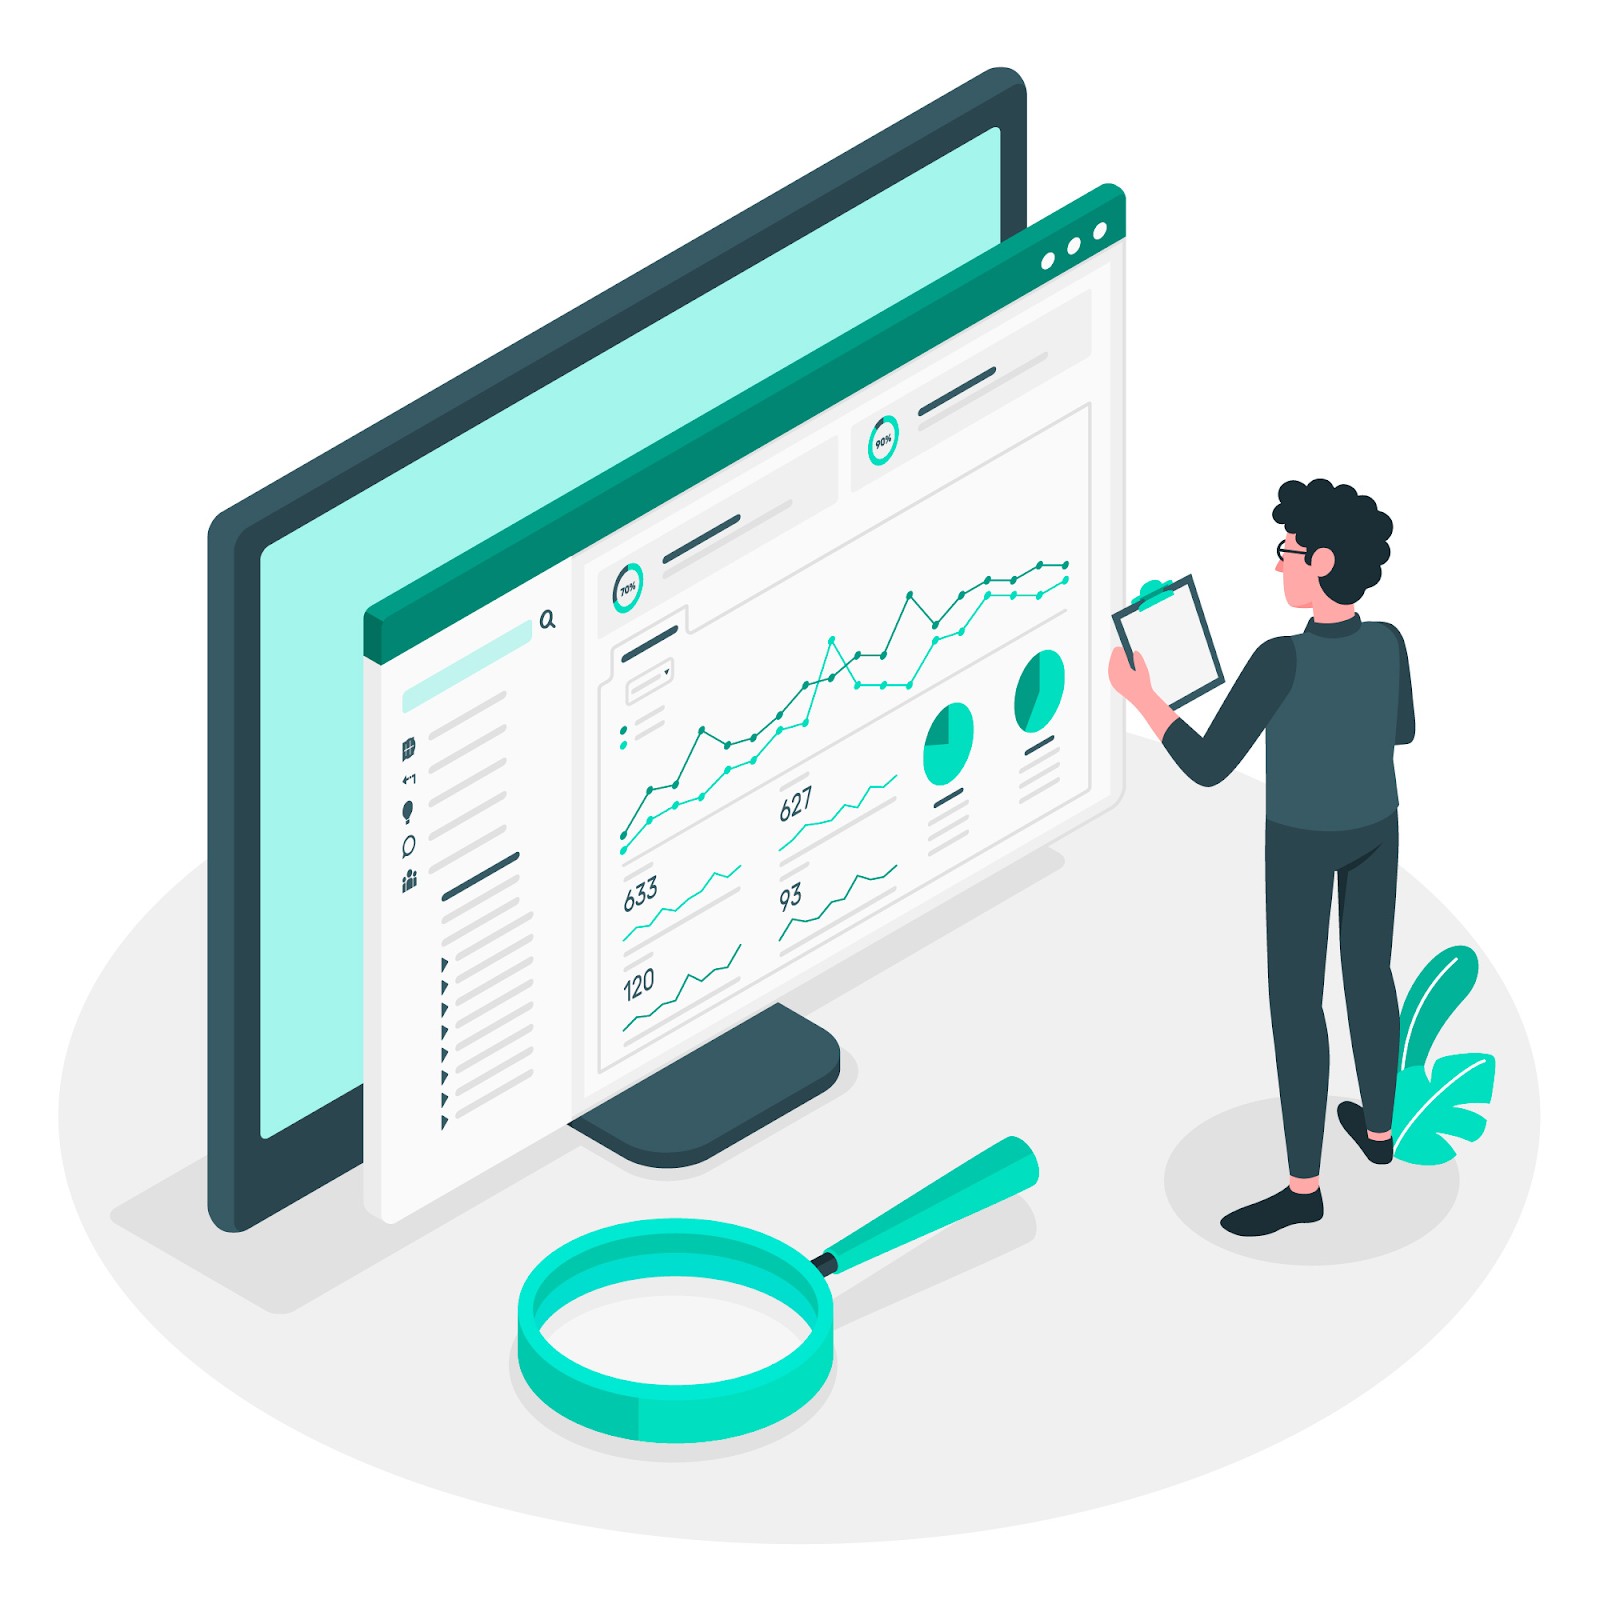
Leverage Analytics Tools
There are various analytics tools available that can help simplify the measurement of user retention. Tools like Google Analytics and FullSession offer built-in features to track retention rates and perform cohort analysis.
These tools can provide visualizations and detailed reports that make it easier to understand your retention data at a glance.
User Retention Metrics That Matter
Keeping an eye on key metrics alongside user retention gives you a fuller picture of what’s going on with your service or product. By monitoring different data points, you can spot trends and patterns that might not be obvious just from looking at retention alone.
For example, you might notice that even though more users are sticking around, they aren’t engaging with your content as deeply if session lengths are dropping. This kind of insight helps you figure out what’s working and what’s not, allowing you to make smarter tweaks to improve the user experience.
Here are some of the most important user retention metrics that can provide deep insights into user behavior and the health of your business:
1. Churn Rate
Customer churn rate is the flip side of the retention rate. It represents the percentage of users who stop using your service during a given time frame. Monitoring churn helps you identify how many users you’re losing, which can prompt a deeper dive into what might be causing them to leave.
2. Daily Active Users (DAU) and Monthly Active Users (MAU)
These metrics give you a snapshot of engagement and show how many existing customers interact with your product on a daily or monthly basis. A strong ratio of DAU to MAU can indicate a healthy level of user engagement and regular retention.
3. Average Revenue Per User (ARPU)
Understanding how much revenue each user contributes on average can help you gauge the economic impact of retention strategies. If ARPU increases alongside retention improvements, it’s a good sign that your retained users are more valuable.
4. Repeat Purchase Rate
For e-commerce platforms, the repeat purchase rate is crucial. It measures how often customers come back to make another purchase. This metric is a direct indicator of customer loyalty and satisfaction.

5. Session Length
Session length tracks how long users stay engaged during each visit to your platform. Longer sessions can indicate higher engagement, which is often correlated with higher retention rates.
6. Customer Lifetime Value (CLTV)
CLTV predicts the net profit attributed to the entire future relationship with a customer. By understanding this value, you can better assess how much to invest in retaining users versus acquiring new ones.
7. Net Promoter Score (NPS)
NPS measures customer satisfaction and loyalty by asking customers how likely they are to recommend your product or service to others. A high NPS is often associated with high user retention, as satisfied users are more likely to stick around and promote your brand.
Best Ways to Improve User Retention
Today’s digital marketplace is highly competitive, and if you don’t pay attention to user retention, you risk falling behind your competitors. Here are some actionable strategies that can help you maximize user retention and turn casual users into loyal patrons.
Always Be Improving the User Experience
A smooth, intuitive user experience is a must to retaining customers. Focus on simplifying navigation, speeding up loading times, and making sure your user interface is clean and user-friendly. Remember, there’s no faster way to cause user churn than to have a clunky, difficult-to-use interface.
Regular updates based on feedback can also show your commitment to their needs and encourage them to stay.
Take Personalization to the Next Level
Personalization can make users feel valued and understood. Tailor the user experience based on individual preferences, behaviors, and past interactions. This could mean recommending products, adjusting content displays, or even personalizing communication styles in emails and notifications.
Upgrade the Onboarding Process
A strong onboarding process can set the tone for user retention. Make sure that new users understand how to navigate your platform and fully utilize all its features. A good onboarding experience can significantly reduce initial churn by removing barriers to usage.
Engage with Your Users
Regular engagement can build strong relationships with your users. Use email newsletters, push notifications, and social media to stay in touch. Offering help, asking for feedback, and updating them about new features keeps your users involved and informed.

Consider Rewards and Loyalty Programs
Introduce rewards and loyalty programs to incentivize continued use. This could be through points, special access to new features, discounts, or even public recognition. Such perks make users more likely to return and engage with your platform.
Monitor and Respond to Feedback
Actively seek and listen to user feedback. Monitoring reviews, conducting surveys, and engaging in dialogue through social media can provide invaluable insights into what users like and dislike.
Responding to feedback not only improves the product but also shows users that their opinions are valued, which can improve their loyalty.
How to Use FullSession to Measure User & Customer Retention
FullSession is a great tool for digging into what keeps users coming back to your website or what might be pushing them away. Here’s a straightforward guide on how to use FullSession to measure customer retention and find ways to improve it:
Step 1: Set Up FullSession
Start by integrating FullSession with your site. It’s pretty straightforward—just like adding a Google Analytics code. Once it’s up and running, it starts tracking how users interact with your site, capturing everything from clicks to scrolls.
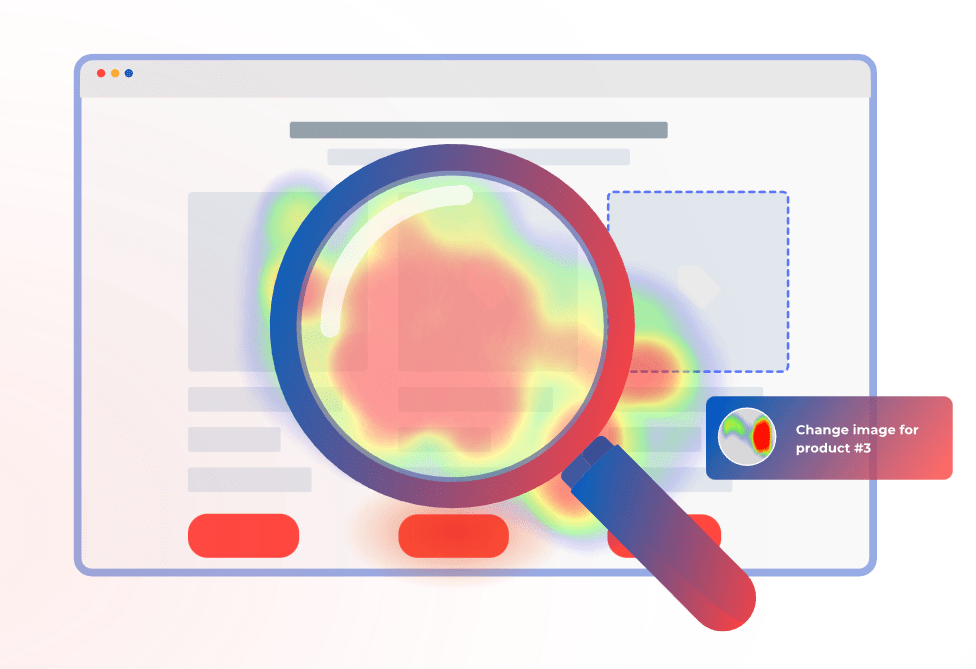
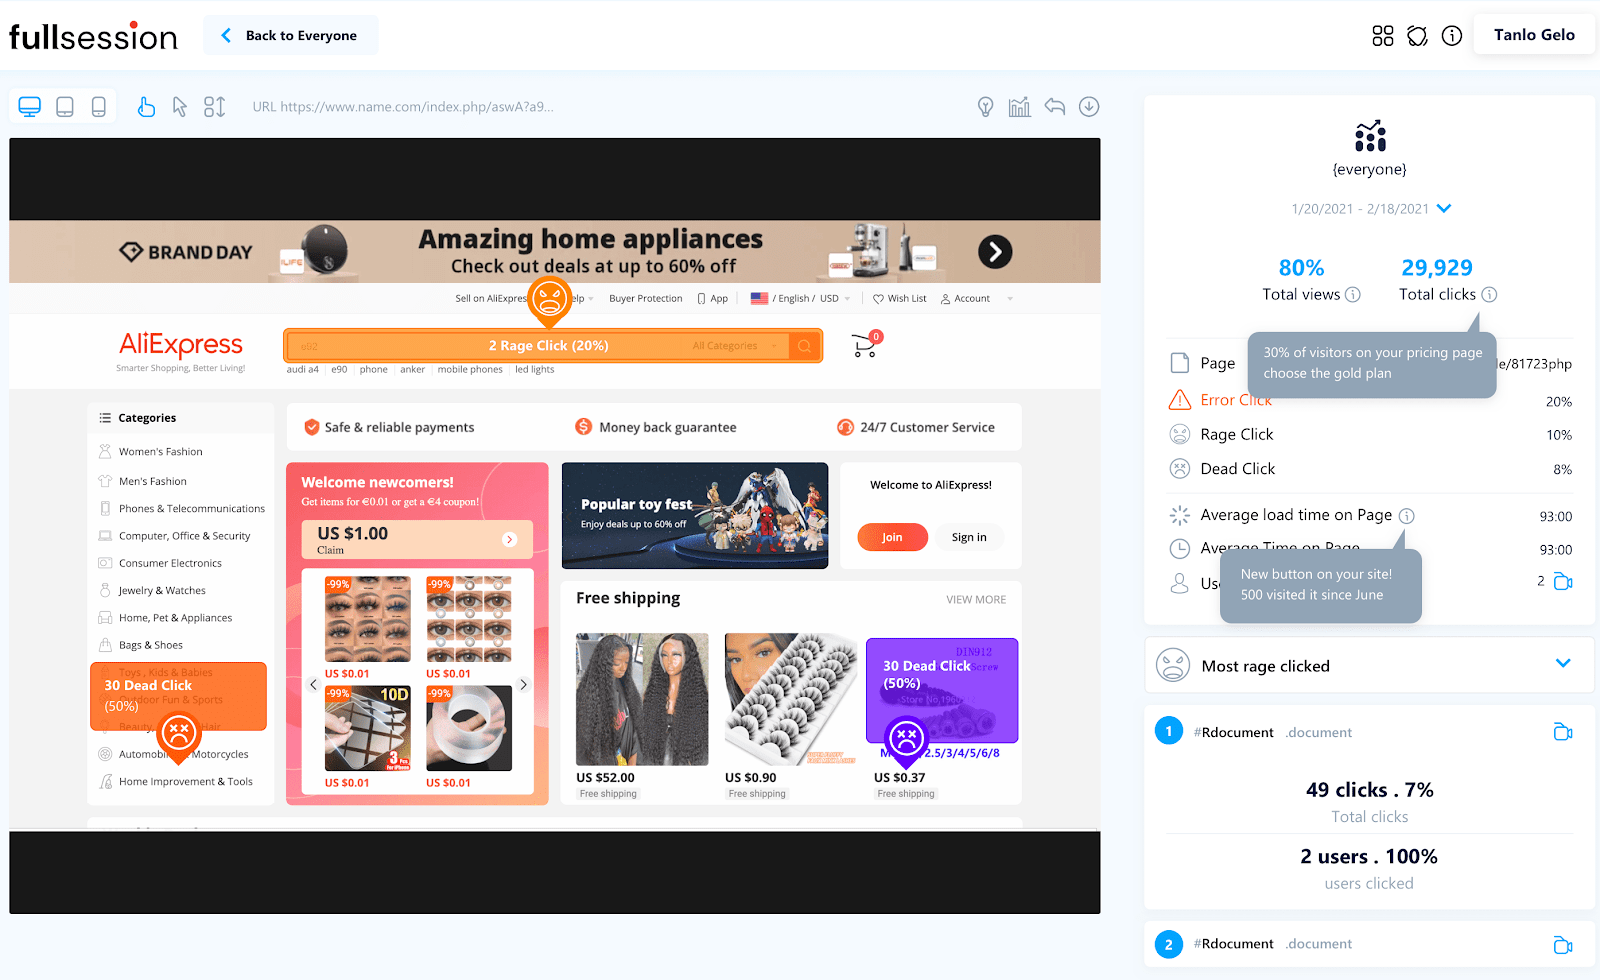
Step 2: Explore Heatmaps
Heatmaps are super useful for seeing what parts of your site users are drawn to. They show you where people are clicking the most and where they’re spending their time. This visual tool helps you quickly spot which features grab attention and which might be overlooked.
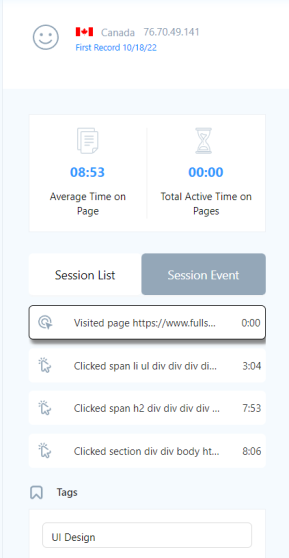
Step 3: Dive Into User Sessions
With FullSession, you can watch replays of user sessions to follow their journey through your site. These are essentially videos of what each user does, which show you where they get stuck or what keeps them engaged.
Understanding these paths can help you smooth out any rough spots that might deter users from coming back.
Step 4: Set Up Event Tracking
Track key actions you want users to take on your site, like signing up or making a purchase. Seeing how often these events happen gives you clear insight into whether users are really engaging with your site over time.
Step 5: Segment Your Users
FullSession lets you break down your users into different groups based on things like where they came from or what device they’re using. This helps you tailor your analysis and pinpoint which groups are sticking around longer than others.
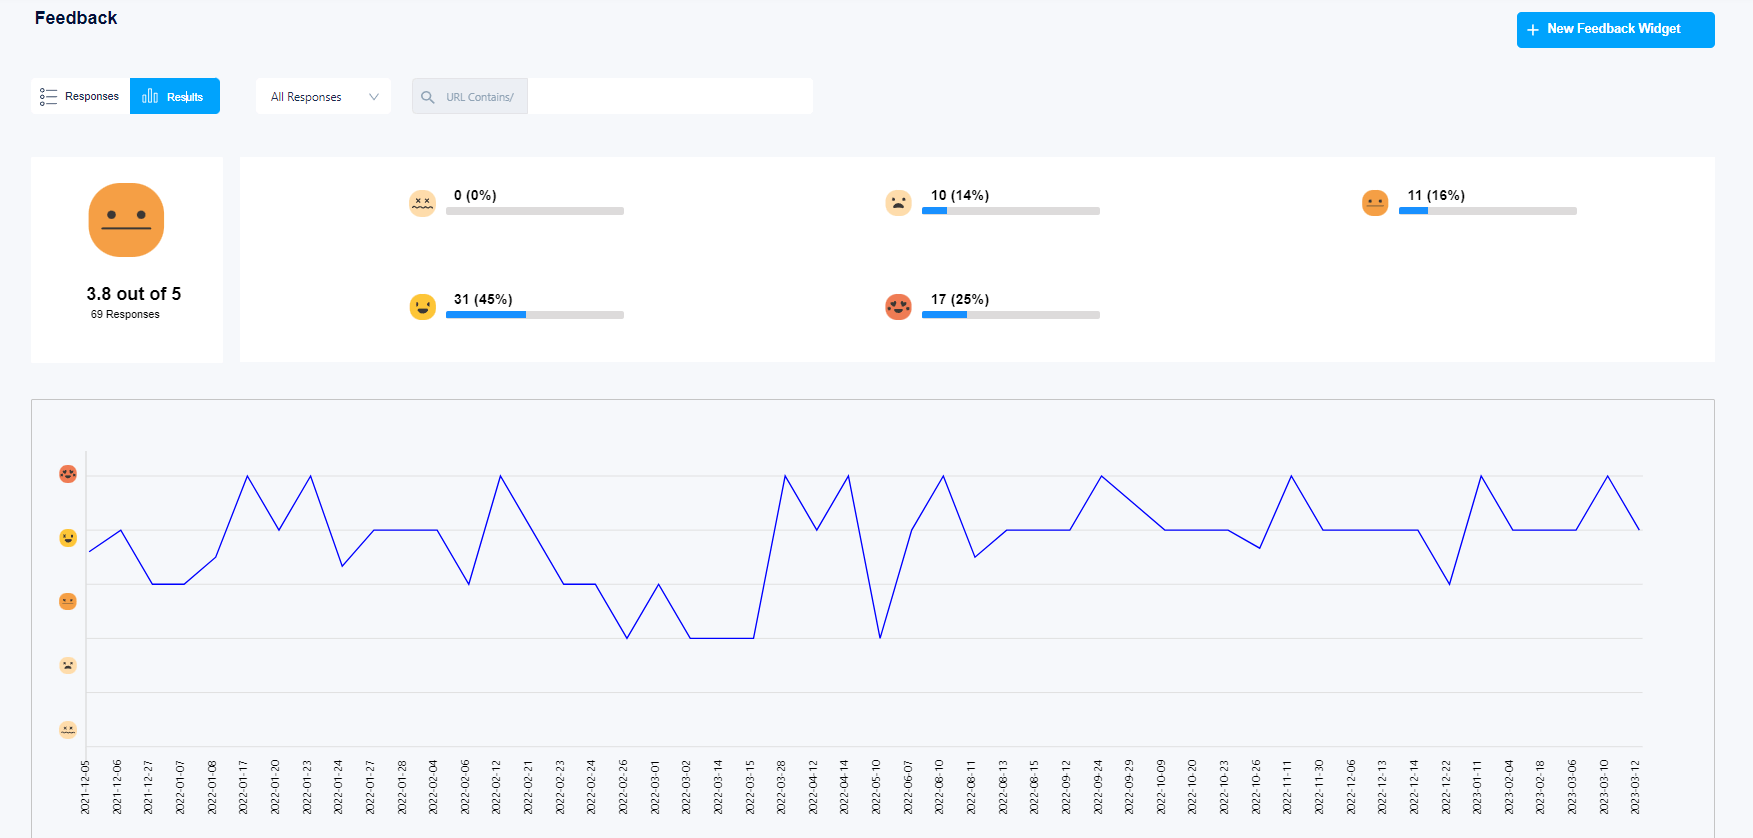
Step 6: Collect Direct Customer Feedback
Don’t forget to ask users directly what they think so that you can perform better retention analysis. FullSession has customer feedback tools for popping up quick surveys or feedback forms right on your site. This direct line to user thoughts can be incredibly helpful for figuring out what changes you need to make to keep them around.
Step 7: Keep an Eye on the Data
Make it a habit to check in on your FullSession reports regularly. Keeping track of how user behavior shifts over time can clue you into what’s working and what’s not, which helps you tweak your site to better retain users.
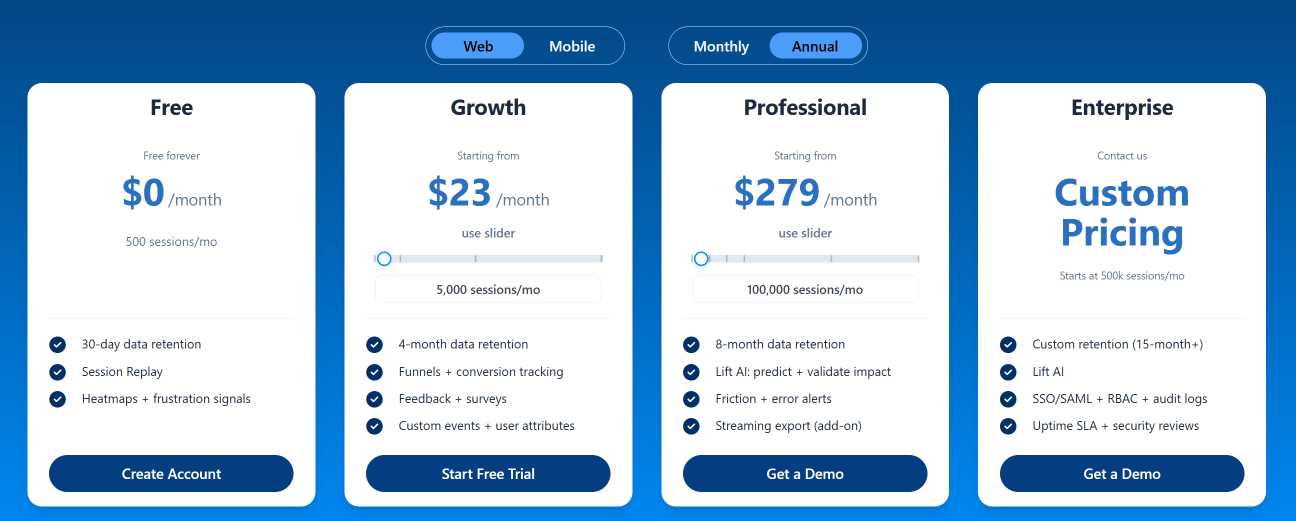
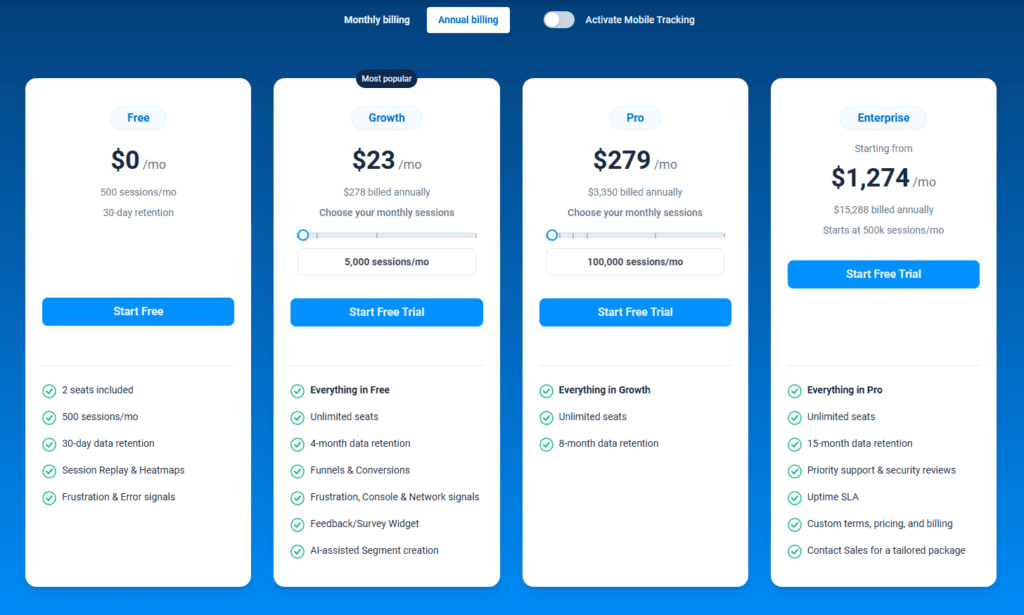
FullSession Pricing Plans

The FullSession platform offers a 14-day free trial. It provides two paid plans—Basic and Business. Here are more details on each plan.
- The Starter plan costs $39/month or $32/year and allows you to monitor up to 5,000 monthly sessions with up to 6 months of data storage.
- The Business plan costs $75/month or $60/year and helps you to track and analyze up to 100,000 monthly sessions with up to 12 months of data storage.
- The Enterprise plan has custom pricing and offers customizable sessions plus full access to all features.
Analyze Your User Retention Rate Today
It takes less than 5 minutes to measure user retention withFullSession, and it’s completely free!
FAQs About User Retention
How often should I measure user retention?
It’s a good idea to keep an eye on user retention pretty regularly. How often you check in can depend on how quickly your business is changing or growing—monthly or quarterly checks are a solid start.
Can user retention impact my bottom line?
Definitely. High user retention often translates to more stable and predictable revenue, plus you’ll save a bundle by not having to constantly chase after new customers.
Does a high churn rate always mean poor user retention?
Mostly, yes. If lots of people are bailing on your platform, it’s a sign that something might not be clicking. It’s worth taking a closer look to see what’s up.
Mohamed oversees operations and finance at FullSession and has contributed to the company’s UX analytics knowledge base.