Behavior analysis software is a category of tools that collect data on how people interact with a website or app, then turn that user behavior data into meaningful insights teams can act on. You can use it to analyze user behavior across sessions and identify trends before they turn into lost revenue.
Picking behavior analysis software shouldn’t mean sitting through five sales calls just to find out what something costs. Updated July 2026, this guide compares five top solutions on features and pricing, so you can shortlist in minutes instead of weeks.
One quick note before we go further.
You’ll get:
- A side-by-side comparison table of all five tools
- A breakdown of FullSession, FullStory, Google Analytics, Contentsquare, and Mixpanel
- A framework for matching a tool to your team
If you’ve landed here searching for applied behavior analysis (ABA) software instead, that’s a different world entirely: ABA software solutions are built for behavior analysts, covering ABA practices, ABA organizations, client progress tracking, and therapy sessions in ABA therapy programs.
We touch on that distinction in the FAQ section below, but the rest of this guide focuses on teams that want to track user behavior.
Key Takeaway
- FullSession: Combines session replay, heatmaps, funnel tracking, error alerts, and feedback in one workspace, so product and UX teams get the full picture without juggling multiple tools.
- FullStory: Autocaptures every interaction and lets teams search session data retroactively, which suits larger organizations with dedicated analytics staff.
- Google Analytics: Tracks traffic, acquisition, and conversion trends for free, making it the default starting point for broad reporting.
- Contentsquare: Breaks pages into zones and pairs that with journey analysis, built for enterprise teams running structured conversion rate optimization programs.
- Mixpanel: Logs specific user actions as events, so product teams can build funnels, retention reports, and cohort analysis around exact behaviors.
FullSession stands out because it replaces several separate subscriptions with one connected workspace.
Instead of pulling a heatmap from one tool, a session replay from another, and funnel data from a third, your team works from a single source that already ties those pieces together.
That means less time reconciling data and more time actually fixing what’s broken.
Data Collection in Behavioral Analytics (and Why It Matters)
Data collection is the foundation every behavioral analytics tool is built on. Without accurate data collection, the reports, graphs, and dashboards on top of it are just guesses dressed up as insights.
Most platforms collect data in two ways:
- Quantitative tracking counts specific behaviors: page views, clicks, form submissions, and conversion events.
- Qualitative data adds the “why” behind those numbers through session replay, heatmaps, and direct user feedback.
A tool that only does one or the other leaves gaps. Traditional analytics tools are strong at counting what happened but weak at explaining it. That’s the gap session replay and heatmaps exist to close. This gap is also why customer journey analytics software exists: it connects the two sides into a single view.
Real-time data collection matters just as much as depth. If your team can only see what users did last week, you’re always reacting late. The best setups show user actions as they happen, not days later.
What gets collected typically falls into these categories:
| Data type | What it captures |
| Clicks and taps | Where users interact on a page or in an app |
| Scroll depth | How far users get before losing interest |
| Form fields | Where users hesitate, skip, or abandon a form (data entry patterns) |
| Errors | Broken elements or scripts that block user actions |
| Custom events | Specific user interactions unique to your product |
User privacy and data security have to be part of this conversation too. Any tool collecting behavior data should let you mask sensitive information, exclude specific elements, and comply with regional privacy rules by default, not as a paid add-on.
Evaluation Criteria for Behavioral Analysis Software
Five criteria separate a genuinely useful behavior analysis software platform from a dashboard nobody opens twice, and how well it scores on each one determines how much it actually contributes to product optimization down the line.
The five core criteria
- Data collection depth. Does it capture both quantitative events and qualitative context like session replay, or just one?
- Ease of setup. Can a non-technical team member get real data flowing in under an hour, or is there a steep learning curve?
- Pricing information. Is the starting price public, or do you need a sales call just to get basic pricing information?
- Integrations. Does it connect cleanly with Google Tag Manager, your CRM, and your communication tools?
- Data security and user privacy. Are masking, consent, and compliance features built in, not bolted on?
Reporting quality and quick self-check
Data analysis and reporting matter here too. A platform that collects rich data but buries it in cluttered dashboards doesn’t help anyone turn it into actionable insights.
Look for clear graphs and data visualization your team will actually use, not just data they can technically export. If your evaluation stretches into structured testing programs, the CRO tool categories breakdown is a useful next stop.
Advanced features like AI-generated summaries or predictive scoring sound impressive, but they only matter if your team will actually use them week to week.
Quick self-check before you shortlist a tool:
- Can it pinpoint areas of friction, not just report totals?
- Does it work across multiple platforms (web, mobile, and app)?
- Does it show you specific behaviors tied to real sessions, not just averages?
At-a-Glance Comparison of the Top Behavioral Analytics Software
You don’t need to read five vendor websites to get the basics. This table lays out how FullSession, FullStory, Google Analytics, Contentsquare, and Mixpanel compare.
| Tool | G2 Rating | Best For | Top Feature | Starting Price |
| FullSession | 5.0/5 | Product and UX teams that want replay, heatmaps, and funnels in one workspace | Lift AI, unified session replay and heatmaps | Paid from $39/month (paid annually) |
| FullStory | 4.5/5 | Enterprise teams with dedicated analytics staff | Retroactive event search | Paid plans by quote |
| Google Analytics | 4.5/5 | Teams that need broad traffic and acquisition reporting | Free, unlimited-scale tracking | Free; Analytics 360 starts at $50,000 per year |
| Contentsquare | 4.6/5 | Large enterprises running structured CRO programs | Zone-based heatmap analysis | Paid plans start at $49 per month |
| Mixpanel | 4.5/5 | Product teams tracking specific user actions and funnels | Event-based funnel analysis | Usage-based, starts at $140 per 1K events |
Want the wider picture beyond these five? Our list of user behavior tools covers more ground, including website visitor tracking software.
Best Behavioral Analytics Software for Product and UX Teams
Each of these five tools takes a different approach to the same problem: turning raw user behavior into something your team can actually act on.
FullSession
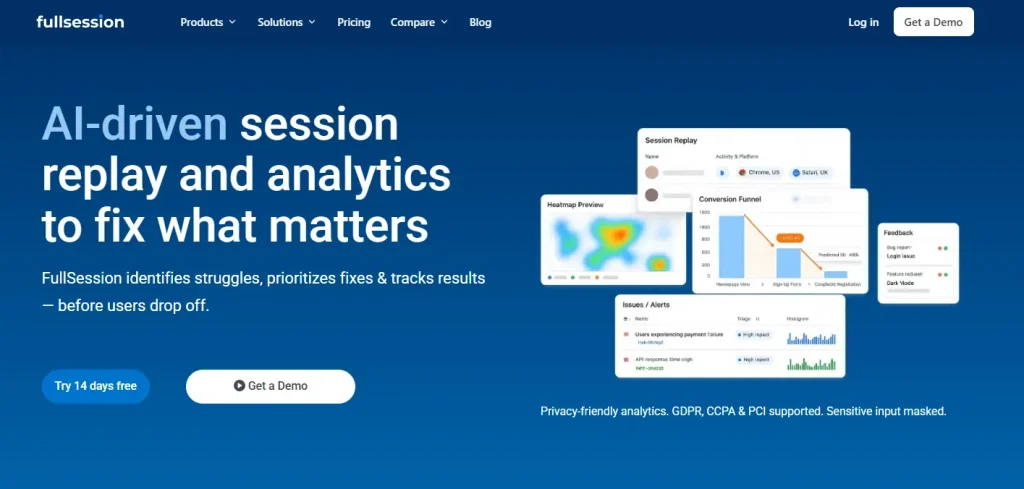
FullSession combines session replay, heatmaps, funnel tracking, feedback collection, and error alerts inside a single workspace instead of spreading them across separate tools.
Product and UX teams get a full picture of a user’s journey, from landing page to the exact click where they dropped off. They never have to switch platforms or export data between systems.
The platform captures every user interaction in real time and reconstructs it as a watchable session, layered with heatmap and funnel data pulled from the same events.
That means you can trace a rage click flagged in a heatmap straight to the replay that shows what caused it. For a deeper look at how this works, the session recording and replay tools and website heatmap tools break down each piece separately.
Best for
Product and UX teams who want session replay, heatmaps, and conversion data in one place instead of stitching together three separate subscriptions.
Key features
- Session replay: Watch real user sessions to see exactly where friction happens, click by click.
- Heatmaps: Visualize where users click, scroll, and hover across any page to see engagement patterns you’d otherwise miss.
- Feedback: Capture in-context user feedback tied directly to the session it came from.
- Funnel tracking: Identify the exact step where users drop out of a signup or checkout flow.
- Error tracking: Get alerted to JavaScript errors and broken elements the moment they affect a real user.
- Mobile replay: Extend the same session-level visibility to your mobile app, not just your website.
- Lift AI: Get fix recommendations ranked by revenue impact, then validate whether each one actually worked.
- Safety and security: Built-in data masking and privacy controls protect user privacy by default, not as an upsell.
- MCP server: Connect FullSession data directly into AI workflows and other tools your team already uses.
Pricing
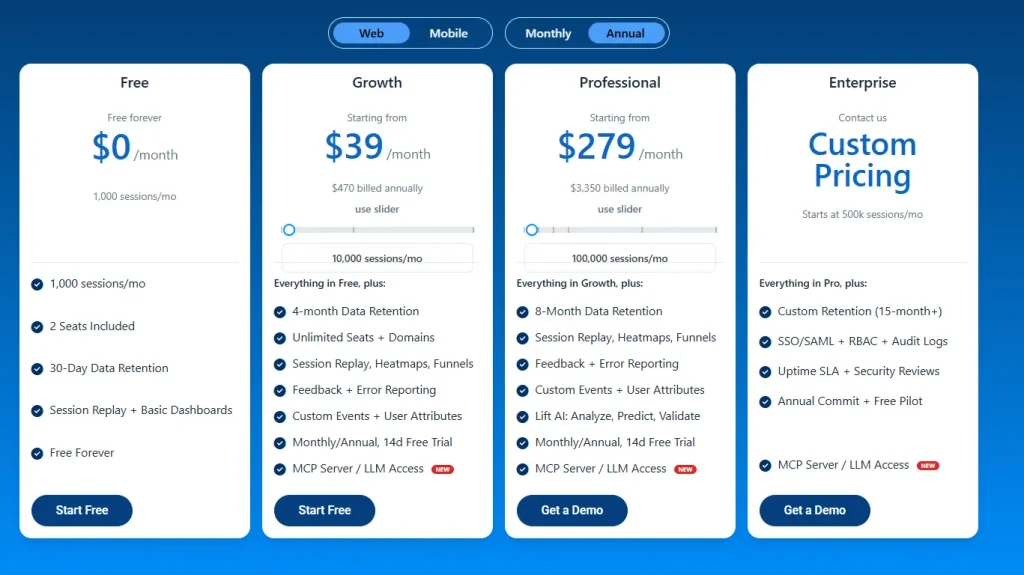
FullSession offers a free forever plan, with paid plans starting at $39/month (billed annually) for the Growth tier. It also includes enterprise pricing which starts at 500k sessions/month. Learn more about the pricing.
Not Ready for a Demo? See Your Own Data First.
Get replays and heatmaps flowing within minutes, no credit card and no trial countdown.
FullStory
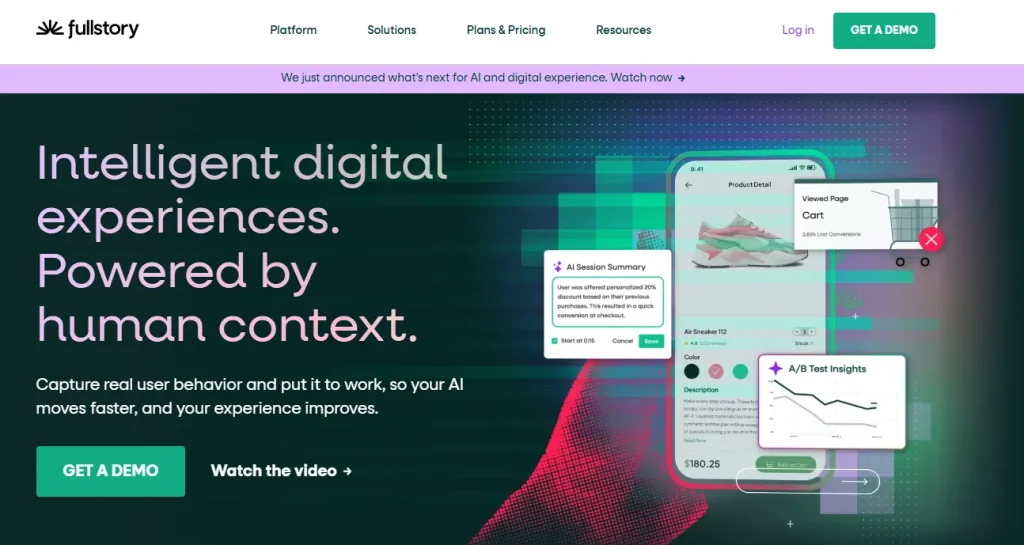
FullStory positions itself around retroactive search, letting teams query session data after the fact without deciding in advance which events to track. This appeals to larger organizations with dedicated analytics teams who want to explore behavior data freely rather than working from pre-set dashboards.
The platform autocaptures interactions across a site or app, then indexes them for search. Any team member can find specific behaviors, like every user who hit a broken checkout button, without writing a query in advance.
Learn more about FullStory competitors.
Best for
Enterprise teams with dedicated analytics staff who need to explore session data flexibly across large, complex products.
Key features
- Autocapture: Records every interaction automatically, so nothing needs to be tagged in advance.
- Session search: Query historical sessions by specific behaviors or events after they’ve already happened.
- Funnels and journeys: Map how users move through multi-step flows across the product.
- Segmentation: Group users by behavior, device, or custom attributes for targeted analysis.
- StoryAI summaries: Get automated, AI-generated summaries of session activity at scale.
Pricing
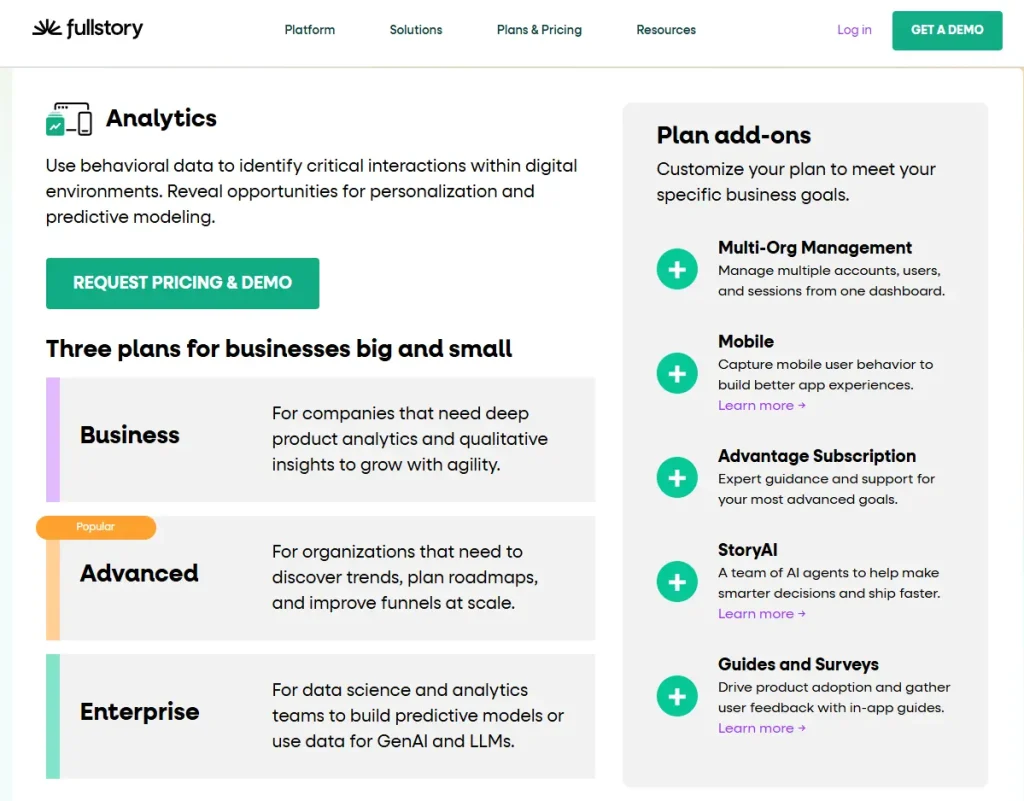
FullStory offers a free plan with 30,000 sessions per month, and paid Business, Advanced, and Enterprise tiers priced by quote.
Google Analytics
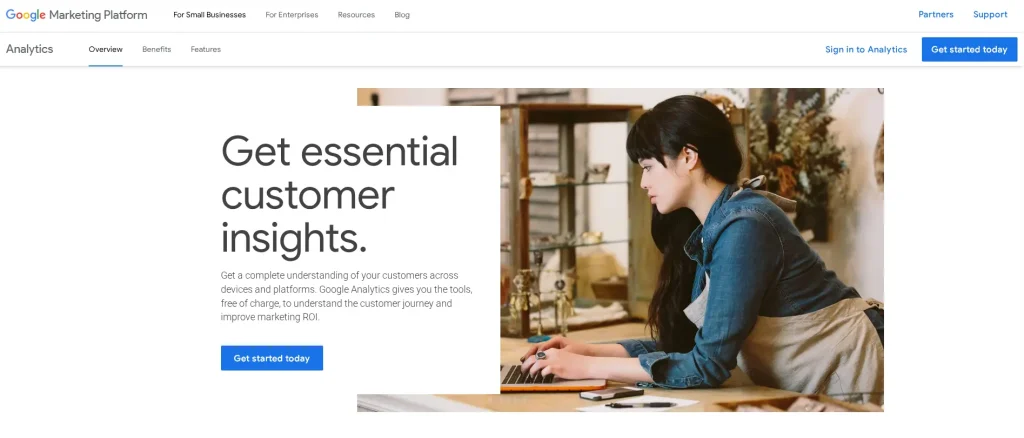
Google Analytics tracks traffic sources, user acquisition, and on-site behavior at no cost, making it the most widely adopted starting point for behavioral data on the web.
It focuses on aggregate patterns like where visitors come from and which pages they view, rather than recording individual sessions. That data commonly feeds directly into broader marketing strategies, from campaign attribution to channel budgeting
It works by placing a tracking snippet, often deployed through Google Tag Manager. That snippet logs page views, events, and conversions into reports teams can slice by channel, device, or audience segment.
If the platform alone doesn’t cover what you need, the alternatives to Google Analytics guide compares options built for deeper behavioral detail.
Best for
Teams that need broad, free reporting on traffic, acquisition, and conversion trends across a website or app.
Key features
- Event tracking: Track specific user actions like clicks, video plays, or form submissions.
- Audience reporting: See where users come from and how different segments behave.
- Conversion tracking: Measure how well specific goals, like signups or purchases, are performing.
- Google Tag Manager integration: Deploy and manage tracking tags without touching site code.
Pricing
Google Analytics is free for standard use. Analytics 360, the enterprise tier, is available through Google Marketing Platform. It starts at roughly $50,000 per year.
Contentsquare
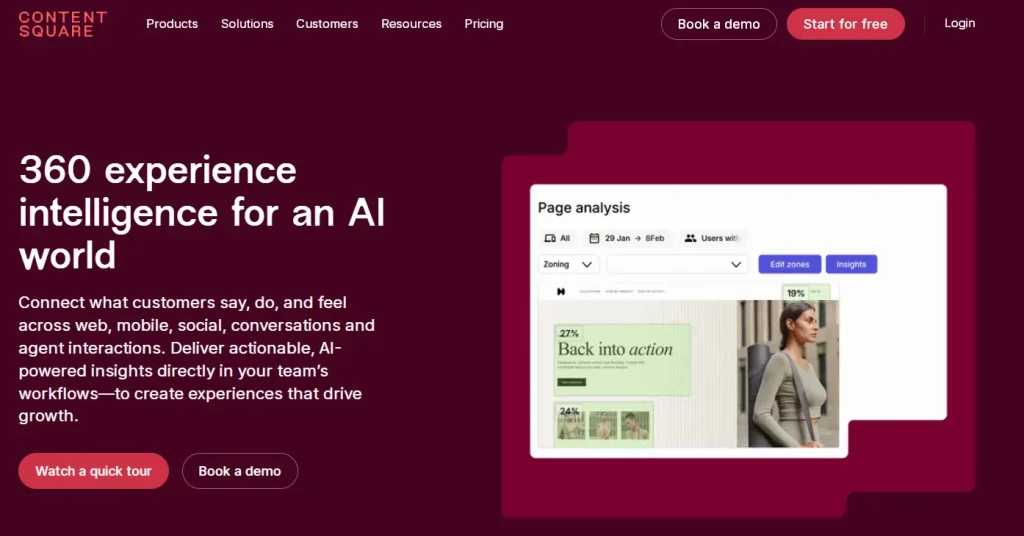
Contentsquare focuses on structured conversion rate optimization programs for large organizations, pairing zone-based heatmaps with journey analysis across web and mobile app experiences.
It’s built for enterprise CRO teams running ongoing testing programs rather than smaller teams looking for a quick setup.
The platform breaks pages into zones and tracks engagement at that level. It then layers session replay and journey data on top, so teams can pinpoint areas of friction that drive or block conversions.
Learn more about Contentsquare competitors.
Best for
Large enterprises running structured, ongoing conversion rate optimization programs with dedicated CRO staff.
Key features
- Zone-based heatmaps: See engagement broken down by specific page zones, not just raw clicks.
- Journey analysis: Map paths users take across multiple sessions and devices.
- Session replay: Watch recorded sessions tied to specific zones or events.
- Impact quantification: Estimate the revenue impact of specific friction points and higher conversions.
- Merchandising analytics: Analyze product-level performance for e-commerce catalogs.
Pricing
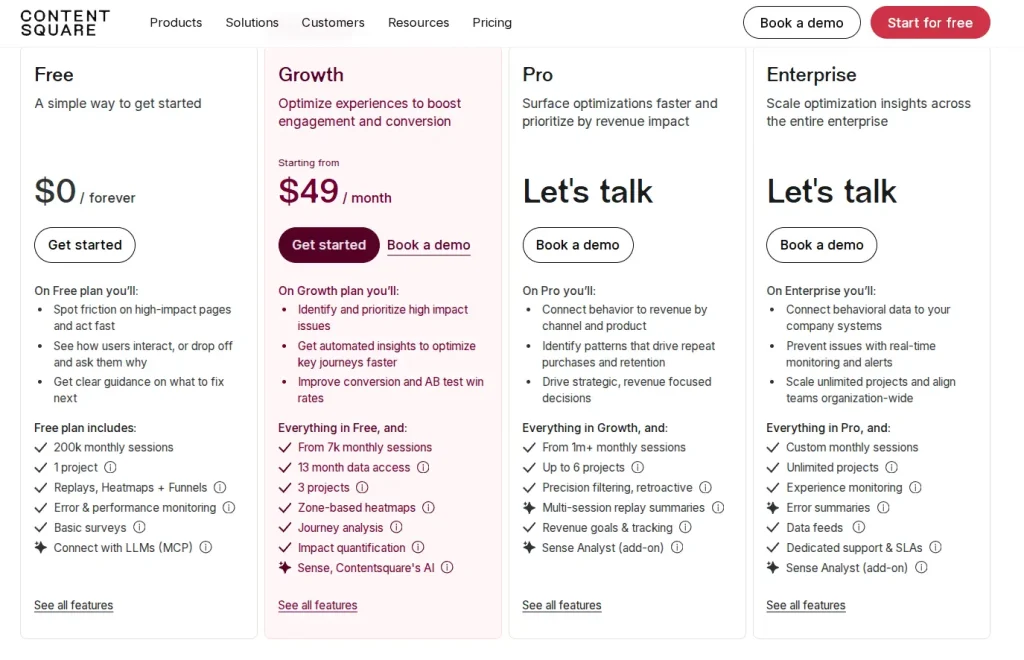
Contentsquare offers a free trial, with paid plans starting at $49 per month and 7k monthly sessions.
Mixpanel
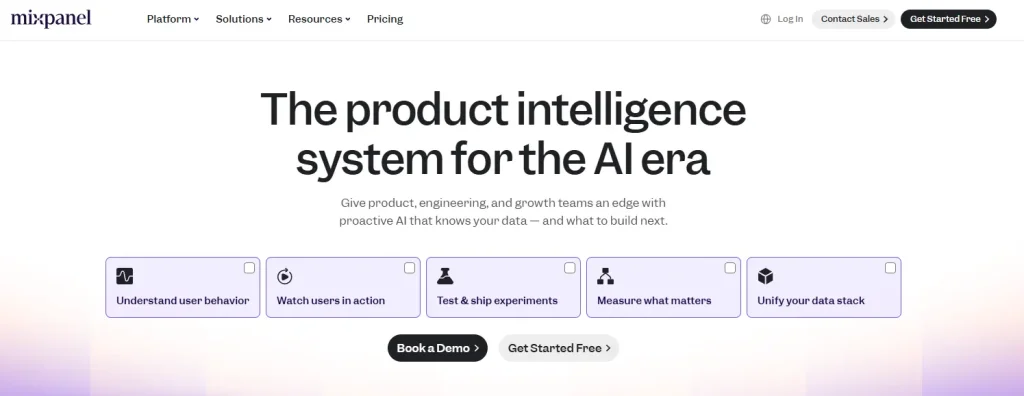
Mixpanel tracks specific user actions as events, then lets teams build funnels, retention curves, and cohort reports from that event data. It suits product teams who care less about watching individual sessions and more about measuring specific behaviors at scale, like feature adoption or checkout completion rates.
Mixpanel logs every user action as a discrete event tied to that user’s profile. Teams can then build reports that follow a person’s behavior across multiple sessions and devices over time.
If you’ve outgrown it or want a different fit, the Mixpanel alternatives guide compares tools built around the same event-tracking model.
Best for
Product teams that need to track specific user actions and analyze funnels across a defined set of events.
Key features
- Event tracking: Log specific user actions as structured, queryable events.
- Funnel analysis: Measure conversion rates between any two steps in a defined flow.
- Retention reports: See how many users come back after a specific action or time period.
- Cohort analysis: Group users by shared behaviors or attributes for comparison.
- A/B test analysis: Measure the impact of experiments directly against behavioral data.
Pricing
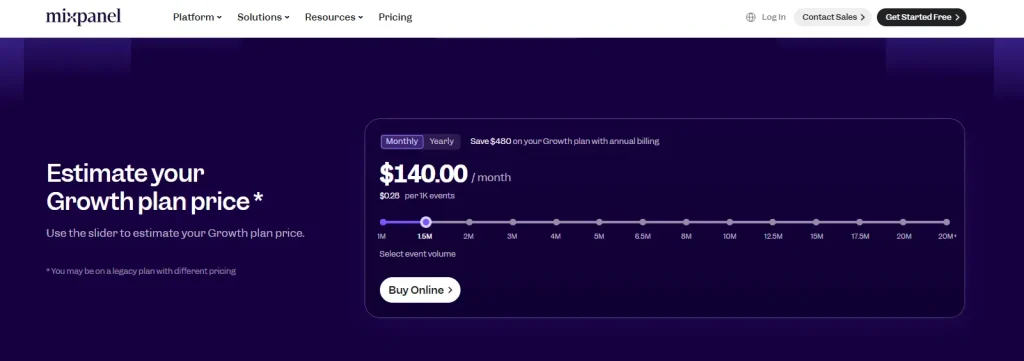
Mixpanel offers a free plan for teams tracking up to 1 million monthly events, with paid plans starting at $140 per month or $0.28 per 1K events.
How to Choose the Right Behavioral Analysis Software
Start with your team’s biggest blind spot, not the longest feature list. A team drowning in tickets about “something broken on the checkout” needs session replay and error tracking more than another dashboard.
Ask three questions before you commit to any tool, since this decision-making step is easy to rush:
- What specific behavior are you trying to understand?
- Who on your team will actually use this daily?
- What’s your real budget once you move past the free tier, including any enterprise plan costs down the line?
Which tool fits your team?
| Team type | Best-fit tool | Why |
| Product and UX teams | FullSession or Contentsquare | Replay, heatmaps, and funnels together in one workspace |
| Marketing teams | Google Analytics | Free, broad traffic and acquisition reporting |
| Engineering-led product teams | Mixpanel | Tracks specific user actions as structured events |
| Large analytics teams | FullStory | Flexible, retroactive exploration of session data |
Watch for a few common pain points before you sign a contract. Unclear pricing until you talk to sales, a steep learning curve for non-technical staff, and features that sound advanced but sit behind a higher-cost tier are all warning signs.
None of these are dealbreakers on their own, but stacking two or three together usually signals a high cost of ownership down the line.
For a broader view beyond these five, the product analytics tools roundup covers more ground.
Why Choose FullSession
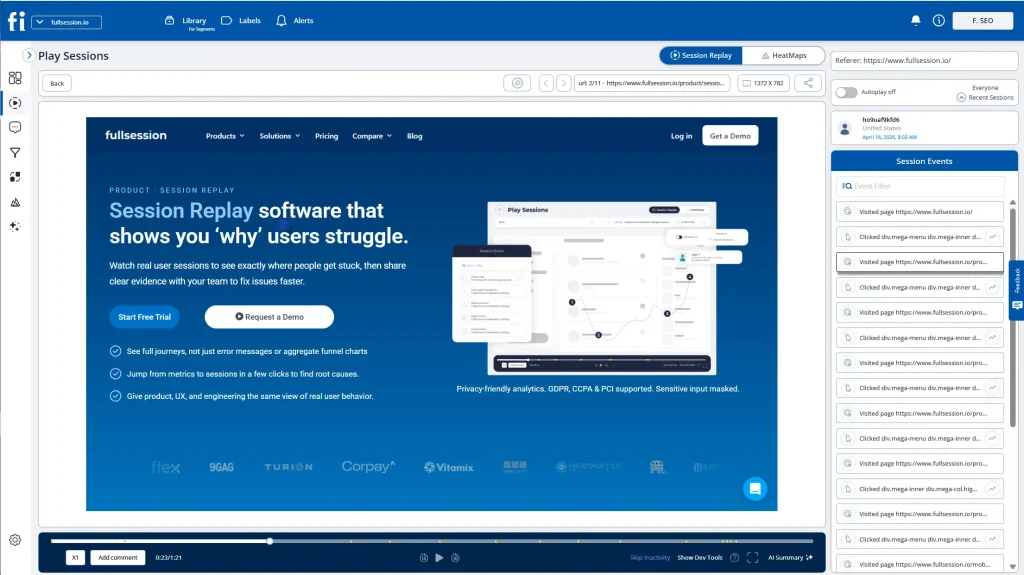
Most teams end up stitching together four or five tools just to understand their own product: one for replay, another for heatmaps, a third for funnels, and a support inbox that never talks to any of them. FullSession exists so you stop doing that.
From “Something’s wrong” to “Here’s why”
A heatmap flags where users hesitate or rage-click on a page. Instead of leaving you to guess why, that same anomaly links straight to the session replay showing the exact moment things went wrong, down to the click.
Funnel tracking then tells you whether that friction is costing you conversions at scale, or just annoying a handful of users. Error tracking catches the technical side of the same story, alerting your team the moment a bug hits a real visitor instead of waiting for a support ticket days later.
And when a user does leave feedback, it’s tied directly to their session. You’re reading a comment next to the exact experience that prompted it, not guessing at user satisfaction from a survey score.
For a closer look at how that feedback loop works, the customer feedback collection tools guide covers it in more depth.
Less manual review, more prioritization
Lift AI takes this a step further by doing the prioritization for you. Instead of your team manually reviewing sessions to guess what’s worth fixing, it ranks issues by revenue impact, then tells you whether a fix actually worked after you ship it.
Mobile replay extends that same visibility to your app, so you’re not blind on one platform while fully covered on another. And because everything runs through built-in data masking and privacy controls, none of this comes at the cost of user privacy, ensuring compliance without extra effort on your team’s part.
What you actually get
- One connected workspace instead of four disconnected tools to reconcile.
- Customizable workflows that streamline workflows across support, product, and marketing teams, instead of forcing everyone into one rigid process.
- A direct line into your existing AI workflows: the MCP server gives you direct access to FullSession’s data, instead of exporting and re-importing between systems.
- Custom pricing for enterprise teams with higher volume or specific requirements, so you’re not stuck choosing between a plan that’s too small and one that’s overbuilt.
See the Friction Your Current Analytics is Missing
Watch real sessions and get evidence-backed fixes in minutes, not sprints.
Integrations with Google Analytics and Operational Systems
Behavior analytics tools rarely work alone. Most teams run them alongside Google Analytics and connect both to the rest of their stack through Google Tag Manager.
That integration layer usually covers a few common categories:
- Tag management: Deploying tracking snippets through Google Tag Manager without editing site code for every change.
- Communication tools: Pushing session alerts into Slack, email, or the support platforms your team already uses daily.
- Data warehouses: Exporting raw event data to multiple sources or systems for teams that want to build custom reports elsewhere.
None of this replaces Google Analytics. It sits alongside it, adding the qualitative “why” that traffic reports alone can’t show, and helping teams stay ahead of issues instead of reacting to them weeks later.
Testing Methodology and Research Notes
Every pricing figure and feature claim in this guide comes directly from each vendor’s official website and pricing page. We checked each one at the time of publication, not from third-party estimate sites or aggregators.
G2 ratings referenced in the comparison table reflect publicly listed scores on G2’s own platform. Pricing for usage-based or enterprise plans can shift based on volume and contract terms. Treat the figures here as a starting point for your own conversation with each vendor, not a final quote.
Conclusion About Behavioral Analysis Software
Every tool on this list solves a real problem, but not the same one. FullSession, FullStory, Google Analytics, Contentsquare, and Mixpanel each focus on a different piece of user behavior, from broad traffic reporting to deep, session-level detail.
Pick based on what your team struggles with today, whether that’s diagnosing bugs fast or looking to increase conversions:
- Diagnosing bugs and friction fast: FullSession or Contentsquare.
- Exploring large volumes of session data flexibly: FullStory.
- Tracking specific user actions and events: Mixpanel.
- Free, broad traffic reporting: Google Analytics.
If your team is still deciding, FullSession is a solid place to start. It brings session replay, heatmaps, funnel tracking, error alerts, and feedback into one workspace at a lower starting price than most of the enterprise-focused options on this list, so you’re not paying for capacity or seats you don’t need yet.
Not Ready for a Demo? See Your Own Data First.
Start a free trial and watch how FullSession shows real-time data from your own sessions and funnels.
FAQs About Behavioral Analysis Software
What is behavioral analysis software?
Behavior analysis software is a category of tools that record, track, and interpret how users interact with a website or app. It combines quantitative data like clicks and page views with qualitative context like session replay and heatmaps. Teams use it to identify friction, understand user journeys, and get higher conversion rates without relying on guesswork.
What is the best software for ABA?
ABA software refers to clinical practice-management platforms built for therapy providers and therapy goals covering client progress notes, billing services, and insurance billing workflows. These are different products from digital behavior analytics tools like the ones compared in this guide. If you need ABA-specific software, look for platforms built specifically for behavior analysts and therapy organizations.
Which AI is best for behavior analysis?
No single AI tool works best for every use case. Some, like FullSession’s Lift AI, focus on ranking website friction by revenue impact, while others specialize in clinical ABA data tracking or general-purpose analytics. The right choice depends on whether you’re analyzing digital user behavior or clinical behavioral data.
What are behavioral analytics tools?
Behavioral analytics tools are software platforms that track, record, and interpret how users interact with a website or app, such as clicks, scrolls, and session activity. They combine this data with visualizations like heatmaps and session replay to help teams understand and improve the user experience.

Roman Mohren is CEO of FullSession, a privacy-first UX analytics platform offering session replay, interactive heatmaps, conversion funnels, error insights, and in-app feedback. He directly leads Product, Sales, and Customer Success, owning the full customer journey from first touch to long-term outcomes. With 25+ years in B2B SaaS, spanning venture- and PE-backed startups, public software companies, and his own ventures, Roman has built and scaled revenue teams, designed go-to-market systems, and led organizations through every growth stage from first dollar to eight-figure ARR. He writes from hands-on operator experience about UX diagnosis, conversion optimization, user onboarding, and turning behavioral data into measurable business impact.