An e-commerce heatmap is a visual representation of how visitors interact with your store pages. It overlays color-coded behavior directly on your web page: red and orange mark the zones getting the most clicks, taps, and attention; blue and green reveal areas shoppers scroll past or ignore.
Standard analytics tells you what happened, not where on the page or why. A website heatmap closes that gap by turning raw website traffic data into a graphical representation you can read and act on in seconds.
This guide covers heatmap types, where to apply them in your conversion funnel, how to analyze the data, advanced tactics, technical setup, measurement, integrations, and compliance.
Key Takeaways
- There are four types worth knowing: click heatmaps, scroll heatmaps, mouse movement maps, and dynamic heatmaps. Dynamic heatmaps are the only type that work on cart and checkout pages with dynamic URLs, which makes them essential for any e-commerce team serious about conversion optimization.
- Apply e-commerce heatmaps across all four funnel stages (Category, Product Detail, Cart, Checkout), and you’ll identify patterns in visitor behavior that standard analytics simply can’t surface. A heat map turns a vague “high bounce rate” into a specific, fixable layout problem.
- Always segment by device before you analyze. Mobile users and desktop users behave differently on the same page, and aggregate heatmap data blends both into a picture that accurately reflects neither.
- Use heatmap insights to drive specific A/B tests, not general redesigns. The goal is to identify areas where visitor behavior signals a clear problem, form a testable hypothesis, and measure the outcome.
- Pair heatmaps with session replay to validate what you see before you act. A pattern in aggregate data becomes a confirmed finding when you watch real users reproduce it in a recording.
- Compliance isn’t optional. Any ecommerce website running heatmaps on checkout pages needs PCI DSS field masking, GDPR consent handling, and a clear data retention policy in place before going live.
Most heatmap tools give you the visual layer and nothing else. FullSession combines click maps, scroll maps, movement maps, and dynamic heatmaps with session replay, funnel analysis, error tracking, and Lift AI in one platform.
Every insight connects to a measurable business outcome, without jumping between tools or manually connecting the dots.
Book a demo with FullSession to see how it works.
Ecommerce Heatmap Types and When To Use Each One
There are four main types, each answering a different question about visitor behavior.
| Heatmap Type | What It Tracks | Best Ecommerce Use Case | Mobile? |
| Click heatmap | Every click and tap, aggregated | Add-to-cart buttons, broken links, call to action performance | Yes |
| Scroll heatmap | How far users scroll before leaving | Content placement, review visibility, fold analysis | Yes |
| Mouse movement / hover map | Cursor path and hover clusters (desktop only) | Hesitation near price, size guide, shipping info | No |
| Dynamic heatmap | All types on pages with dynamic URLs | Cart, checkout, order history, account pages | Yes |
Click heatmaps
Click heatmaps record every place users click or tap on a page and aggregate those user interactions across sessions. For ecommerce teams, they reveal three things:
- Where users click vs. where you want them to. If shoppers are clicking around your add-to-cart button rather than on it, you have a layout problem.
- Dead zones. Clicks on non-interactive elements mean visitors expect something to happen, and it doesn’t. A dead click kills purchase momentum fast.
- Rage clicks. When users repeatedly click the same spot, they’re frustrated. On a product image, it usually means shoppers want a zoom feature that doesn’t exist. On your checkout button, it often signals a payment error or slow page load.
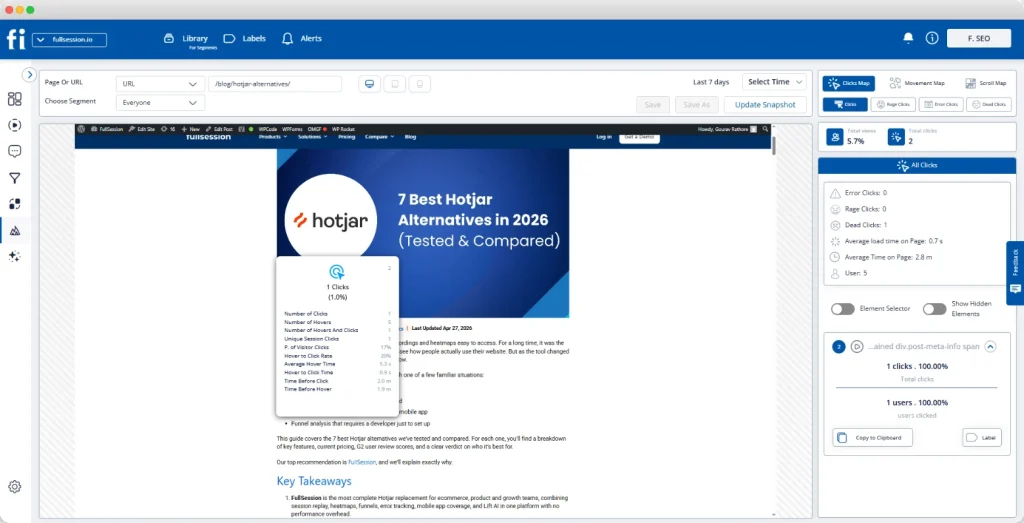
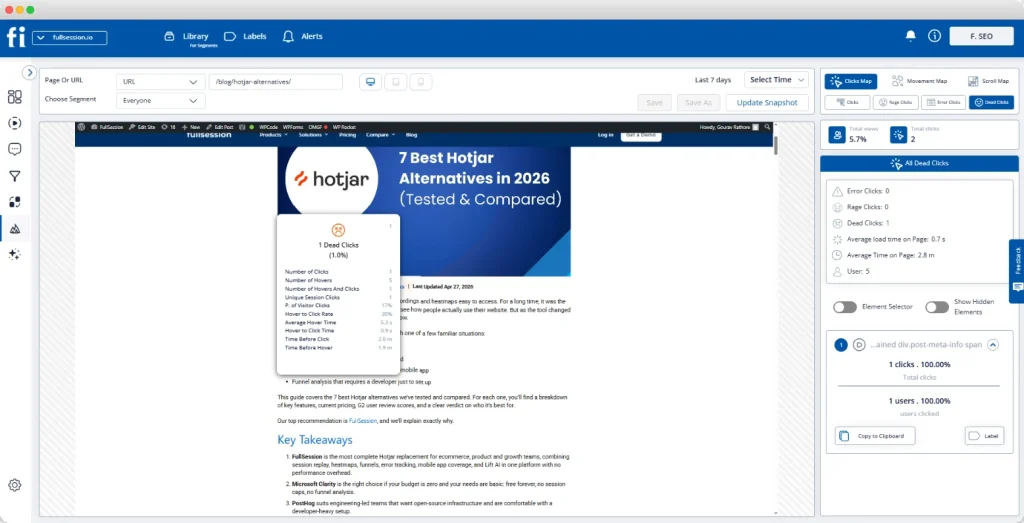
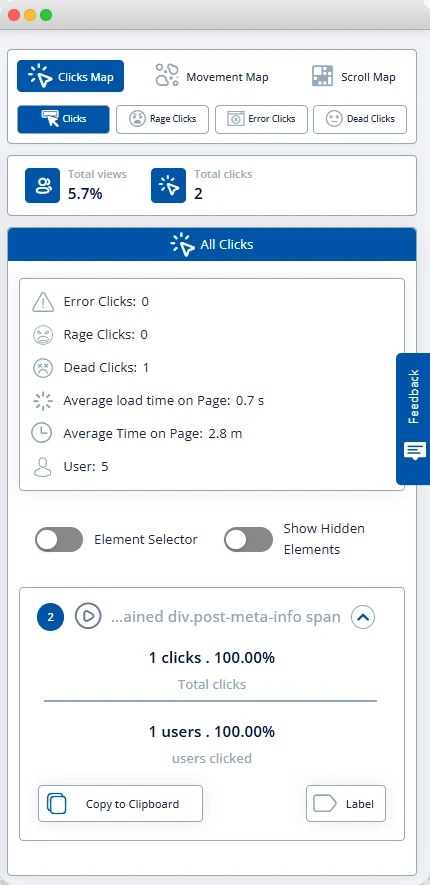
In FullSession, the Click Map view shows total clicks, rage clicks, error clicks, and dead clicks in a single right-hand panel.
You can toggle between signal types without leaving the heatmap view, and the panel displays click counts alongside average load time and average time on page.
Scroll heatmaps
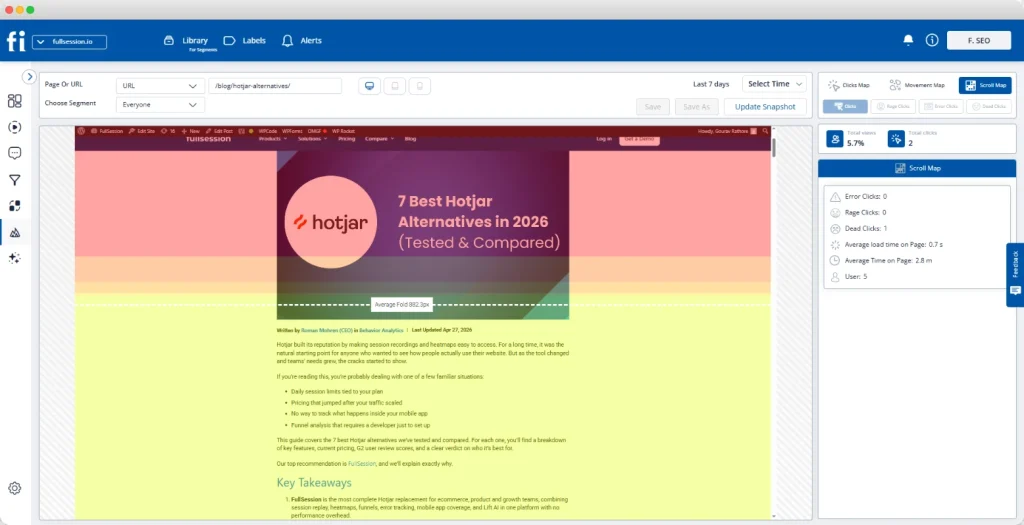
Scroll heatmaps show how far users scroll down a page before leaving. The top is always the hottest zone. A sharp color change marks where most visitors scroll no further.
Key page elements (product reviews, size guides, shipping details, and the call to action) are often positioned below where most visitors stop scrolling. That means your target audience never sees the content you need them to see.
FullSession’s Scroll Map automatically marks the average fold line, showing a warm red zone at the top that transitions to yellow, then cool to green below the fold.
You can see this across both desktop heatmaps and mobile devices.
Mouse movement heatmaps and hover maps
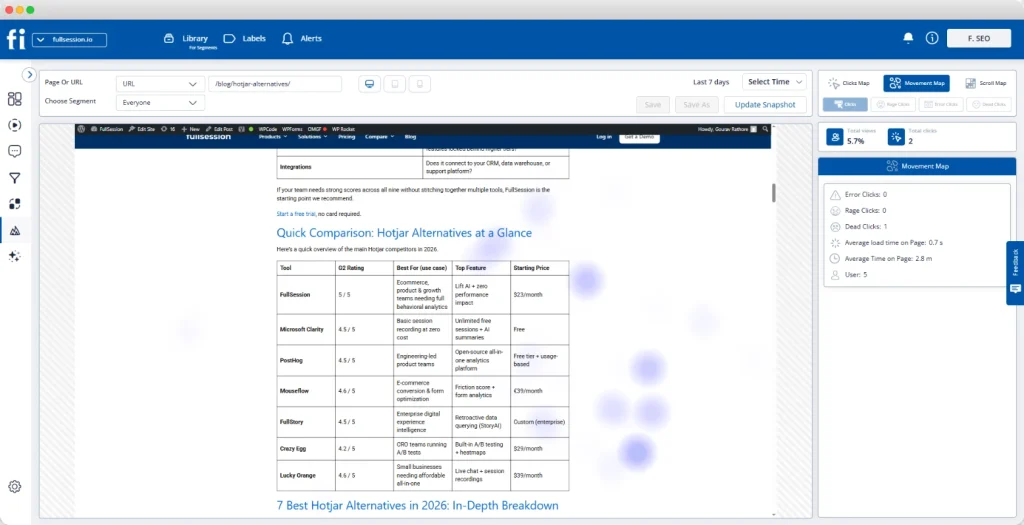
Hover maps track cursor movement on the desktop to identify areas where users linger without clicking. Unlike eye tracking, which involves tracking eye movements with specialist hardware, hover maps use cursor data as a proxy for attention.
Cursor clusters near a price element without a corresponding click mean shoppers are pausing to evaluate. Clusters near a return policy link confirm that information is a genuine decision point.
FullSession’s Movement Map displays these clusters as soft purple blur spots, and they work best as a supporting signal alongside click and scroll data.
One thing to keep in mind: hover maps only capture desktop user behavior. Mobile users don’t generate hover events, so always analyze the mobile experience and desktop heatmaps separately.
For a deeper breakdown of how these three core types compare, see our guide to click, scroll, and movement heatmaps.
Dynamic heatmaps
Most ecommerce teams overlook dynamic heatmaps. That’s a mistake, because they cover the pages where revenue is won or lost.
Standard heatmaps work on static pages with fixed URLs. Your cart, checkout steps, and order history all use dynamic URLs that change per session, and a static heatmap can’t track them.
Dynamic heatmaps solve this by grouping all URL variants that match a defined pattern into a single, readable view.
FullSession handles dynamic URL grouping natively. Configure a pattern once, and it aggregates all matching sessions into one heatmap.
Apply E-commerce Heatmaps Across Your Conversion Funnel
The highest return comes from applying e-commerce heatmaps systematically across four pages. Think of it as the e-commerce heatmap funnel audit: Category, Product Detail, Cart, Checkout.
Category and collection pages
Goal: help shoppers find and commit to a product quickly.
- Scroll signal: A sharp drop-off after the first row means visitors aren’t browsing. They land, fail to find what they want immediately, and leave.
- Click signal: No activity on filter and sort controls usually means those elements are poorly positioned, not unwanted.
- Dead zone signal: Clicks on product thumbnails that don’t generate PDP traffic indicate a broken link, a direct revenue leak that’s invisible without a click heatmap.
Use the scroll map and the click map together. Collect at least 2,000 sessions per device type before drawing conclusions.
Product detail pages
- Scroll signal: If fewer than 40% of visitors reach your product reviews, moving reviews above the fold is almost always worth testing first.
- Dead click signal: Repeated clicks on a size or color selector that register as dead clicks mean the selector isn’t responding. This is one of the most common friction points on apparel and footwear ecommerce sites.
- Hover signal: Cursor clustering near shipping estimates or return policy text on desktop confirms those elements are active decision points. Make them easier to find.
FullSession lets you link directly from a heatmap click cluster into session replay filtered to the same segment, so you can watch the exact moment a shopper hits the friction.
That’s how quantifying the revenue impact of each friction point becomes possible.
Learn more about heatmaps vs session replays.
Cart page
Goal: maintain purchase intent and move shoppers to checkout.
- Product image clicks: Shoppers clicking cart product images are rechecking their choice. Link those images back to the PDP.
- Coupon field rage clicks: Repeated attempts on a discount field mean the field is broken, or code failures have no clear feedback.
- Scroll drop-off before checkout: On smaller screens, mobile users who don’t scroll to the checkout call to action simply never see it.
Cart pages require dynamic heatmaps. FullSession handles URL pattern matching automatically for all cart sessions.
Checkout page
Goal: complete payment with minimum friction.
- Click signals: Rage clicks on form fields indicate unclear labels or broken validation. A cluster directly on the “Pay Now” button typically signals a payment processing error.
- Scroll signals: Visitors who don’t scroll to the payment section may be blocked by a form field error they can’t see.
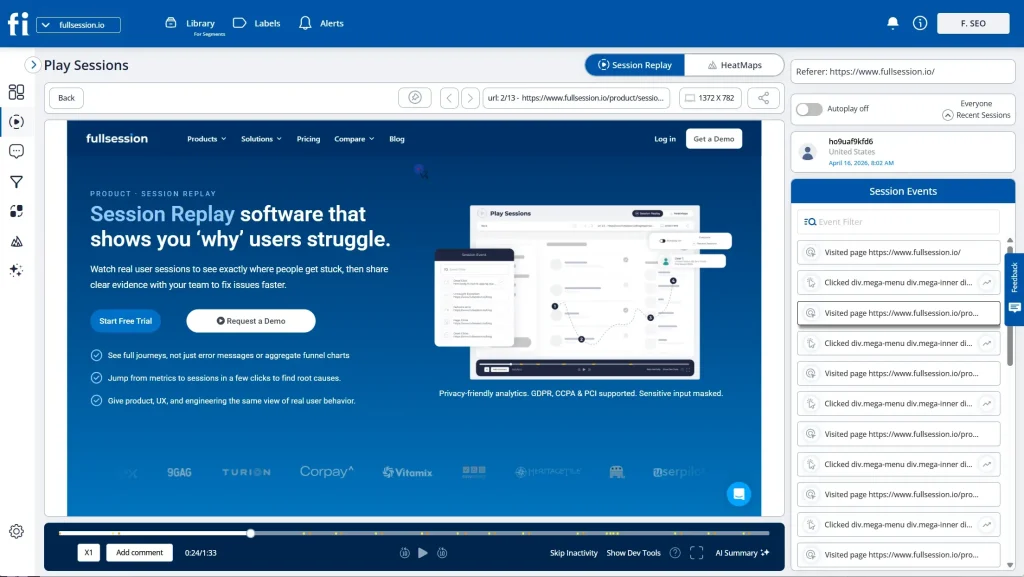
- Session replay bridge: When a heatmap shows an anomaly, move into session replay tools. FullSession’s replay view shows the full page recording alongside a timestamped session event timeline, so you can identify exactly what broke and why.
For a full breakdown of how to apply these signals specifically to checkout pages, see heatmap insights for checkout optimization.
Start a free trial to see these tools in action on your actual pages.
Analyze Heatmap Data To Find Friction Points
Heatmaps show what’s happening. Interpreting what it means is where most teams go wrong.
Step 1: Segment before you analyze
Filter by device type first. Mobile and desktop behavior look completely different, and aggregate data blends both. Then segment by traffic source and new versus returning visitors.
Step 2: Identify the pattern type
A hot zone near an important element means engagement. A hot zone near a non-interactive element means confusion. A dead zone on a CTA means a visibility problem. Rage clicks mean broken expectations. Name the pattern type before assigning meaning to it.
Step 3: Map the pattern to a business outcome
A dead click on a product image only matters if product detail page traffic is low. A rage click on a coupon field only matters if checkout abandonment is high at that step. Proximity to a commercial decision point determines priority.
Step 4: Form a specific hypothesis
State the observation, the mechanism, and the predicted outcome. For example: “The scroll heatmap shows that most mobile visitors stop before reaching the add-to-cart button. Moving add-to-cart above the fold on mobile should increase the product-detail-to-cart rate.”
Step 5: Validate with session replay before testing
Watch 10 to 15 recordings from visitors who show the pattern. A scroll drop-off that looks like a UX issue may turn out to be a broken image causing a layout collapse on certain screen sizes, which is a technical fix rather than a design test.
Heatmaps give you both qualitative and quantitative data. The visual pattern shows where; click counts and scroll percentages tell how often. Together, they give you what analytics dashboards and user interviews alone can’t.
For a complete guide to interpreting signals, read how to read heatmap signals accurately.
If you’ve completed this process and want to move into structured testing, see a prioritized CRO test plan built from ecommerce heatmap data.
Run A/B Tests Driven by Heatmap Insights
Heatmaps are most valuable when they drive specific tests, not general redesigns. Here’s how heatmap insights map directly to testable ideas to help you optimize your store:
- Layout test: Scroll heatmap shows most mobile visitors stop before reaching the add-to-cart button. Test: move add-to-cart to a sticky bar visible throughout the scroll.
- CTA test: Click heatmap shows cursor lingering near “Add to Cart” on desktop, but click-through rate is low. Test: add micro-copy directly below the button, such as “Free returns within 30 days,” and measure the change.
- Form fix: Rage clicks cluster around billing address fields. Session replay confirms phone number validation errors. Test: accept multiple phone formats and add inline error messages field by field.
- Navigation test: Filter panel shows a dead zone on mobile. Test: move filters to a horizontal bar above the product grid and measure pages-per-session and add-to-cart rate.
Always collect at least 2,000 sessions per device type before taking action. Low-traffic pages need 30-day collection windows. Acting on fewer than 500 sessions is the fastest way to reach a confident but wrong conclusion.
Compare E-commerce Heatmap Tools
Not all heatmap tools handle e-commerce use cases equally. The table below covers the five platforms most commonly evaluated for online stores. Choosing the right one has a direct impact on website performance monitoring at the funnel level.
| Tool | Dynamic URL support | Mobile coverage | Session replay | Free tier | PCI masking |
| FullSession | Yes (native) | Yes | Yes (built-in) | Yes | Yes (script level, configurable rules) |
| Hotjar | Yes, via URL targeting and heatmap screenshot updates, with setup limits | Yes | Yes | Yes | Partial (PCI compliant, no explicit field masking noted) |
| Microsoft Clarity | No | Yes | Yes | Yes (unlimited) | No (auto-masks some inputs, not PCI-specific) |
| Crazy Egg | Yes, via URL targeting, with support for dynamic content and SPAs. | Yes | Yes | No | No (masks inputs, PCI via processor) |
| VWO | Yes | Yes | Yes | No | Partial (PCI Level 2 compliant) |
Use Advanced Dynamic Heatmap Tactics
Once your core heatmap setup is running, these tactics help you get more out of the data on pages and traffic segments that most teams never look at closely enough.
Consolidate cart sessions into one view
The most useful dynamic heatmap setup for e-commerce teams is URL pattern matching on the cart page. Instead of scattered individual sessions, you see aggregate behavior across all cart visits: which product images get the most attention, where coupon attempts fail, and where users scroll to.
Track carousel and slider engagement
Many e-commerce homepages and category pages use rotating banners to promote products. Standard heatmaps can’t track what happens as the carousel advances.
Dynamic heatmaps capture engagement with each slide state, revealing whether shoppers click through to promoted products or only engage with the default slide.
This is often how teams discover their banner is generating zero website traffic to the items it features.
Use hover maps as hesitation indicators
On high-consideration product pages (high-price items, subscriptions, configurable products) hover maps are most useful on desktop. Cursor clustering near a price element without a click means shoppers are pausing.
Rather than removing the element, make the information it carries more visible. Display monthly payment options next to the full price. The hesitation tells you what to fix.
Compare heatmaps across traffic sources
Shoppers from Google Shopping behave differently from email subscribers arriving on the same page. Paid traffic typically has higher purchase intent but less brand familiarity.
Segment your heatmaps by traffic source before setting a hypothesis; otherwise, a fix that works for paid visitors looks inconclusive when measured against all traffic.
Validate releases with before-and-after heatmaps
Every time your team ships a meaningful layout change, run a new heatmap cycle for at least two weeks before declaring success. Redesigns frequently optimize one metric while creating new friction elsewhere.
A before-and-after comparison shows the full picture that conversion rate alone obscures.
Follow Technical Best Practices for Reliable Data
A heatmap tool running without proper setup generates misleading data. These five requirements are non-negotiable:
- Install via tag manager. Add the FullSession script through Google Tag Manager or your platform’s native integration: Shopify, BigCommerce, WooCommerce, WordPress, or Wix. Setup takes under five minutes and requires no direct theme code changes.
- Set minimum sample thresholds. Don’t act until a page has at least 2,000 sessions per device type. High-traffic pages reach this in days. Slower pages need a 30-day window.
- Configure dynamic URL grouping. Set URL patterns like /cart/* or /checkout/step/* for cart and checkout pages. Without this, each session generates an orphaned heatmap too small to be useful.
- Mask sensitive fields. Payment card numbers and CVV inputs are masked at the script level and never transmitted. Verify masking is active on every checkout page before going live. See our data masking best practices for a full configuration checklist.
- Refresh baselines after releases. Historical data reflects the old layout. Create a clean baseline the day a redesign goes live. FullSession lets you compare snapshots side by side.
Start a free trial with no credit card required and begin collecting data on your live pages today.
Measure Impact on Conversions and Customer Experience
Running ecommerce heatmaps without measurement turns them into activity rather than results.
Track these metrics after every heatmap-driven change:
- Conversion rate before and after: Compare checkout completion rate and add-to-cart rate over 14-day windows on each side of the change. Use page-level goals, not site-wide conversion rate.
- Revenue per visitor: More reliable than conversion rate alone because it captures average order value changes alongside conversion rate shifts.
- Rage click and dead click frequency: After fixing a broken element, track whether frustration signals drop in the next heatmap cycle. A reduction confirms that the fix resolved the actual problem.
- Scroll depth to target element: After repositioning content, confirm in the next heatmap that more users scroll to reach the element. If scroll depth improves but conversion stays flat, the content (not the position) is the real barrier.
- Funnel drop-off rate: Pair heatmaps with funnel analysis to move from “this area has friction” to a specific step, a percentage, and an estimated monthly revenue impact. That’s how you build the business case for your optimization efforts and prioritize them above everything else on the roadmap.
Integrate Heatmaps With Session Replay and AI Prioritization
FullSession is a full behavioral analytics platform, not a standalone website heatmap tool. E-commerce heatmaps are the entry point into a broader workflow.
Platform integrations
FullSession integrates natively with Shopify, BigCommerce, WooCommerce, WordPress, and Wix. It works alongside GA4: GA4 provides quantitative traffic data, while FullSession adds the qualitative behavioral layer on the same pages.
For experimentation, FullSession integrates with Optimizely so you can see not just which A/B variant won, but how visitors interact differently with each version.
Session replay
When a heatmap shows an anomaly, move directly into session replay. This happens inside FullSession without leaving the platform.
The replay interface shows the full page recording on the left and a timestamped session event timeline on the right, including every page the visitor navigated.
This is how “something is wrong at checkout step 3” becomes “Android Chrome users are hitting a JavaScript error that blocks form submission.”
Lift AI
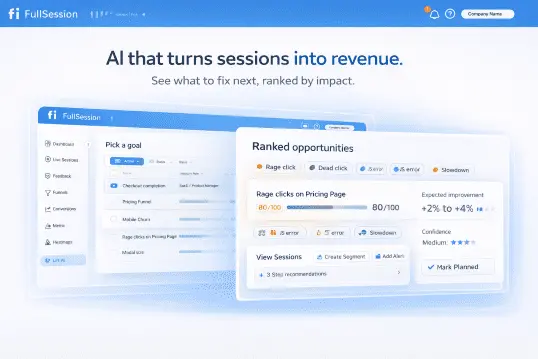
FullSession’s Lift AI is an AI agent that scans heatmaps, session replays, funnels, and error data together, then ranks friction issues by severity and predicted revenue impact.
The dashboard shows issues sorted into Severe, High, Medium, and Low, each with the affected page, issue type, funnel step, and predicted lift. Once you apply the fix, Lift AI validates the result.
You’re not choosing between fixing the cart page and the PDP on gut feel. You’re working from a ranked, evidence-backed list ordered by expected impact on website performance and more sales.
Error tracking
When a rage click cluster appears on a checkout button, it may be a UX problem or a JavaScript error silently blocking form submission.
FullSession’s error tracking connects JS errors and failed API calls to the sessions and heatmap patterns where they occur. Your engineering team sees the error, the session that triggered it, and the behavioral impact, all in one place.
Follow Privacy and Compliance Requirements
Ecommerce heatmap tools operate under stricter privacy requirements than most other website analytics. FullSession is built with compliance as a default, not an add-on.
- GDPR: Your tool should integrate with consent management platforms and capture behavioral data only from visitors who have provided consent. EU data residency options should be available.
- CCPA: Visitors who have exercised opt-out rights must be excluded from tracking automatically. No California resident session data should be shared with third parties.
- PCI DSS: Payment card numbers and CVV inputs must be masked at the tracking script level and never transmitted. Verify masking is active on every checkout page before launch.
- Data retention: Set a 30 to 90-day window matching your optimization cycle. Shorter windows keep data current with the live layout of your store.
- Ethical data collection: Confirm your tool doesn’t track users across other websites, doesn’t use behavioral data for advertising, and doesn’t share session data with third parties outside your configured integrations.
Conclusion About E-commerce Heatmaps
Your analytics tells you shoppers are leaving. Ecommerce heatmaps show you where, and that’s the difference between guessing at fixes and knowing which ones to make.
Click maps, scroll maps, movement maps, and dynamic heatmaps give you the visual layer. Paired with session replay, funnel analysis, and error tracking, every pattern connects to a specific fix and a measurable result. Used consistently, they’re the most direct path to more sales without increasing your ad spend.
Book a demo to see how it works on your store, or start a free trial and begin collecting data today.
FAQs About E-commerce Heatmaps
What is a heatmap in e-commerce?
An e-commerce heatmap is a visual representation of how visitors interact with your store pages. It overlays color-coded user interactions (clicks, scroll depth, mouse movement) onto a screenshot of your web page. Red indicates high interaction; blue shows areas users ignore. Ecommerce teams use heatmap insights to identify areas of friction on product, cart, and checkout pages and to drive conversions without guesswork.
Can ChatGPT create heatmaps?
No. Heatmaps require actual behavioral data from real visitors on your ecommerce site. ChatGPT has no access to your website traffic or user interactions. A tool like FullSession embeds a tracking script that captures real clicks, scroll depth, and mouse movements, then visualizes those user experiences as a color-coded overlay on your live pages.
Can heatmaps be misleading?
Yes. A red hotspot can mean engagement or confusion, depending on whether the element is interactive. Aggregate data can also hide mobile-specific problems: a pattern that looks healthy on a desktop may signal serious friction for mobile users on smaller screens. Always segment by device and validate patterns with session replay before acting on heatmap data.
What is the purpose of a heatmap?
A heatmap makes visitor behavior visible. It transforms raw user interactions into a color-coded overlay so ecommerce teams can instantly identify patterns: where shoppers focus, what they ignore, and where they get stuck. This replaces guesswork with visual evidence, helping teams identify areas to test and fix for maximum impact on conversion rate and customer experience.

Roman Mohren is CEO of FullSession, a privacy-first UX analytics platform offering session replay, interactive heatmaps, conversion funnels, error insights, and in-app feedback. He directly leads Product, Sales, and Customer Success, owning the full customer journey from first touch to long-term outcomes. With 25+ years in B2B SaaS, spanning venture- and PE-backed startups, public software companies, and his own ventures, Roman has built and scaled revenue teams, designed go-to-market systems, and led organizations through every growth stage from first dollar to eight-figure ARR. He writes from hands-on operator experience about UX diagnosis, conversion optimization, user onboarding, and turning behavioral data into measurable business impact.