The first step in optimizing your web presence is understanding website visitors’ click patterns.
You can view click maps to learn how many people clicked on each section of your website and if they found what they were looking for. Click map data will help you understand your audience and allow your company to make further improvements.
There are different types of customer behavior tools. A click map is one of the most effective forms of data visualization, as it breaks down user actions into easily digestible chunks. It helps you uncover details about user behavior that you might otherwise miss.
But what click map software should you use? With dozens of options available, it can be difficult to find one that’s worth every penny.
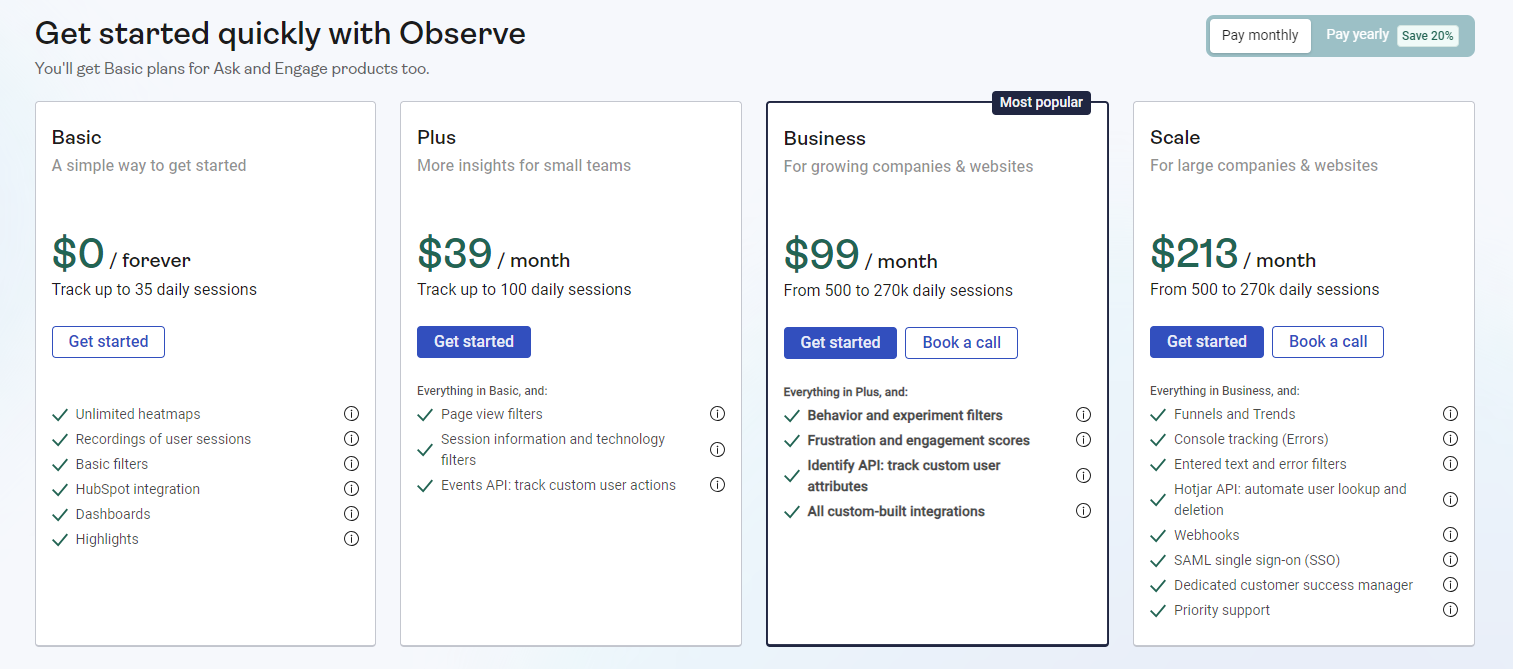
You’re in luck. With FullSession, you can visualize user behavior and track dynamic elements on your website via click maps, scroll maps, and mouse movements at an affordable price, starting at $39 per month. An annual subscription includes a 20% discount on all plans.
Want to see how these features work?
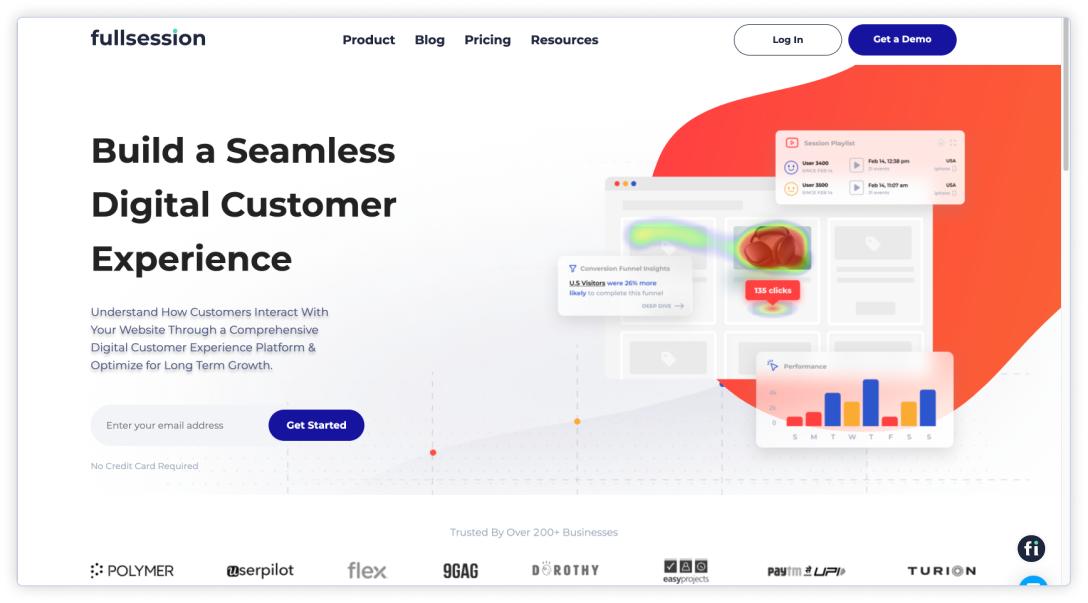
Improve Your Website UX and UI With FullSession
Learn how our interactive heat maps help you find cold spots and dead zones on your site.
In this article, we’ll show you how to use FullSession to create click maps and analyze user behavior data to optimize your website and boost traffic, leads, and conversions.
Before that, let’s explain what click maps are, how they work and which benefits they offer.
What Are Click Maps?
It’s not enough to have beautiful websites or landing pages. You must create a meaningful and memorable experience for the customer that includes quick loading times, error-free page elements, and flawless navigation.
You need to listen to your users and focus on their satisfaction. Click maps are a great way to do this—they’re easy to create, and they’re invaluable for uncovering opportunities to improve your customers’ experience.
Click maps show user behavior trends and patterns and provide visual insights into how your website works in real time, which page elements perform the best, and where you need to improve your UI or UX.
You can use this quantitative data to improve your site content or layout, marketing, sales, or development efforts, increasing your conversion rate. You can also aggregate click behavior data with other heat maps for further conversion rate optimization.
How Do Click Maps Work?
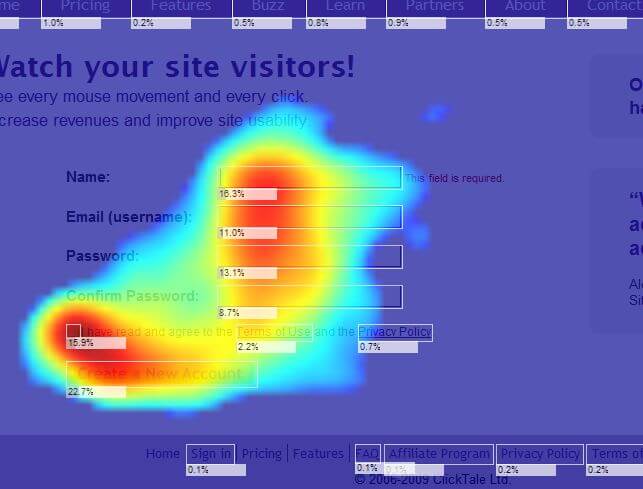
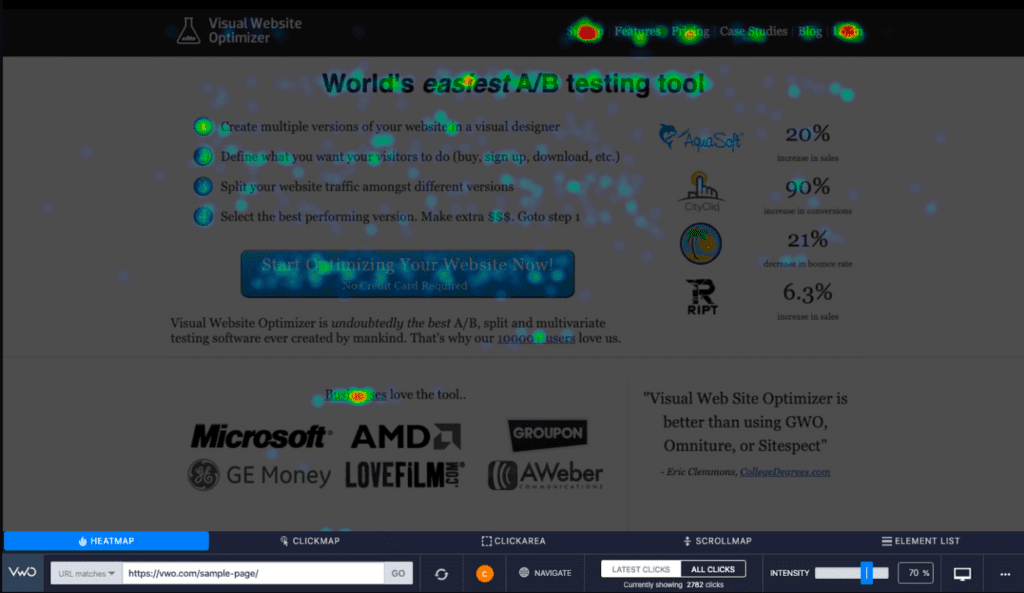
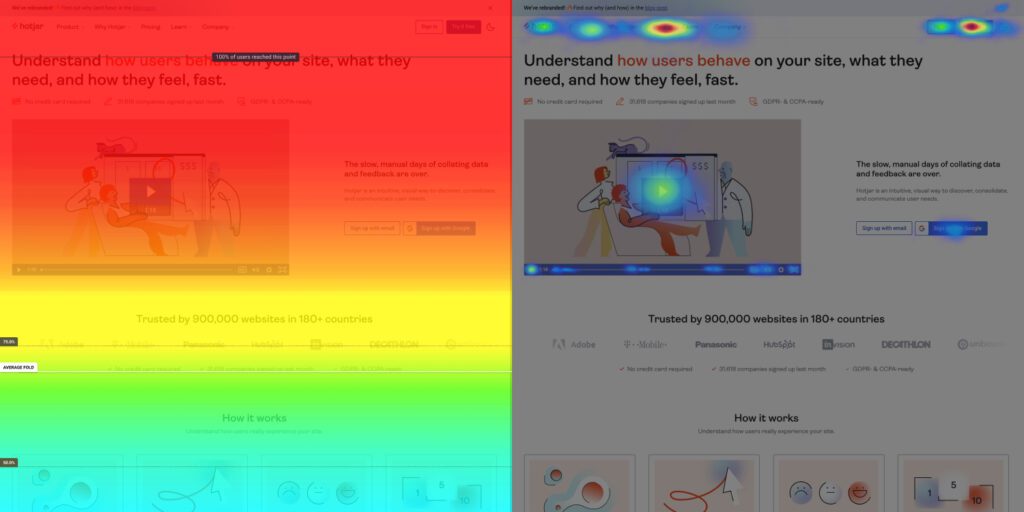
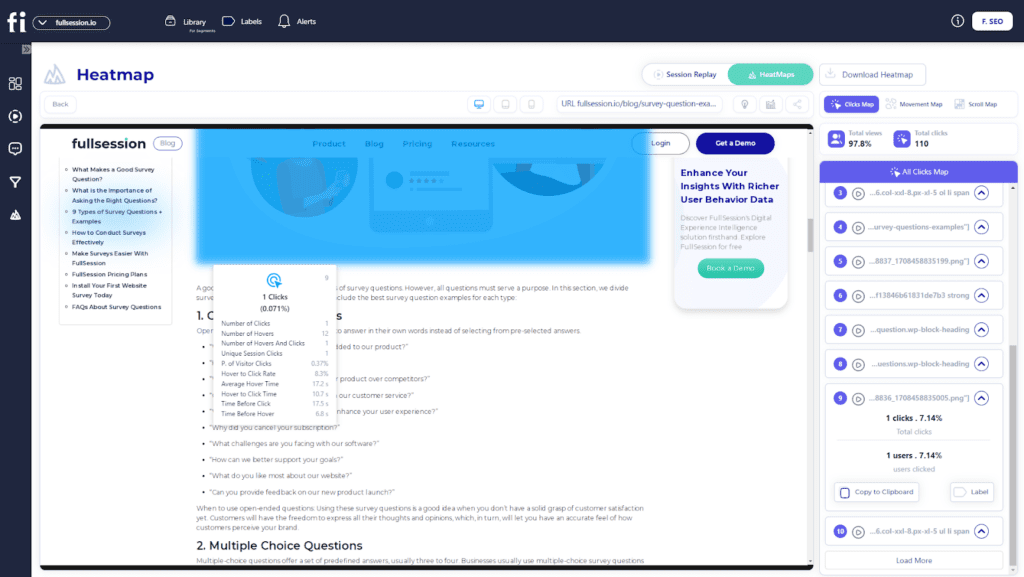
The basic principle behind click heatmaps is simple: Every time someone clicks on an element on your website, web app, or landing page, the click tracking tool records that action and assigns it a unique identifier. It then displays user data in a graphic report, using a color scale to help you visualize user interactions.
The most popular web page elements have the highest color intensity, while elements that receive little or no attention are at the darker end of the color spectrum, usually blue.
This way, you can quickly identify which content is well-received by customers and make adjustments to either replicate that content on other pages or optimize it for higher customer engagement.
Some click maps also allow you to filter results by specific pages or sources, such as organic search or inbound links, which helps you pinpoint specific areas for improvement, increase website traffic, or decrease bounce rate.
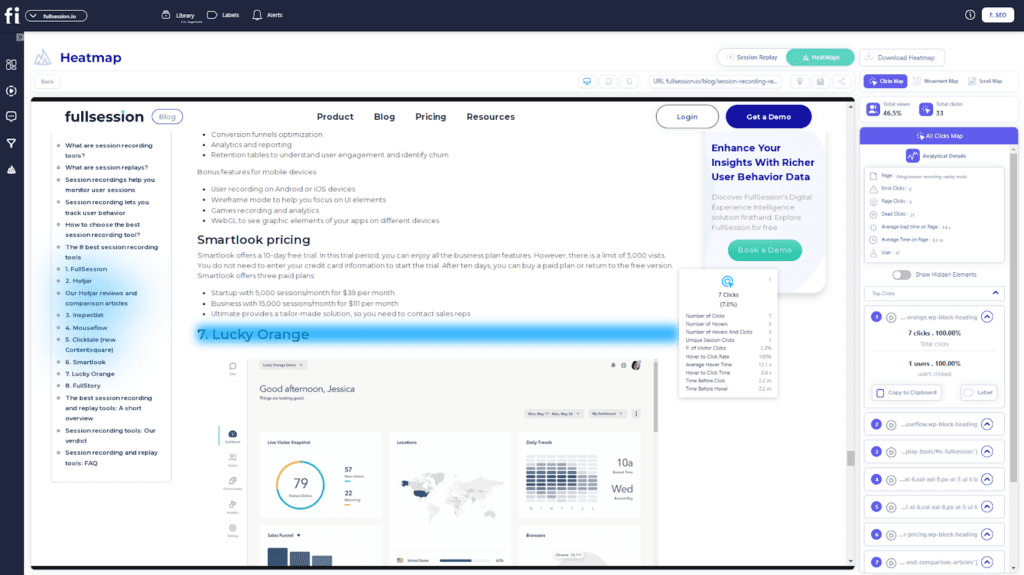
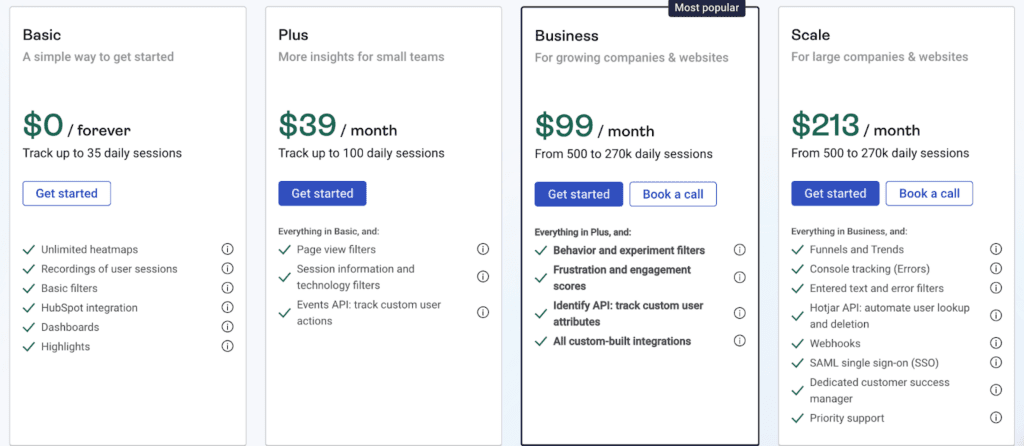
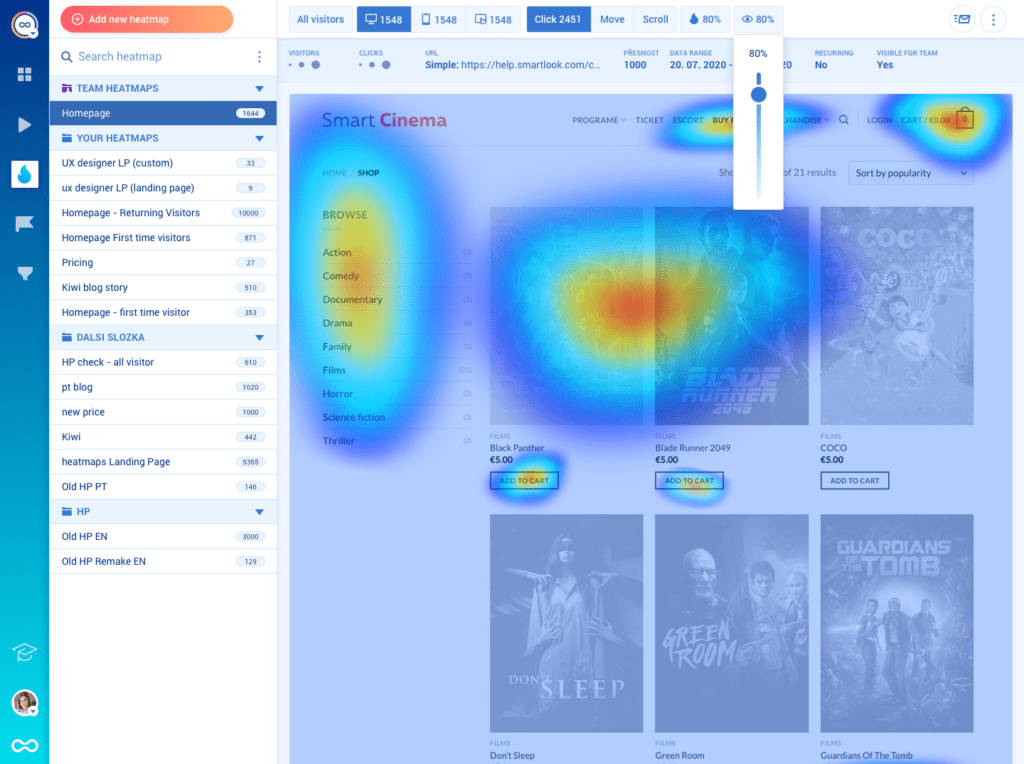
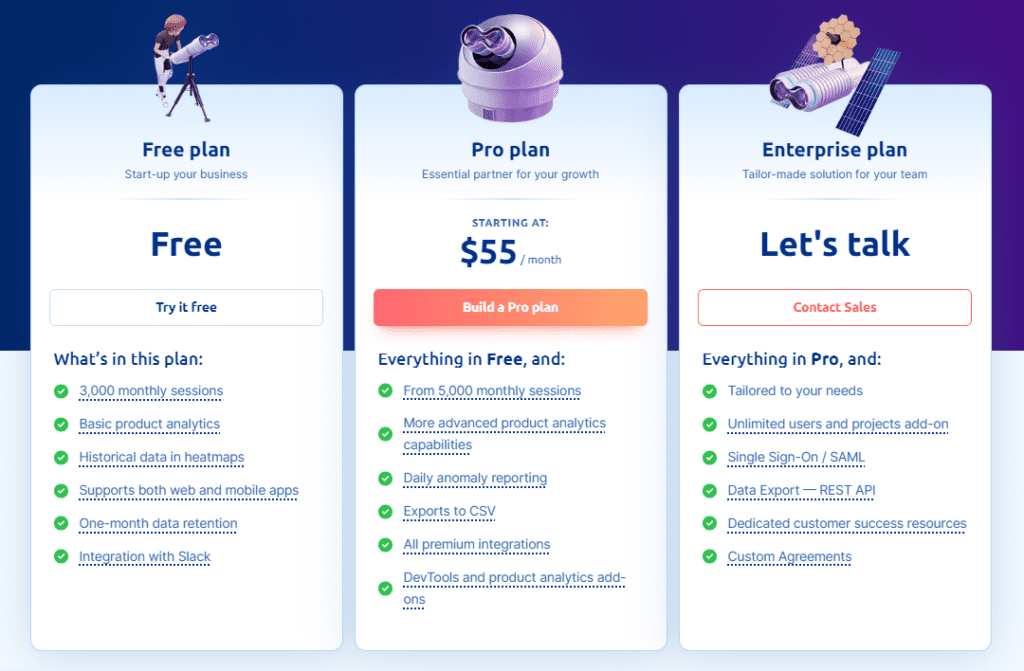
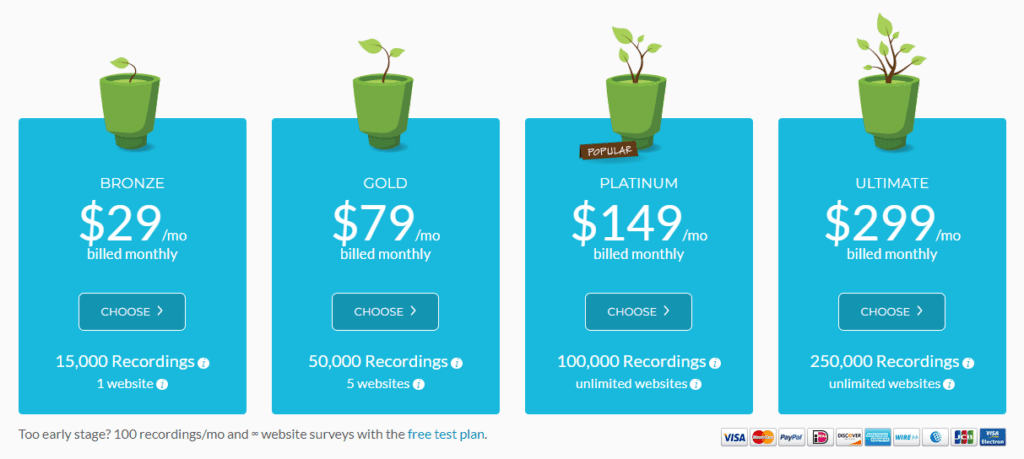
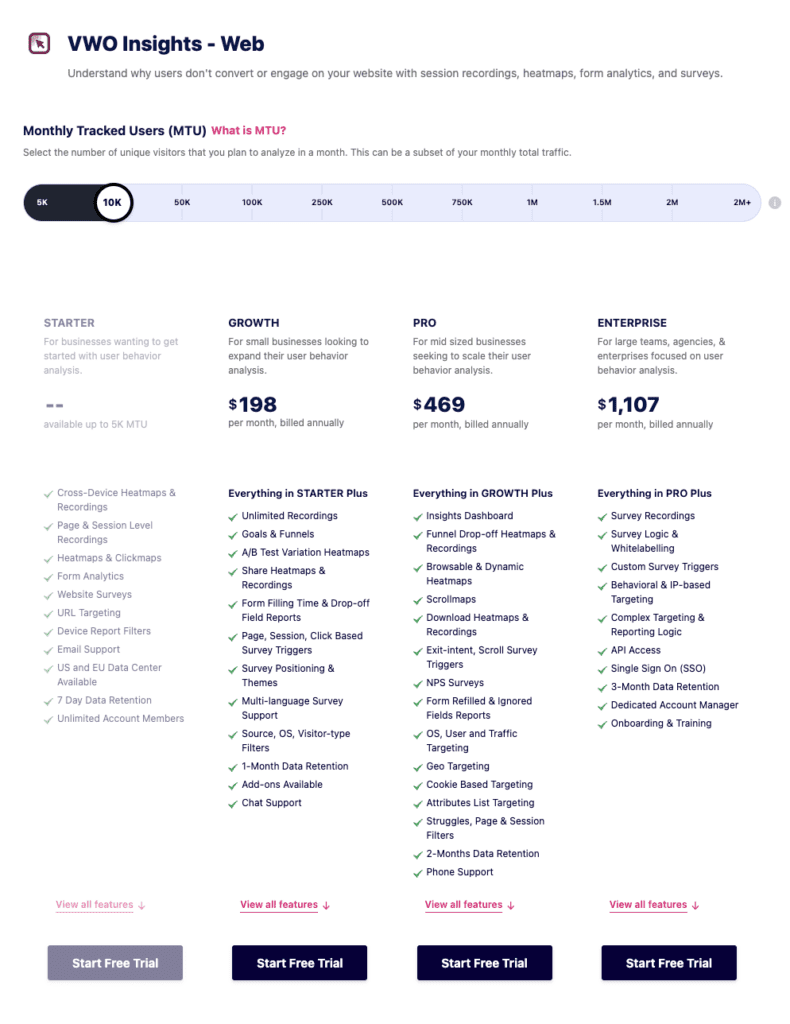
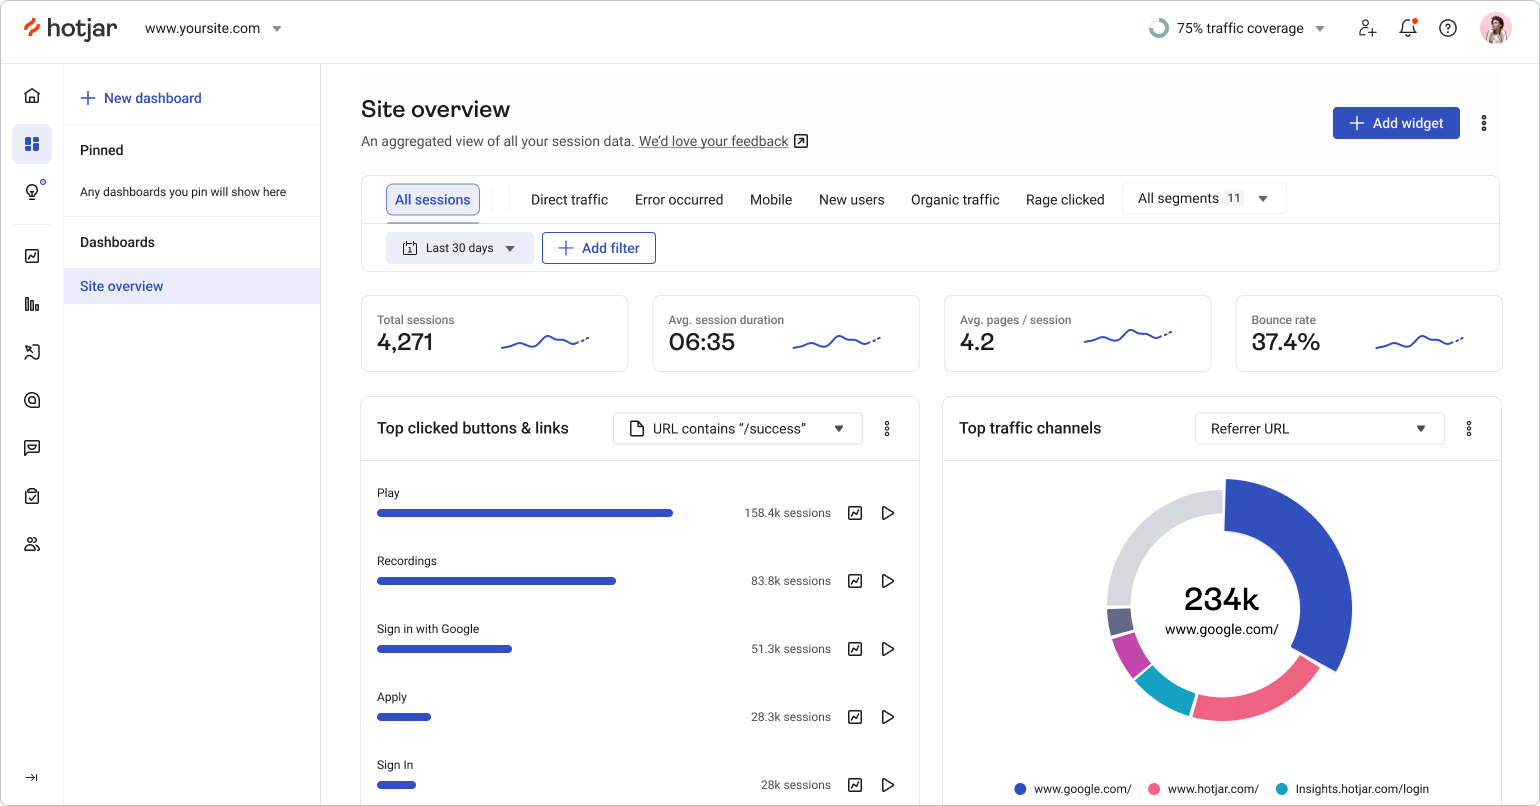
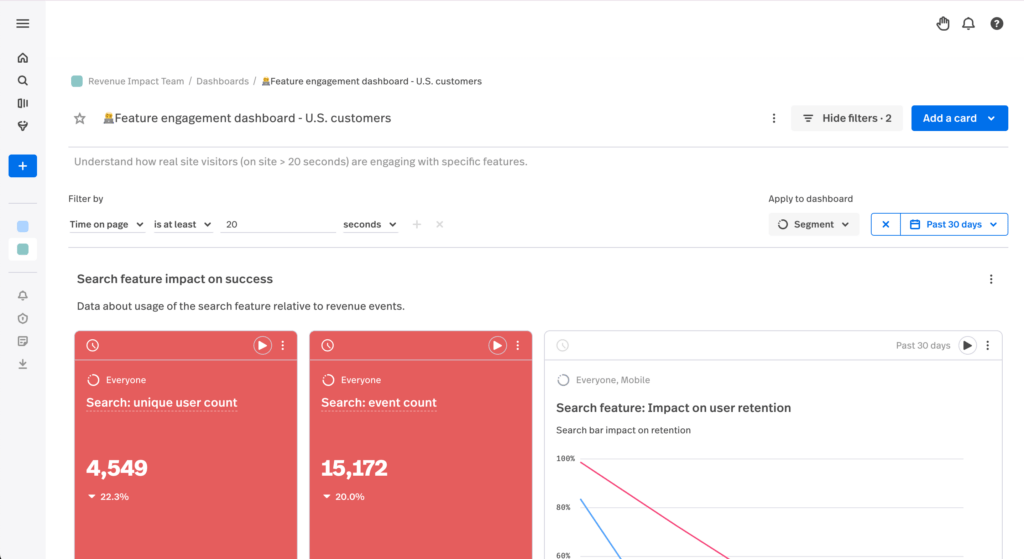
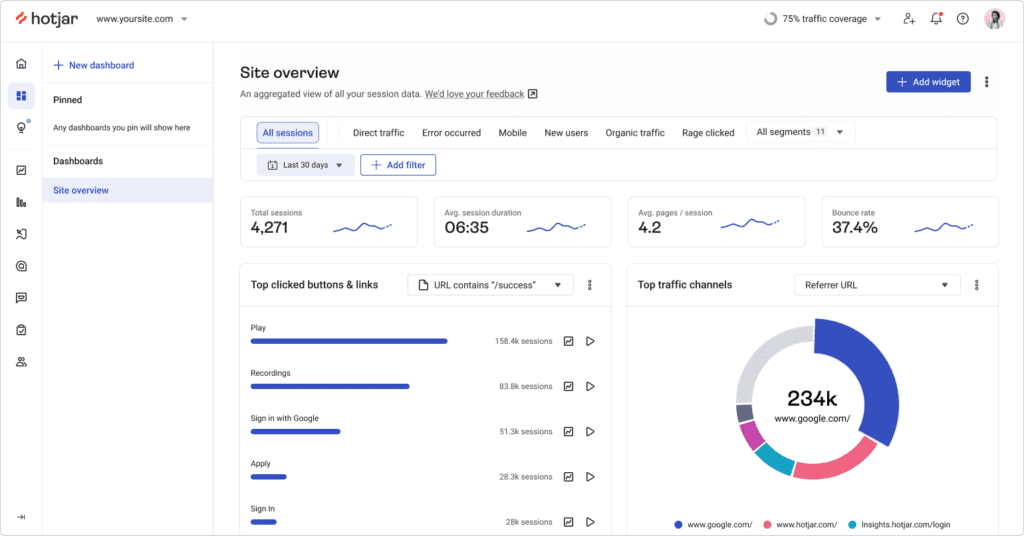
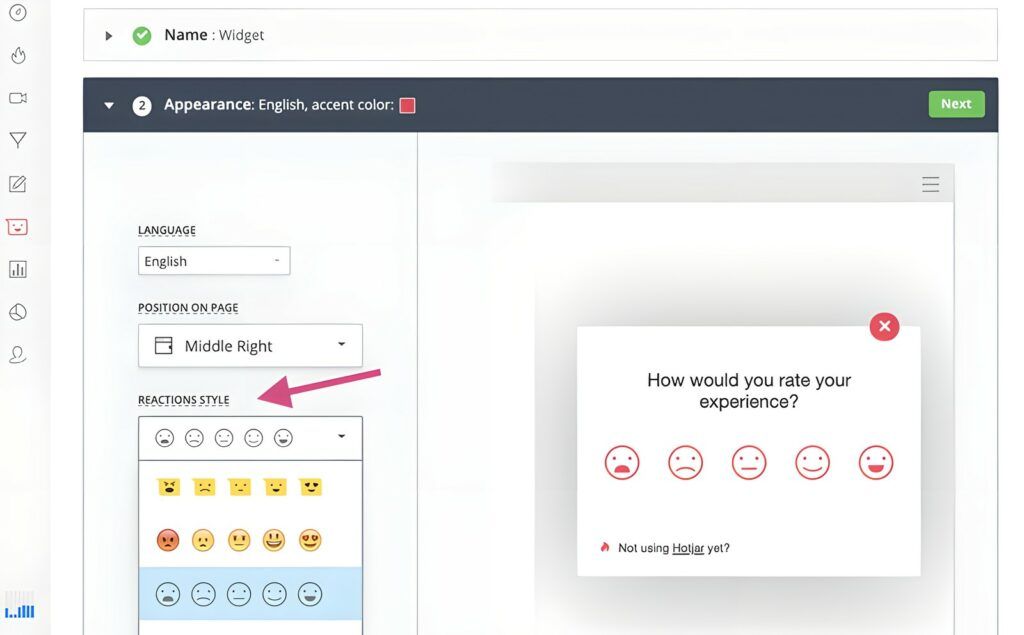
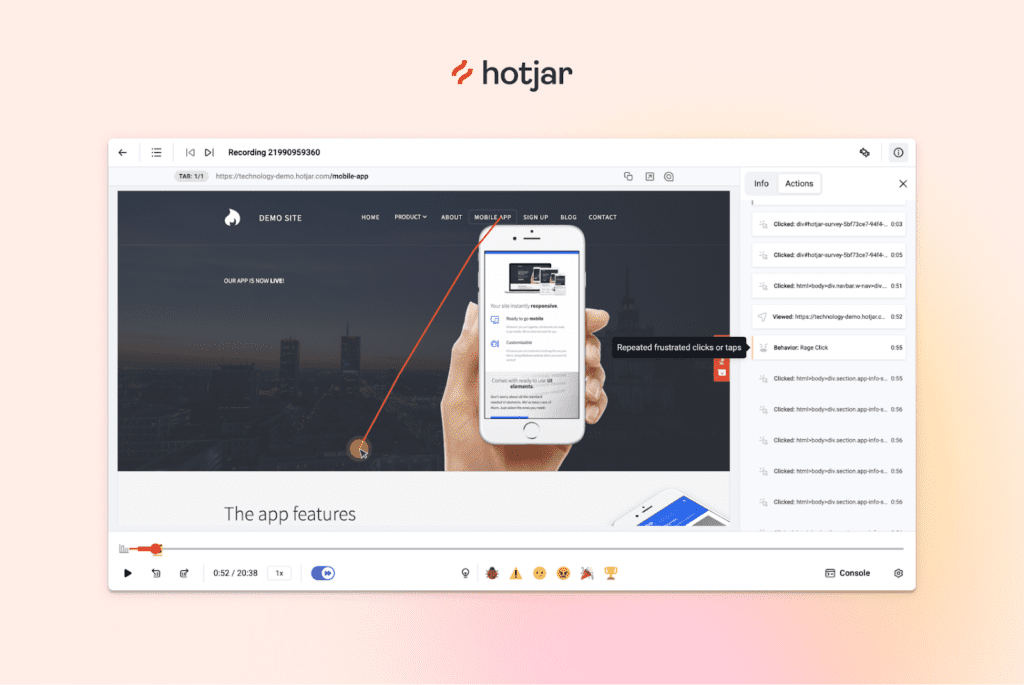
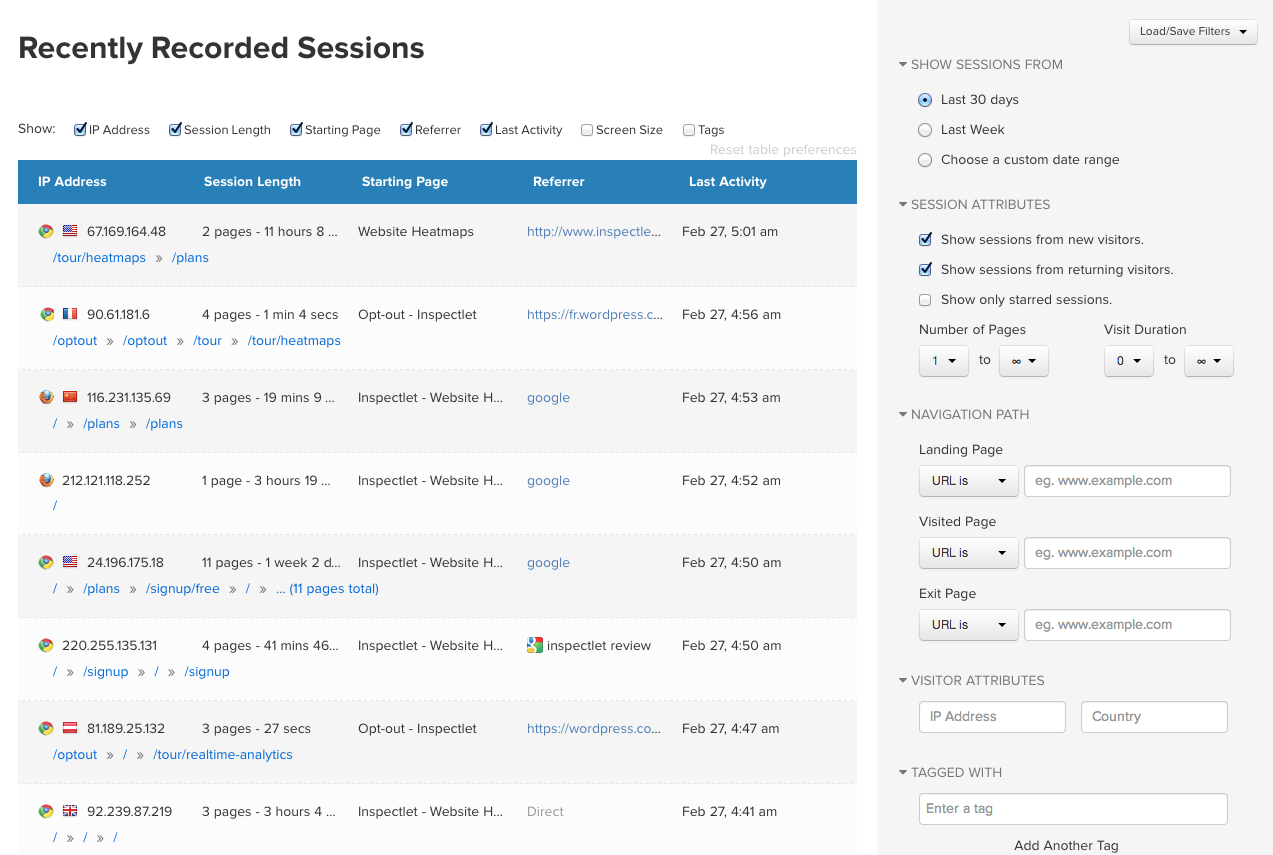
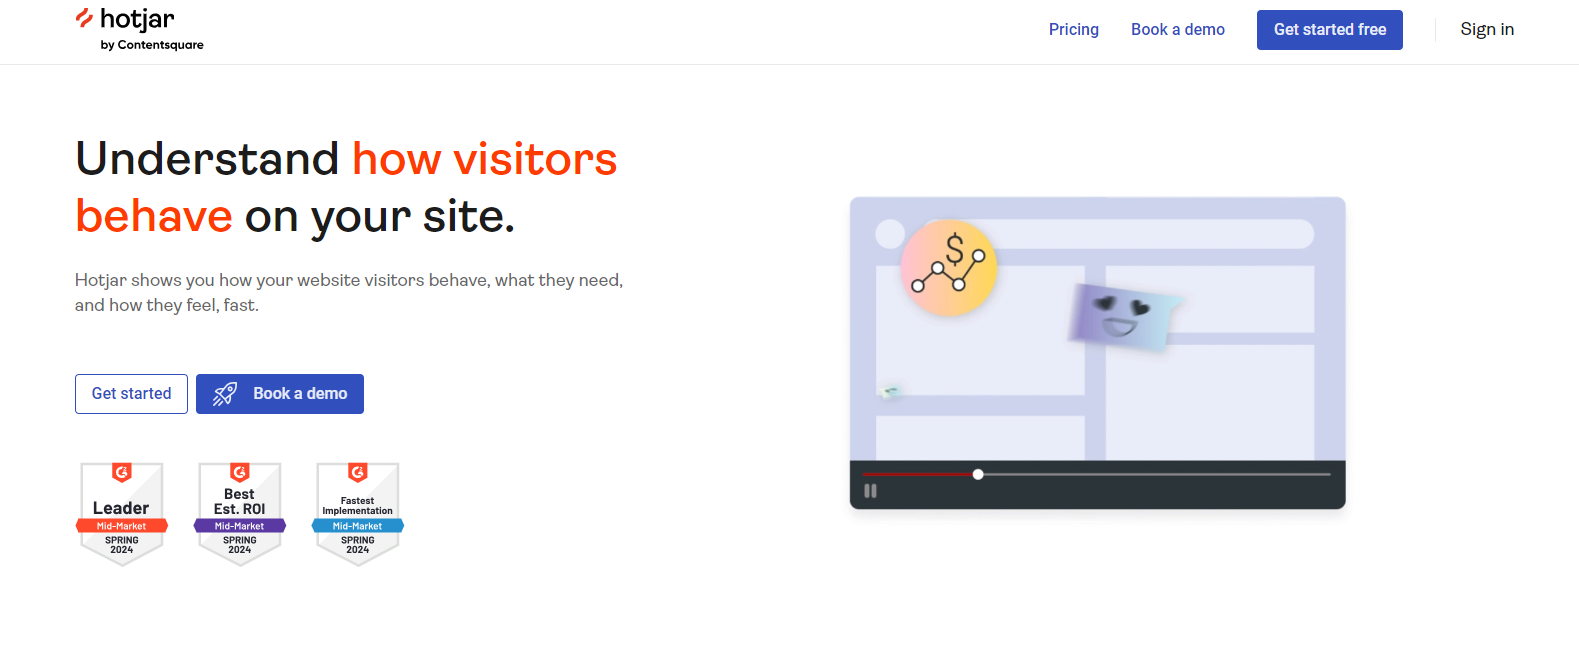
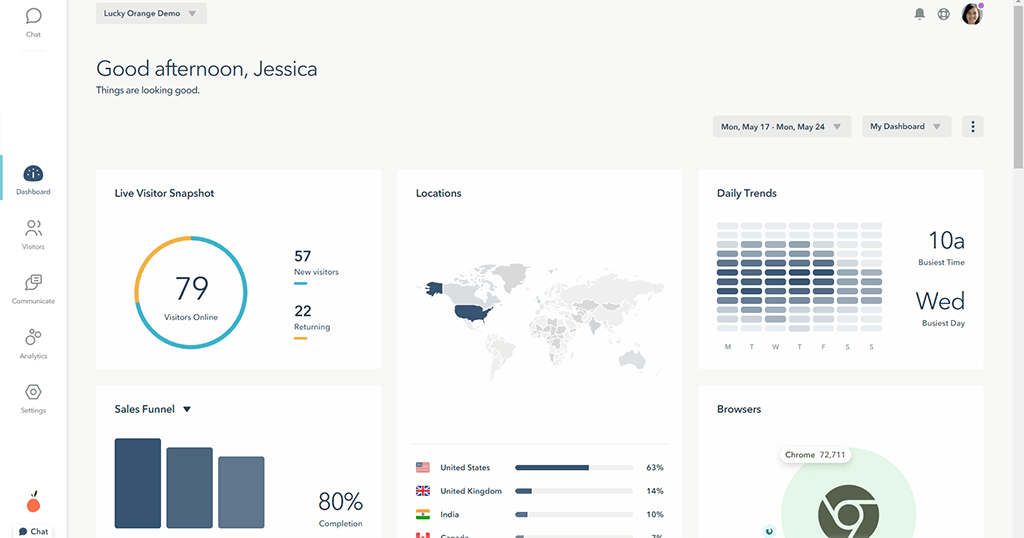
There are many different click map tools available online, so it’s important to choose one that meets your specific needs. Some of the most popular options include FullSession, Hotjar, Crazy Egg, Smartlook and Inspectlet.
What Are the Benefits of Click Maps?
Counting the number of website visits as a measure of success is not enough. Combining the number of unique visitors to your website with click maps and other user behavior tools, you can gain a holistic view of how people interact with your brand.
By using click data to learn how customers navigate through your website, you can personalize their experience across different digital touchpoints. If you’re not yet convinced click maps are worth your time, here are some benefits to consider.
Image source: superoffice.com
Click maps help you:
- Increase your site traffic
- Attract more user interaction
- Test your site’s usability and functionality
- Understand user wants and needs
- Decrease the bounce rate
- Generate more leads and close more sales
- Create an optimal customer journey
- Improve your conversion or sales funnel
- Understand what page elements or website areas are underperforming
- Update your marketing, sales, or development strategy
- Get ideas on how to redesign your website or improve your content
- Reorder your links to achieve higher CTR
- Optimize your website for both web and mobile users
- Detect points of frustration like JavaScript errors, misleading elements, broken elements, etc.
- See if your image links are gaining clicks
A major benefit of click maps is return on investment (ROI) tracking. You will always know the exact percentage of return you receive for every dollar invested in your advertising campaigns.
Also, click maps are easy to implement into your existing digital infrastructure.
What Are the Drawbacks of Click Maps?
Click map is a great way to see how users interact with your website or web app, but there are some drawbacks you should be aware of.
Click maps can be misleading. They show you what areas of your website or web app are most popular, but they may not reflect the user’s interest.
For example, if your website shows video ads, the click map might mark the ads users click the most, like the top right corner of an ad where the close button is.
You will not know if the ads are intrusive or irrelevant to the users’ experience just by watching click tracking reports. This is where session replays come in handy, allowing you to view the entire visitor experience accurately.
Also, click maps can slow your website down. Depending on the software you use, click maps can be time-consuming to generate, so if you have a large amount of data, you may not be able to use click map reports right away.
Finally, click maps can sometimes be inaccurate. They can show you areas where a user clicks or interacts with a specific page, but this might not reflect how many of them have actually paid attention to your page elements.
This is not the case with FullSession because there is no waiting time for heatmap processing–you get instant data with high accuracy–and it doesn’t slow down your website.
Get a demo and see how it works.
Are Click Maps Worth the Investment?
Yes, click maps are definitely worth the investment and can lead to increased revenue. As a business owner, having a visual representation of where users are clicking lets you view your website in new ways.
By tracking users’ navigation, you can build a more effective site based on their actual needs rather than your best guesses and improve performance by making changes to your product pages, calls-to-action, or site structure.
Also, click maps will help you determine why some people leave your eCommerce shop without buying anything so you can take appropriate actions to boost conversions.
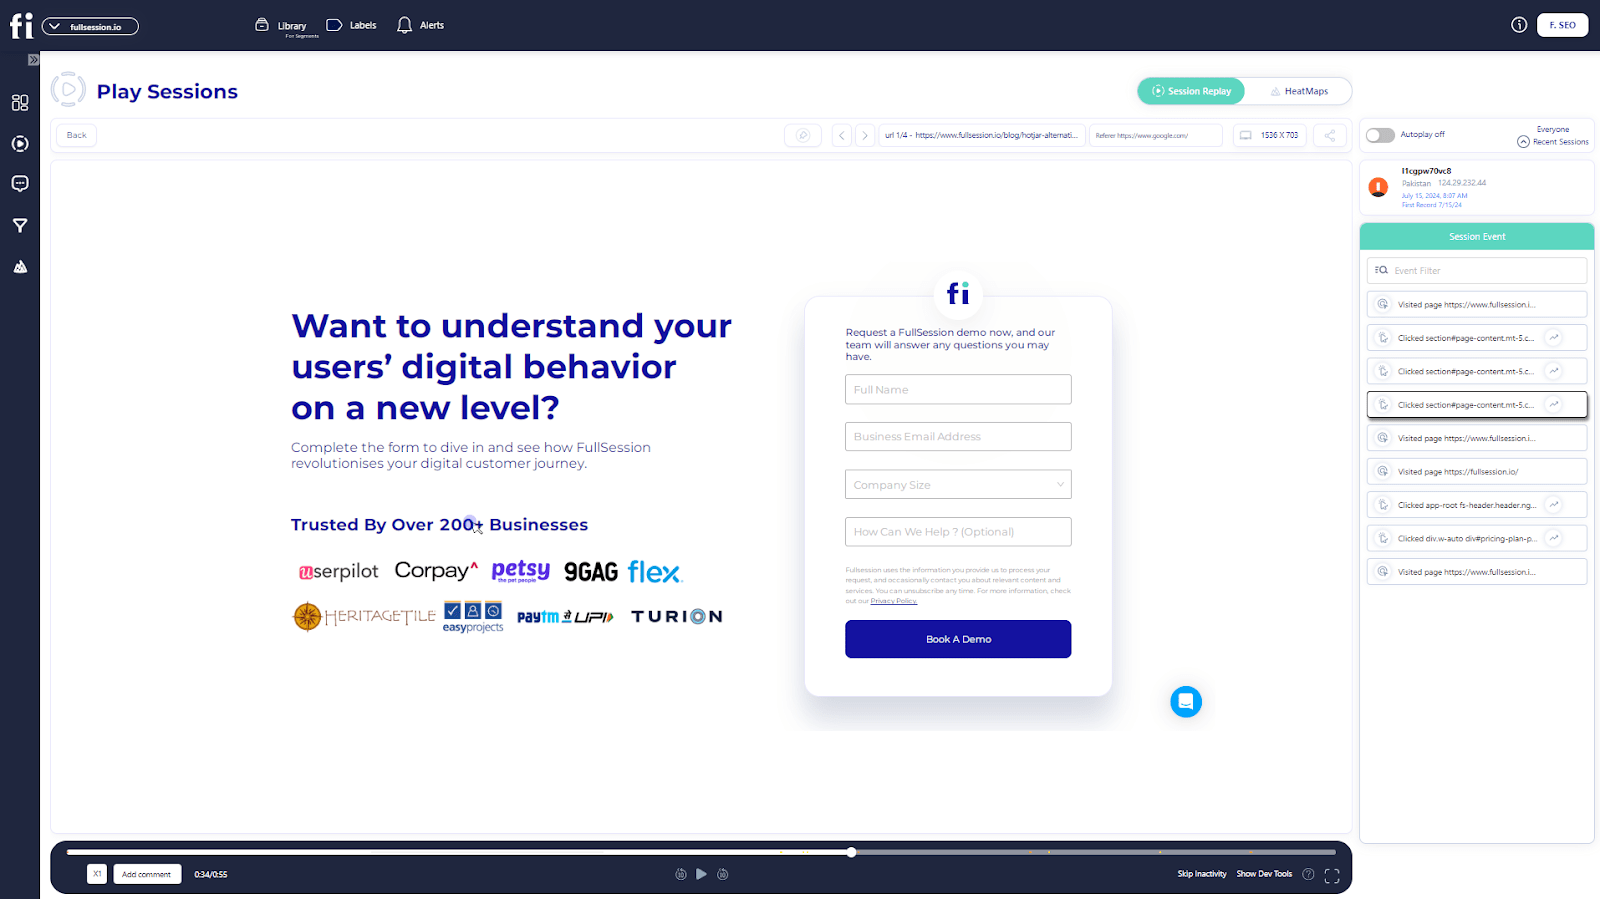
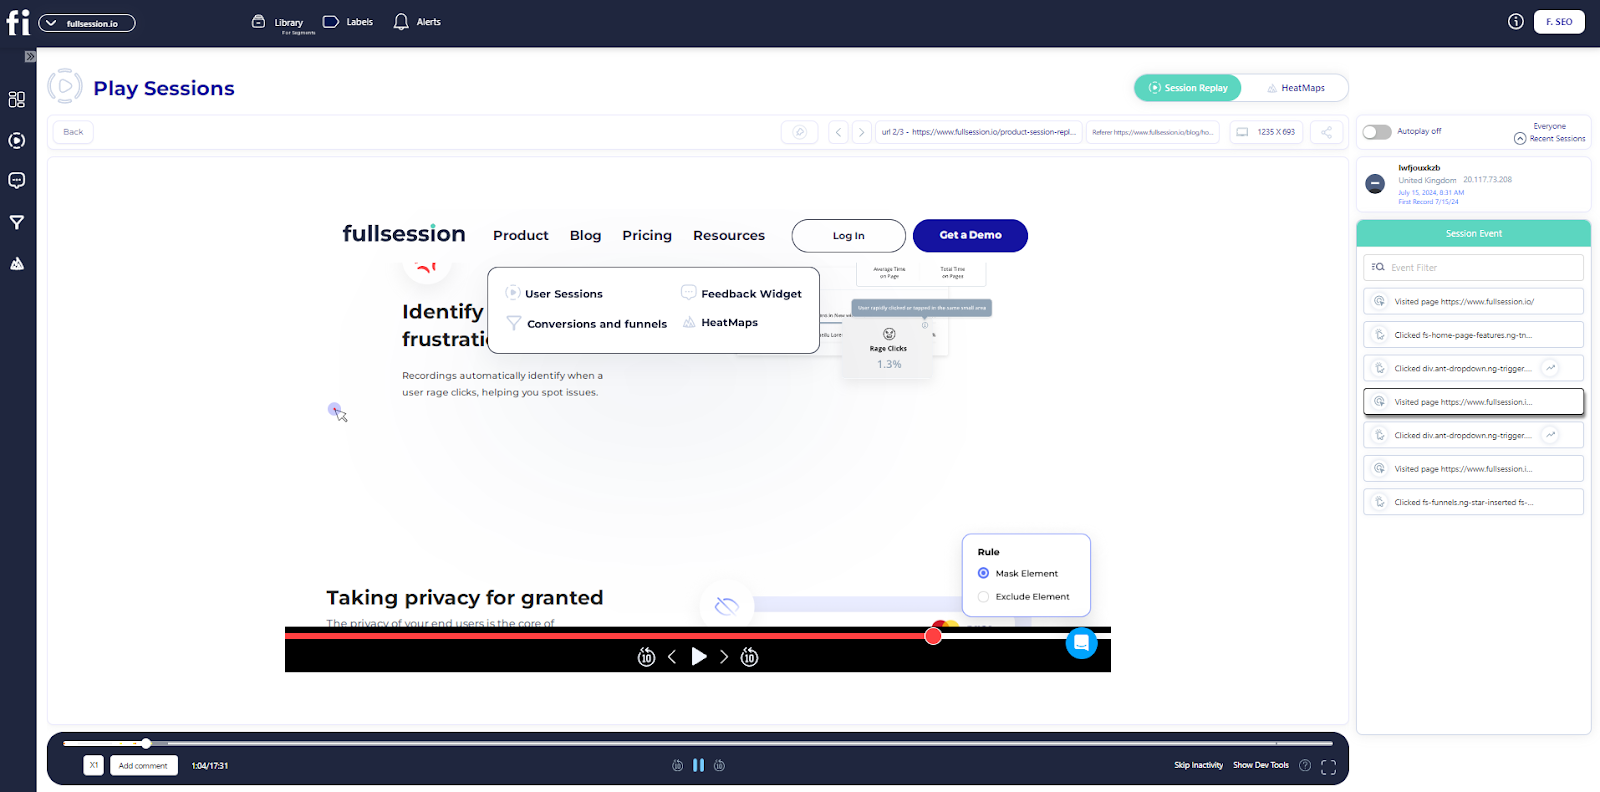
How to Track Website Visitors’ Clicks With FullSession
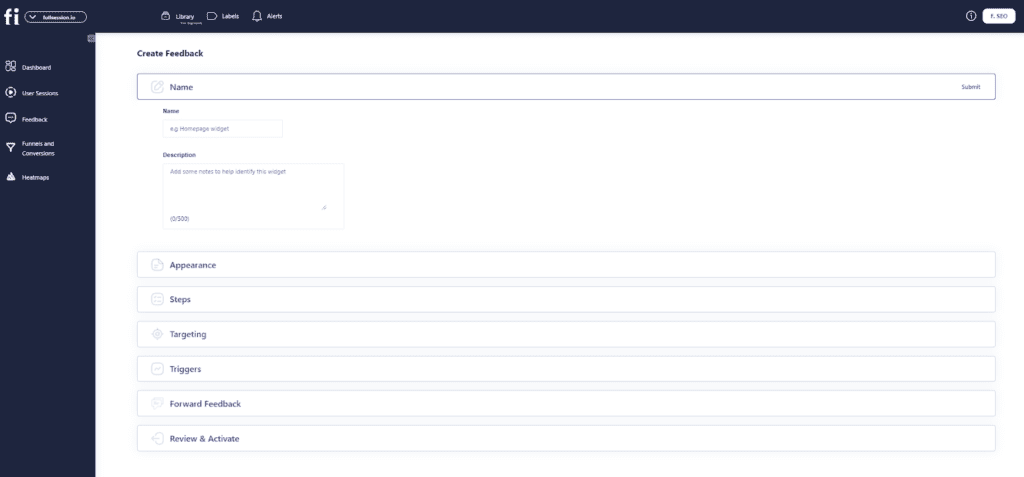
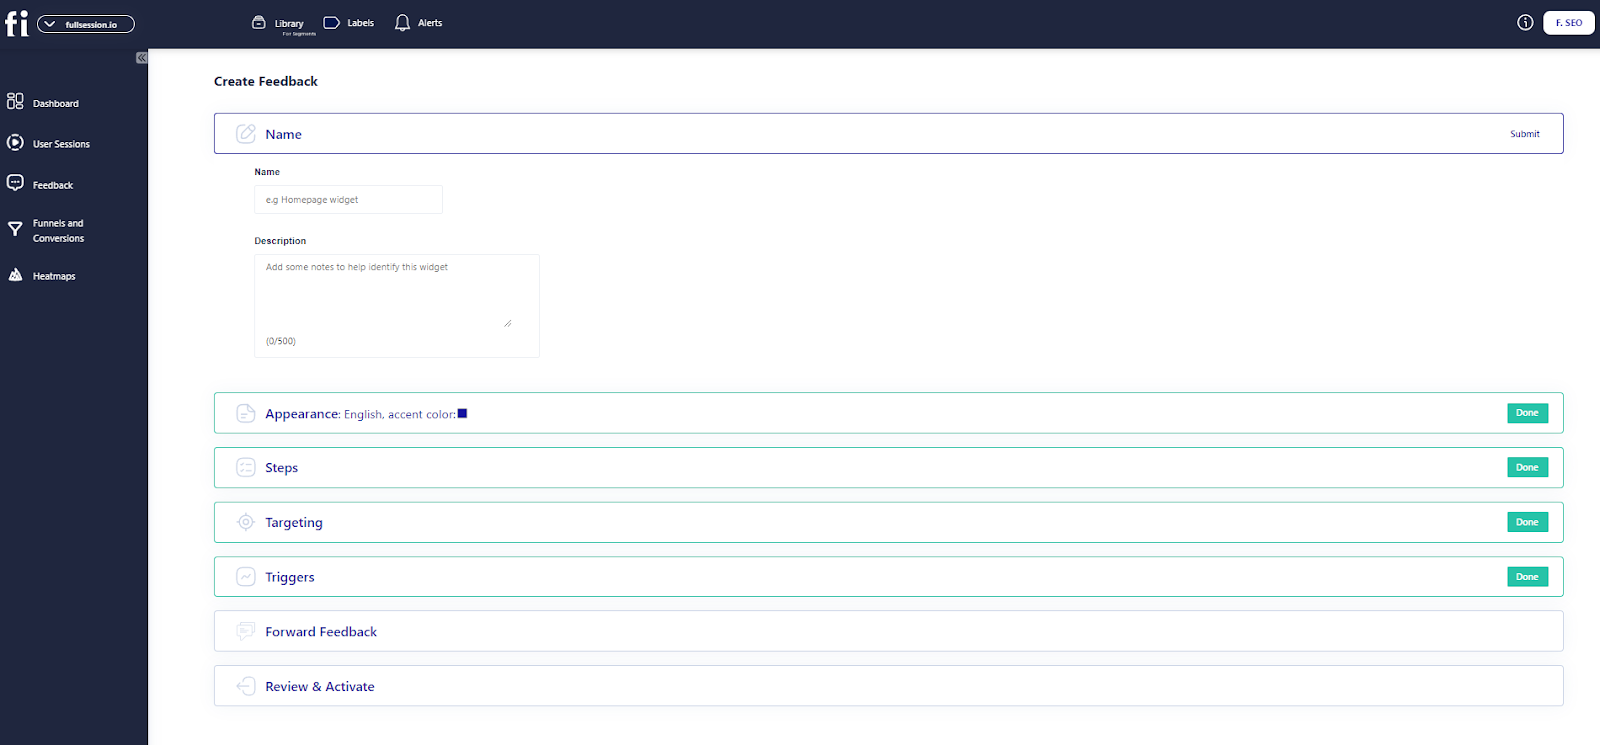
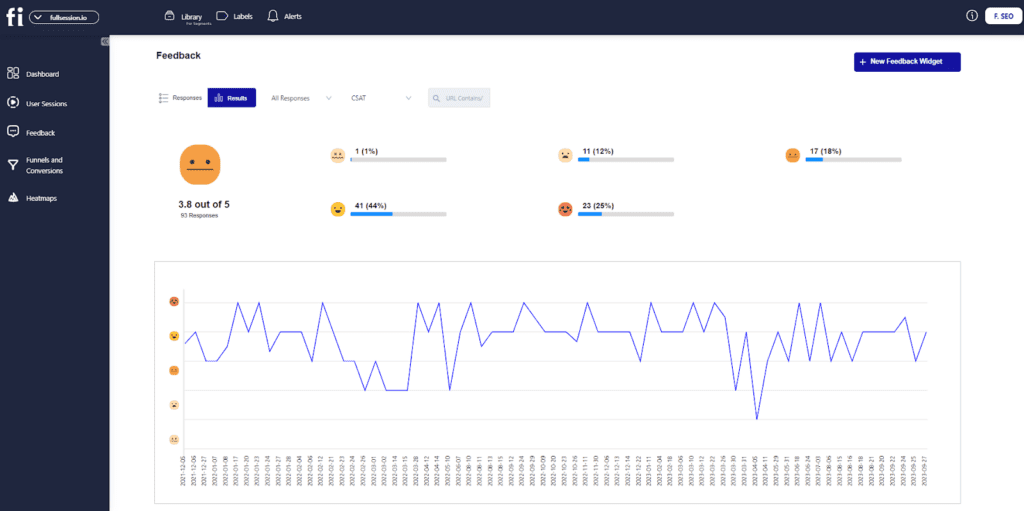
We developed FullSession, our user behavior analytics software, to help you capture all website visitor interactions accurately. You can monitor your users’ experience across devices, analyze their behavior with real-time visual insights, and identify issues in the customer journey for targeted optimization efforts.

With features such as interactive heatmaps, session recordings and replays, customer feedback forms and reports, and conversion, funnel, and form optimization tools, FullSession is a single solution for growing website traffic, boosting engagement, and converting more visitors into active, returning customers.
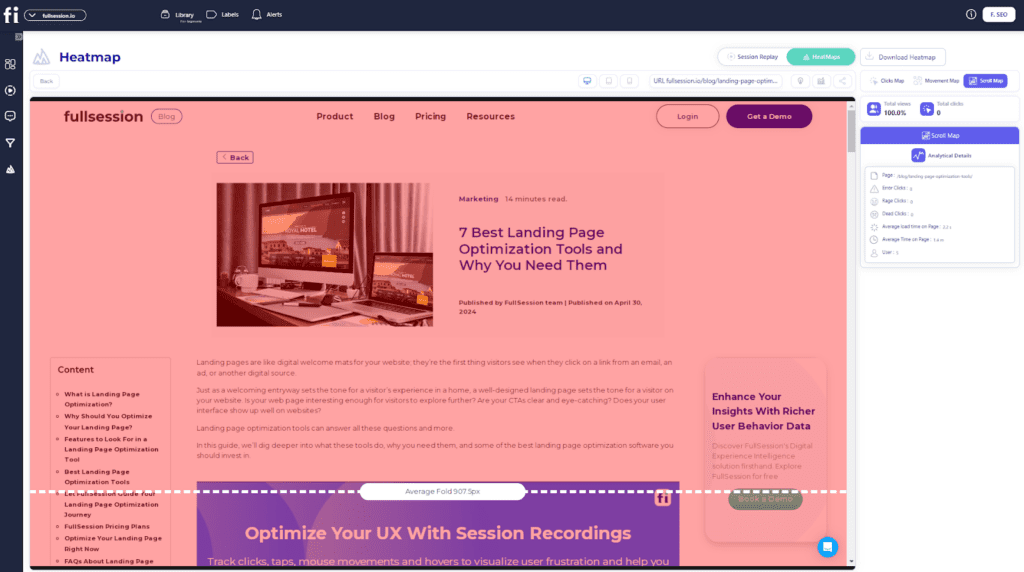
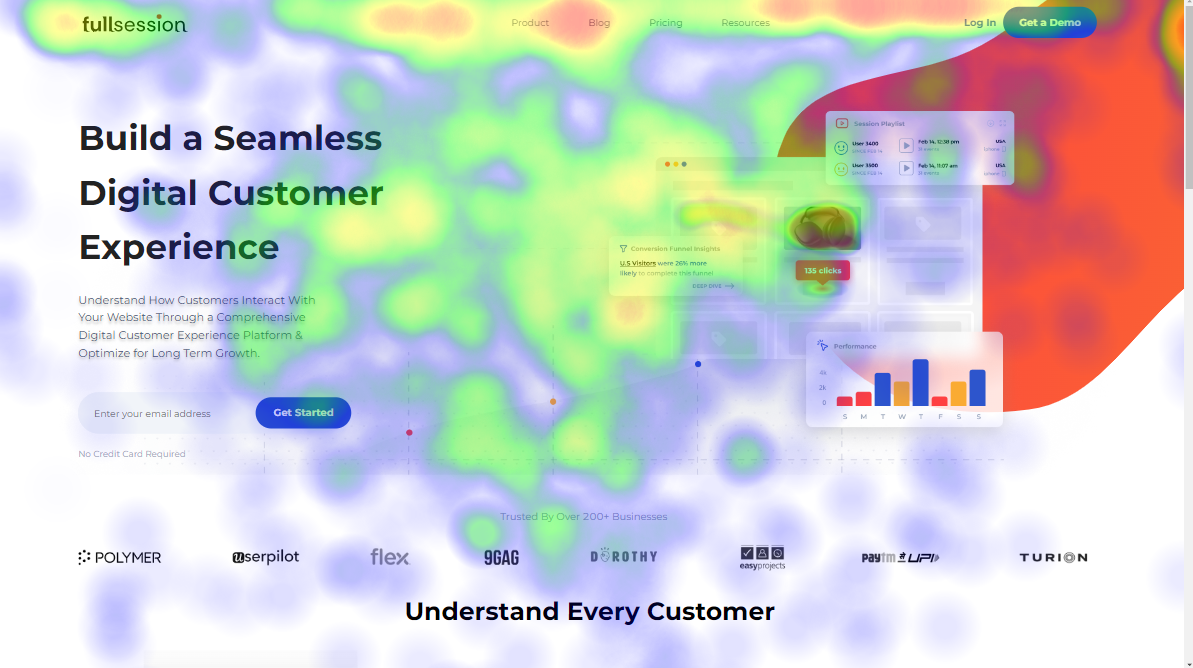
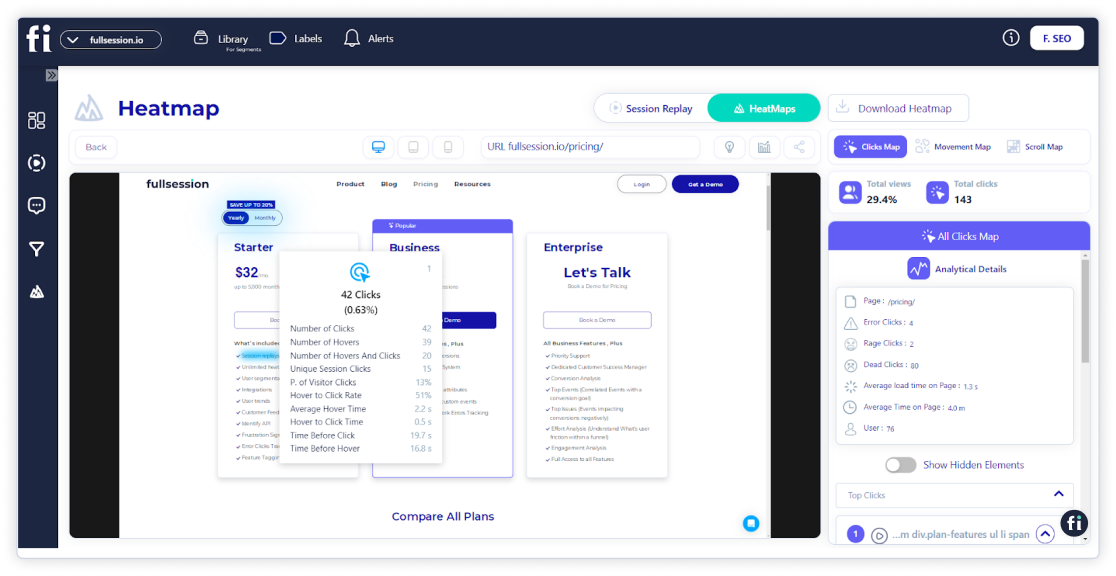
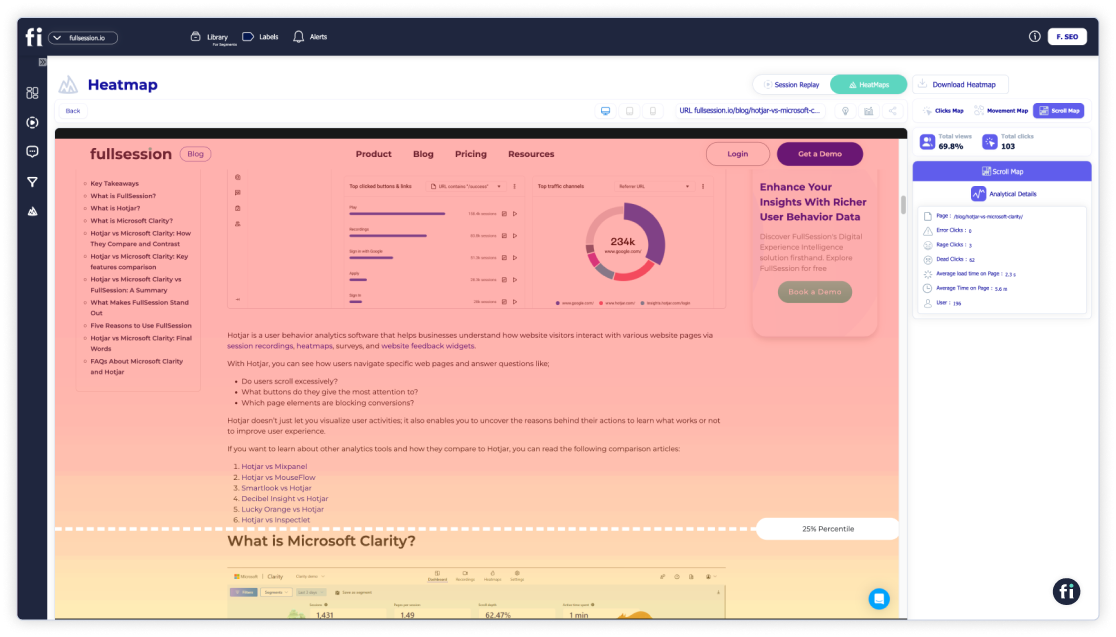
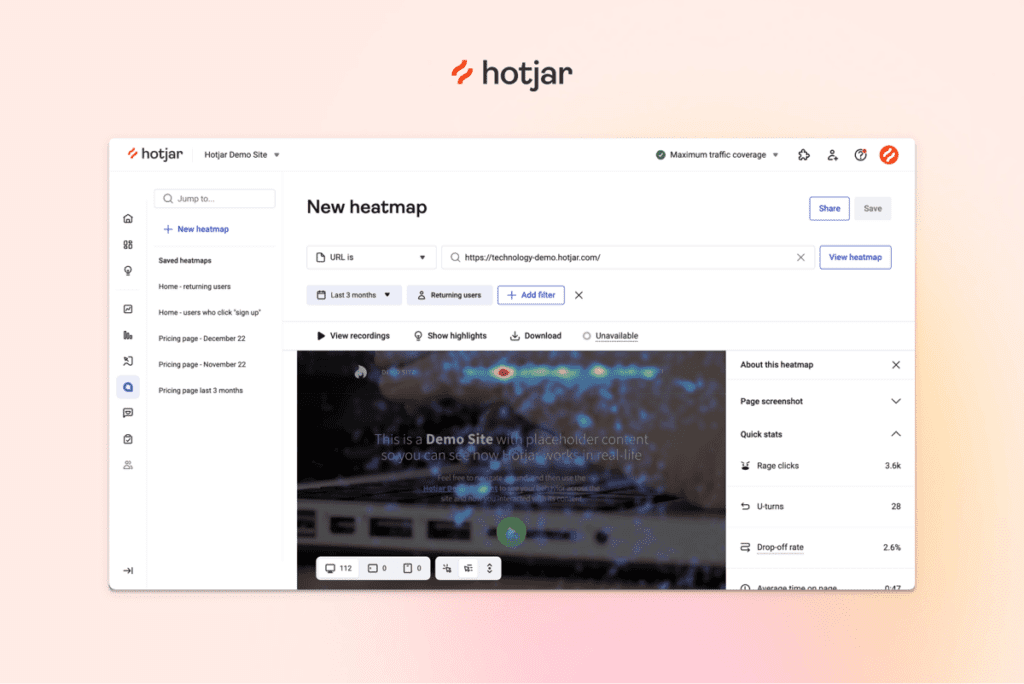
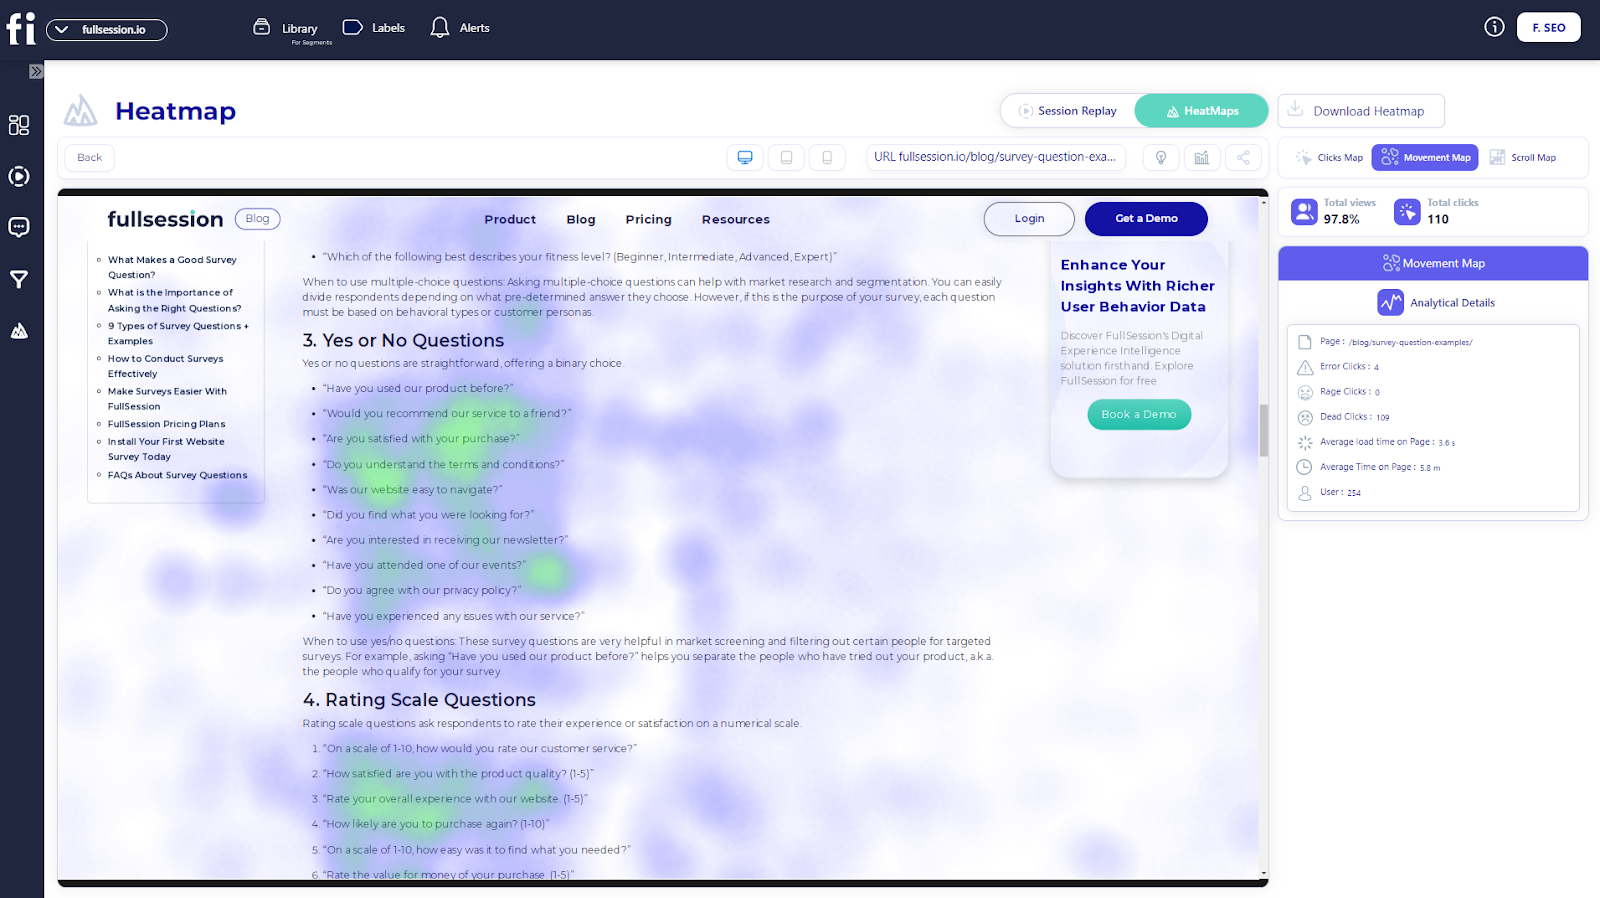
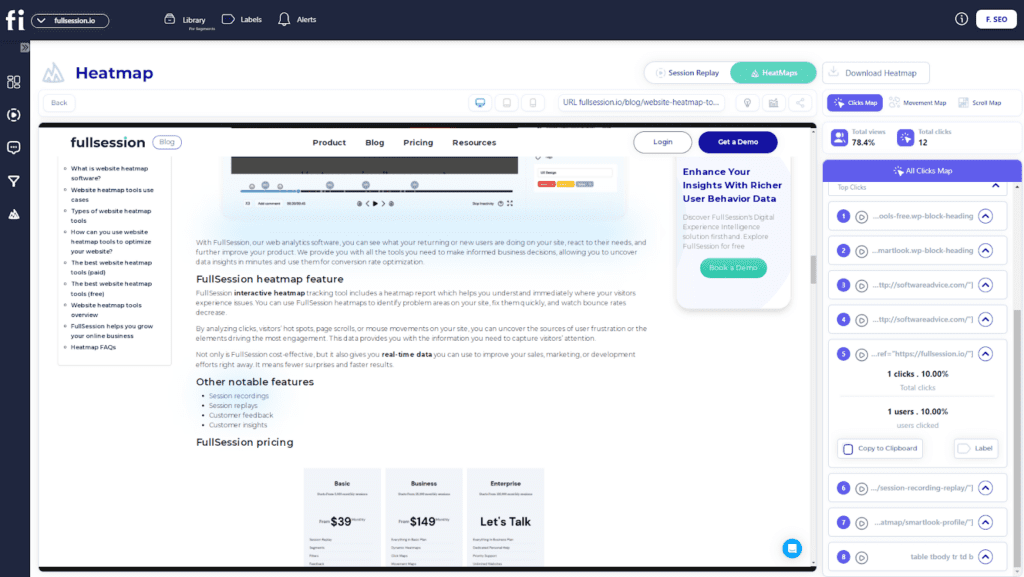
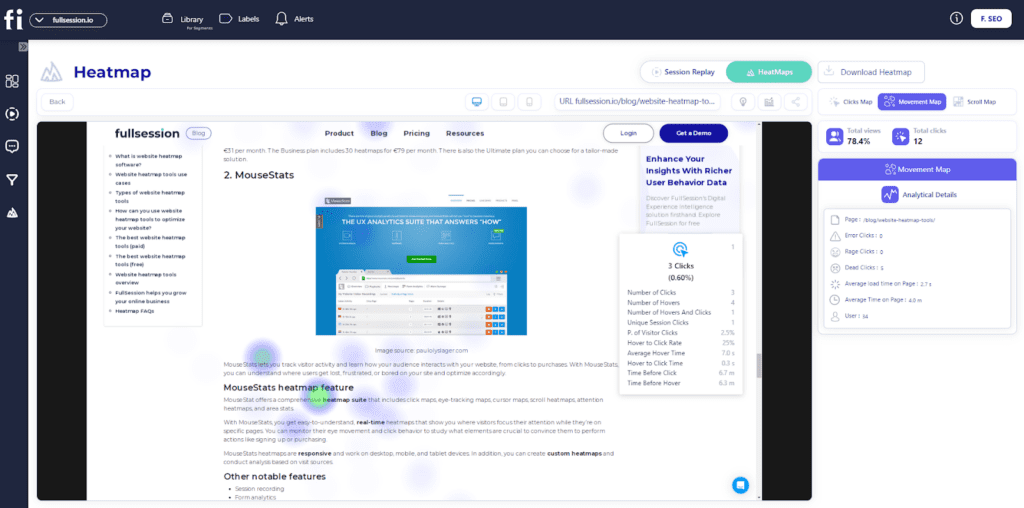
FullSession heatmaps
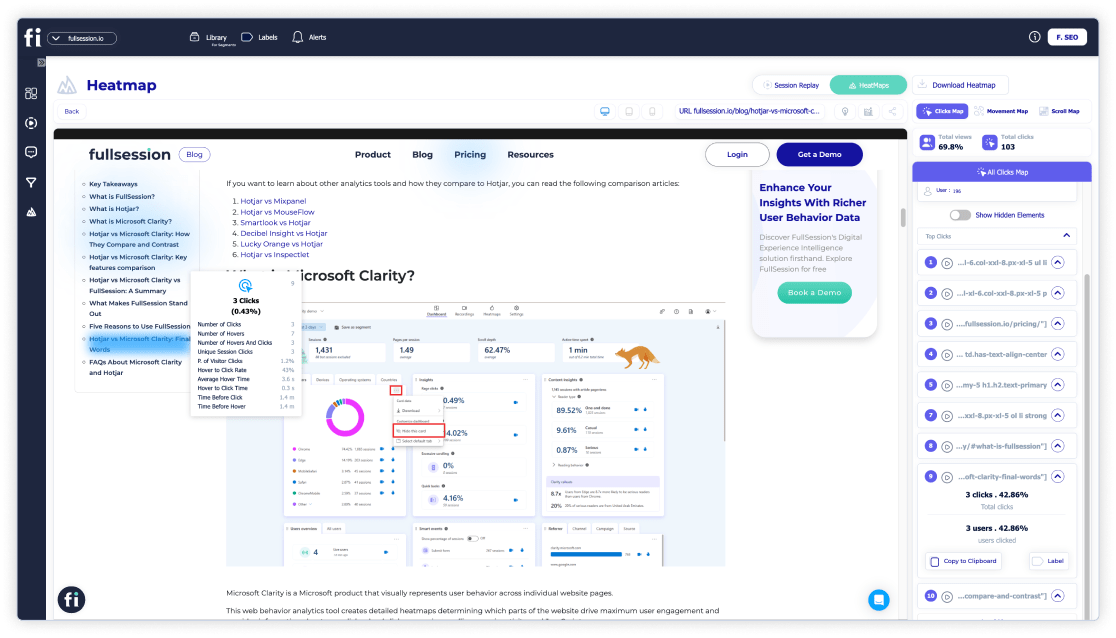
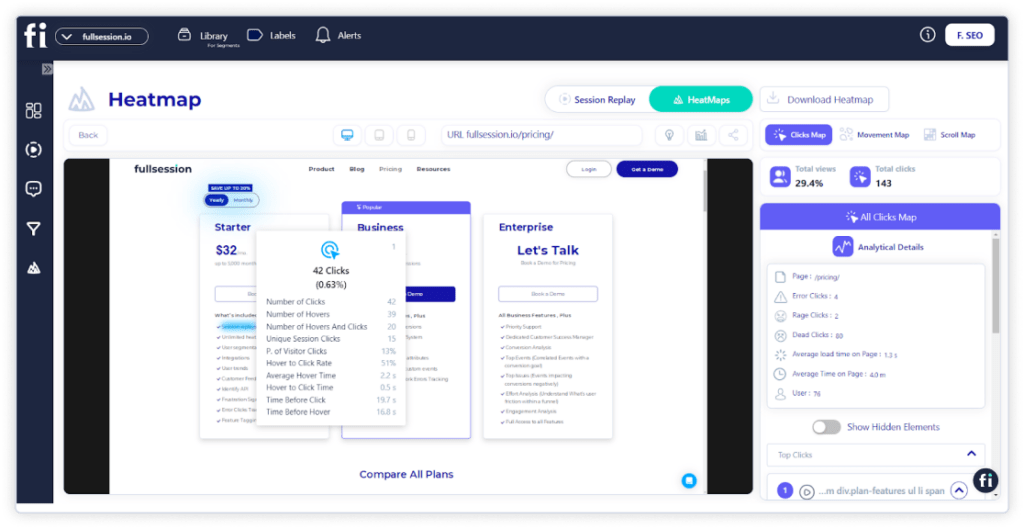
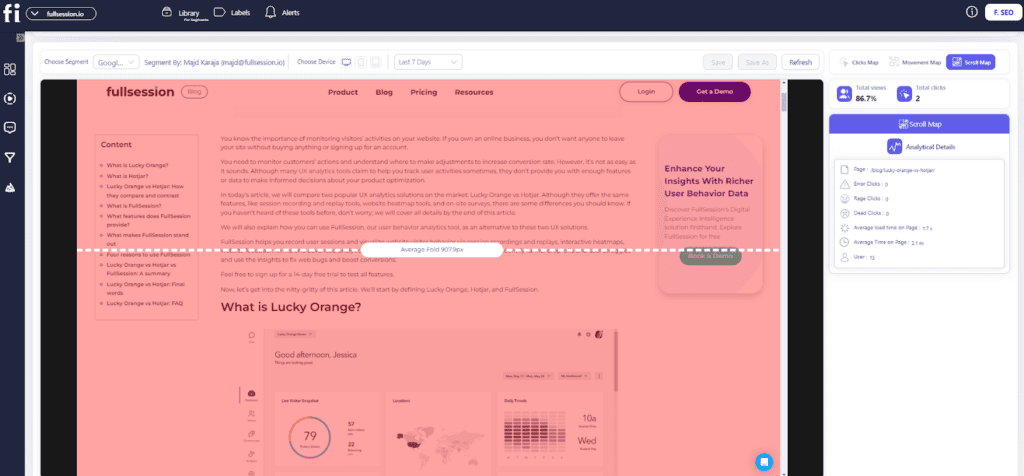
FullSession real-time interactive heat maps help you visualize customer behavior and discover growth opportunities. With FullSession, you can track dynamic page elements and analyze every click, scroll, hover, or mouse movement to create an excellent digital experience.
This feature helps you detect dead zones, test different UI elements, validate design changes, and improve your website’s visual hierarchy. It enables you to optimize website interface, usability, and performance.
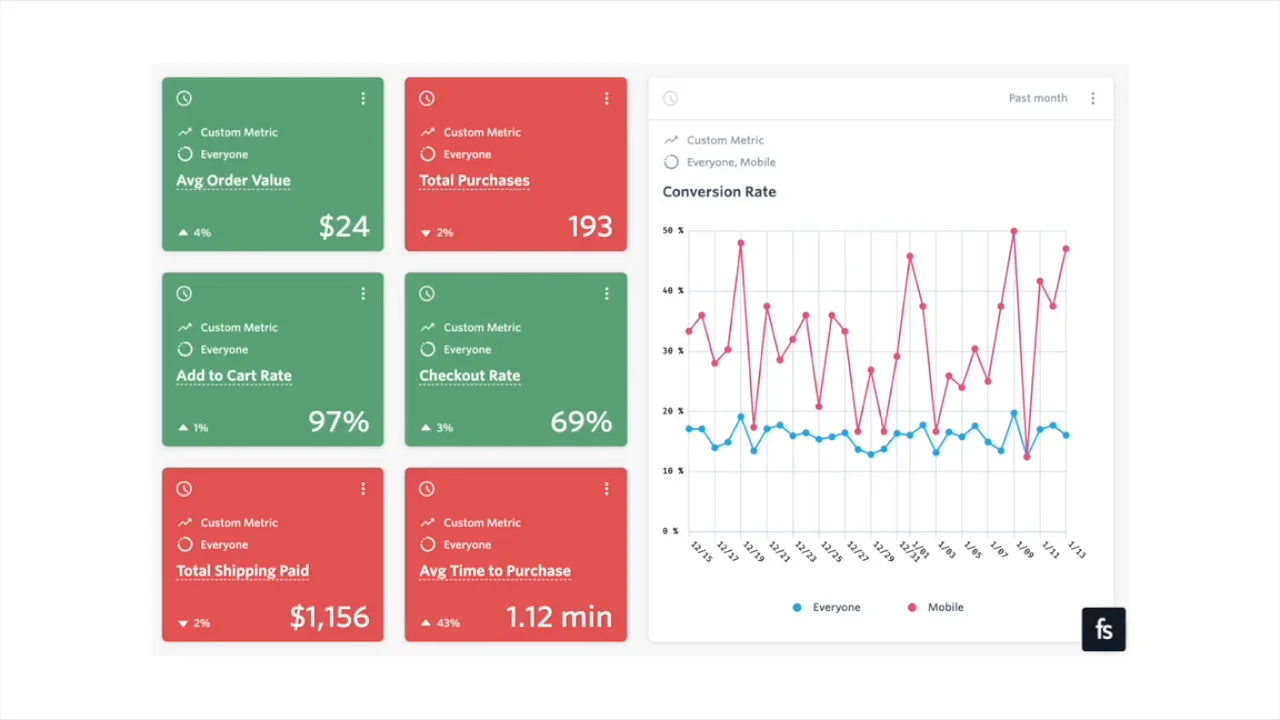
FullSession heat maps display colorful, easy-to-interpret graphic charts that show how visitors navigate your entire website and engage with your brand.
FullSession heatmap types
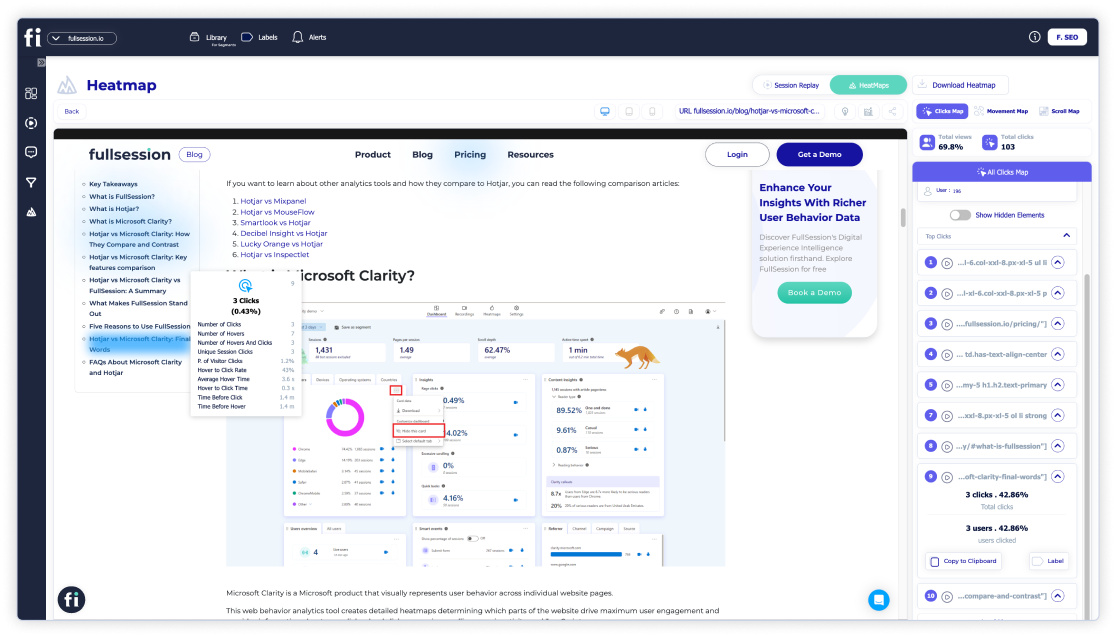
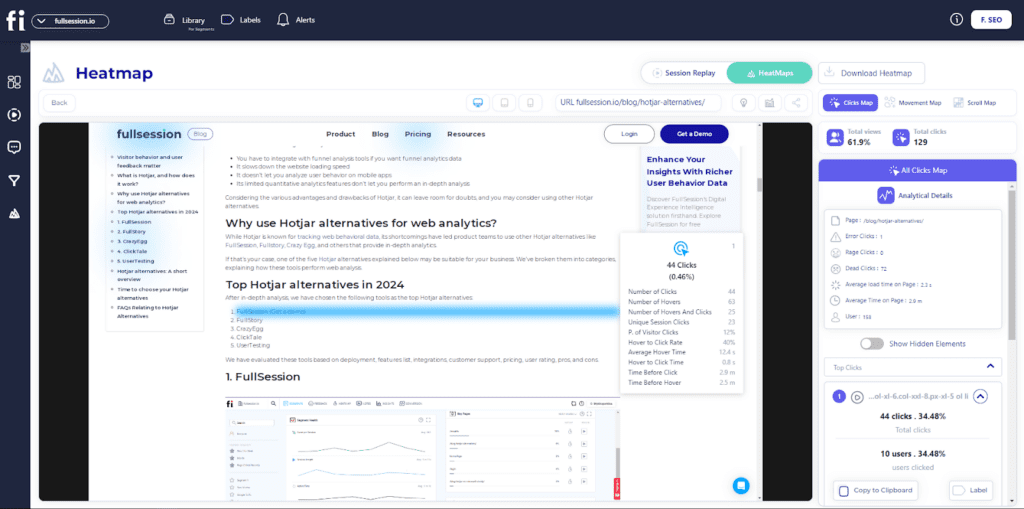
Click maps provide insights into user engagement by showing which elements on a webpage receive the most clicks. This helps you understand what attracts attention and optimize calls-to-action for better conversions.
Analyzing click patterns can also reveal navigation issues and areas that may need design improvements.
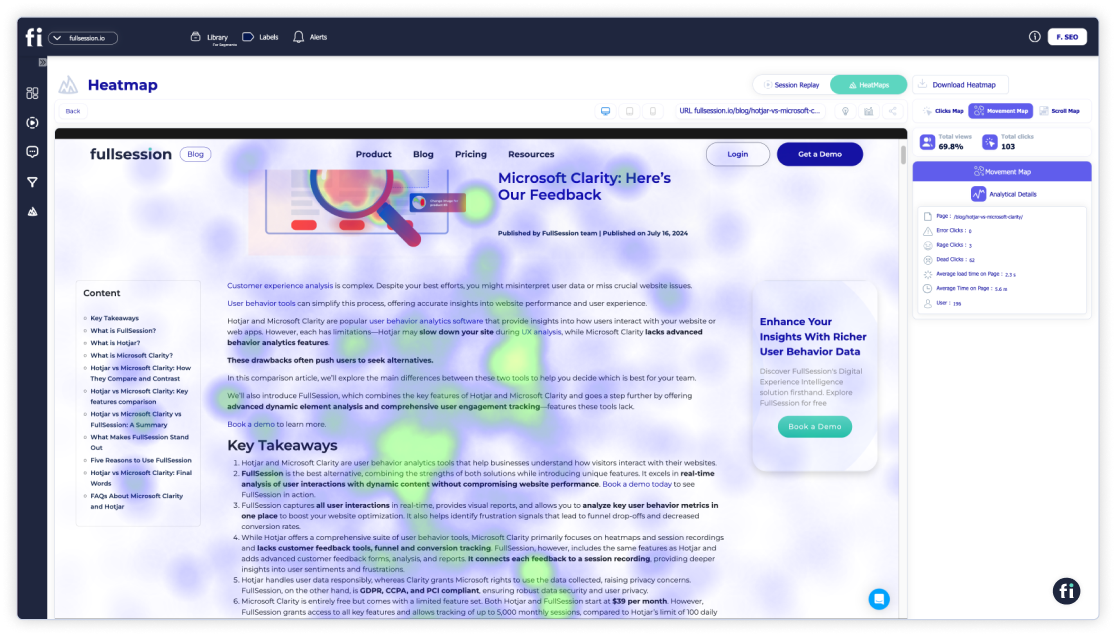
Mouse movement maps, or move maps, track where users move their mouse cursor on a webpage. Since there’s a strong link between where people look and where they move their mouse, these maps highlight which parts of a page catch the most attention.
Once you see where users hover and pause, you can determine which content interests visitors and which parts are ignored. This helps you refine design and content strategies, especially for non-clickable elements.
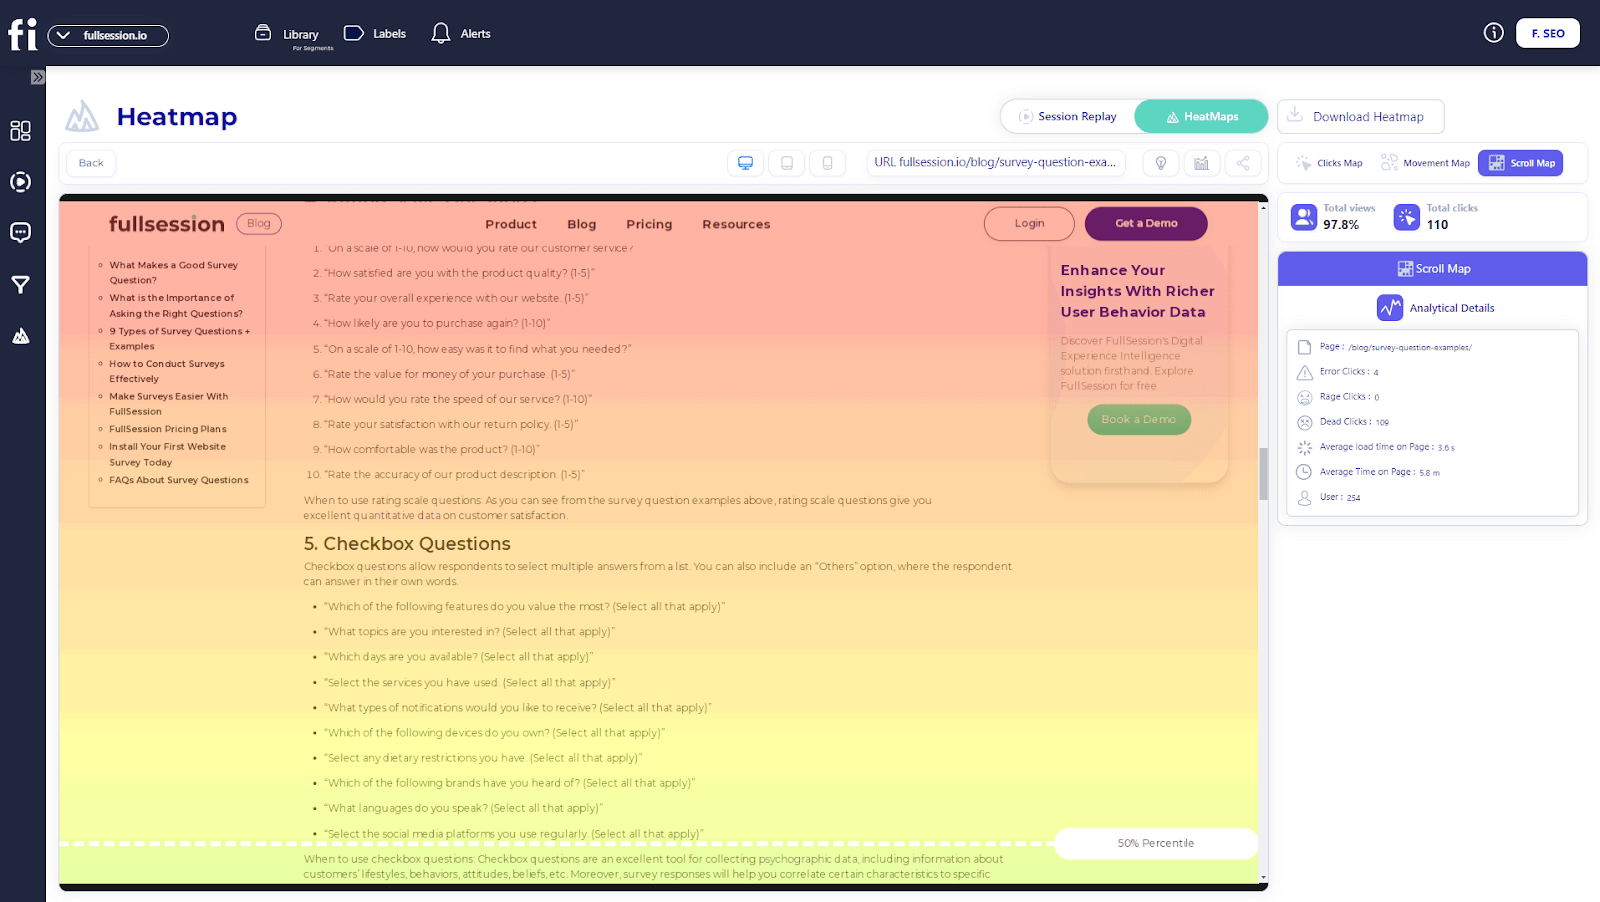
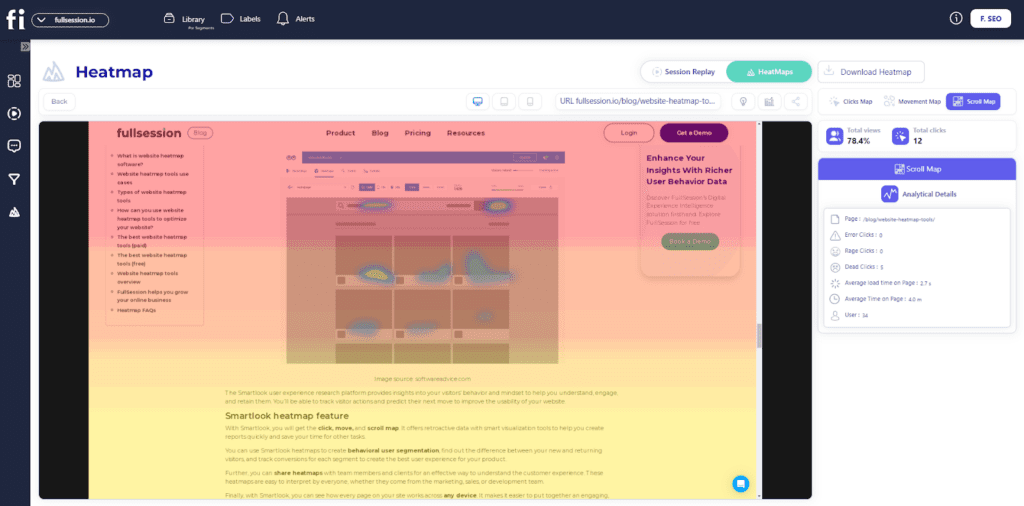
Scroll maps show how far users scroll on your web pages, indicating which sections are viewed and which are skipped. This helps identify “dead zones” where user engagement drops.
When you understand scroll depth, you can adjust content placement and design to ensure important information is seen without requiring excessive scrolling. This optimization improves user engagement and retention.

Using interactive visualizations and advanced filtering options, you can get all the data you need without having to work with complicated reports or raw data in spreadsheets.
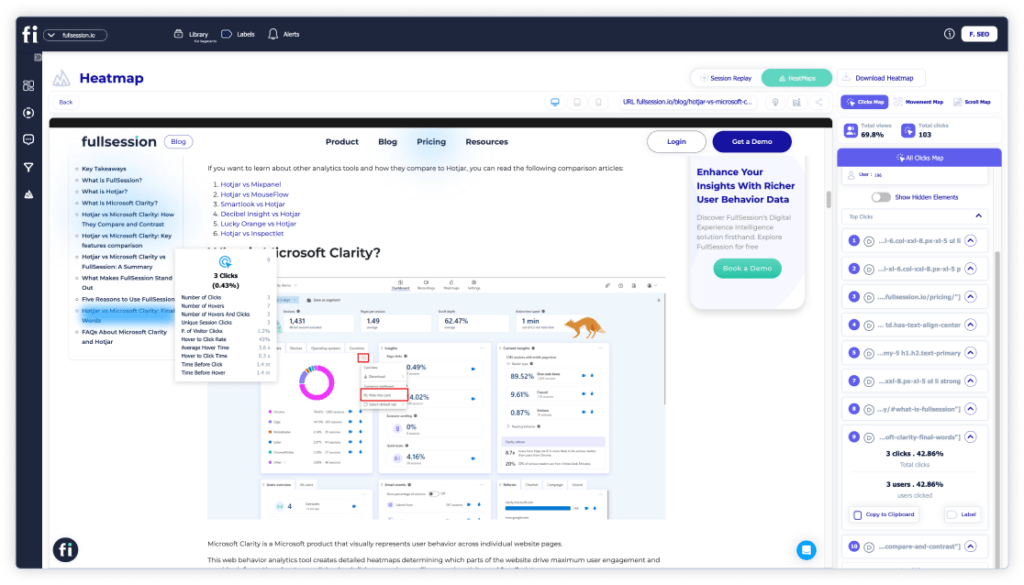
Why use FullSession click maps
No matter what kind of data you’re looking for, from improving your SEO to better understanding your customers, FullSession heatmaps can provide you with the answers.
FullSession has an advanced heatmap tool that gives you access to instant insights and actionable data without affecting your website performance. It helps you identify issues, measure their impact on your site, and pinpoint what you need to do to solve them quickly rather than waiting for a problem to manifest itself.
Use FullSession heatmaps to understand the sources of user frustration or the on-page elements driving the most user engagement to improve your sales, marketing, or development efforts.
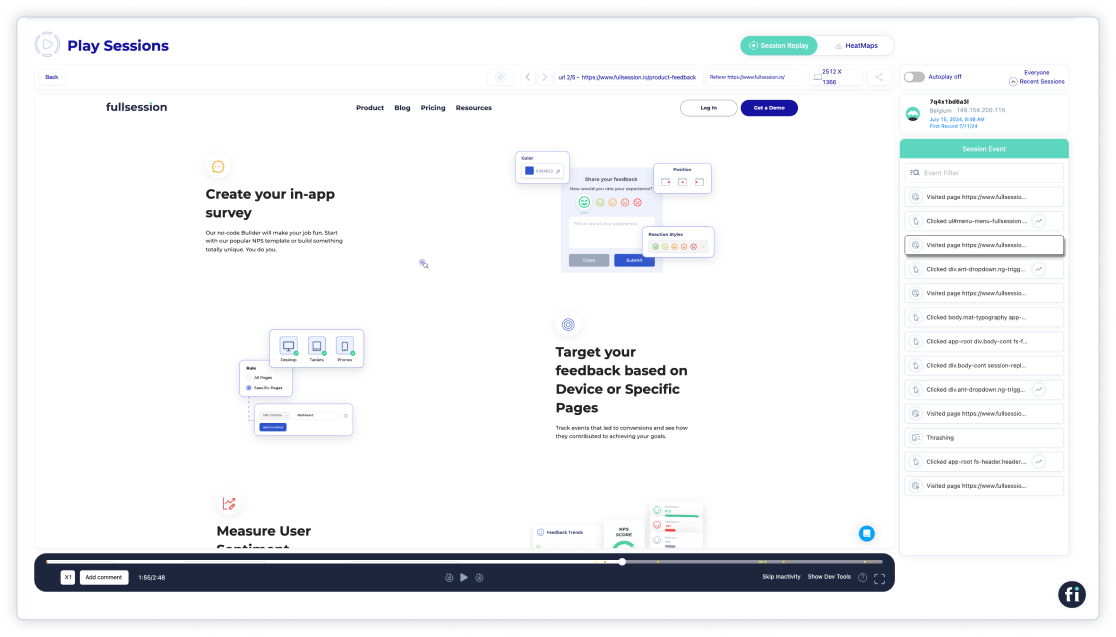
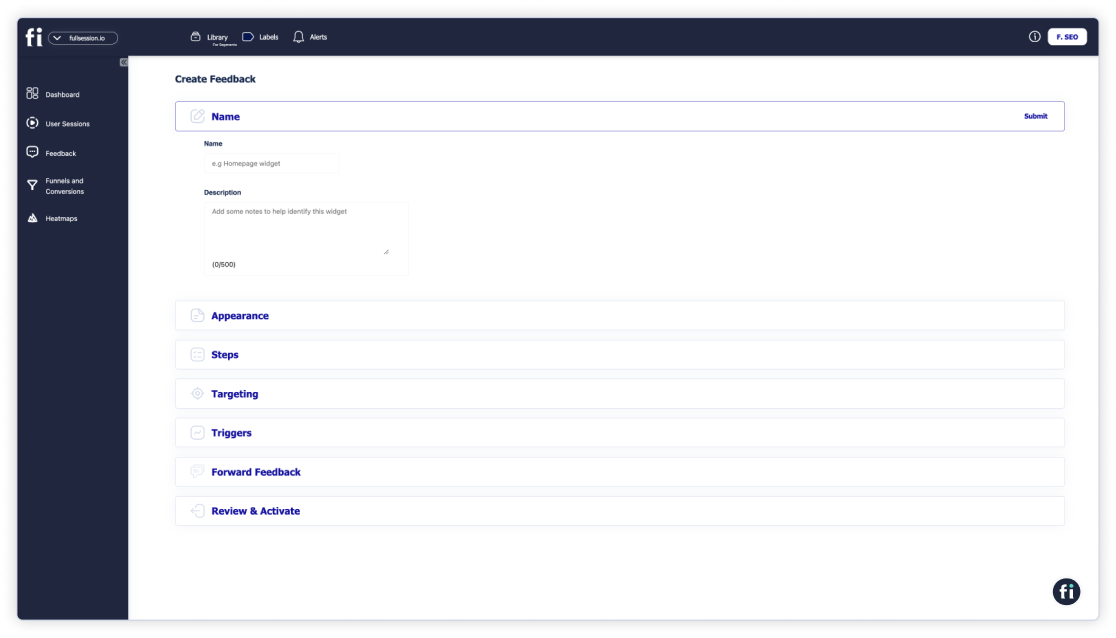
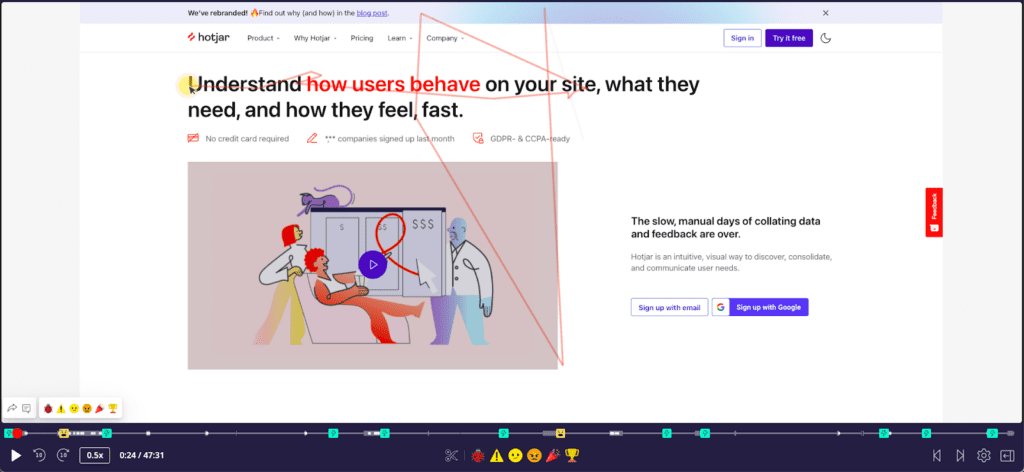
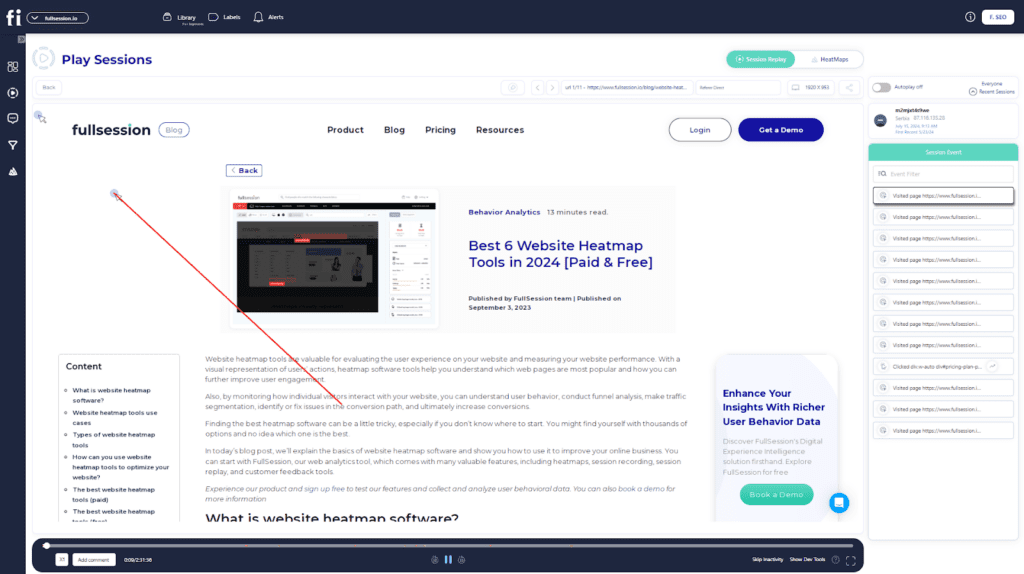
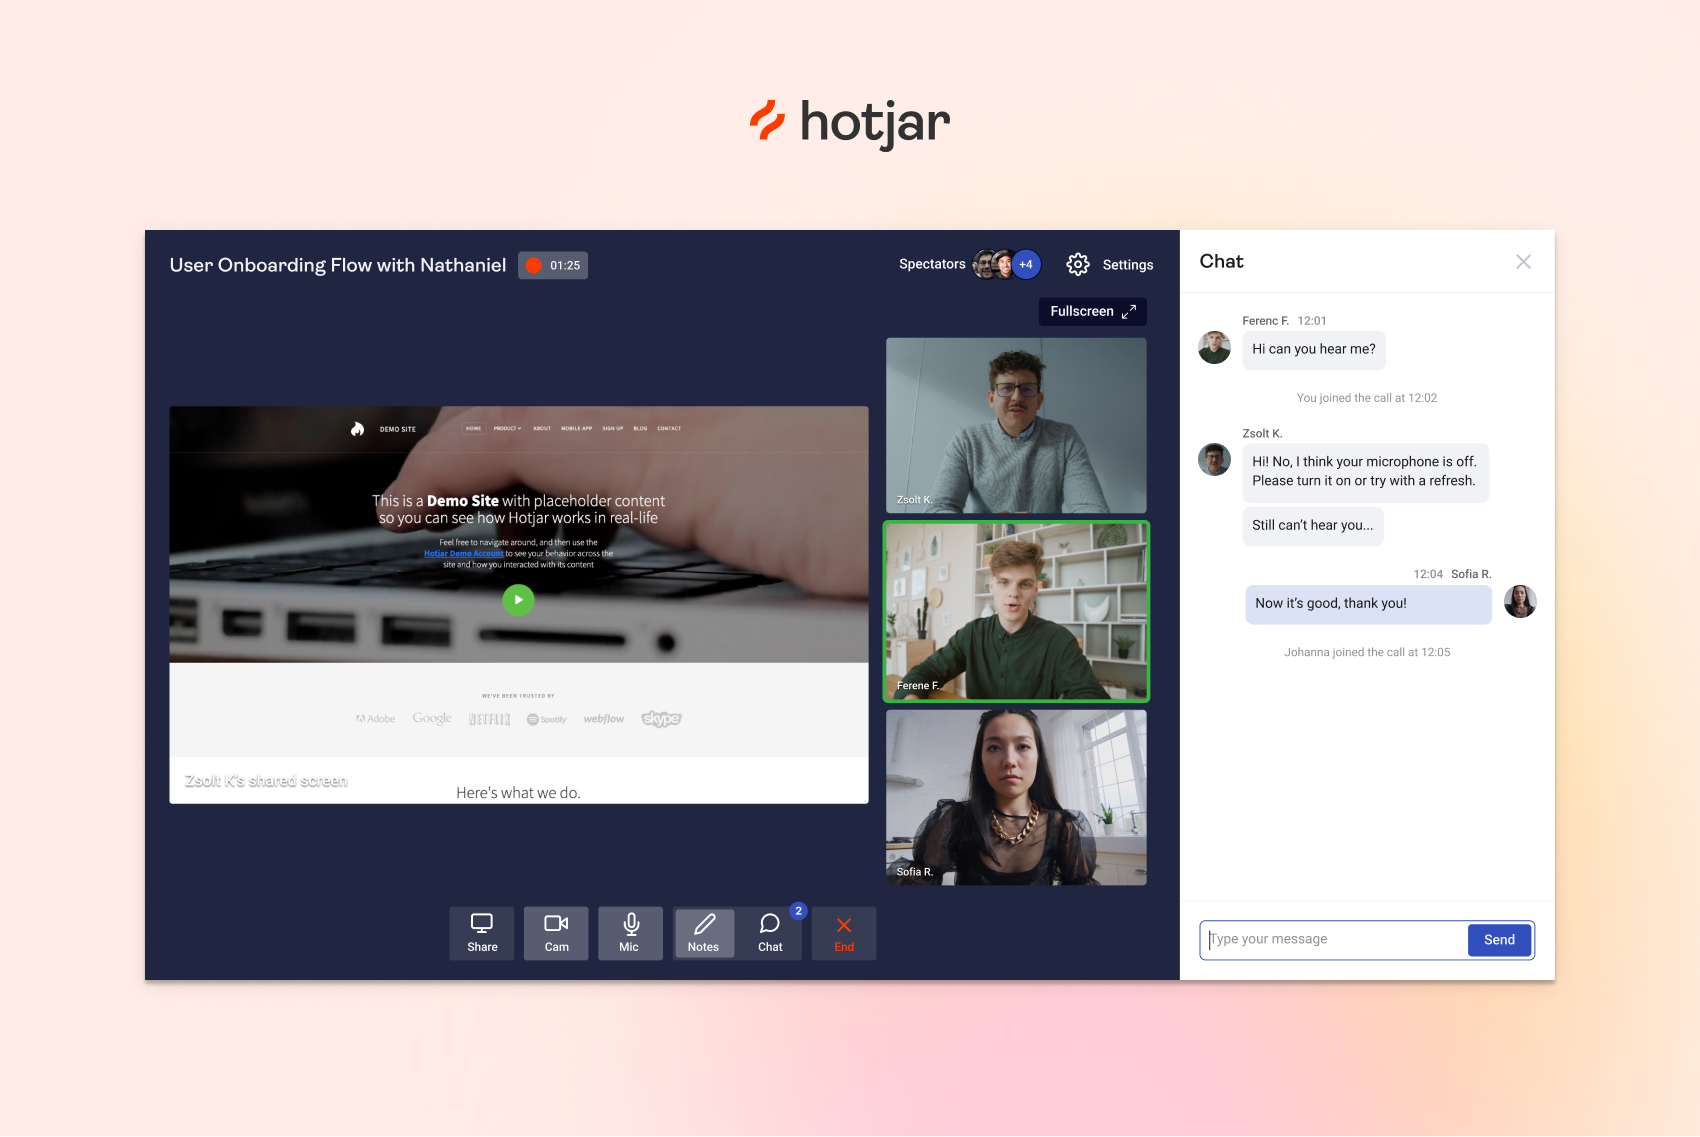
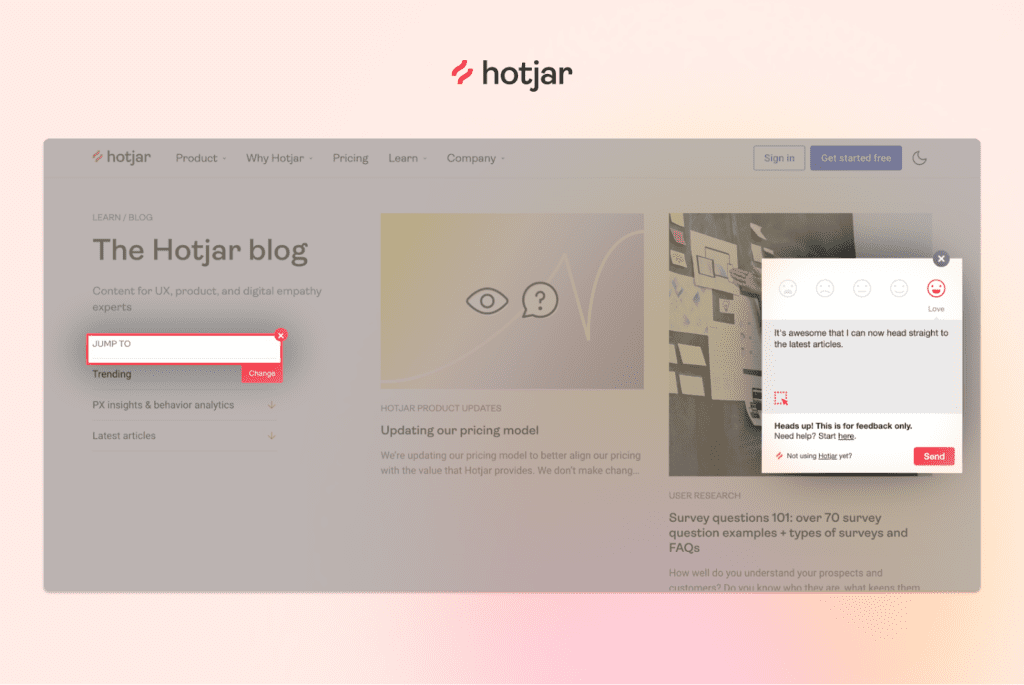
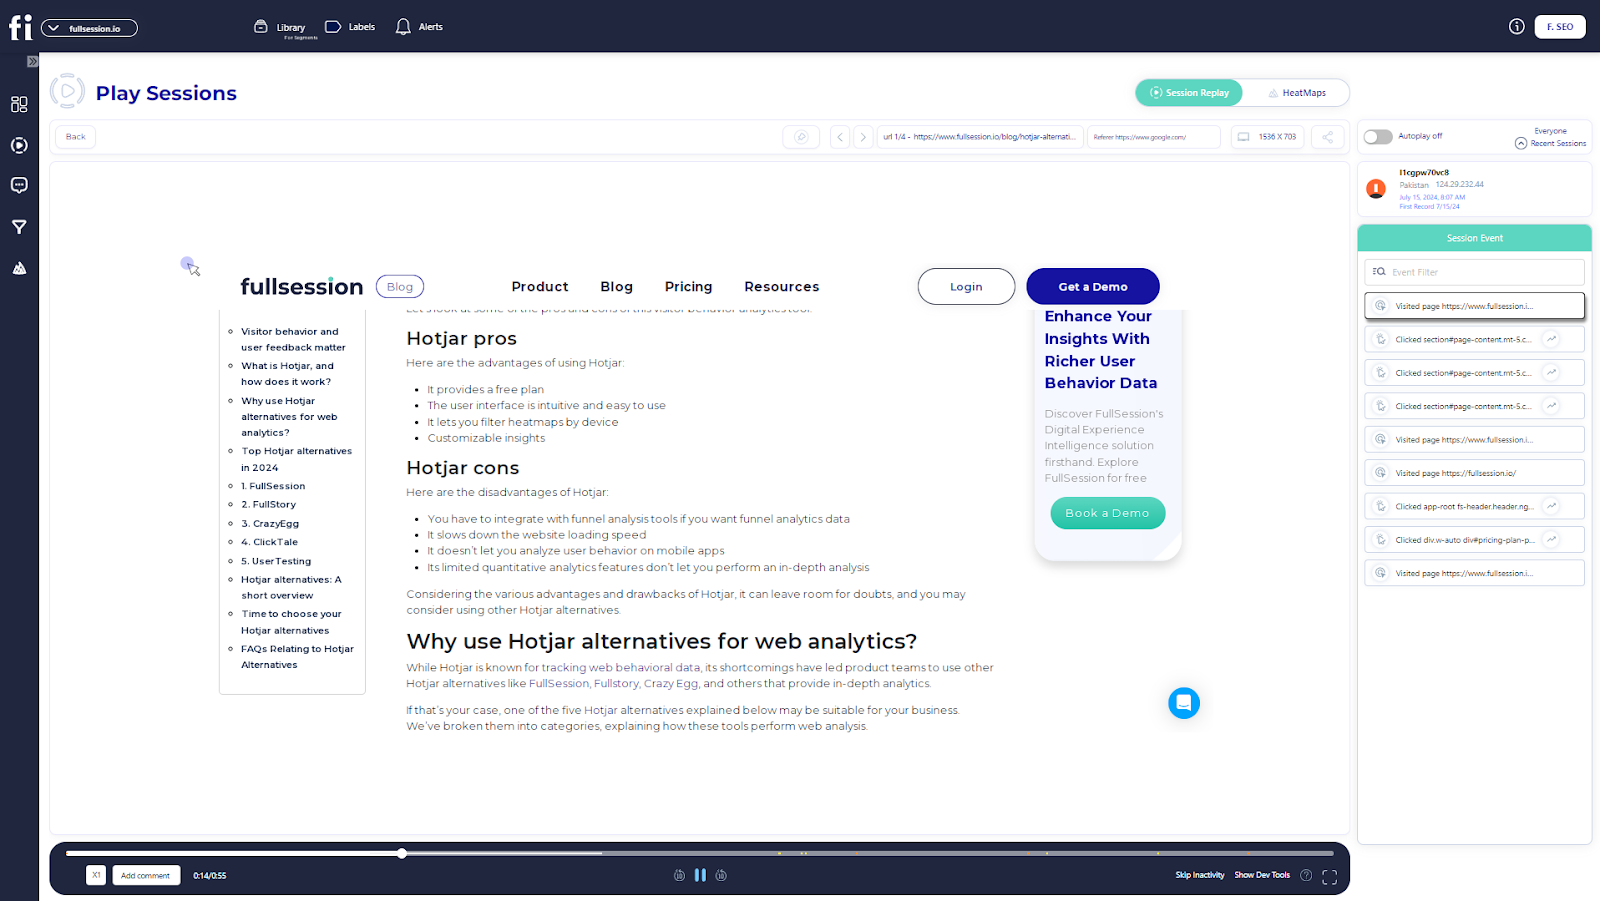
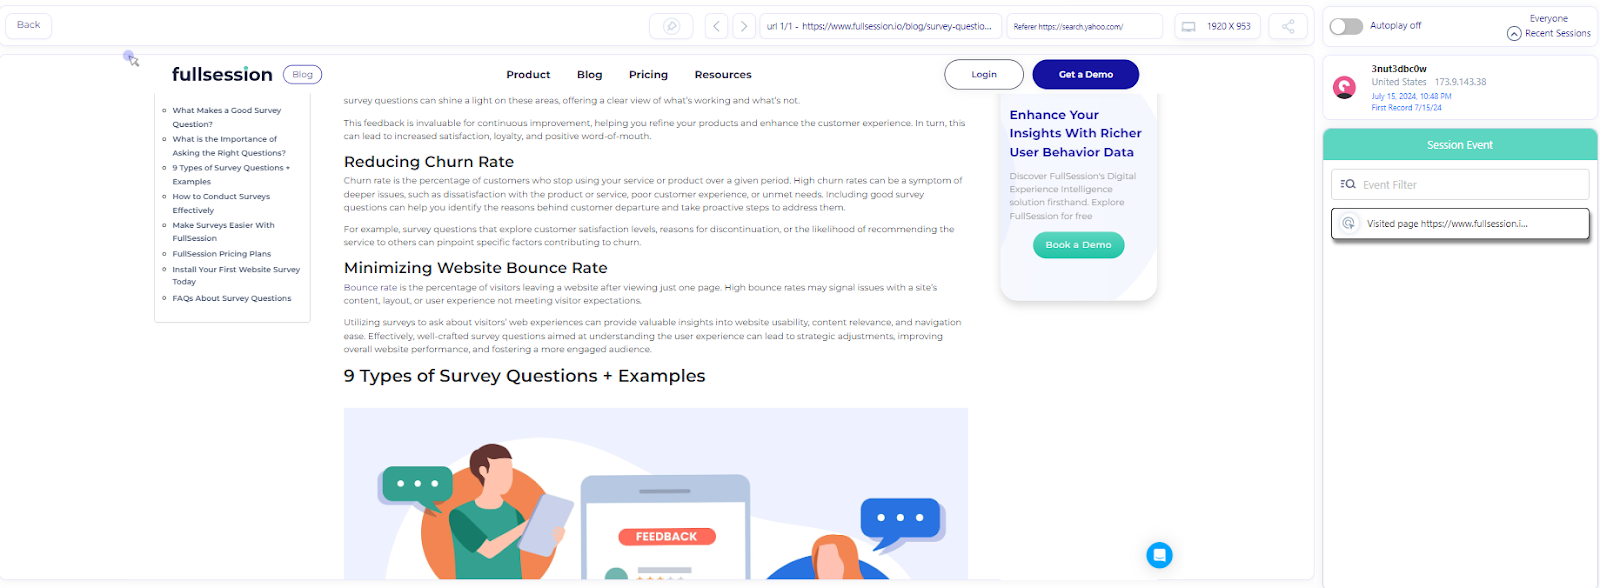
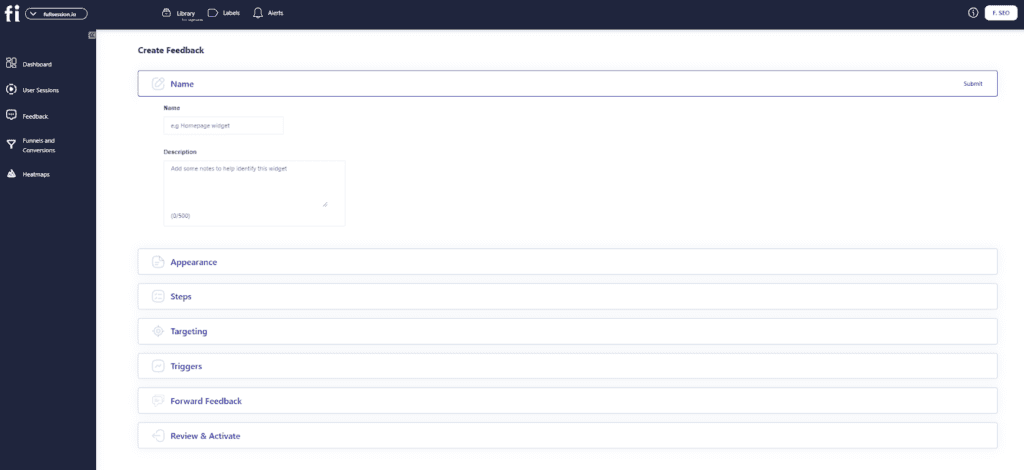
FullSession session recordings and replay tools
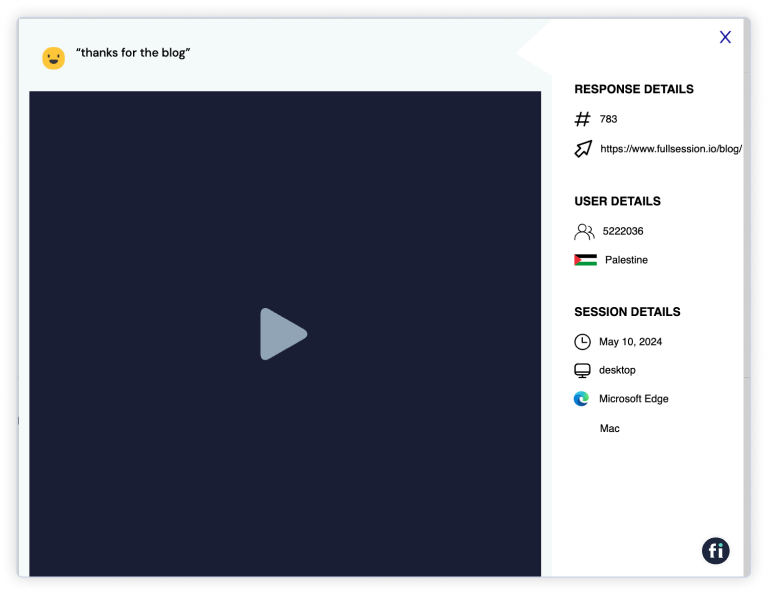
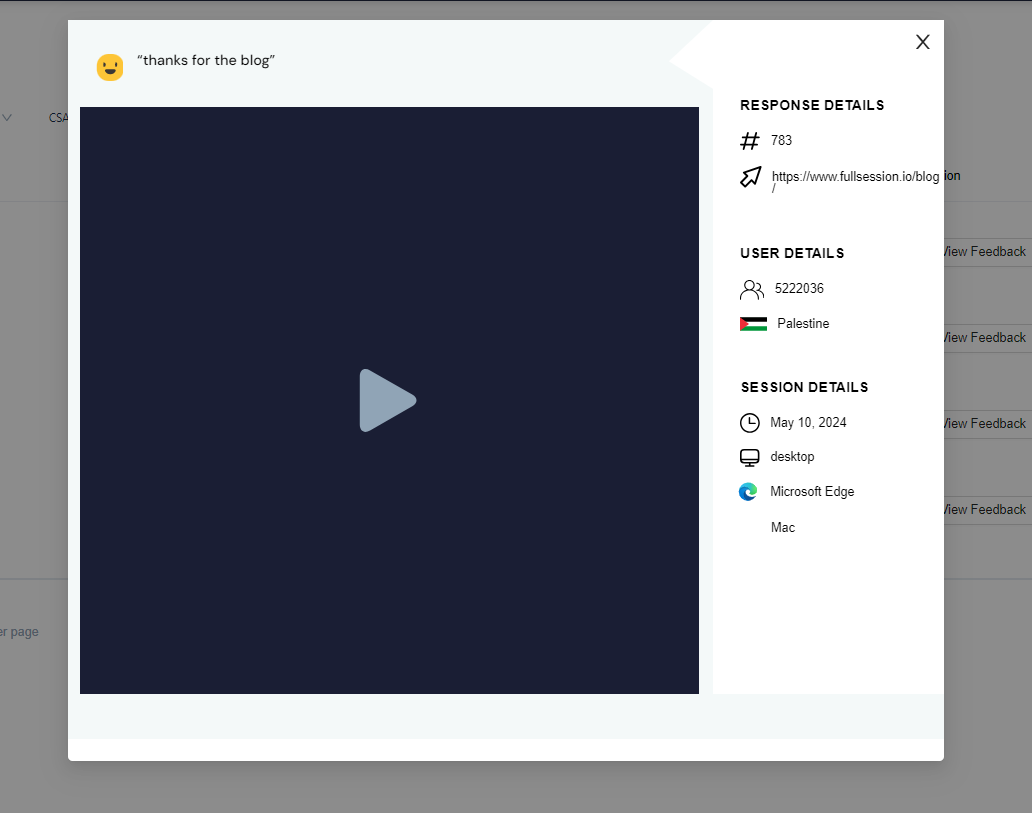
For best results, you should combine session recordings with heatmaps. FullSession logs and shows every visitor action in a session recording, for desktop and mobile sessions.

It’s a faster way to analyze users’ behavior on your webpage and find opportunities to improve the user experience. For detailed information, read our guide on session recordings and replay.
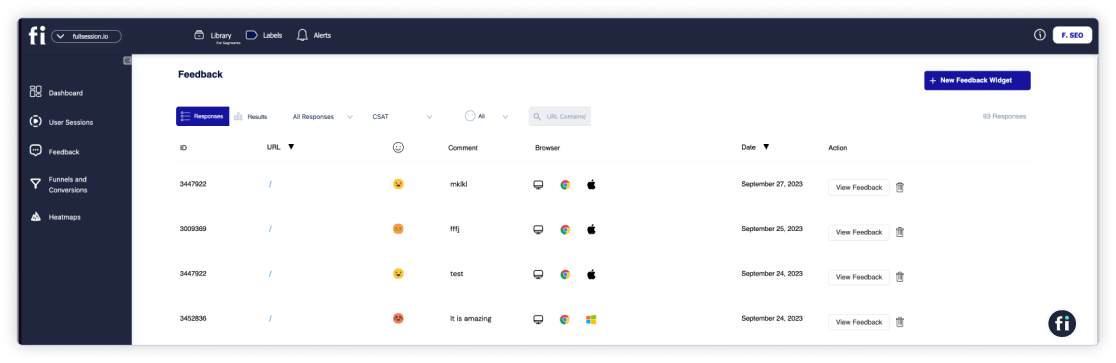
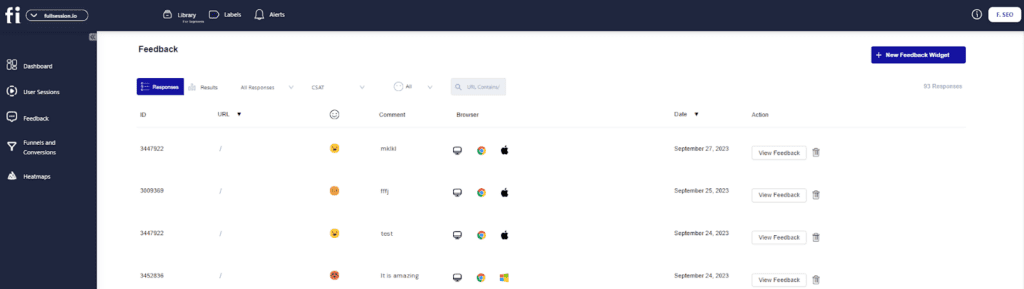
What customer data do you get with FullSession session recordings?
You can easily watch session recordings using the FullSession replay feature that shows:
- Your visit sources
- The IP address of each visitor
- The date of the first session recording
- The average time spent on the page
- The total time spent on pages
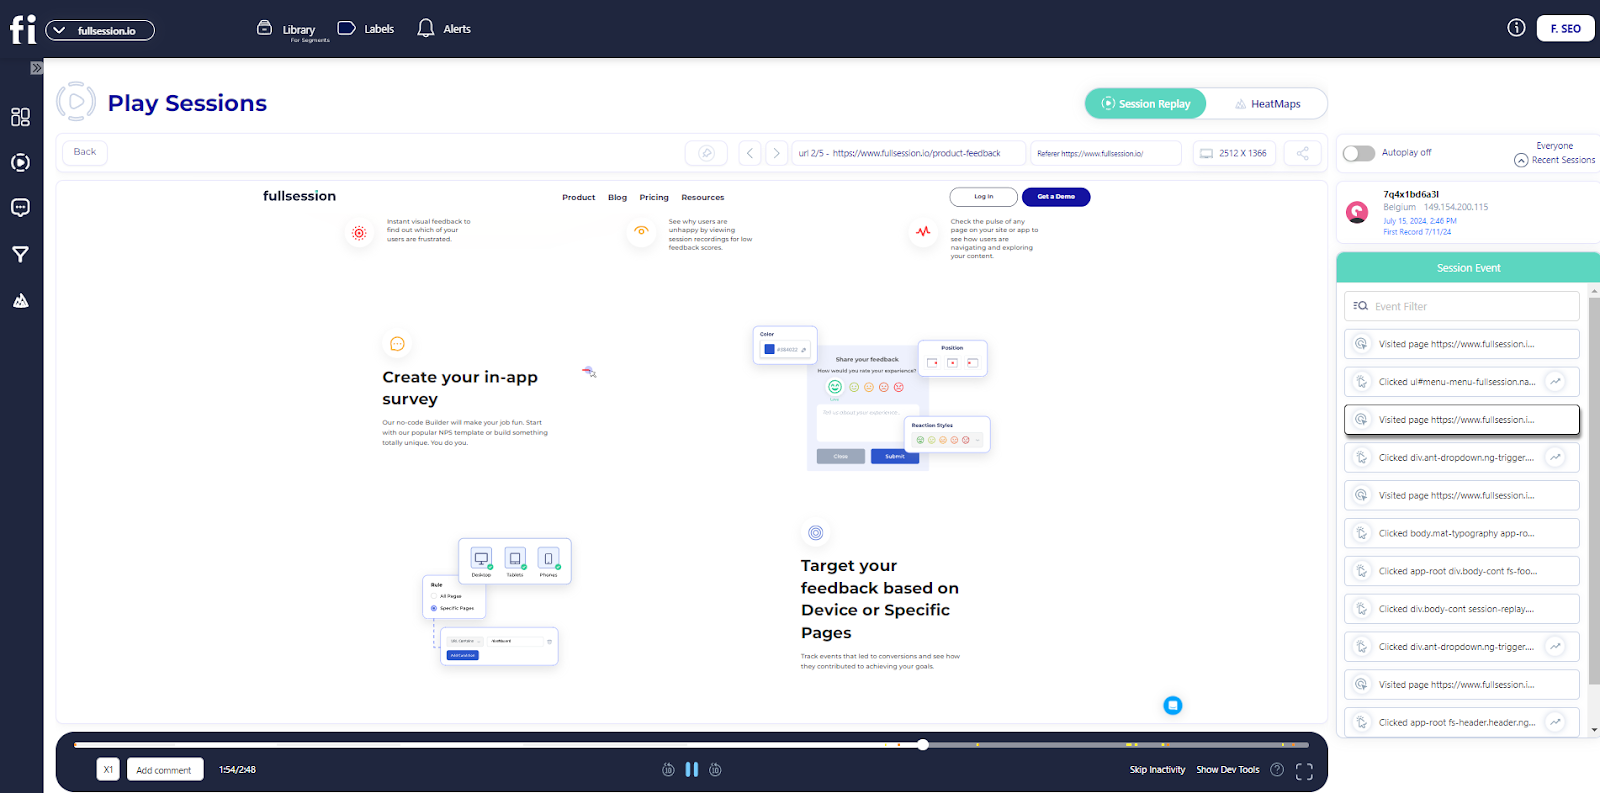
With a session list and session events, you can analyze and inspect users’ actions on each page, from how many times they click on an element to how long it takes them to complete a purchase.
It will show you how often they clicked on buttons and links, visited certain pages, or had any unexpected issues. Whether you want to design better experiences for your customers or reduce your bounce rate, FullSession can help.
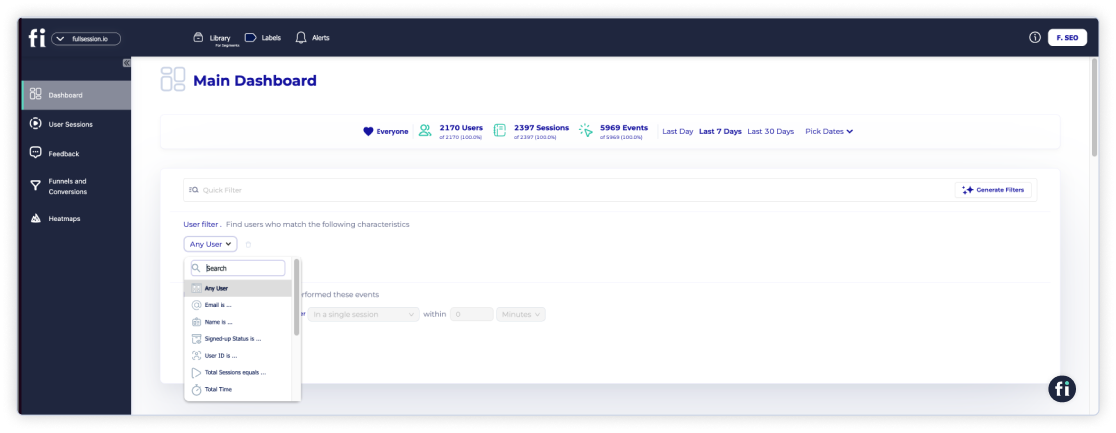
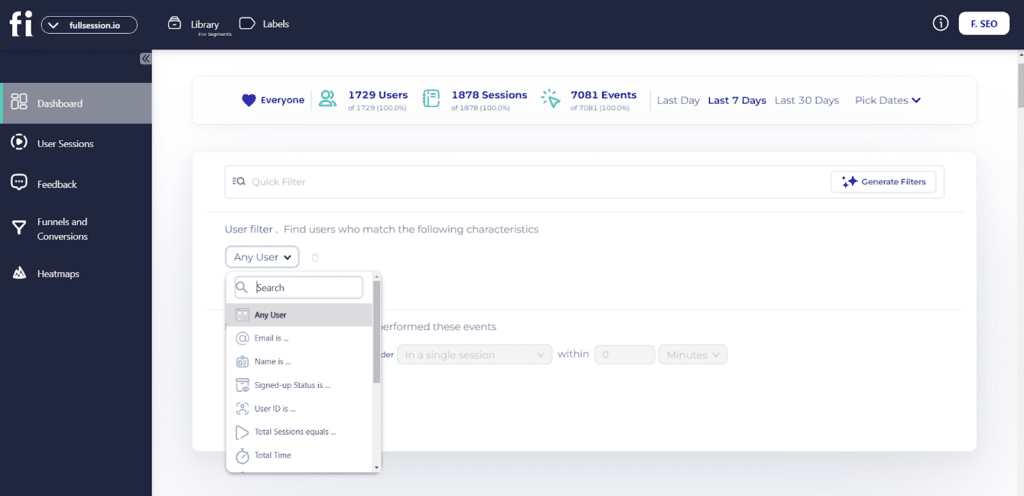
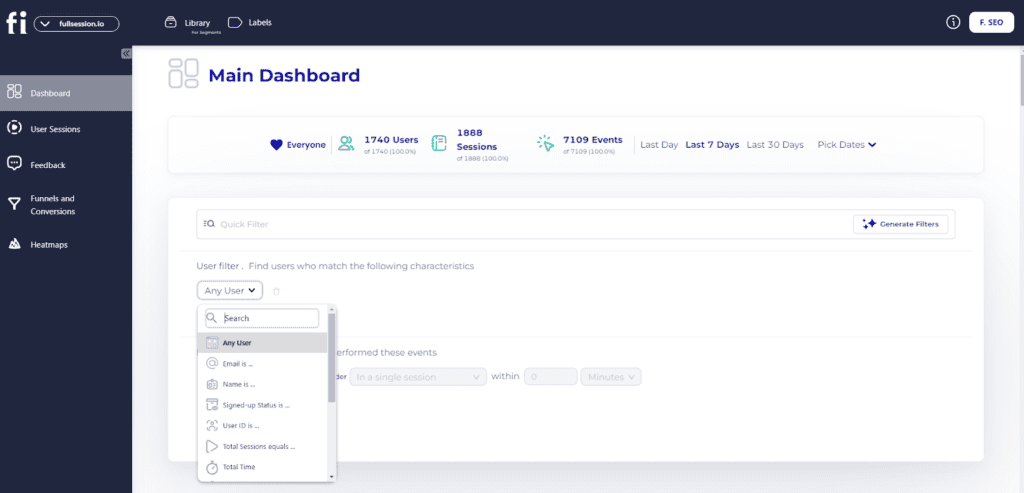
FullSession user insights and events filtering
With advanced filtering options based on many parameters, you’ll be able to save time and quickly find the session replay details you need.
FullSession ensures you only receive relevant search results and includes insights on rage clicks, dead clicks, error clicks, or trashed cursors, among other data.
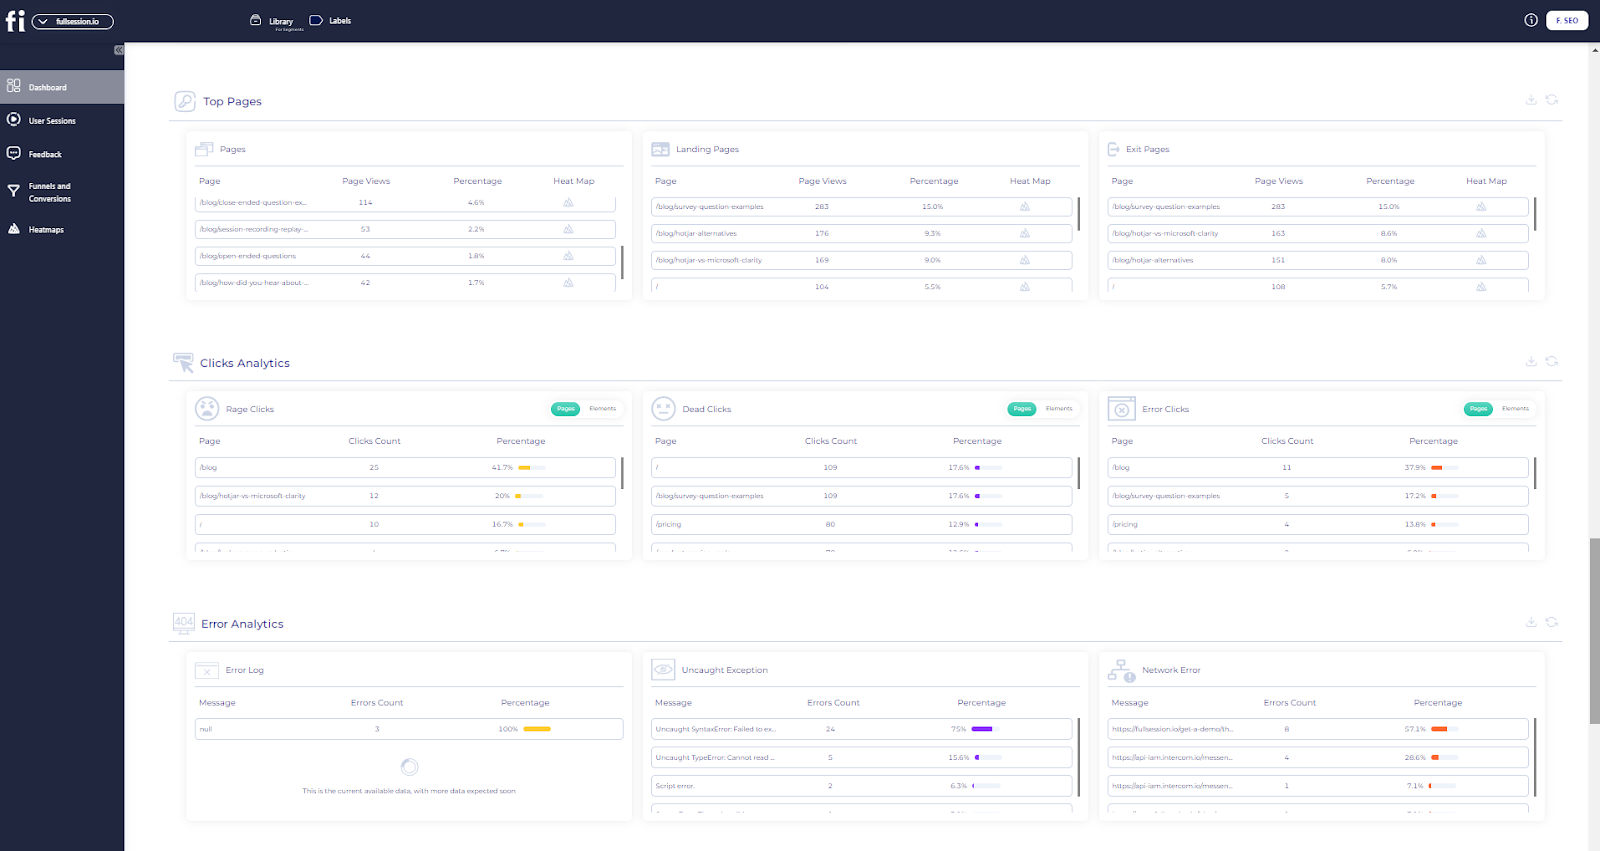
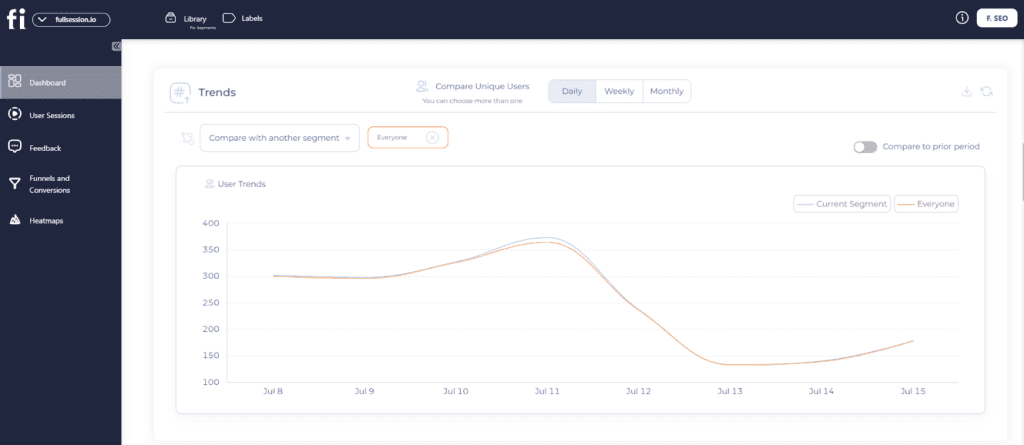
The new FullSession metrics tab allows you to view all your data in one place. It divides reports into three sections and helps you to see insights for up to one year:
User engagement
- Median scroll depth by device
- Page load speed by browser
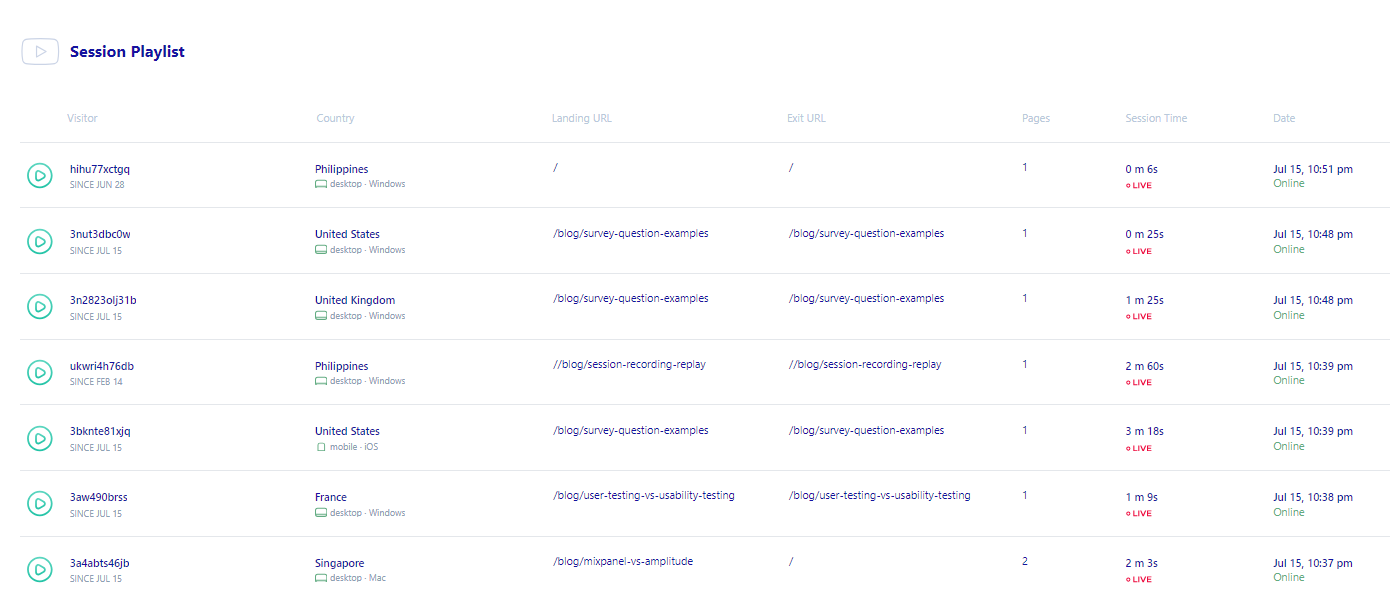
- Session playlist
- Top users
- User trends
- Breakdowns (based on device, browser, and screen)
User experience
- Event per session
- Session length
- Active time
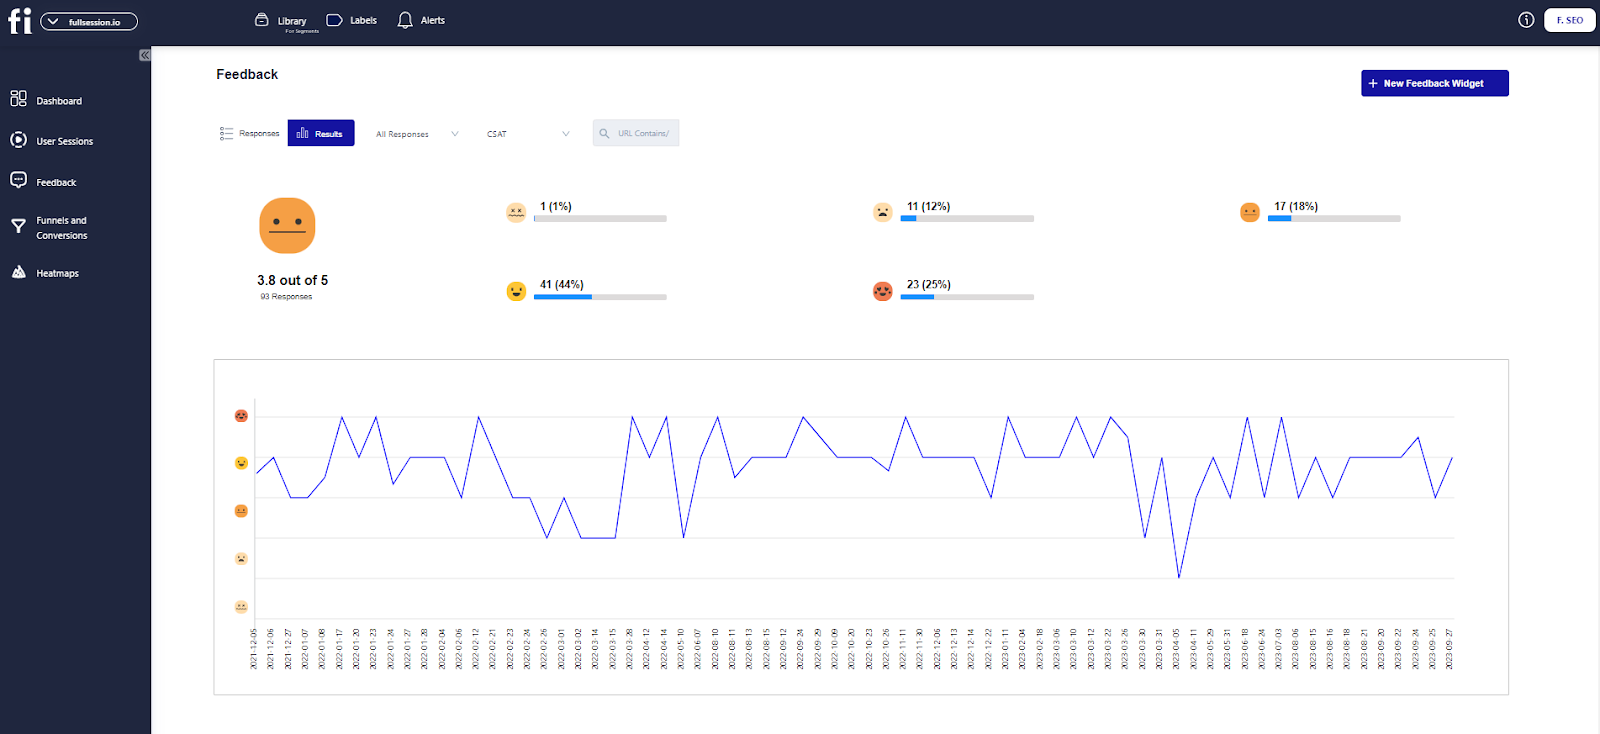
- Feedback data
- Top pages
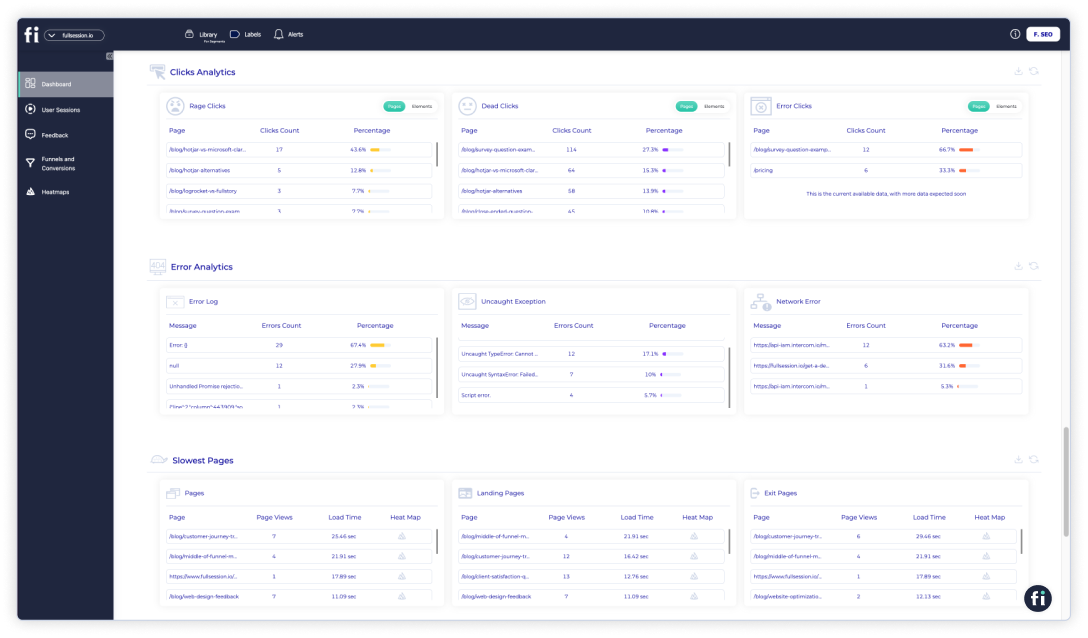
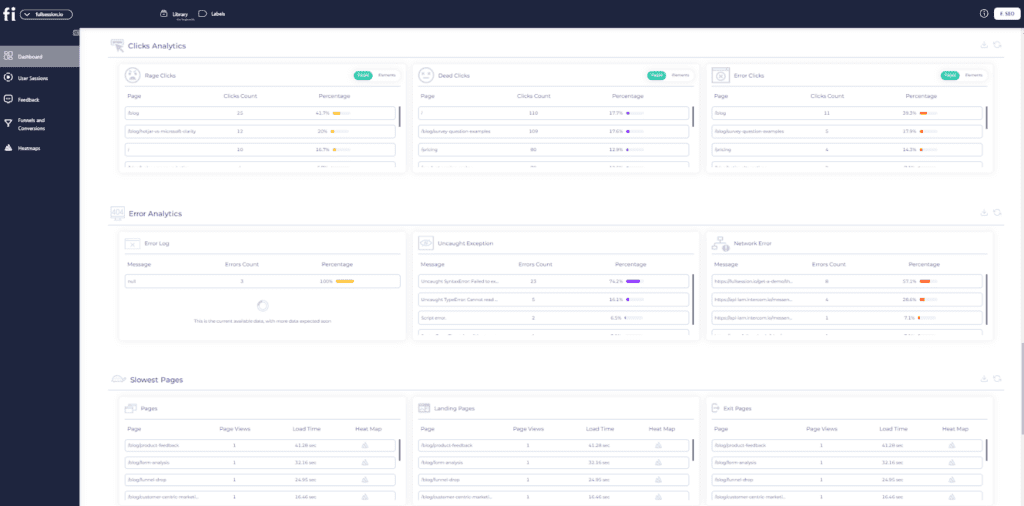
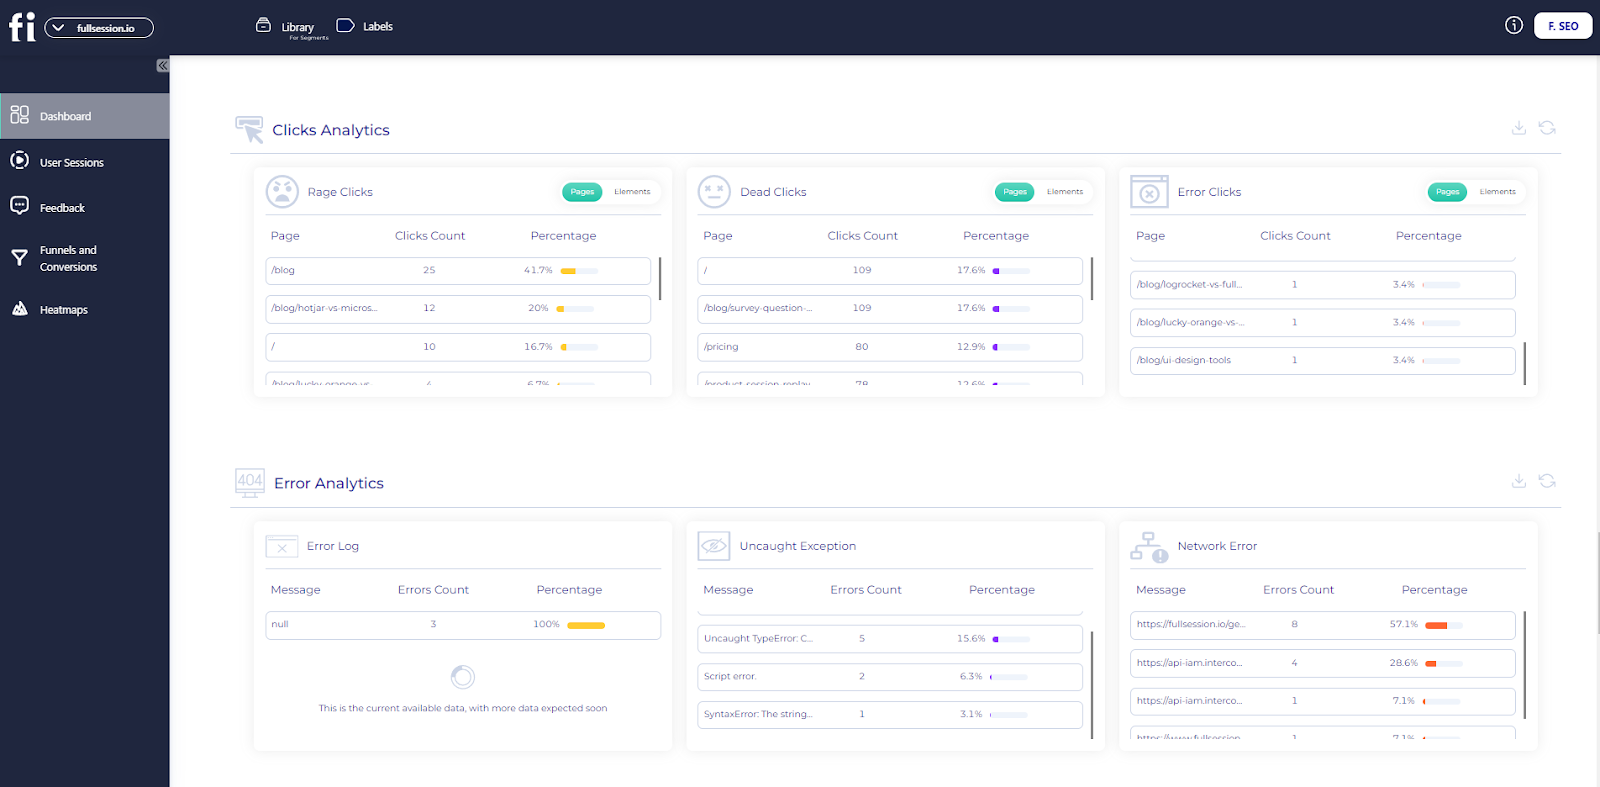
- Clicks analytics
- Error analytics
- Slowest pages (pages, landing pages, and exit pages)
Marketing channels
- UTM analytics
- Top referrers
With FullSession, you can examine every metric and understand exactly what it means for your business. With data-supported insights, you’ll maintain healthy revenue growth and make smarter business decisions.
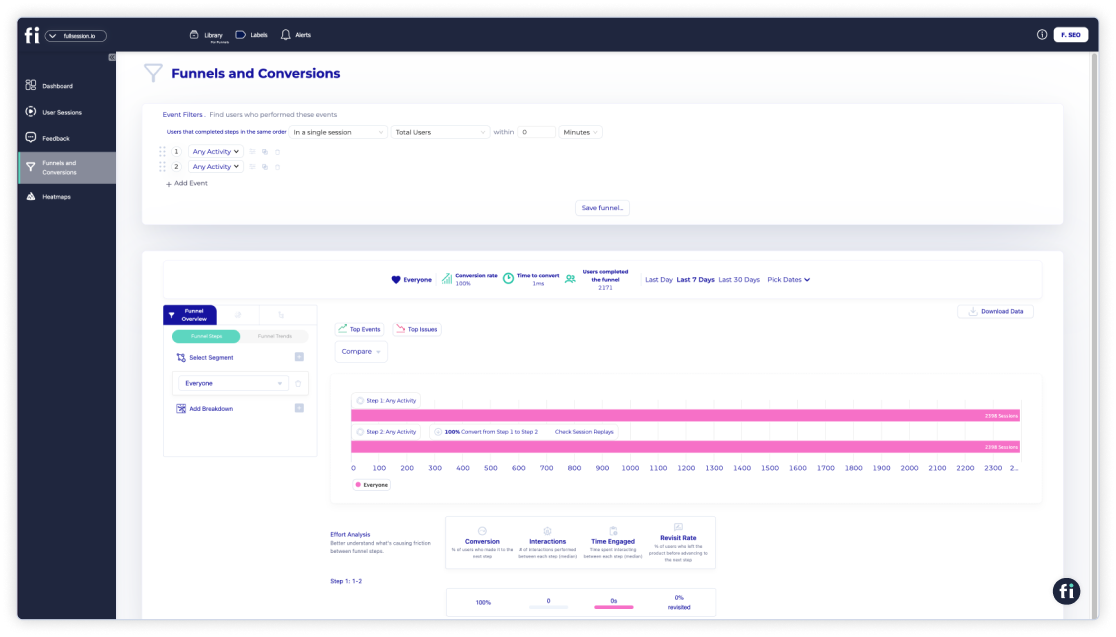
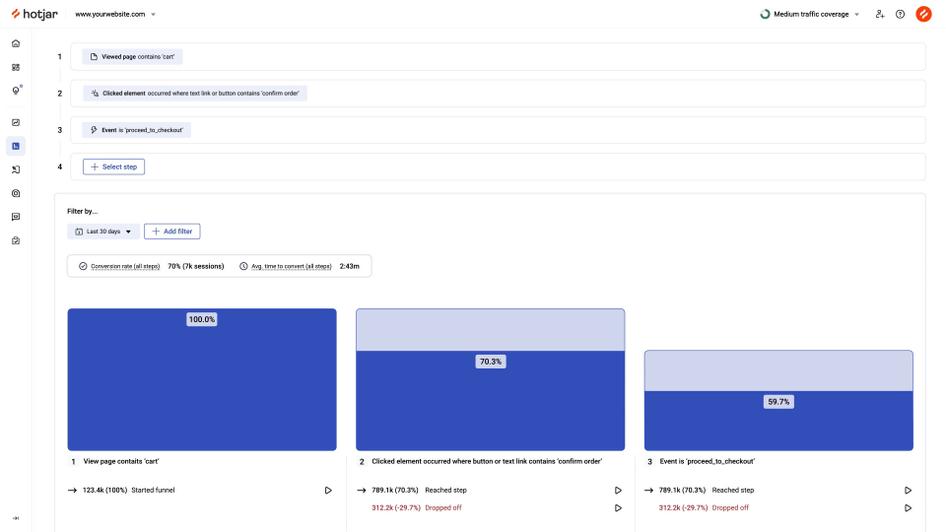
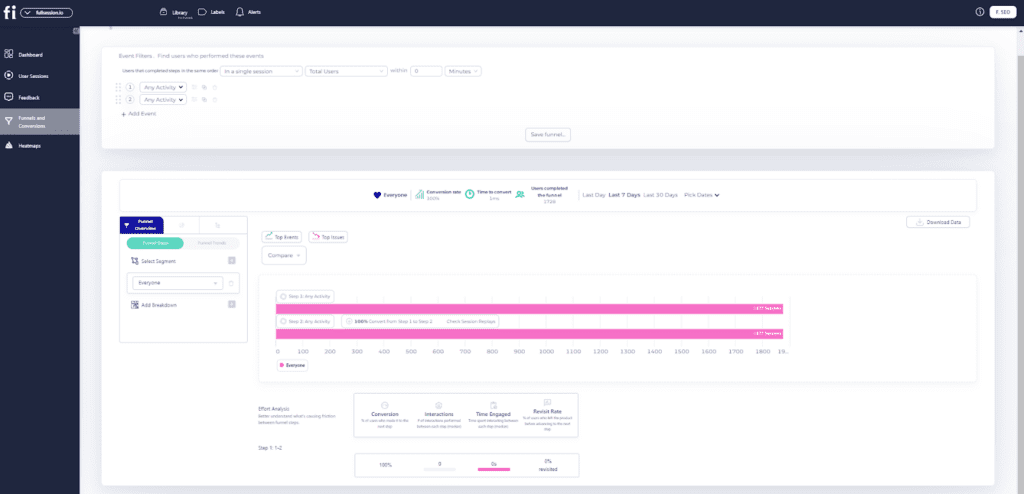
FullSession funnels and conversions
The FullSession funnels and conversions feature provides detailed insights into user journeys, helping track and optimize each step of your conversion funnel. It visualizes user progression, monitors conversion trends, identifies key actions and obstacles, and analyzes user effort.

Segmenting user data and comparing time periods helps tailor experiences and enhance overall performance. Key components include:
- Funnel steps
- Funnel trends
- Top events
- Top issues
- Time engaged
- Top engaged
- Revisit rate
- Segment analysis
- Time period comparison
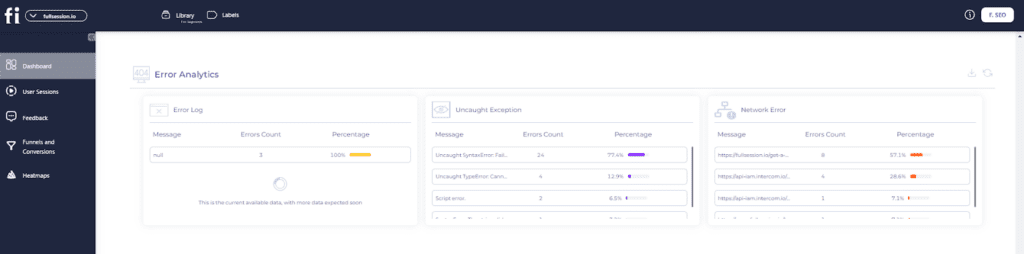
FullSession error tracking and analysis
The FullSession error analysis feature helps you identify, analyze, and resolve errors impacting user experience. By leveraging data on error clicks, network errors, console errors, error logs, and uncaught exceptions, it provides actionable insights to improve the reliability and user satisfaction of your digital products.

This feature monitors error trends, offers segmentation and filtering, integrates with session replays for context, and provides real-time alerts via Slack, ensuring your team can swiftly address issues and enhance the overall user experience.
Start Collecting Heatmap Data With FullSession Today
Understanding how visitors click around your website is the first step to upgrading your online presence and optimizing your user journey.
Click maps are your secret weapon. They offer clear insights into user behavior, allowing you to make smarter decisions for your online business.
By analyzing click map data, you’ll uncover details that help you tweak and optimize for a smoother, more engaging user experience and better conversion rates.
Curious to see how click maps can transform your user flow and website? Give FullSession a try! With our powerful click maps, scroll maps, and other advanced tools, you’ll get a clear picture of user behavior.
FullSession allows you to:
- Capture real-time interactions with dynamic elements for accurate user insights
- Process heatmaps quickly without compromising website performance
- Ensure user privacy by not recording sensitive information
- Handle large volumes of data efficiently to uncover crucial insights swiftly
- Limit behavior tracking to your own site to avoid data misuse
- Promote seamless team collaboration by centralizing efforts on a single platform
Book a demo today and see why FullSession is the right tool to enhance your digital experience.
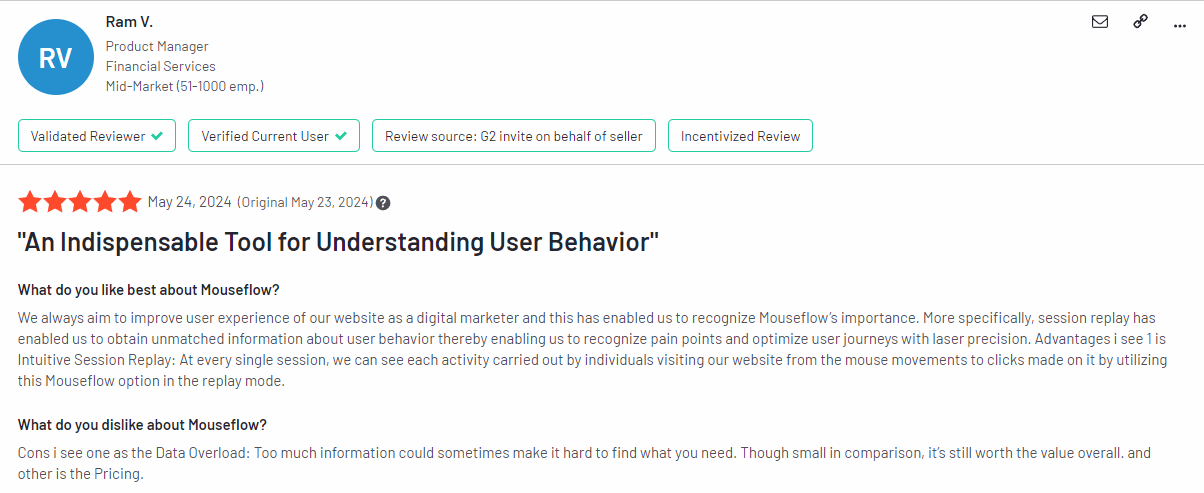
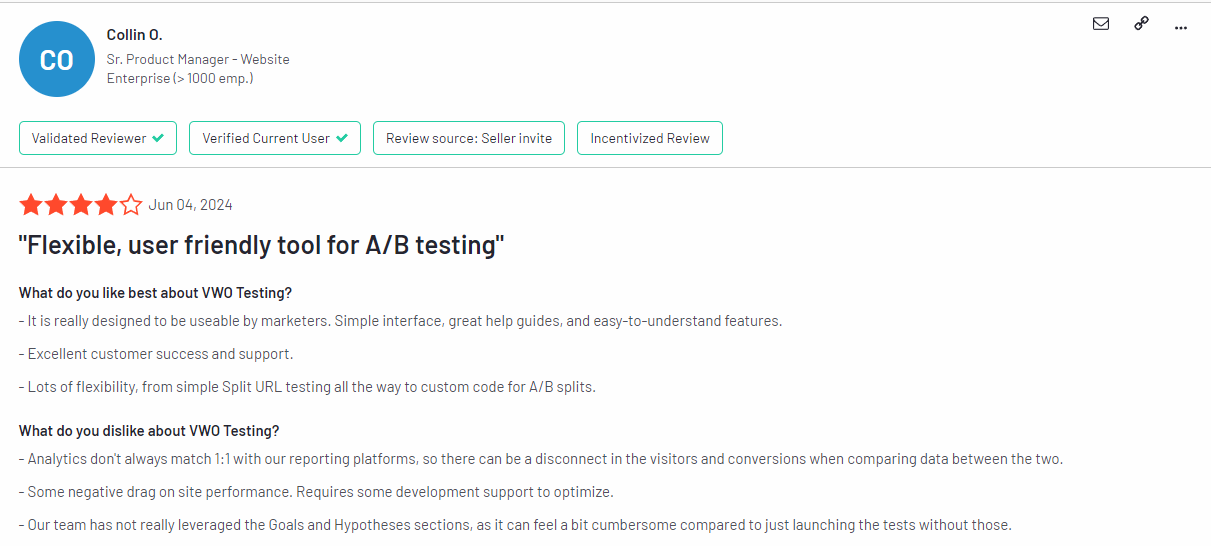
If you found this article helpful, check out our other guides on session recordings and customer feedback tools. You can also find our reviews and comparisons of Mouseflow vs VWO, LogRocket vs FullStory, LogRocket competitors and more.
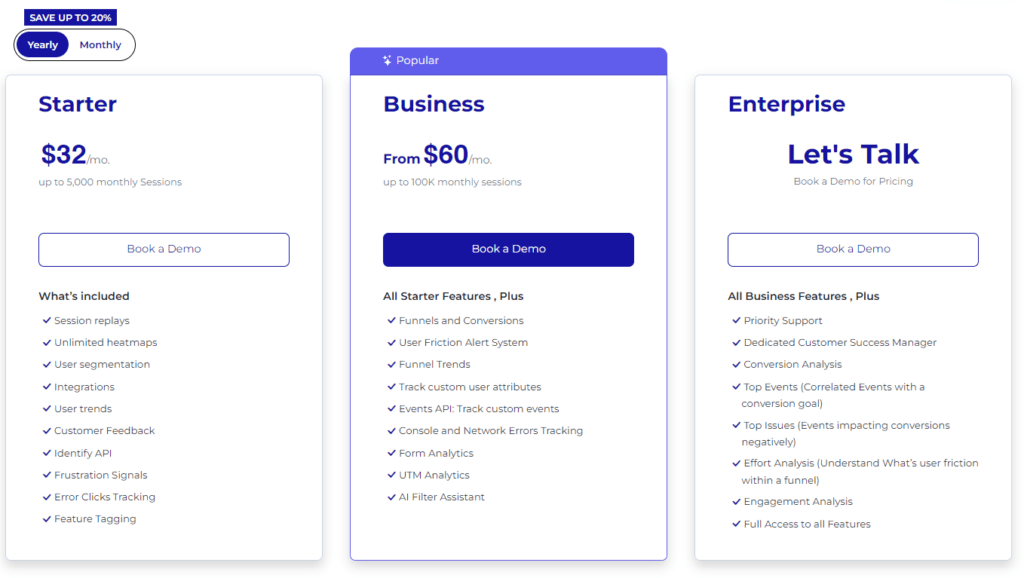
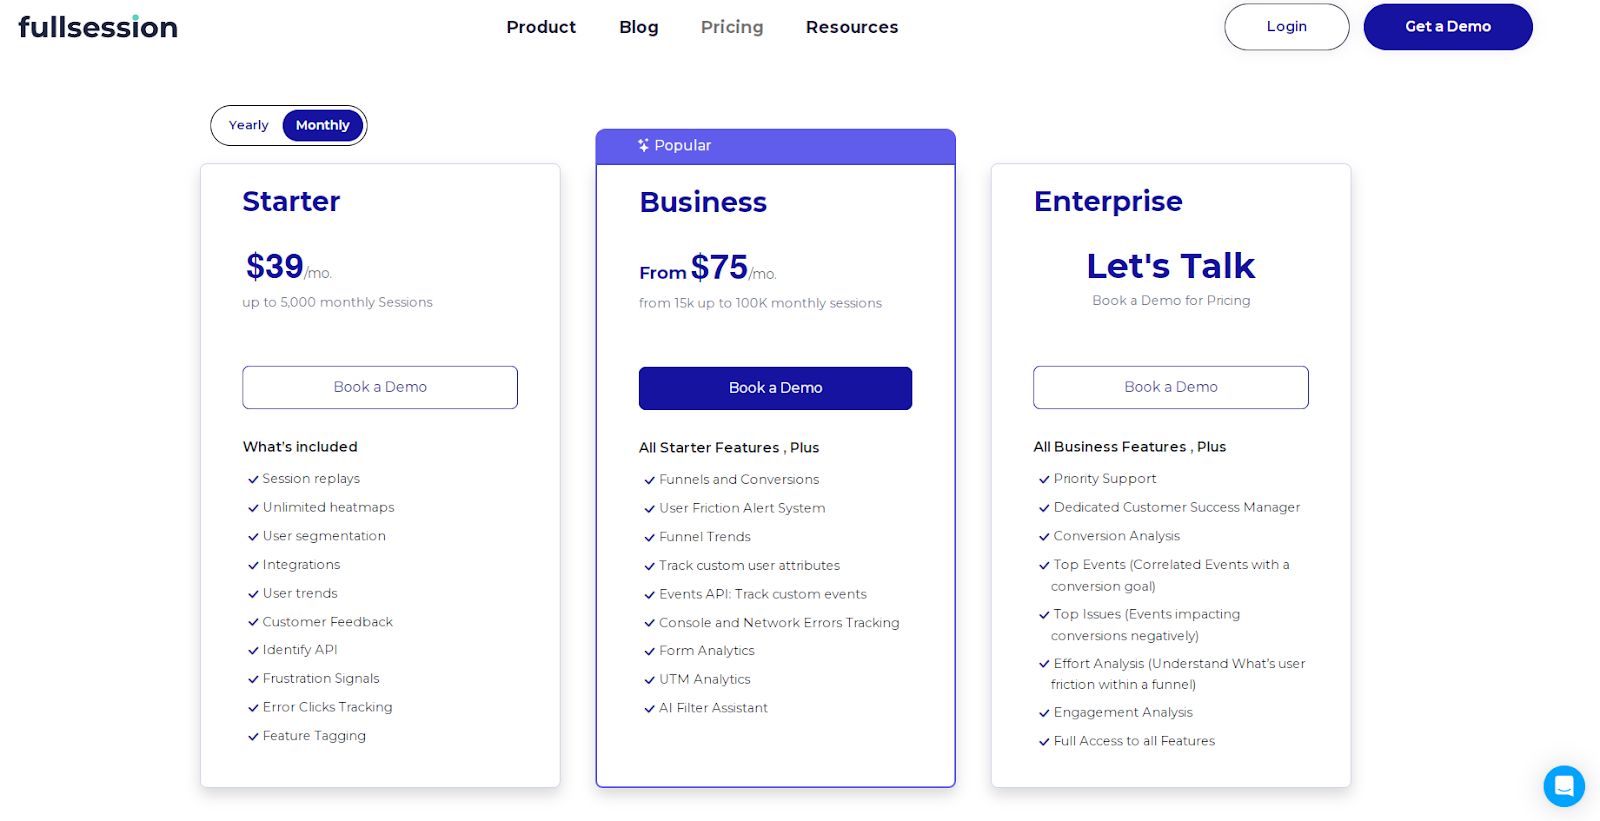
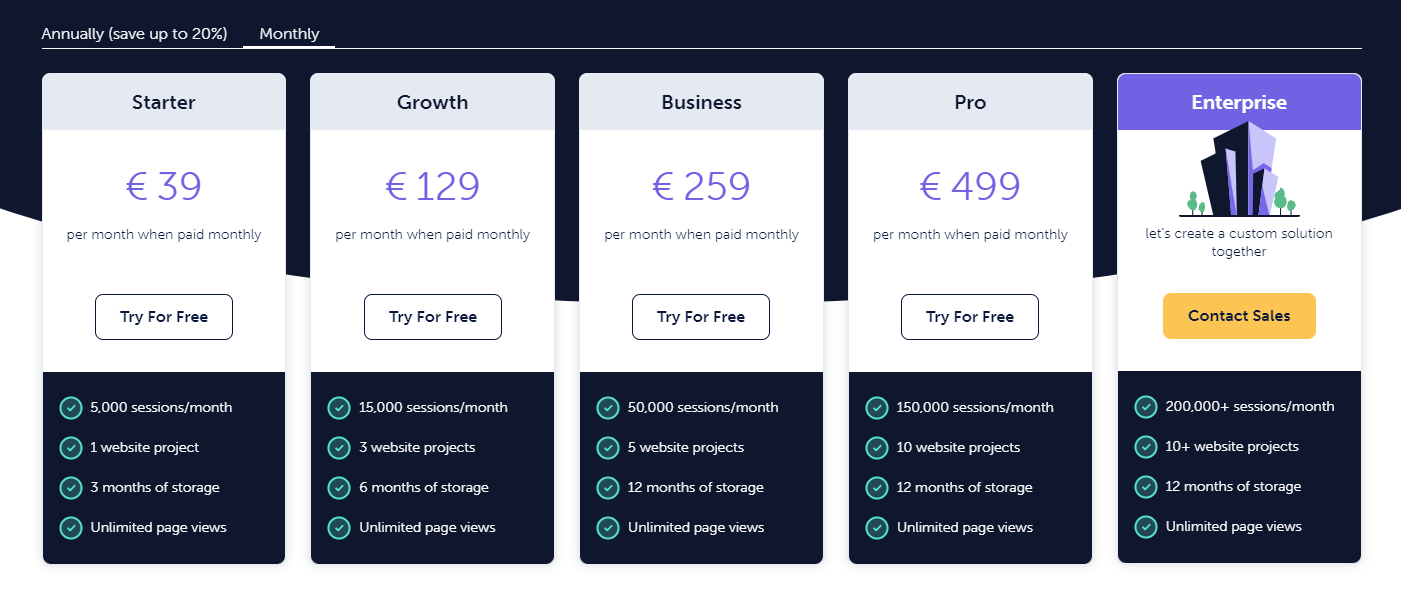
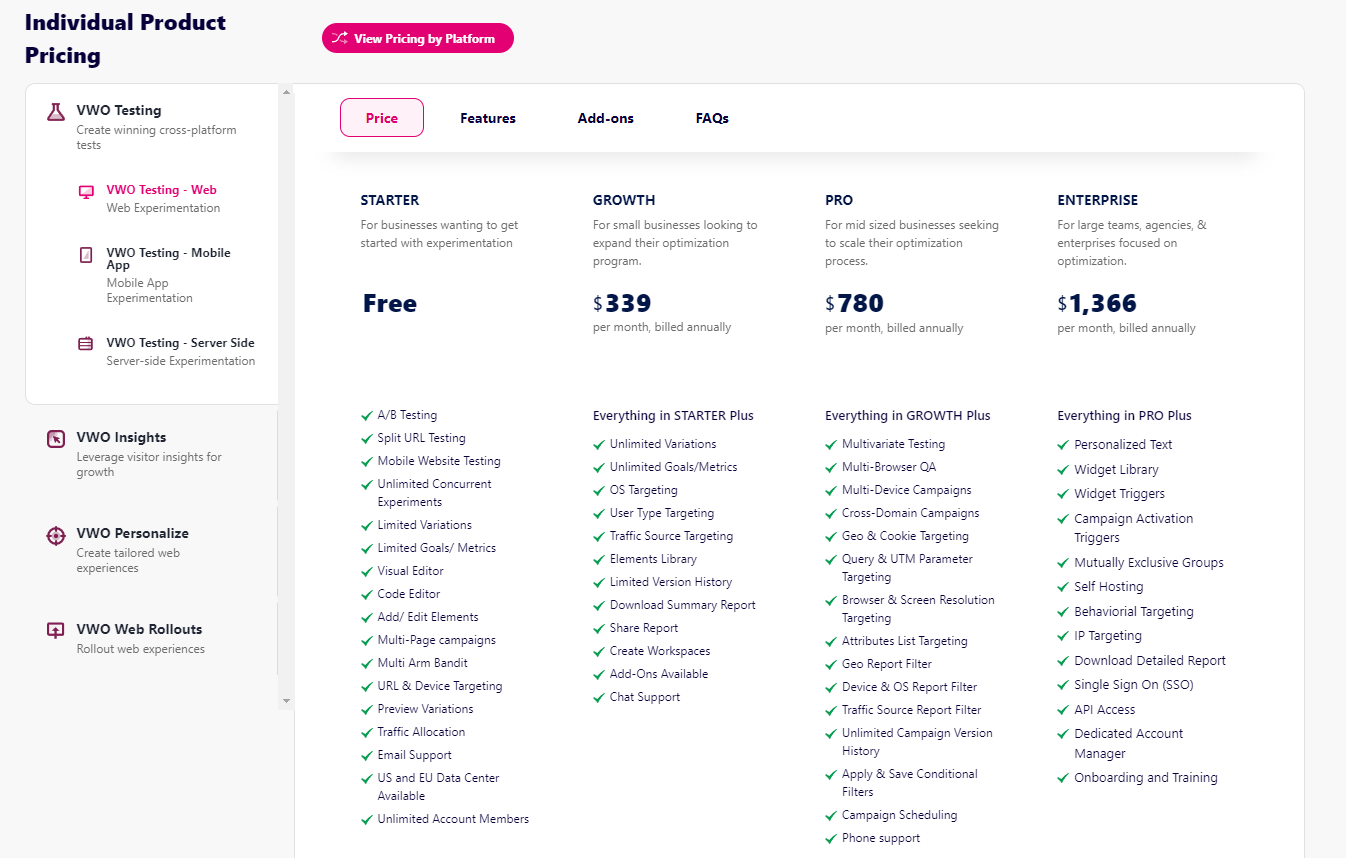
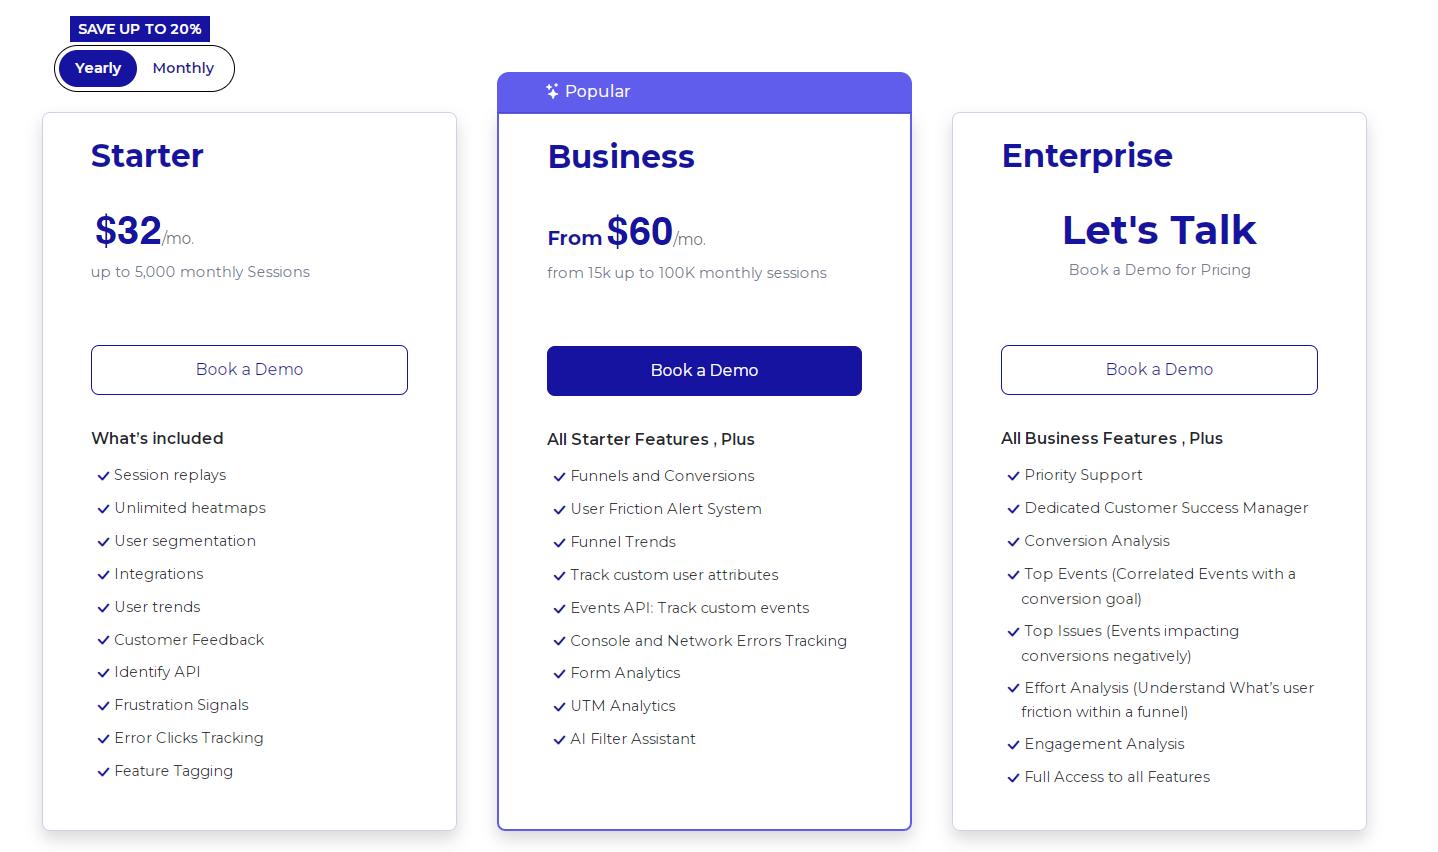
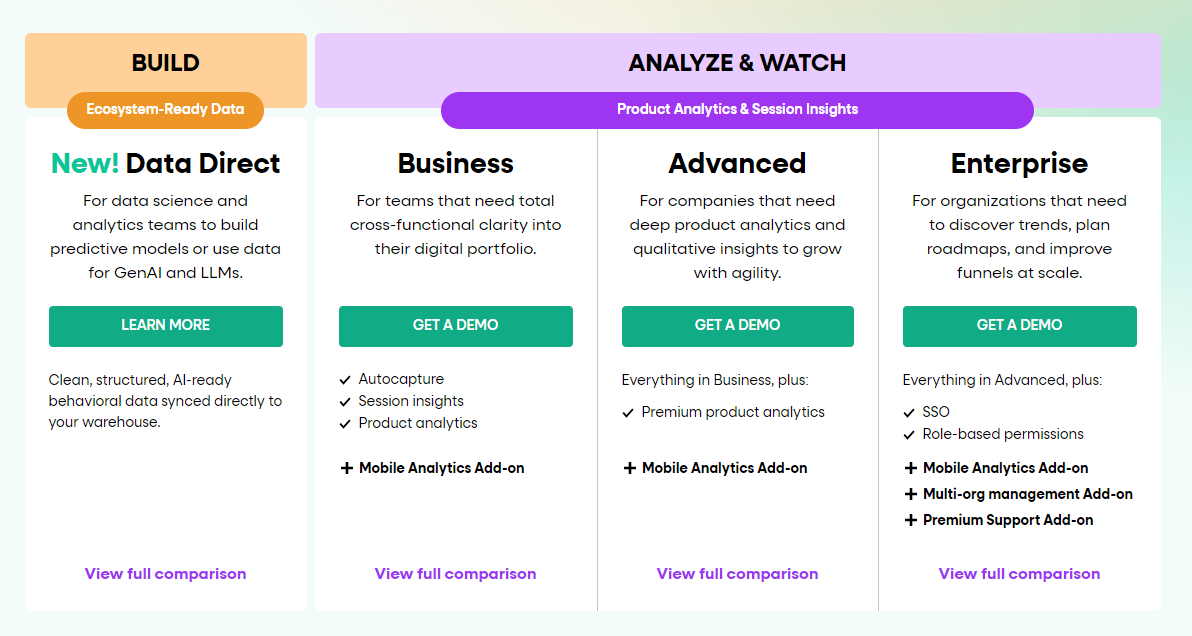
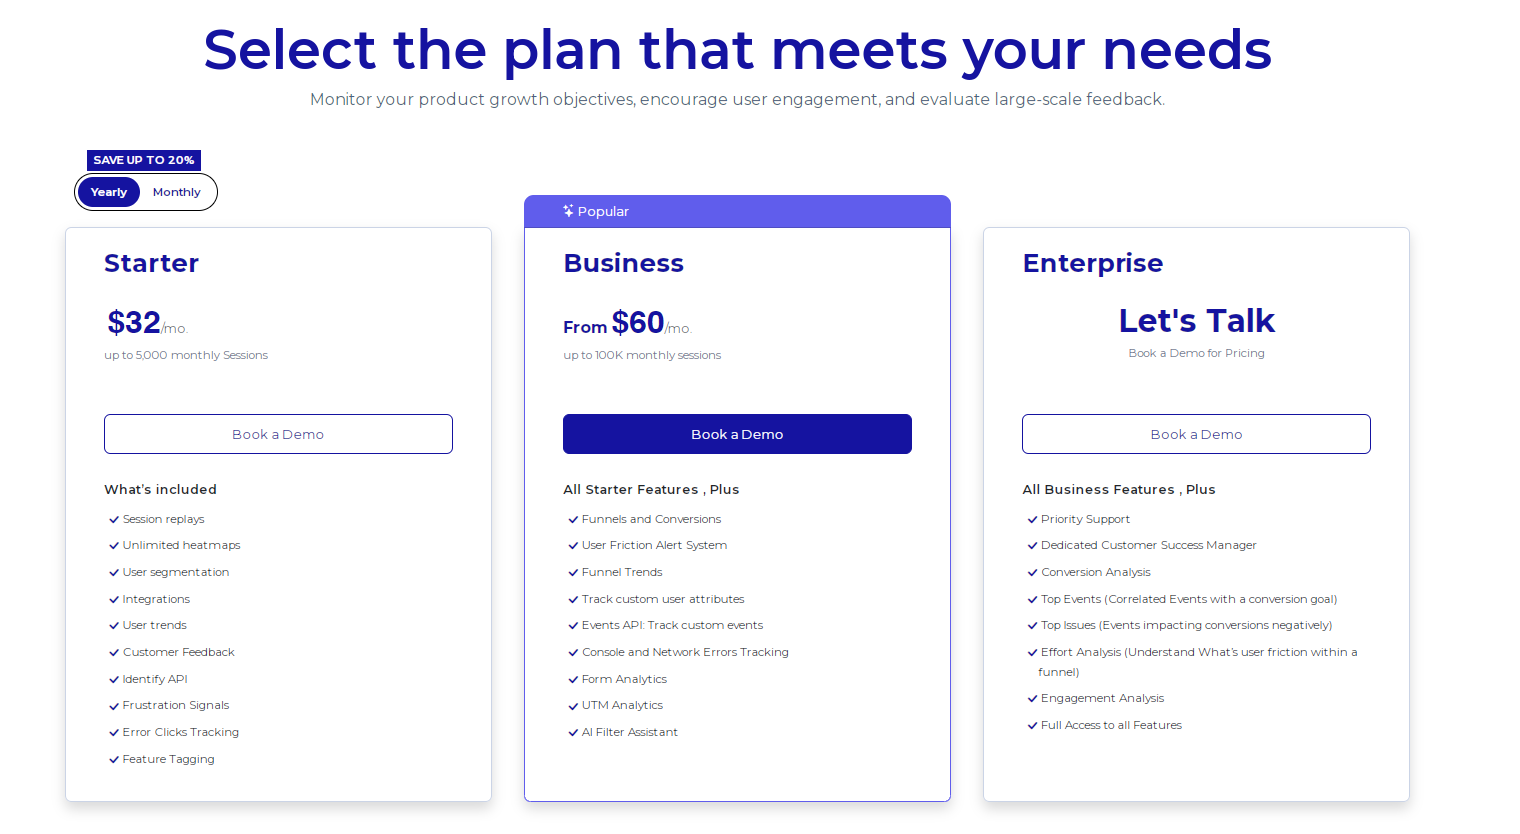
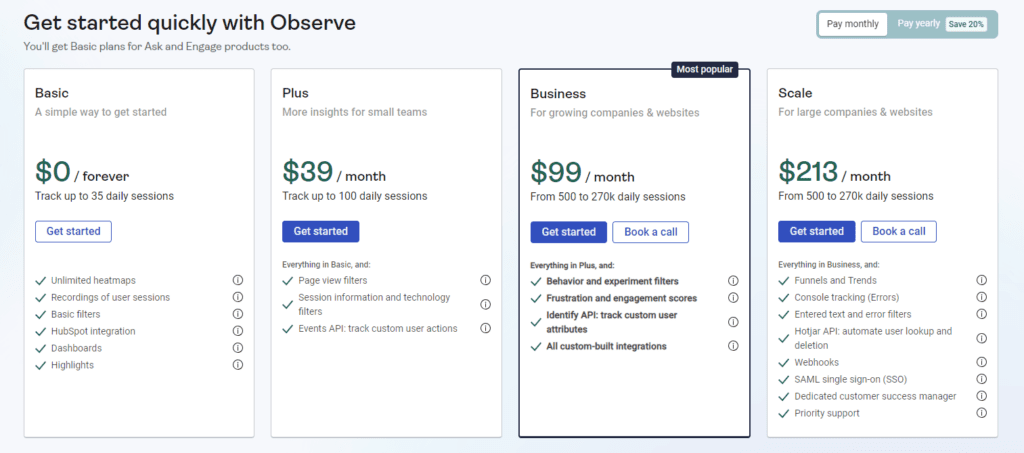
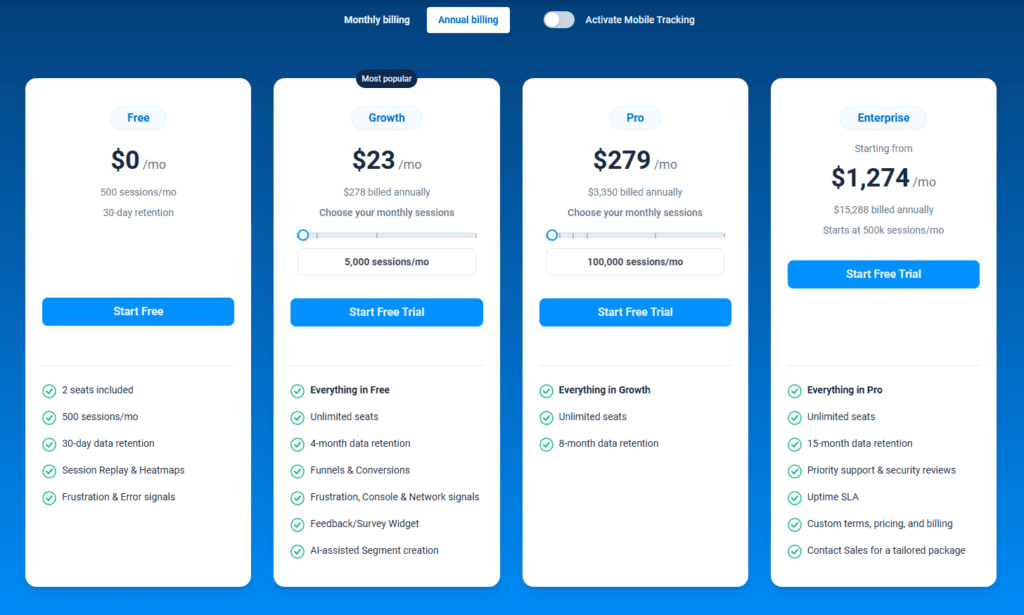
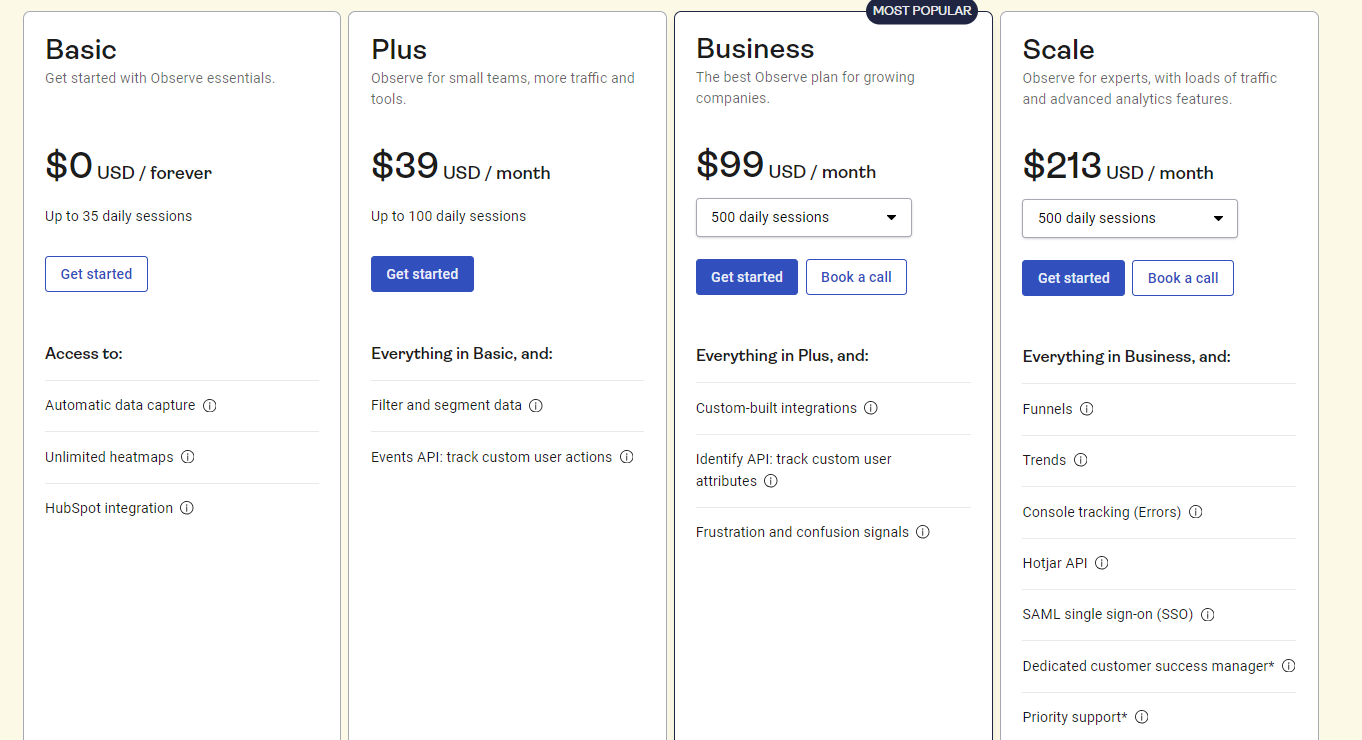
FullSession Pricing Plans
FullSession offers a free trial so you can test all features before subscription. The annual plan can save you up to 20%!
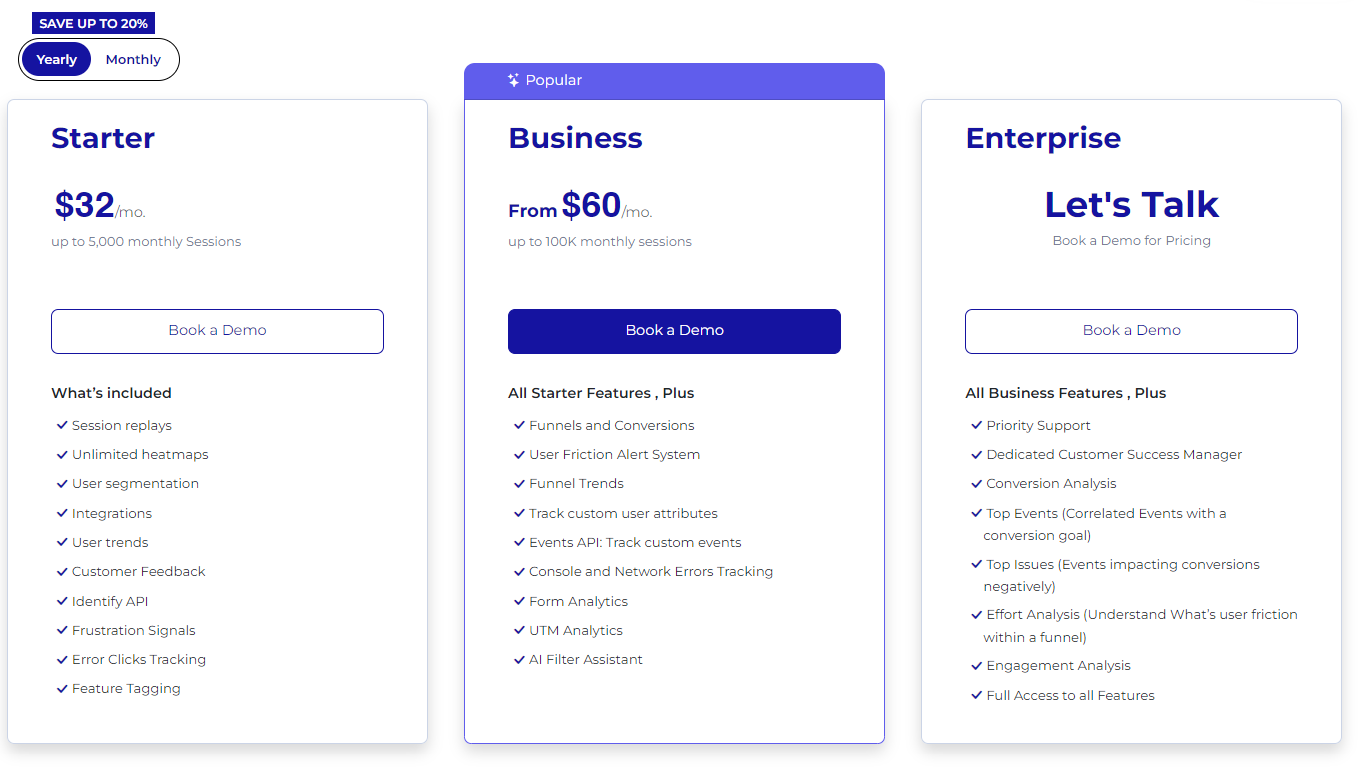
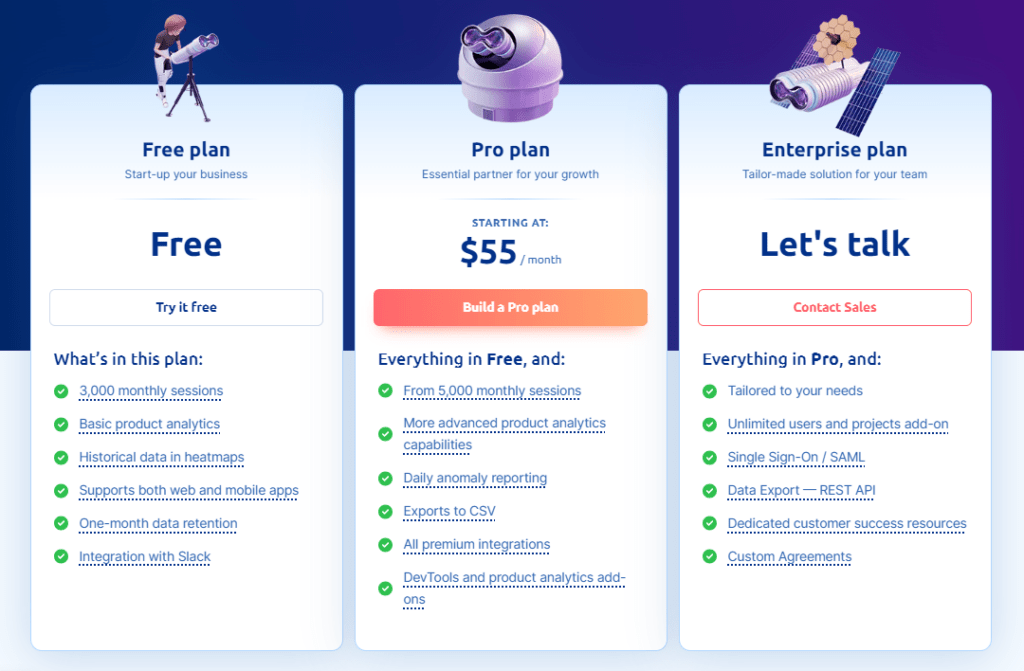
- The Starter plan costs $39/month or $32/year and lets you track up to 5,000 monthly sessions.
- The Business plan starts at $75/month or $60/year and lets you track up to 100,000 monthly sessions.
- The Enterprise plan gives you full access to all features. You can book a demo for more details.
We also provide a customized pricing package if your business has specific website analytics needs. Check out our Pricing page.
FAQs About Click Maps
What are click maps?
Click maps are visual tools that show where users click on a webpage. They highlight the most and least clicked areas, providing insights into user behavior and helping identify which elements are engaging or causing issues. They also help you track signs of frustration, such as rage clicks, a specific link that leads nowhere, or some other element that’s broken.
How to make a click map?
To create a click map, use a tool like Hotjar or FullSession. Integrate the website heatmap tool with your website, and it will start tracking user clicks automatically. The tool will then generate visual representations of click data, highlighting hotspots and areas with little to no interaction.
How much is a click on a map?
The cost of using click maps depends on the analytics tool you choose. Tools like FullSession typically offer tiered pricing plans based on the volume of tracked sessions or features included. Prices can range from free for basic plans to several hundred dollars per month for advanced features and higher usage limits.
How are clicks tracked?
You can track clicks by embedding a tracking code or script from an analytics tool like FullSession into your website. This code captures user interactions, including clicks, and sends the data to the tool’s servers, where it is processed and visualized in the form of click maps and other analytics reports.


![Website Tracking: How to Do It + 5 Tools [Free & Paid]](https://www.fullsession.io/wp-content/uploads/2022/11/unnamed-7.jpg)


![6 Best Website Heatmap Tools in 2025 [Comparison Guide]](https://www.fullsession.io/wp-content/uploads/2022/02/image1-2.png)