Providing a relevant and meaningful user experience is essential for any website, but defining what makes up a good user experience can be challenging.
Luckily, UX analytics tools can help you better understand user behavior so you can know exactly what kind of UX to offer your users.
We created FullSession after thorough research of other UX testing tools on the market. It helps improve the user journey and overall product performance via interactive heatmaps, session recordings, customer feedback forms, conversion funnel analysis, and error tracking.
With this article, we will help you learn more about UX analytics and show you 11 ways you can use UX analytics tools to reach your goals. First, let’s cover the basics.
Improve Your Website UX and UI With FullSession
Learn how our interactive heat maps help you find cold spots and dead zones on your site.
What Is a UX Analytics Tool?

A UX analytics tool gathers data on user activity, analyzes that data, and provides reports to help you better understand the user experience. It enables you to optimize your products according to users’ evolving needs.
It also helps product teams identify what works and doesn’t, providing clear indicators and benchmark results. These insights can be great for determining the effectiveness of a specific design or feature modification before the final implementation.
A UX analytics tool will help you answer essential questions about product use, such as:
- What are the user motivations?
- Can they achieve their desired goal?
- Does it relate to their values?
- What can your product do?
- What can users do with it?
- How accessible or intuitive is the product?
- Can you improve it in the future?
- What are the most significant issues users encounter, and how can you solve them?
What Are the Most Common UX Analytics Tools?
There are many different types of UX analytics tools available. You can choose the one that best suits your needs and goals.
Combining different tools is the way to go for a comprehensive analysis. Integrations can also be pretty helpful. They allow you to centralize results and conduct data analysis from various sources.
On the other hand, some solutions, such as FullSession, provide all the necessary features you can use for the UX analysis in one place.
Let’s explore the most common types of UX analytics tools.
Real-time analytics
Real-time analytics gathers and measures real-time user data. It provides insights into how users interact with your website, such as what they click on, what holds their interest longer, what elements they ignore, etc.
For example, a real-time analytics tool lets designers and developers react on the spot and solve problems before or as they occur or recognize opportunities for further improvements.
User flow maps
User flow maps depict user journeys on websites or mobile apps. They illustrate the user’s path from start to finish and help you understand the quality of their individual experiences.
With these maps, you will see how users navigate your website and find out if they reach their goals. An example of such a goal is making a purchase. User flow maps are essential in creating the experience you want your users to have.
They are also valuable for creating an intuitive user interface, as well as evaluating and modifying user interface elements.
Funnel analytics
Funnel analytics provides the information you need to analyze your conversion rates at any given point in your sales or marketing funnel. You can determine which steps in the flow are effective and cause users to drop off to decrease your conversion rates.
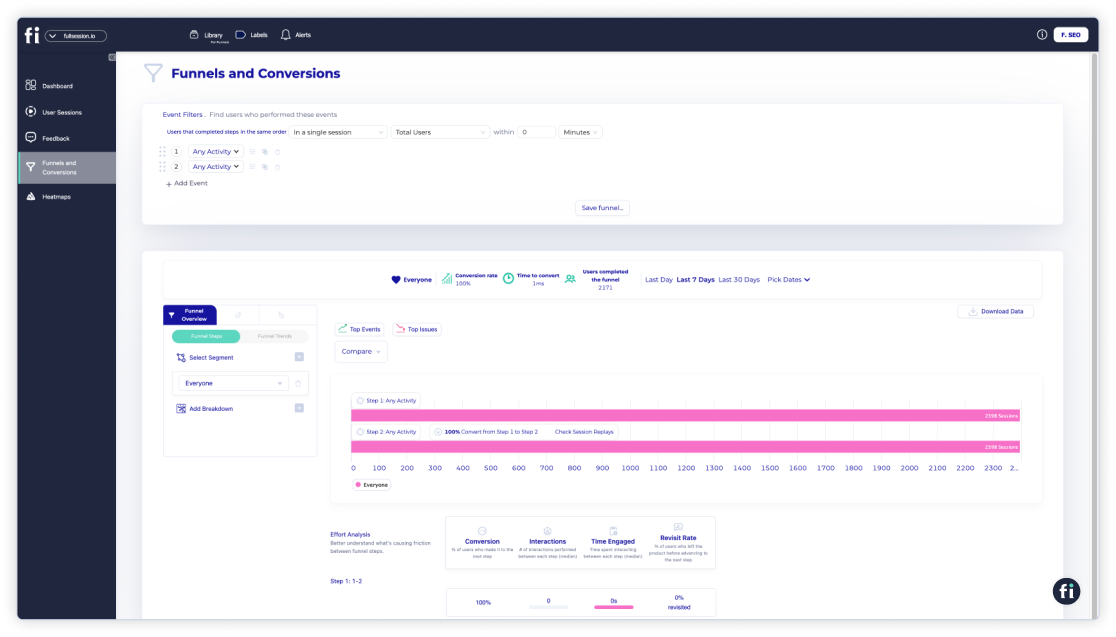
Conversion funnel analysis is a major strength of FullSession. The FullSession funnels and conversions feature is like having a smart guide for your user journeys. It tracks every step of your conversion funnel, helping you see where users are dropping off and what’s working to drive conversions.
Imagine you’re running an e-commerce site and notice that a lot of users are abandoning their carts right before checkout. With FullSession funnels, you can visualize each step of the funnel and see exactly where these drop-offs are happening.
For example, you might discover that users are spending too much time on the payment page, indicating a potential frustration point. By analyzing trends over time, you can see if this issue worsens during certain periods, like a sale.
The tool also lets you compare how different segments, like mobile users versus desktop users, interact with the funnel. If mobile users are dropping off more frequently, you could identify and fix mobile-specific issues.
FullSession helps you pinpoint these problems and optimize each step to improve conversions, ultimately leading to a smoother user experience.
Book a demo to see how it works.
Website usage analytics
Web analytics collects, measures, and analyzes data from website users’ actions. It compiles data into reports that help you understand how visitors interact with your website. You can monitor web traffic or conduct more complex analyses for market research and website optimization.
Web analytics tools, such as FullSession, provide resources for understanding user behavior and helping you make informed decisions. With web analytics, you can increase customer retention, attract new prospects, improve your sales funnel, and increase your ROI.
Heatmap analytics
Heatmap tools, which you can use with FullSession, show you pages with the highest user activity on your website. You see what parts of your site users are interacting with the most, usually by a heat gradient that shows click, scroll, or mouse movement activity.
Heatmap analytics can help you conduct funnel analysis and monitoruser behavior. It also provides insights on increasing user engagement. You can observe your A/B test performance, group your web traffic into segments, andevaluate your conversion paths to make necessary improvements.
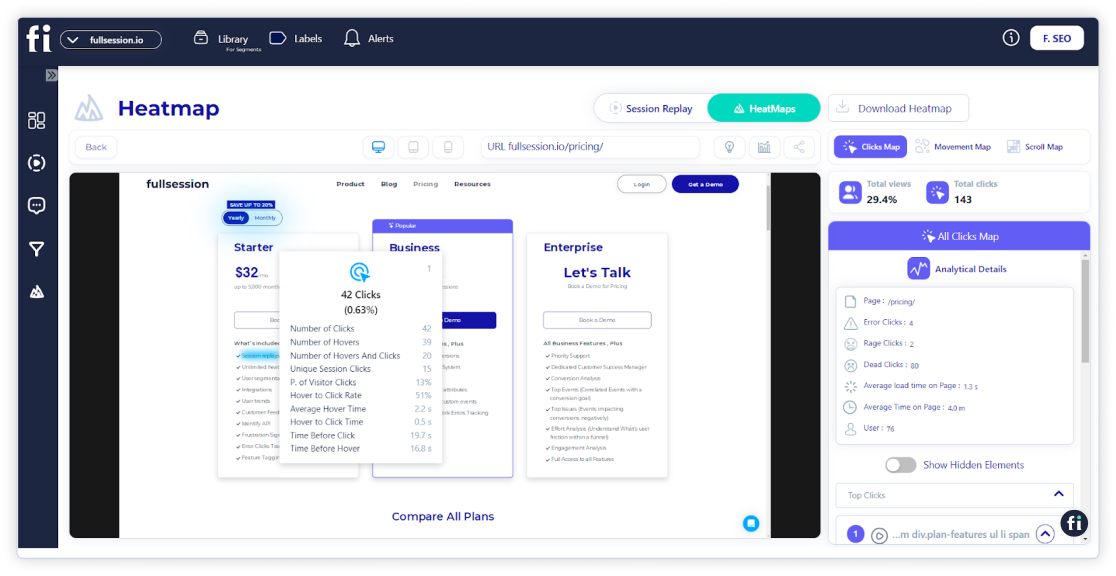
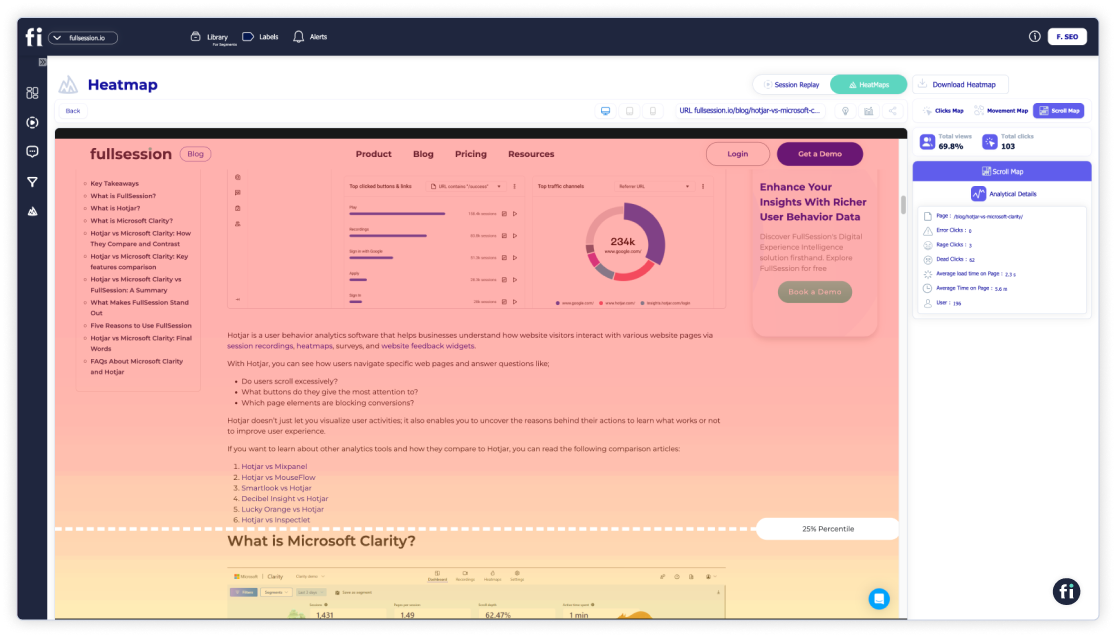
FullSession can collect quantitative data and present it into three different types of heatmaps:
- Click maps: Show where users click on a page, highlighting the most popular areas and helping you understand what grabs their attention.
- Scroll maps: Reveal how far users scroll down a page, indicating which content keeps their interest and where they tend to lose focus.
- Mouse movement maps: Track the path of users’ mouse movements, giving insights into how they navigate and interact with your content and where they might be hesitating or focusing their attention.
FullSession heatmaps are interactive and provide real-time insights. Real-time data allows for immediate action, and businesses can be proactive, preventing issues or seizing opportunities. On the other hand, aggregated data relies on reports, which could take longer to appear. FullSession eliminates this issue.
Improve Your Website UX and UI With FullSession
Learn how our interactive heat maps help you find cold spots and dead zones on your site.
Session recording tools
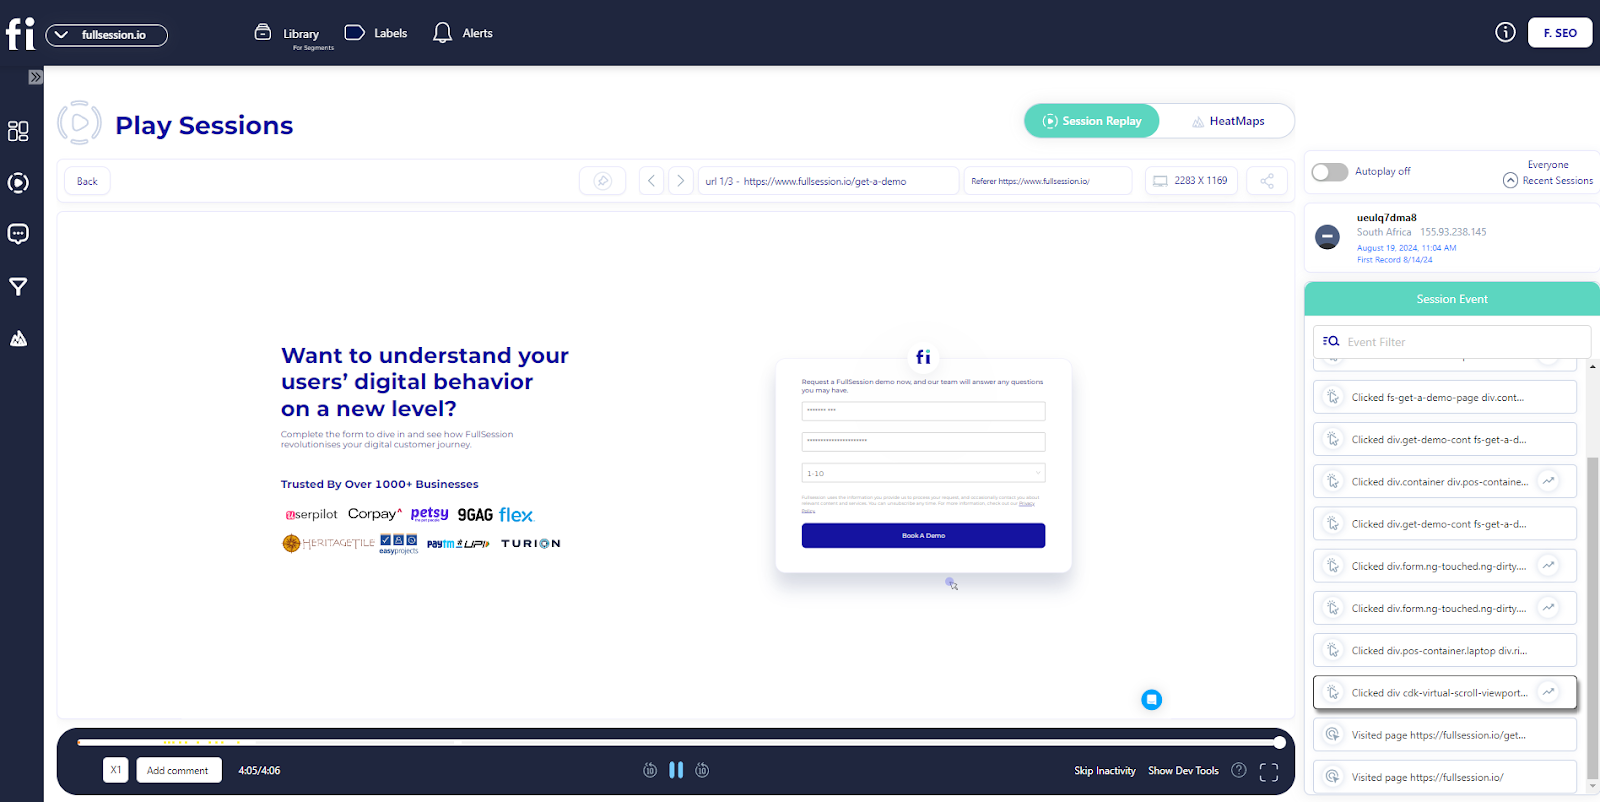
With session recording tools, such as FullSession, you can record user sessions and play them back to observe users’ online behavior.
This feature enables you to log and monitor users’ actions, such as clicks, taps, or mouse movements, in real time. It gives insight into your users’ journey and helps you solve problems more quickly and effectively.
This qualitative analytics solution helps you understand:
- The user experience on different devices
- What parts of your site or web pages attract them the most
- Their mouse movement patterns
- Where they click the most or stop scrolling on your pages
- If there are page elements causing issues
With this data, you can set up strategies that meet user needs and ultimately improve user experience.
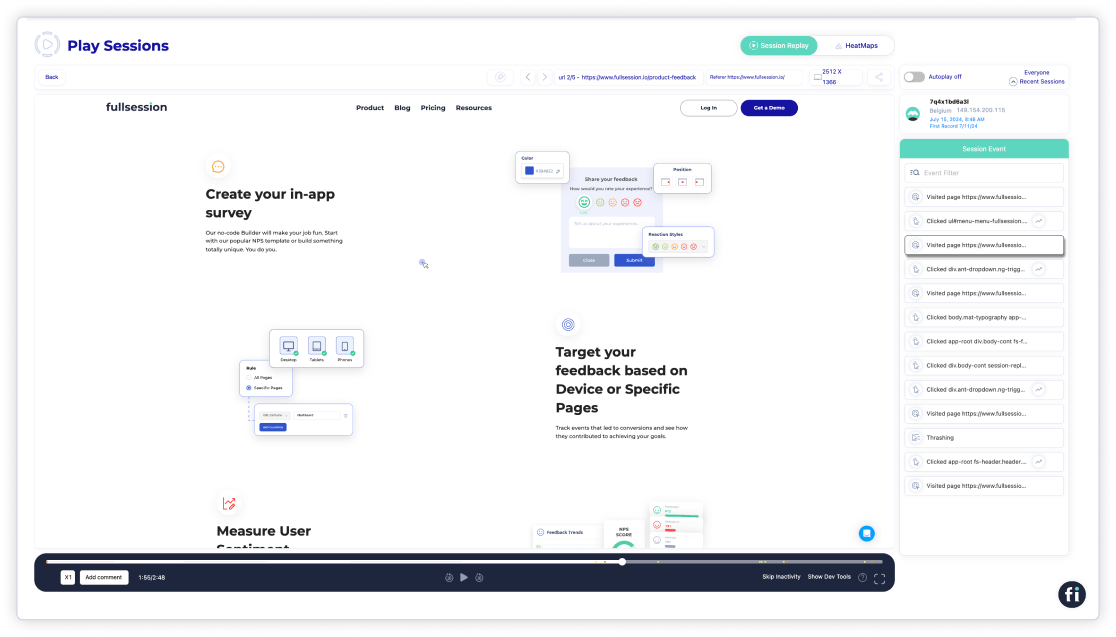
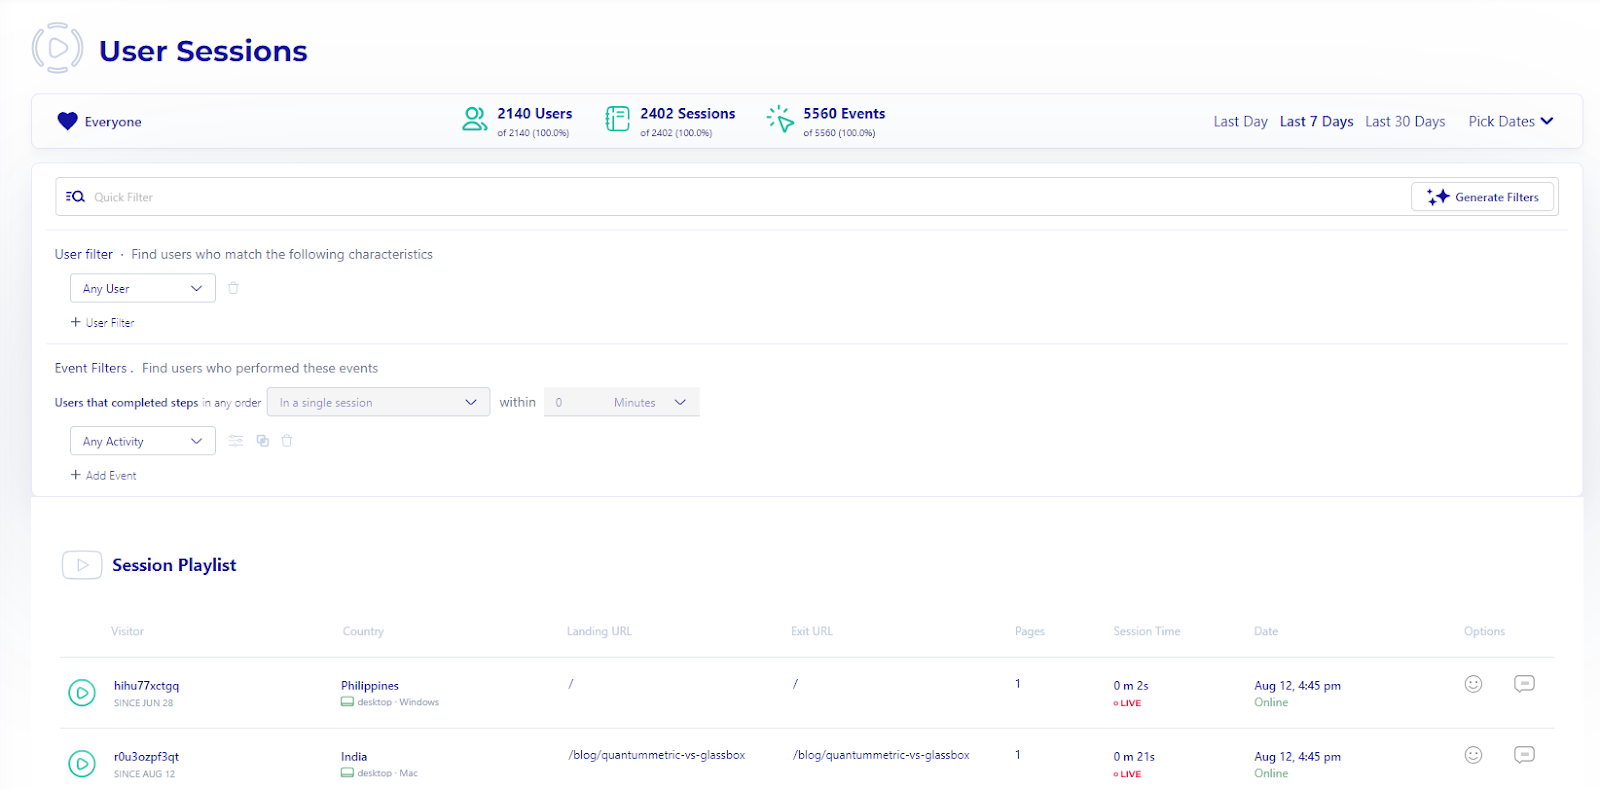
To watch user sessions with FullSession, click on any of the entries on the Session Playlist.
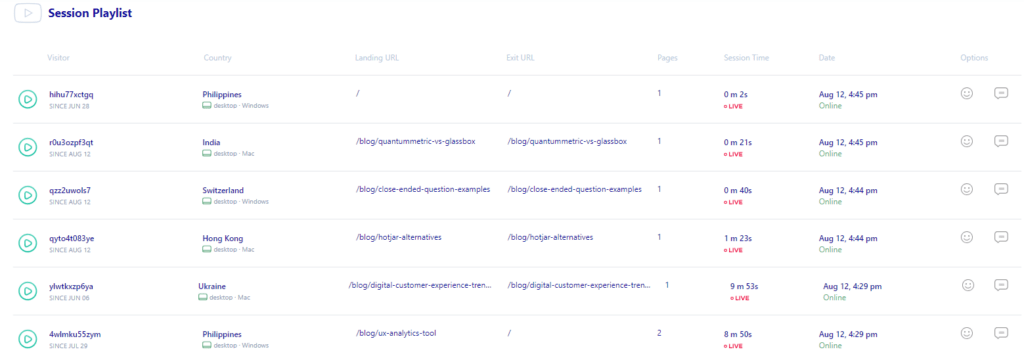
The recordings will automatically play, and then you can observe your users’ activity.
When you replay a session, you’ll be able to see:
- Visit source
- Users’ locations (country and IP address)
- Pages viewed, and URLs visited by your users
- The average time a user spends on a page
- The total time a user spends on pages
- Session list
- The session event data
- Screen resolutions of your users’ devices
Start a free trial to see how it works.
Customer feedback tools
It is essential because it provides user feedback in real-time and helps you understand what they’re having trouble with, so you can provide solutions immediately. Also, it helps you optimize your marketing or sales efforts.
Companies may use sentiment analysis to gain better insights into their customers’ opinions and feedback, based on data from reviews, social media, or surveys. With this data, they can identify trends, improve customer experience, and create better sales strategies over time, based on their sentiment.
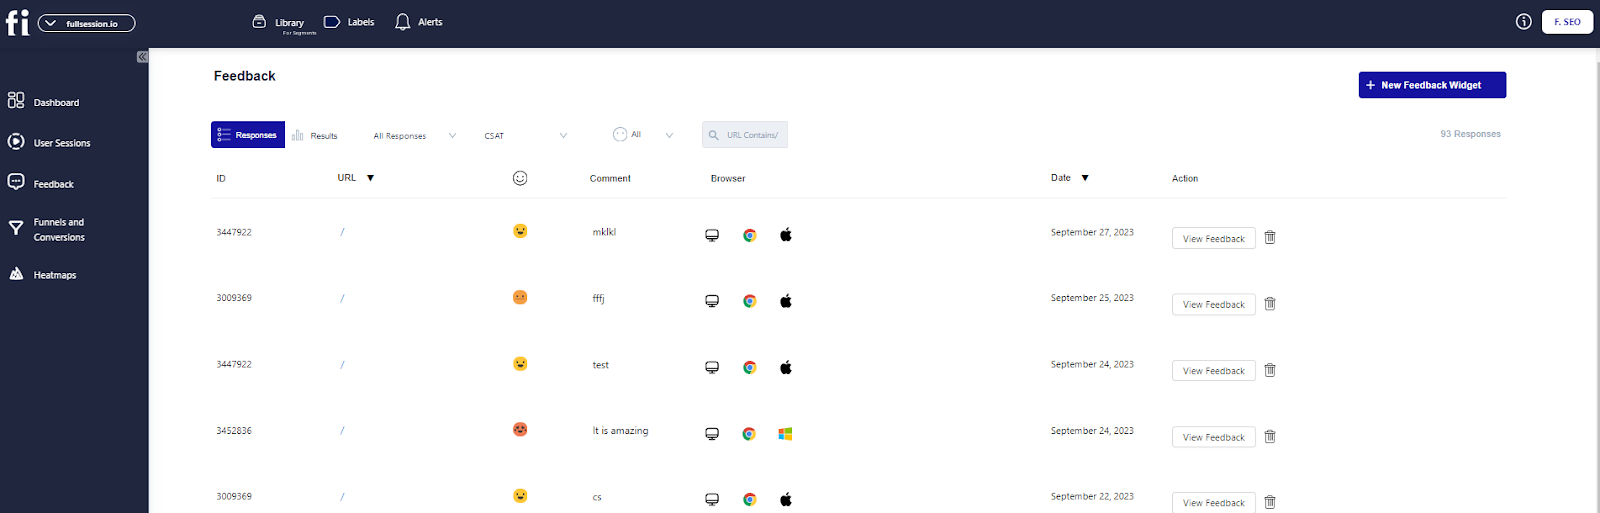
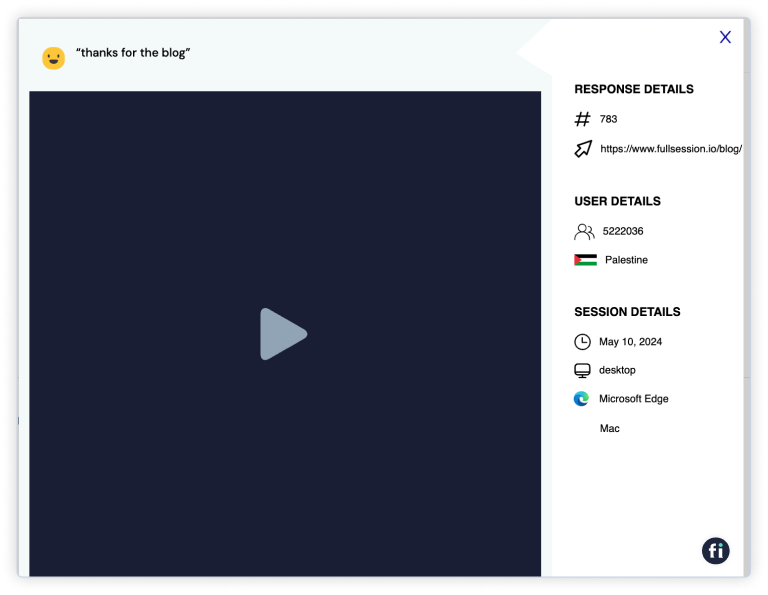
FullSession lets you customize your own feedback widgets to collect valuable user insights.
You can also replay user sessions and view customer feedback attached to each session.
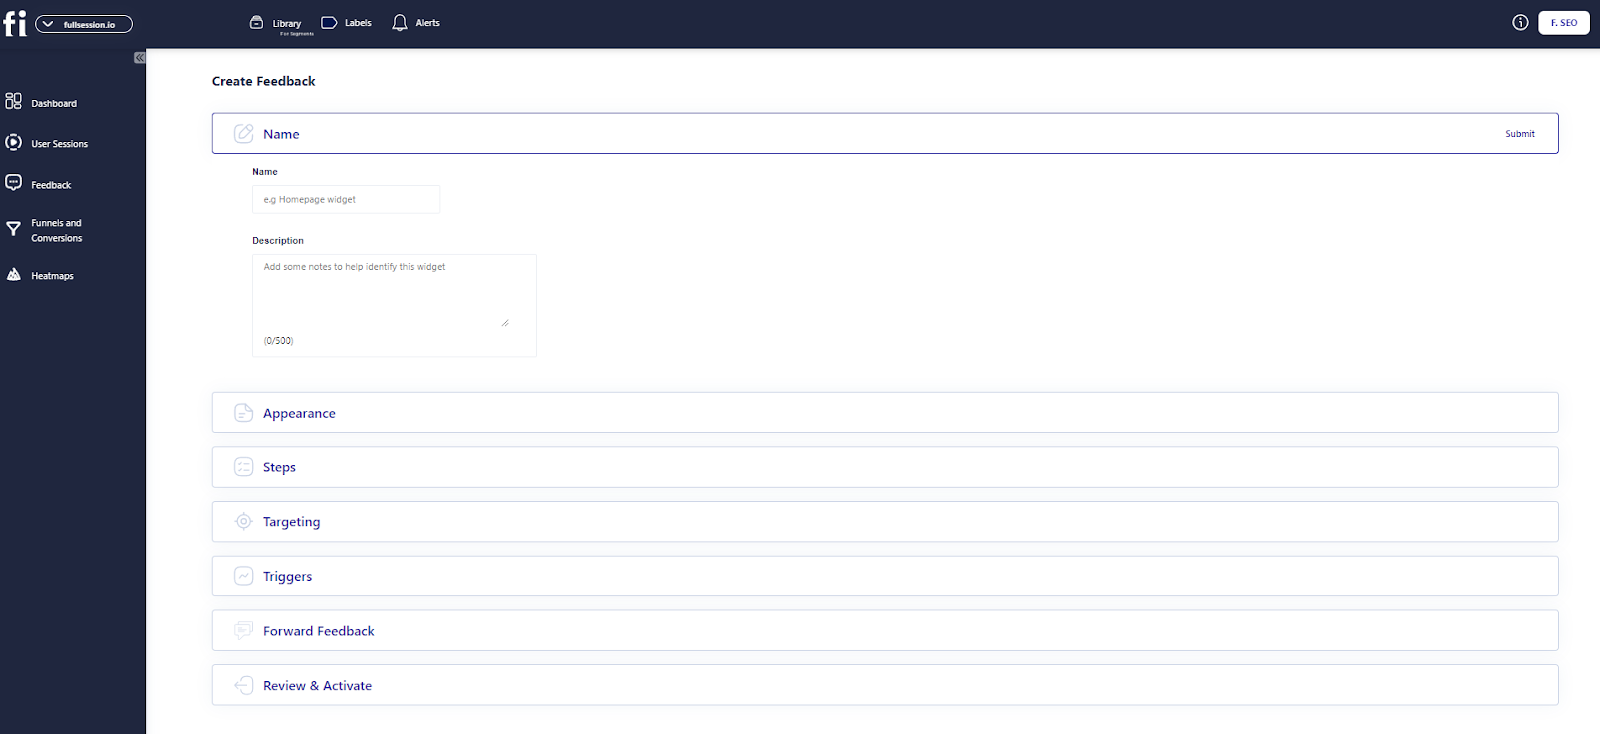
Seven steps in gathering customer feedback with FullSession
Find the ‘New Feedback’ widget at the top-right corner of the page.

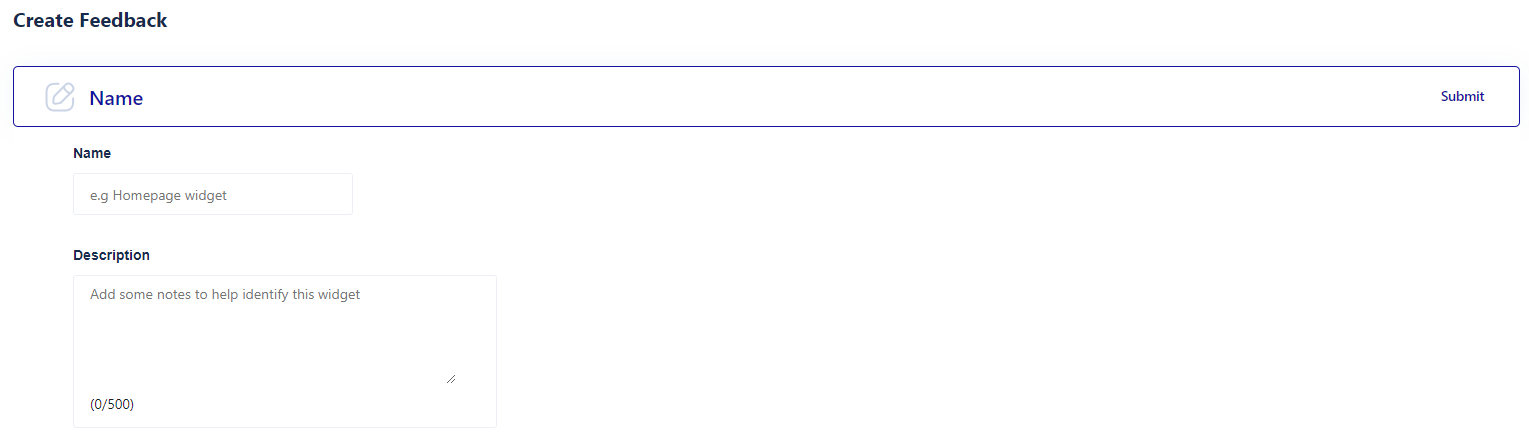
Add a name and description to the form. It makes it easier to find your form later.
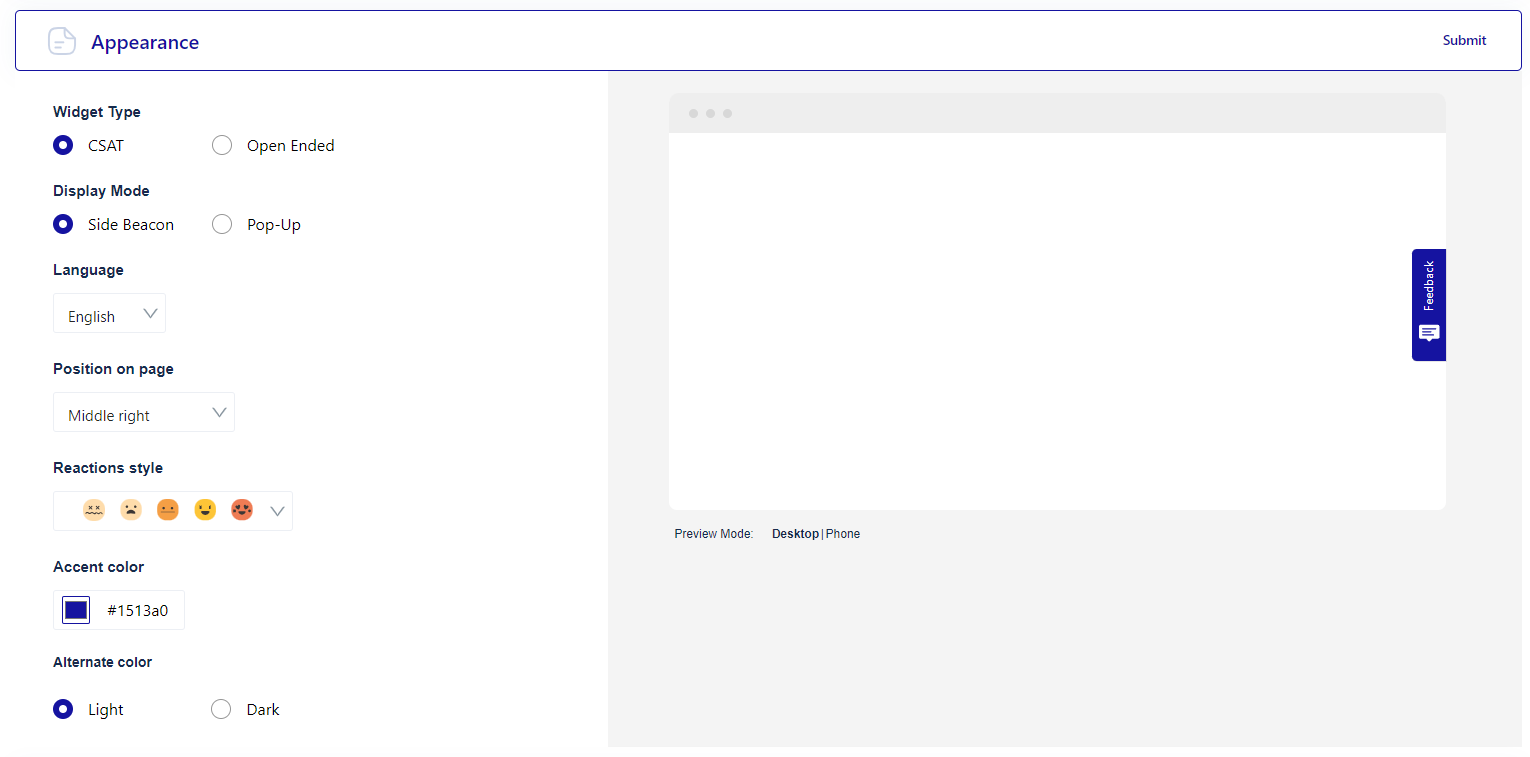
Next, choose how you want the form to look. You can adjust the language, reactions, colors, and form position. You can also preview the form before publishing.
If you’re not satisfied with the form design, there is a reset button you can use to start redesigning your form.
Now, set up the feedback form’s flow. You can ask how the user feels or request contact details. It’s all up to you.
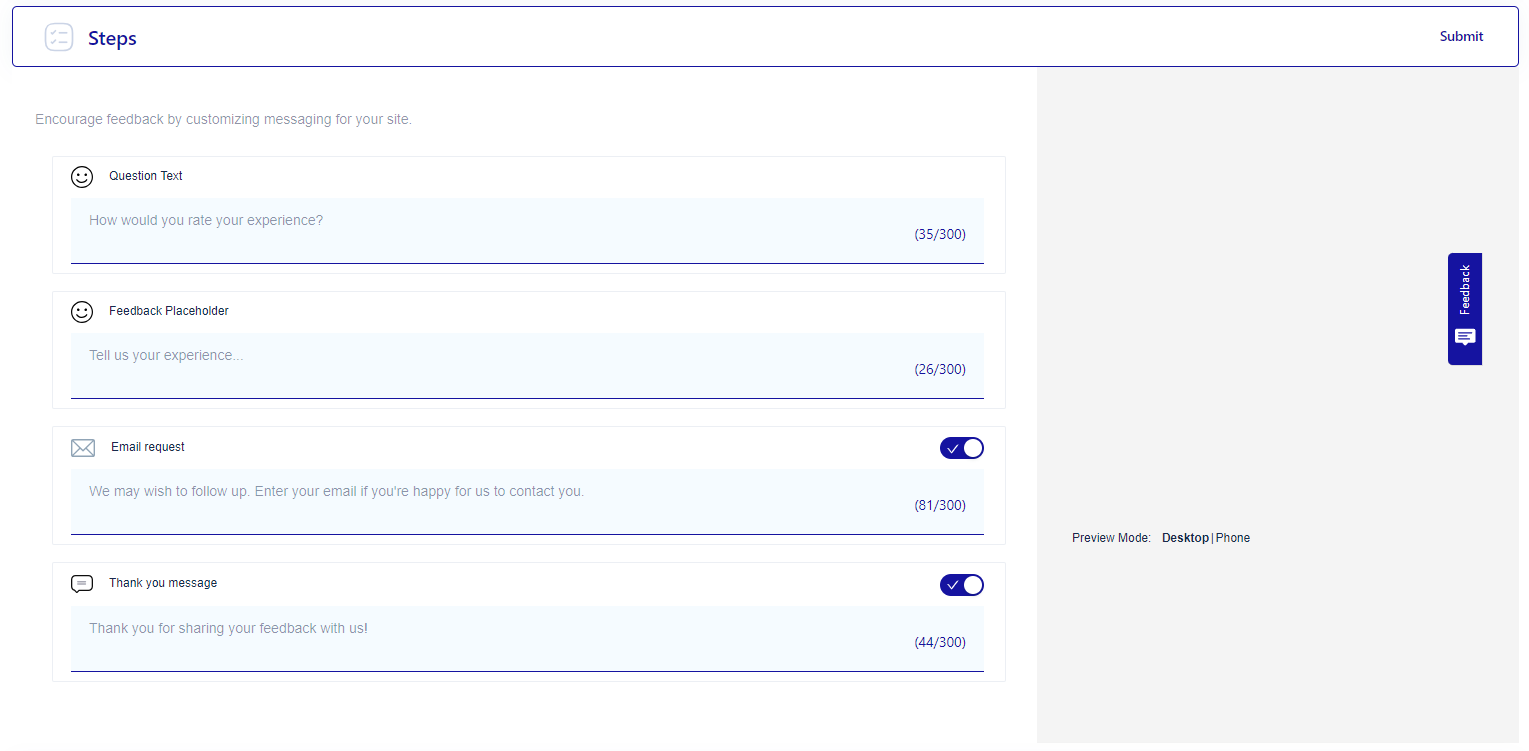
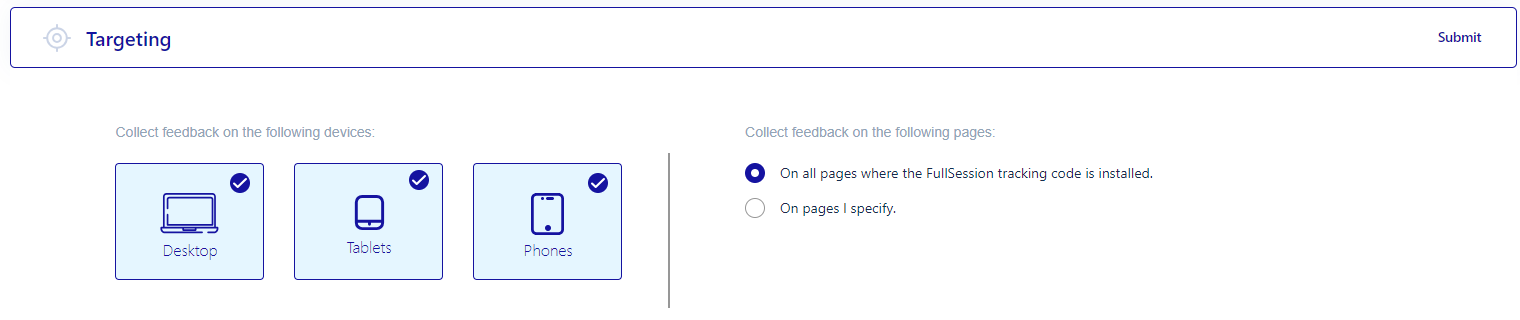
Target the form’s audience by their devices. The FullSession tracking code lets you choose to collect feedback from all pages or a single one.
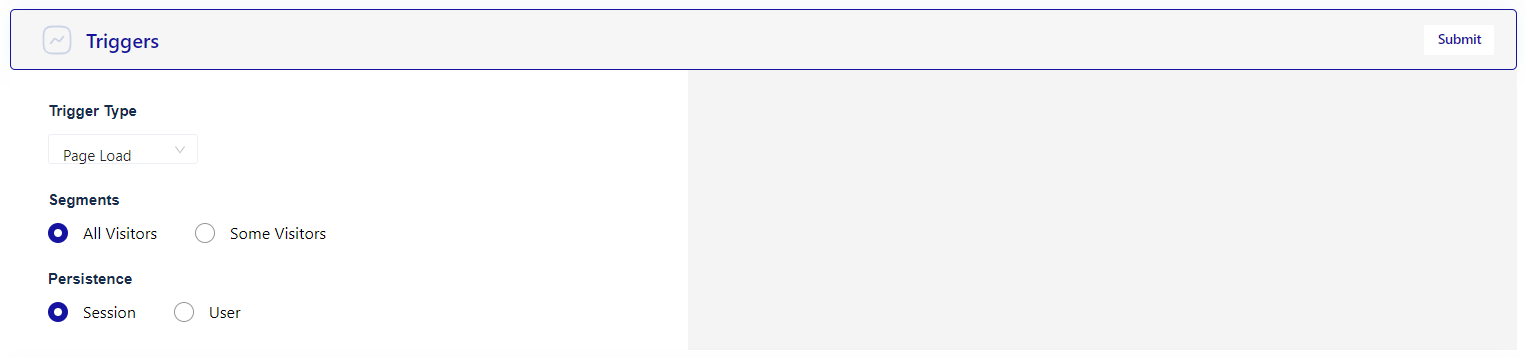
FullSession also lets you select a trigger type for all user feedback widgets. You can choose when the widget will appear (e.g., after rage clicks, after the page loads), who it will appear to (all visitors or some specific segments only), and how persistent it will be.
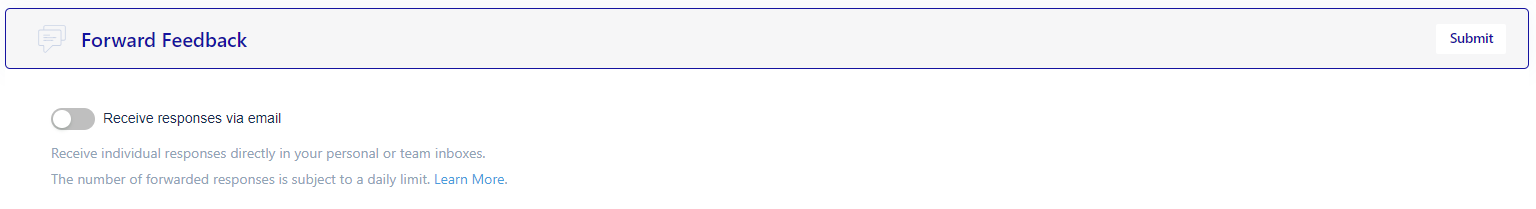
You can choose how you would like to receive the feedback. Choose your email inbox, but remember that you can only receive a certain number of responses daily.
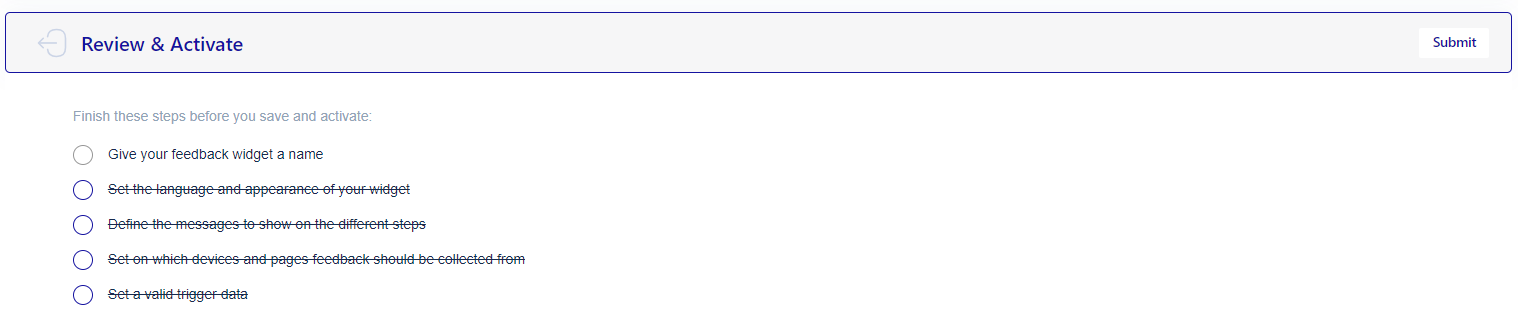
After reviewing all your steps, you can activate the feedback form and start receiving customer feedback if you are satisfied.
Error tracking and analysis
FullSession can reduce your bounce rate via error tracking and analysis. This feature helps you detect, analyze, and fix issues that affect user experience. It covers error clicks, network errors, console errors, error logs, and uncaught exceptions on web and mobile apps.
Error clicks highlight problematic elements in your application, while network errors reveal issues with server requests that disrupt user activities. Console errors point to underlying JavaScript issues, and error logs offer comprehensive details for effective debugging.
Uncaught exceptions are critical errors that need prompt handling to prevent crashes. The feature also includes trend analysis, segmentation, and session replay integration for deeper insights, along with real-time Slack alerts for immediate error resolution.
Book a demo to see how it works.
Using FullSession as a UX Analytics Tool
FullSession is a web analytics software designed to assist you in monitoring, measuring, and analyzing the effectiveness of your website or landing pages.
FullSession includes session recordings and replays, interactive heatmaps, customer feedback forms, error analysis, and conversion funnel analysis, which help you make better decisions by understanding behavior data and user insights.
With FullSession, you can track engagement data and compare it across channels, devices, and periods to identify what type of content or website elements perform best or need further improvement.
Plus, FullSession can help you:
- Monitor dynamic elements in real time to gain accurate user insights
- Speed up heatmap processing without affecting site performance
- Safeguard user privacy by omitting the recording of sensitive data
- Efficiently handle large data sets and swiftly uncover crucial insights
- Restrict tracking of user behavior to your site, ensuring data is not misused
- Enhance cross-team collaboration by centralizing efforts on a single platform
Start a free trial now.
Install FullSession on your website to monitor user behavior
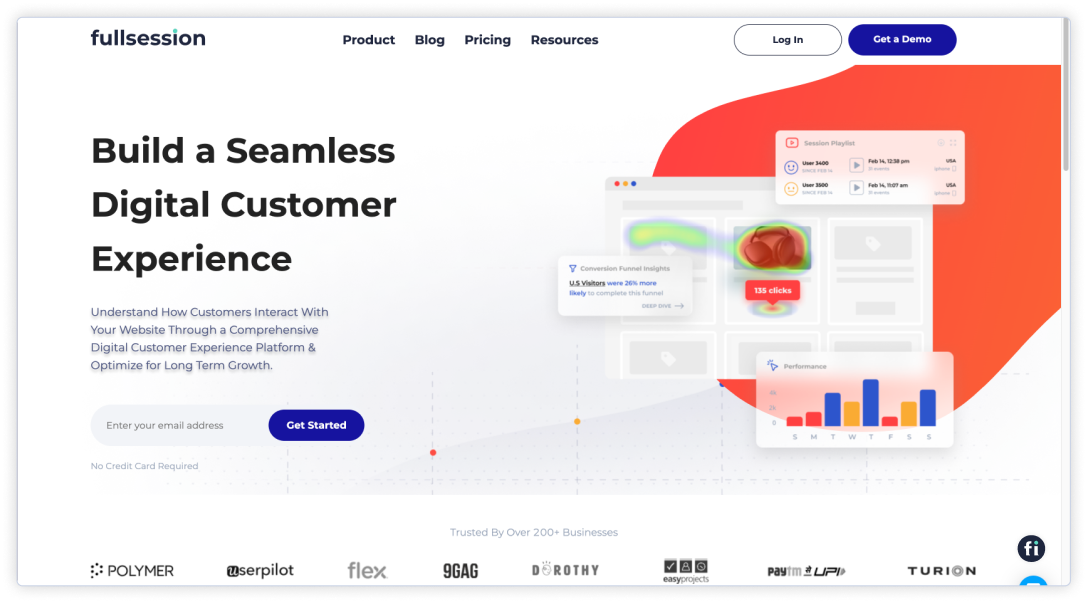
On the FullSession site, take a look at the right side of the primary menu. Log in or book a demo.

To start with FullSession implementation, go to Settings, and select FullSession Setup, as seen below.
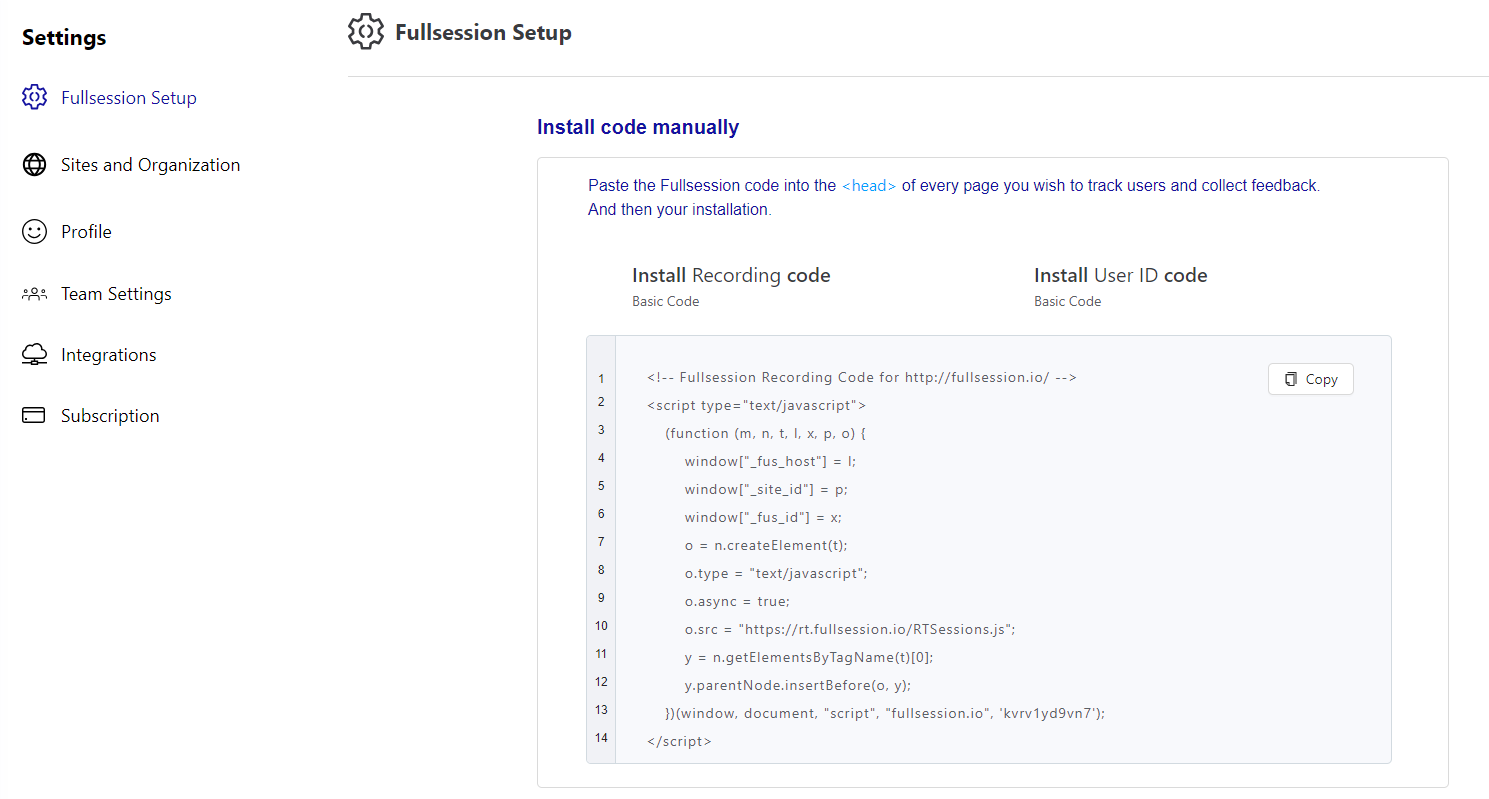
On your setup page, you will see a FullSession code you can copy to add to your website. On each website page, you want FullSession to track, paste the code below the < head >.
That’s it. You can start capturing user behavior in minutes.
Why Should You Choose FullSession?
FullSession is your best solution for boosting conversions, increasing site value, and improving user experience and satisfaction. Easy to install and use, FullSession should be your top choice because:
- FullSession comprehensively analyzes website visitor behavior and friction points through broader analytics tools.
- FullSession insights let you know what issues might lead to funnel dropouts and affect conversion rates.
- FullSession has advanced filtering options to understand visitor experience better and identify sessions that seem unusual.
- FullSession lets you segment users based on specific criteria, such as demographics, location, behavior, and more, for a more in-depth analysis of user behavior insights.
- FullSession helps identify significant events inside a session to save time and focus on the most critical issues.
- FulllSession helps you pinpoint usability issues that can turn away potential conversions via user recordings and heatmaps.
- FullSession lets you monitor and analyze UX metrics, such as the number of users who return to your website, the number who leave after viewing only one page, the number who click on your CTA, etc.
- FullSession is more affordable than other traditional analytics tools.
Book a demo to learn more.
What Are the Benefits of Using a UX Analytics Tool?
UX analytics is essential to any business because it provides quantitative and qualitative data on the overall user experience on your website, web app, landing page, or mobile app.
Failure to recognize users’ changing needs and adapt to those needs will lead to poorly designed products and reduced user satisfaction.
Here are some other advantages of using UX analytics tools.
UX analytics provides you with facts
You can’t argue with data obtained from the UX analytics tool. There is very little room for errors or misinterpretations. UX analytics gathers quantitative data based on statistics and presents accurate information on user interactions.
Analytics is the measurement of performance. For example, it’s easy to calculate differences and measure effectiveness if you implement a solution. Thus, the value of your work becomes more apparent.
Analytics generates faster results
With various tools available to analyze data, questions about improving user experience are answered almost immediately. You can get real-time information when needed, from conversion rates to customer feedback.
Compared to other methods, UX analytics is a great way to discover what your visitors think without lengthy processes. With a few clicks in your UX analytics tool, you can get data and use it to improve your design, content, or layout so users don’t drop off your funnel.
It gives a unique insight into website performance
With analytics, you can analyze user behavior to understand how well your website is performing. It includes your website usage, what aspects don’t provide results, where you need to make improvements, etc.
UX analytics gives you access to more website data than any other analysis method to ensure your website is at optimal performance.
Analytics supports integration with other solutions
When choosing a UX analytics tool, one factor you should always consider is integration. This aspect covers how well you can combine UX analytics tools with other solutions or if they are stand-alone tools.
Thanks to these integrations, you can utilize gathered data at any step of the UX design process and use it for multiple use cases. For example, FullSession integrates with major platforms like Wix, Bigcommerce, and WordPress so it can fit into your existing tech stack seamlessly.
UX analytics data is easily presentable
Data can often be challenging to explain to laypersons. However, with UX analytics, presenting data on UX-related processes doesn’t require your audience to have expert knowledge. Instead, anyone can easily understand generated reports.
This ease of presentation comes in handy when defending your work to higher-ups. UX tools provide visual reports that are easy to comprehend. UX researchers and designers can comfortably show the effect of implemented changes to a feature without worrying about any technical jargon.
After discussing how beneficial UX analytics can be, let’s cover how to use UX tools.
Improve Your Website UX and UI With FullSession
Learn how our interactive heat maps help you find cold spots and dead zones on your site.
How to Use a UX Analytics Tool to Optimize Your Website
We’ve covered the basics of UX analytics, so we can discuss the implementation further. To create a compelling user experience with the help of a UX analytics tool, it needs to have certain features–most of which we’ve already covered:
- Heatmaps use data visualization to show user activity and engagement on your web pages. Recorded data typically includes clicks, scrolling, taps, and insights showing what users most enjoy on your site.
- Session recordings and replays record user behavior on your website, letting you replay and observe their activity. By understanding what users spend time on, you can improve your site pages for better engagement.
- Funnel analysis provides data on the areas of your site where users drop off the funnel, allowing you to identify patterns and improve the stages in your funnel with a lower conversion rate.
- Polls and surveys collect user feedback based on questions you ask in polls and surveys. This information pinpoints what’s wrong with your website and what works well.
- Detailed insights on user behavior show data on user engagement with your website and their individual preferences. You can use it to map out customer patterns and user segmentation.
Now that you know everything about UX analytics tools, let’s explore the 11 best ways you can use them to optimize your website performance and increase user satisfaction.
1. Collect data
Your first step is to know your audience, and the best way to do this is by collecting data. The data collected with UX tools can help identify problems with usability and functionality, creating space for improvements.
UX tools can be quantitative or qualitative. Qualitative tools provide opinion-based information that can be gathered in a survey or poll, while quantitative analytics tools provide fact-based, numerical data. For purposes involving user behavior, combining both is most effective.
2. Get the big picture
This follow-up step involves grasping the main idea behind the website and assessing your current results. You need to answer the questions of why you created it, who it is for, and how it will meet users’ needs.
A UX analytics tool helps you get a bird’s eye view of your website performance and see the big picture for further improvements.
To assess your results, ask the following questions:
- What steps have been taken before?
- What is the team trying to achieve?
- Which information do we need to collect?
- What is the timeframe for accomplishing all goals?
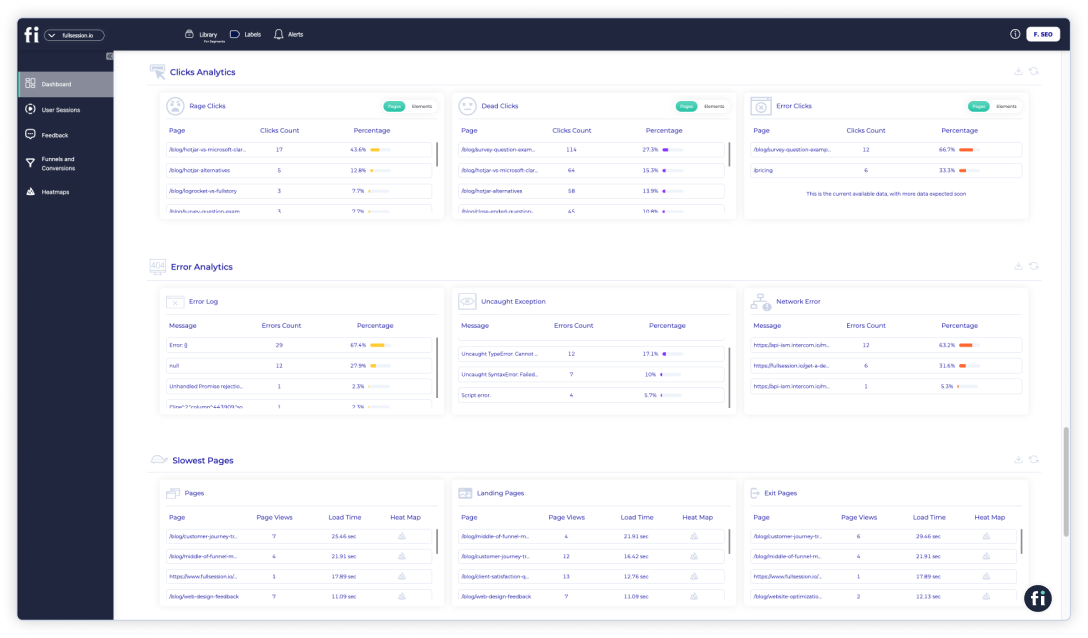
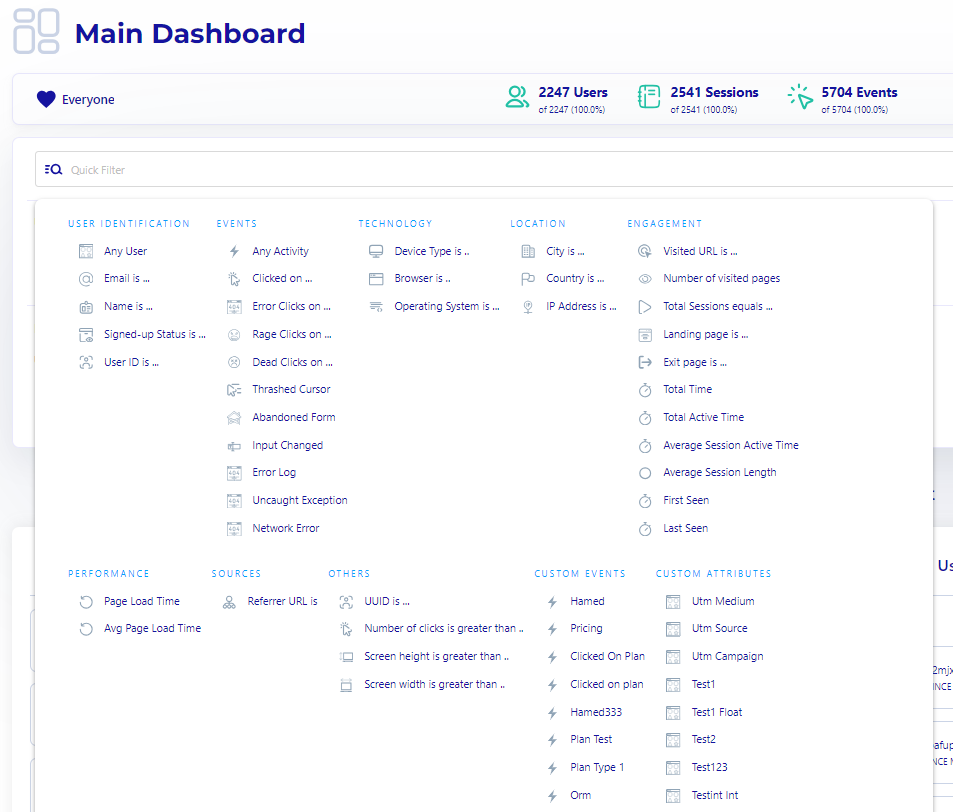
FullSession helps you find and fix problems on your site by collecting data on user and event properties. To review this data, click on the Insights tab in the menu.
Now you’ll see a new panel with three sections on your dashboard. You can select a specific time range to get insights for up to one year.
You get to see data on:
User engagement
- Median scroll depth by device
- Page load speed by browser
- Session playlist
- Top users
- User trends
- Breakdowns (based on device, browser, and screen)
User experience
- Event per session
- Session length
- Active time
- Feedback data
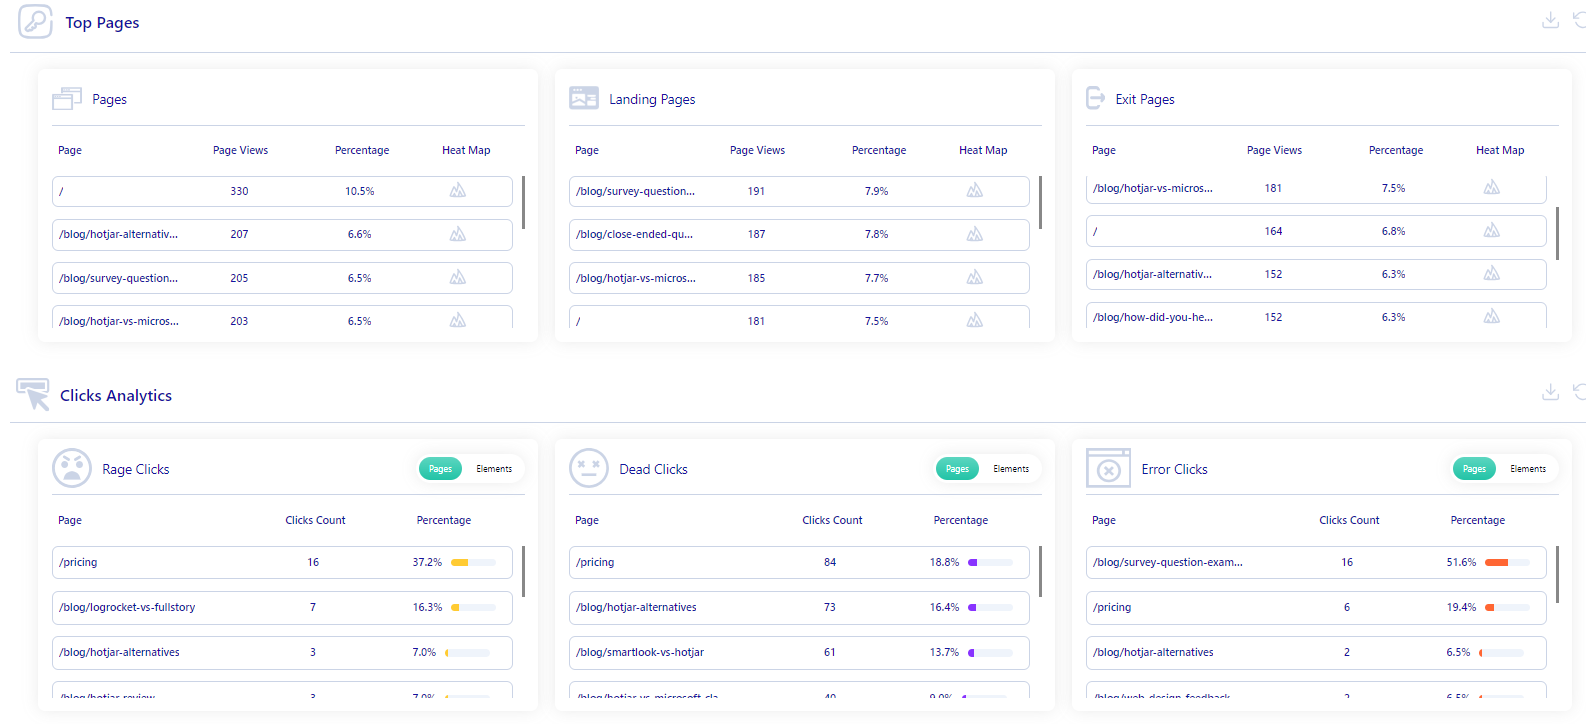
- Top pages
- Clicks analytics
- Error analytics
- Slowest pages (pages, landing pages, and exit pages)
Marketing channels
- UTM analytics
- Top referrers
You can use data to build a website tailored to your customers’ needs and create the best experiences. Historical data can also help feed predictive analytics, allowing you to make data-driven decisions based on future user behavior.
3. Track website traffic
Monitor website traffic to measure user experience. Web traffic tracking is essential because it reports your site’s overall performance.
You can find out which parts of your website resonate with users the most and which ones repel them. You can also make modifications as necessary to achieve your goals.
4. Identify user groups
The next important step is to segment users into specific groups based on demographic data, psychographic data, and other parameters. User groups help define your target audience. If you know who uses your product, you can create a user experience that satisfies their needs.
With FullSession, you can segment user groups by different characteristics, such as the devices or browsers they use, location, language, and so on.
5. Track your audience’s behavior
The next phase in this process is monitoring user behavior. You can identify what will most likely attract and appeal to them and what they will ignore completely. This is an effective way to boost conversion rates.
For example, with insight into how users move through conversion funnels to reach checkout or form submission, you can figure out what puts them off or causes them to drop off the process.
Analyzing user behavior in relation to the user experience is the best way to see if your conversion funnel is working as well as it should.
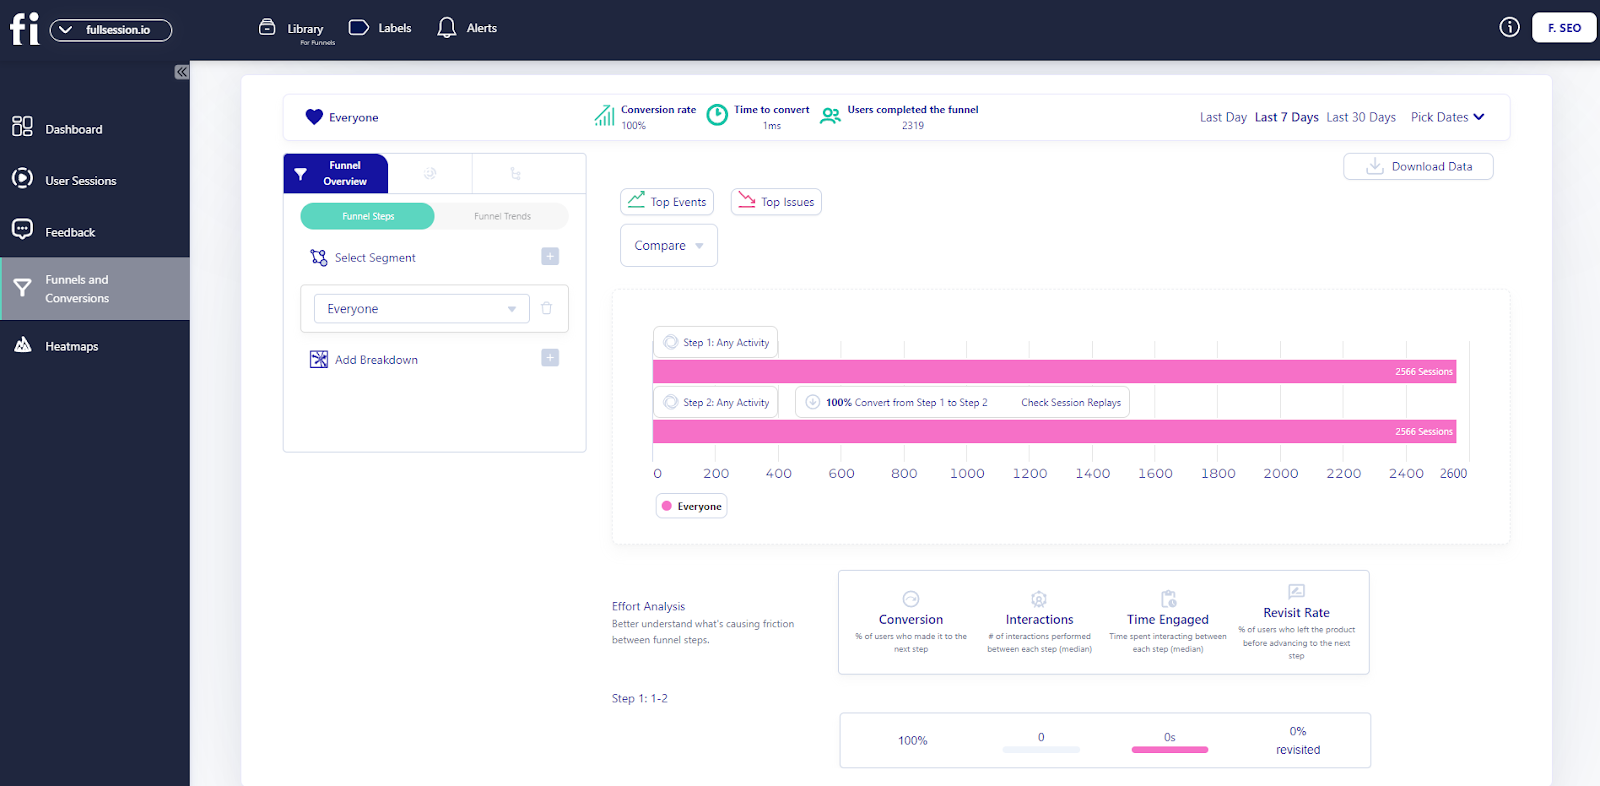
With FullSession funnels and conversions, you can:
- Explore funnel steps: View how users progress from initial interaction to final conversion, including conversion rates and drop-off rates for each step. This helps identify where users drop off and which steps need optimization.
- Analyze funnel trends: Monitor changes in user flows and conversion rates over time to spot trends and seasonal variations. Assess long-term performance and adjust your strategies based on these insights.
- Review events correlations: Identify actions and events that increase conversion rates to highlight successful user behaviors and features. Use these event-tracking insights to replicate successful patterns and improve user journeys.
- Detect top issues: Pinpoint actions or obstacles that hinder conversions, which helps address issues causing user drop-offs. Implement improvements to reduce friction and improve the user experience.
- Conduct effort analysis: Measure the time users spend interacting between funnel steps to understand user effort and potential user frustration signals. Analyze the most engaging steps or features to highlight parts of the funnel that capture user interest. Promote and enhance these features to maximize customer retention and conversions.
- Perform segmentation and comparison: Compare funnel performance across different user segments (e.g., device type, location) to understand interactions of various user groups. Tailor experiences and address segment-specific issues.
- Do time period comparison: Analyze performance over different time periods to monitor changes in behavior and conversion rates. Based on these insights, adjust marketing strategies and product features.
6. Optimize your calls-to-action
The call-to-action button is your golden ticket to driving conversions, but only if it is well-designed. As the name implies, it encourages users to take action on your site, whether making a purchase or subscribing to an offer.
The UX analytics tool can help identify two issues—why visitors can’t find what they’re looking for and why they leave the landing page without converting. In most cases, you will see that the reason behind a high bounce rate is poor CTA placement.
7. Improve design, layout, or content
Data will help you understand the user’s needs, behavior, and content requirements. Make sure your design is intuitive and that the layout allows easy navigation.
Additionally, invest in your content design so it resonates with your target audience. The more conversational—the better!
8. Measure user engagement
This step entails measuring the overall user activity on your website. Key metrics on user engagement to look out for include:
- Clicks
- Taps
- Scrolls
- Screen views
- Pageviews
- Video views
- Time spent on the website
- Comments and shares on blog posts
- Sign-ups
- Form submissions
9. Increase conversion rates
You can improve your website’s conversion rates by improving its speed, eliminating friction points, and designing actionable CTAs.
Alternatively, you can use conversion rate optimization tools to analyze details and make faster improvements. Another important step is to conduct user testing to ensure that your website is user-friendly and conducive to successful conversions.
10. Reduce bounce rates
UX analytics tools will provide data on your site performance. Using this information, you can take measures to reduce the number of people who leave your website without completing their user journeys. These measures include:
- Monitoring your conversion rates
- Constantly improving UI design to meet user needs and requirements
- Optimizing site speed and CTAs
11. Increase time spent on site
Still drawing on reducing bounce rates, it would be vital if you could keep users on your website longer by eliminating negative experiences, such as slow load times, broken links, unresponsive layouts, and non-clickable items.
Some of the practical techniques are a clean design, an interactive experience using videos and photos, high readability, and internal linking.
How FullSession Compares to Other UX Analytics Tools
How does FullSession fare against competitors? Here is a quick overview.
| Key Features | Integrations | Support | FreeTrial | Pricing | |
| FullSession | Session recording and replay, interactive heatmaps, customer feedback tools, funnel analysis, error tracking | Shopify, Big Commerce, Wix, WordPress, Open APIs and modern webhooks | Email, knowledge base, live chat, user guides, documentation | Yes | Starts at $39/month, provides 20% discount on annual plans |
| Hotjar | Heatmaps, session recordings, surveys and feedback polls | Slack, Segment, Hubspot, Google Optimize, Omniconvert, Optimizely, and Zapier | User guides, documentation, knowledge base, submit a complaint ticket | Yes | Starts at $39/month |
| Lucky Orange | Live chat and session recording, heatmaps, funnels | Google Analytics, Adobe DTM, and Hubspot CRM | Email, live chat, phone support, help center | Yes | Starts at$39/month |
| Mixpanel | Event tracking, cohort analysis, A/B testing | Google Analytics, Zoho, Meya, FullStory, and many others | Submit a request, help center, documentation | Yes | Starts at$28/month |
| FullStory | Session replay, heatmaps, error monitoring | More than 50 integration options | Knowledge base or email | Yes | N/A |
| LogRocket | Session replay, performance monitoring, error tracking | Zendesk, Jira, Intercom, Datadog, Pendo, Sentry, and Stockpile | Documentation, email, or live chat | Yes | Starts at$99/month |
We’ve also reviewed and compared some of these tools: Lucky Orange vs Hotjar, Mouseflow vs VWO, LogRocket vs FullStory, Smartlook vs Hotjar, Hotjar vs FullStory and more.
If you are comparing LogRocket specifically, check LogRocket pricing for a closer look at plans and costs.
The Best UX Analytics Tool: Final Words
Improving your website performance has numerous benefits, such as generating more revenue for your business through higher conversion rates. You can also make your user experience more enjoyable. The most guaranteed way to achieve this is to use a UX analytics tool to see how users behave.
If you want a one-stop-shop platform, FullSession is the right UX analytics tool for you. With heatmaps, detailed reports, session recordings, error analysis, funnels and conversions, and customer feedback tools, you can optimize your website to improve customer satisfaction and create a website aligned with their needs.
FullSession offers a 14-day free trial for its paid plans, so you can try all user experience analytics tools before committing.
Book a demo today to learn more!
FullSession Pricing Plans
FullSession offers three premium packages. The annual plan can save you up to 20%.
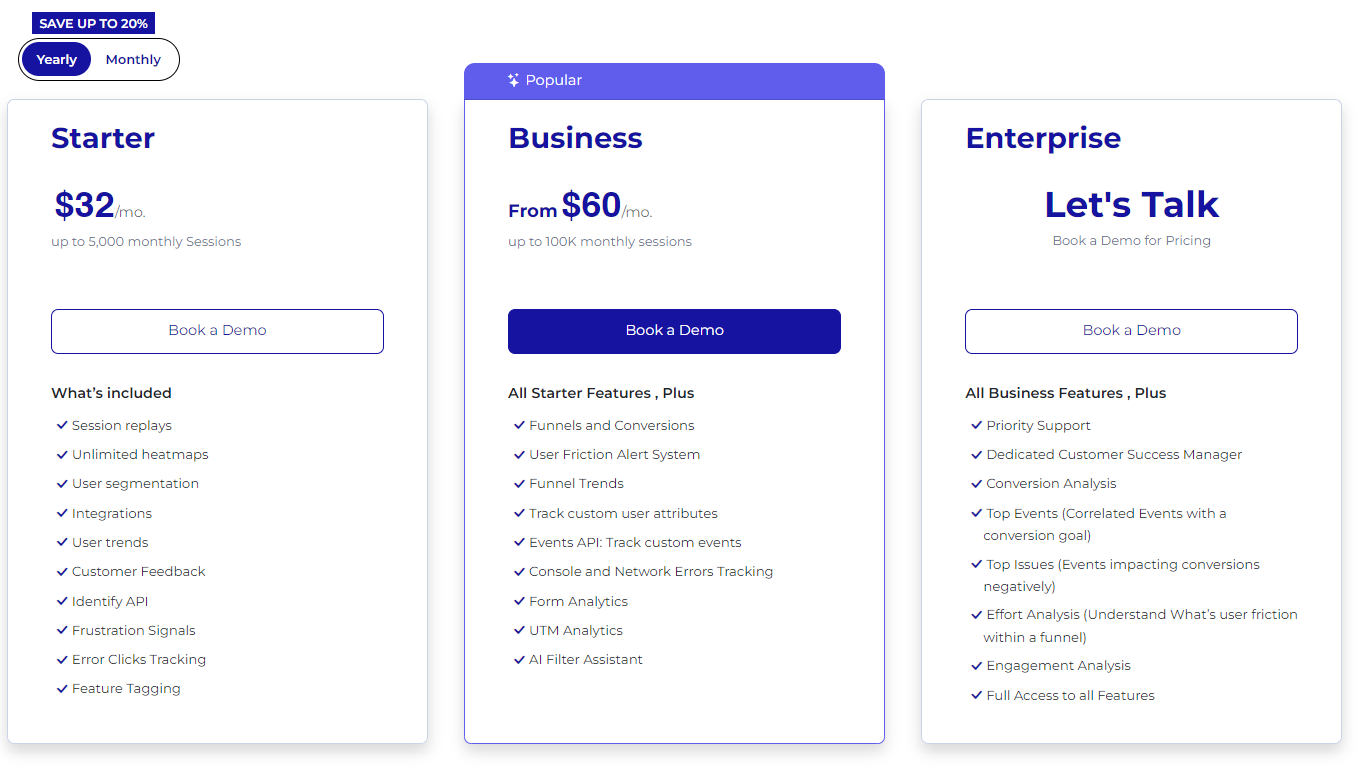
- The Starter plan costs $39/month or $32/year and lets you track up to 5,000 monthly sessions.
- The Business plan starts at $75/month or $60/year and lets you track up to 100,000 monthly sessions.
- The Enterprise plan gives you full access to all features. You can book a demo for more details.
We also provide a customized pricing package if your business has specific website analytics needs. Check out our Pricing page.
Let’s take a look at some FAQs for UX analytics tools.
FAQs About UX Analytics
What is UX analytics?
UX analytics is all about understanding how users interact with your product. It tracks their behaviors and preferences to help you improve the overall user experience. Key features of UX analytics tools include session replays, heatmaps, usability testing, A/B testing, and customer feedback tools that collect qualitative and quantitative insights.
What is the most used UX tool?
The most comprehensive user behavior analytics tool is FullSession, and it’s affordable, too! It provides valuable insights into user behavior and helps you measure the effectiveness of your designs.
What is the best tool for analytics?
There isn’t a one-size-fits-all answer, but tools like FullSession, Hotjar, Pendo, LogRocket and Adobe Analytics are top choices for comprehensive analytics and user behavior tracking. You can also try Google Analytics, a popular UX analytics tool that lets you analyze user paths for free, or Mouseflow if you need form analytics and user interviews.
Do UX designers use data analytics?
Yup. UX designers use data analytics and conduct usability tests to inform their design decisions, understand user needs, and create better experiences based on real user data.
Do UX tools work for mobile?
The best UX analytics tools, like FullSession, measure customer behavior on both websites and mobile applications. Since 45% of North American web traffic comes from mobile devices, optimizing for mobile should be a priority.
Mohamed oversees operations and finance at FullSession and has contributed to the company’s UX analytics knowledge base.