The hardest part of creating a website is making it user-friendly and including relevant content that resonates with your customers’ needs. Statistics show that 88% of online consumers won’t return to a website after only one bad experience.
Web analytics tools can help you better understand user behavior when browsing your website and provide actionable insights you can use to improve your product’s performance. Two popular user testing tools are UserZoom and UserTesting.
UserZoom gathers in-depth user feedback through surveys, usability testing, and interviews. However, setting up and analyzing is complex and time-consuming. UserTesting provides real-time user feedback via video recordings but can be costly for small businesses.
In this article, we’ll explore the key features, strengths, and limitations of these two tools to help you understand which one might best fit your needs.
We will also present a more comprehensive alternative–FullSession. It offers session recordings and replays, interactive heatmaps, customer feedback forms, funnels and conversions, and error analysis to help you pinpoint customer issues, solve them, and create a product that provides an exceptional user experience.
To see how it works, book a demo today.
Get a 360° View of User Behavior
Learn how to visualize and analyze all user interactions in one intuitive dashboard.
Key Takeaways
- UserZoom is suitable for comprehensive quantitative testing. Its features, such as live interviews, usability testing, and surveys, make it ideal for product design and development.
- UserTesting focuses on qualitative data with video recordings and real-time user insights. It’s beneficial for identifying usability problems and understanding user perceptions.
- FullSession is a better option overall because you get access to all the tools you need to understand user behavior and test your website’s effectiveness. It offers session recordings, interactive heatmaps, customer feedback, error tracking, and funnel and conversion optimization tools to analyze and improve user experience efficiently. Book a demo to see it firsthand.
- FullSession offers transparent pricing starting at $39/month for tracking up to 5,000 sessions, with all key features and unlimited heatmaps. Plus, you’ll get a 20% discount on annual plans. UserZoom and UserTesting require direct contact for pricing information.
Before we compare UserZoom and UserTesting, let’s discuss FullSession and how it can help you optimize your website’s features.
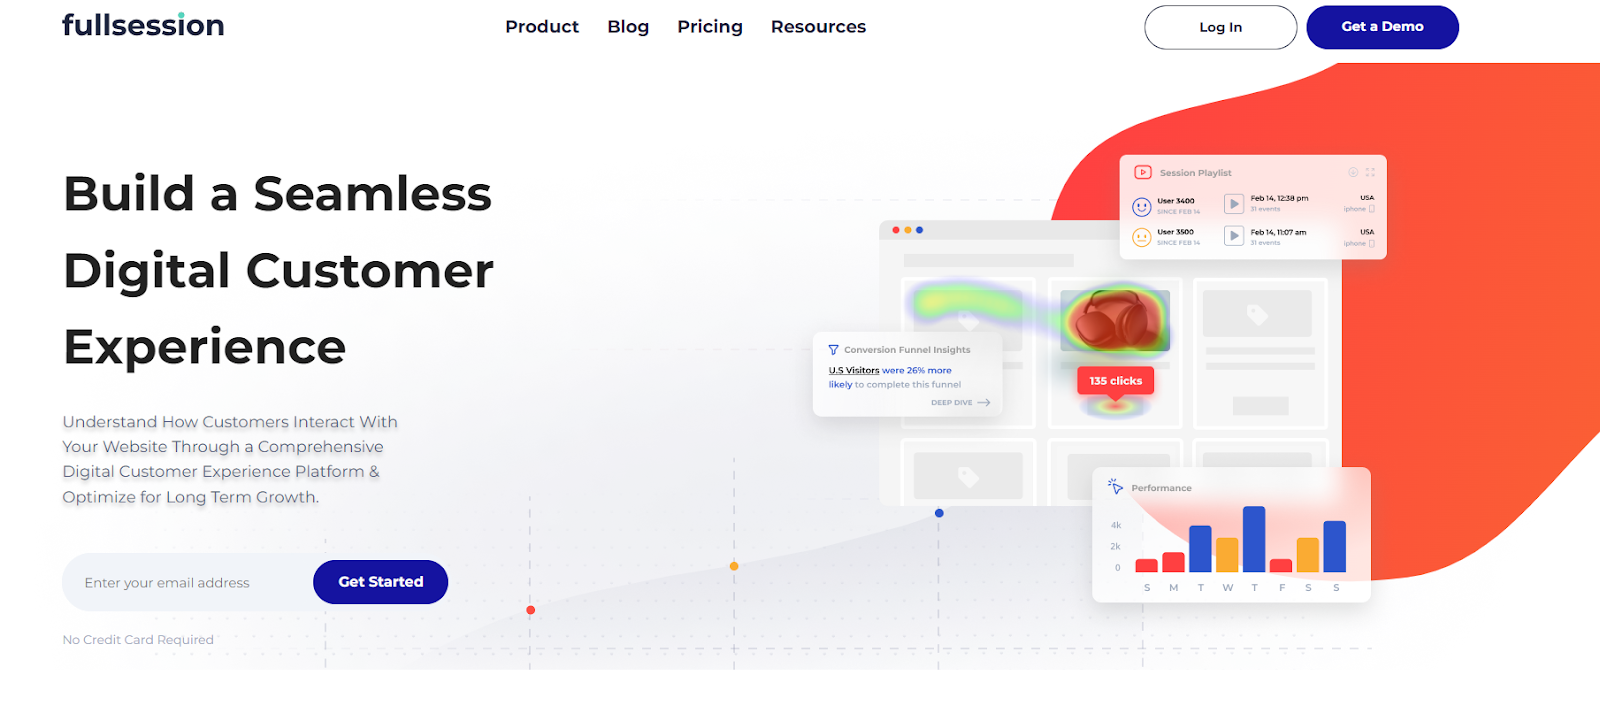
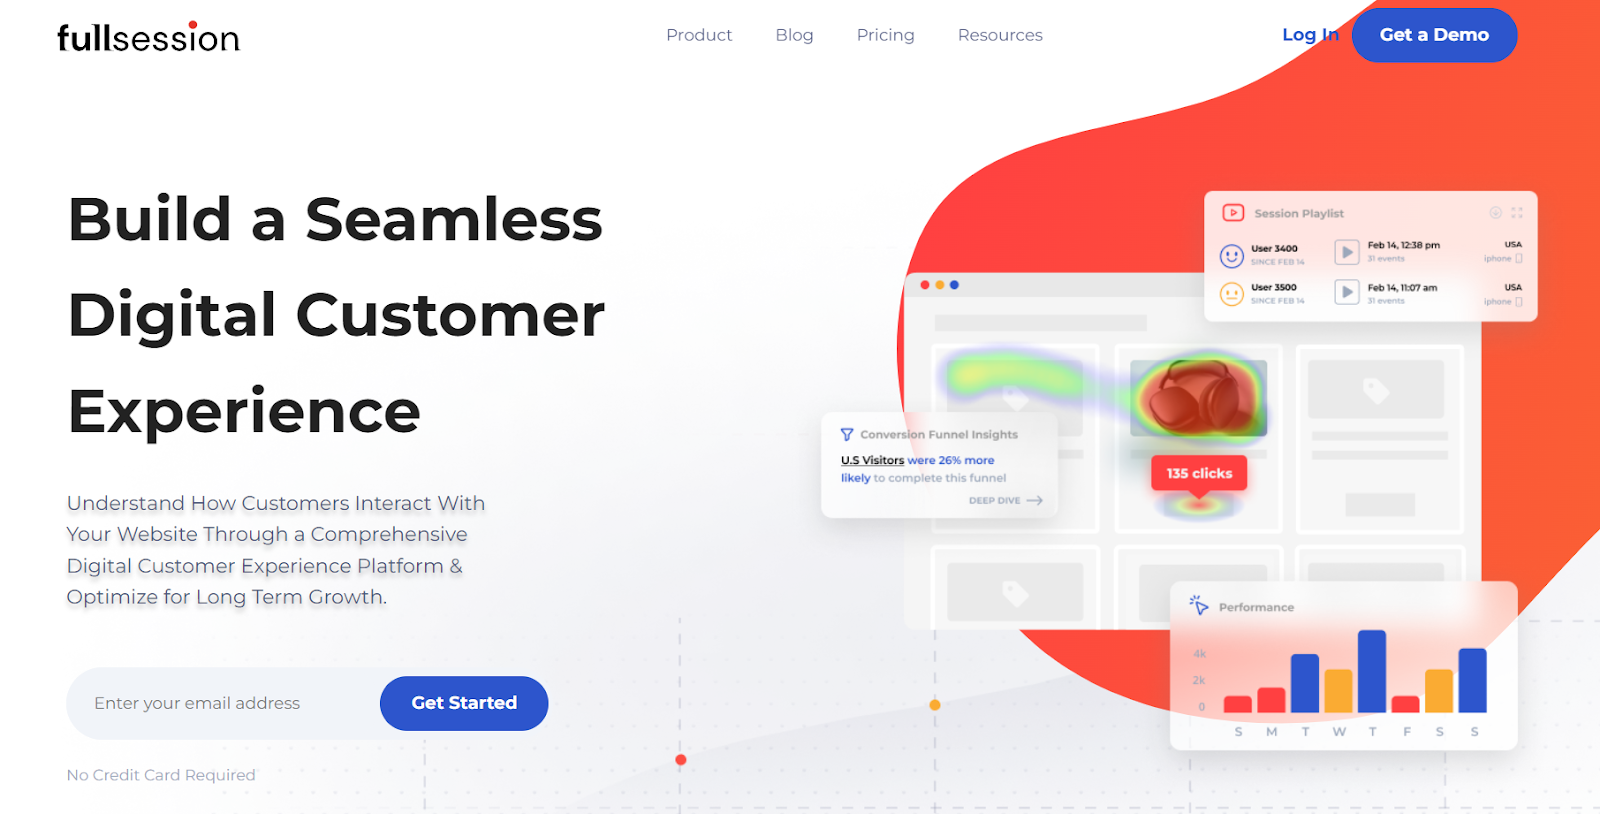
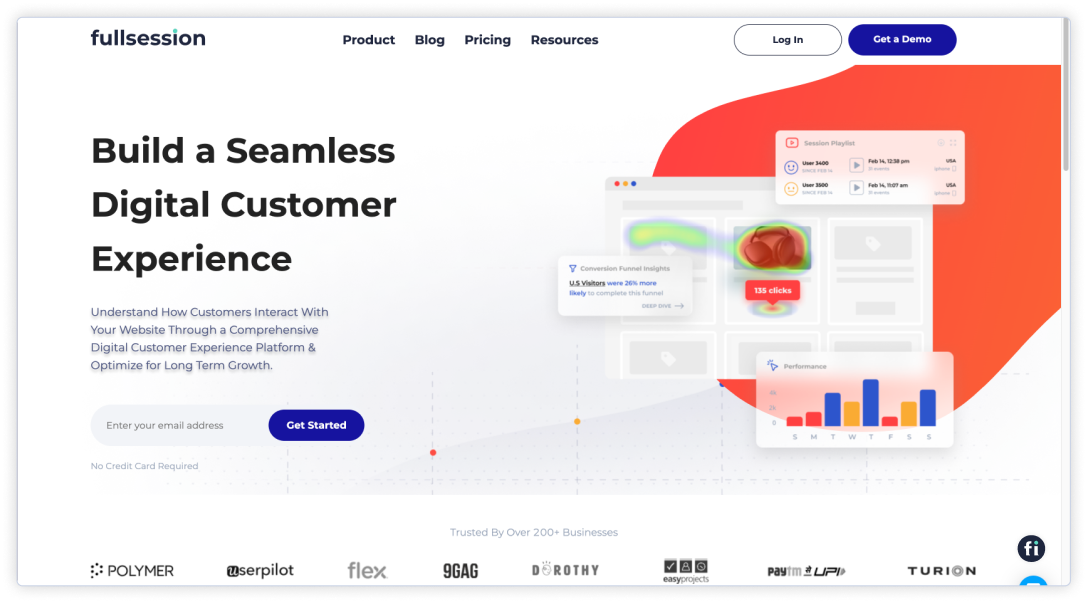
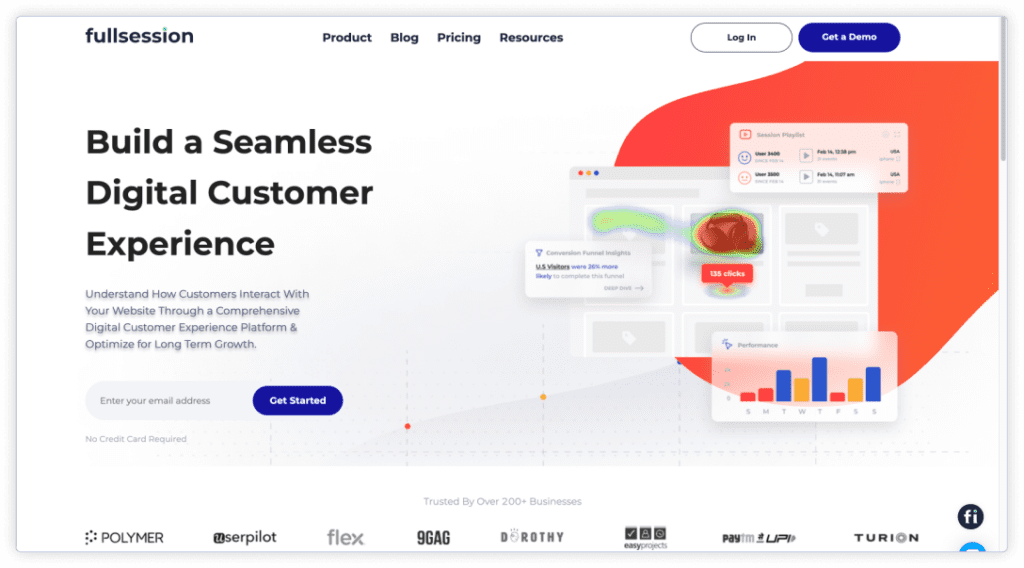
What is FullSession?
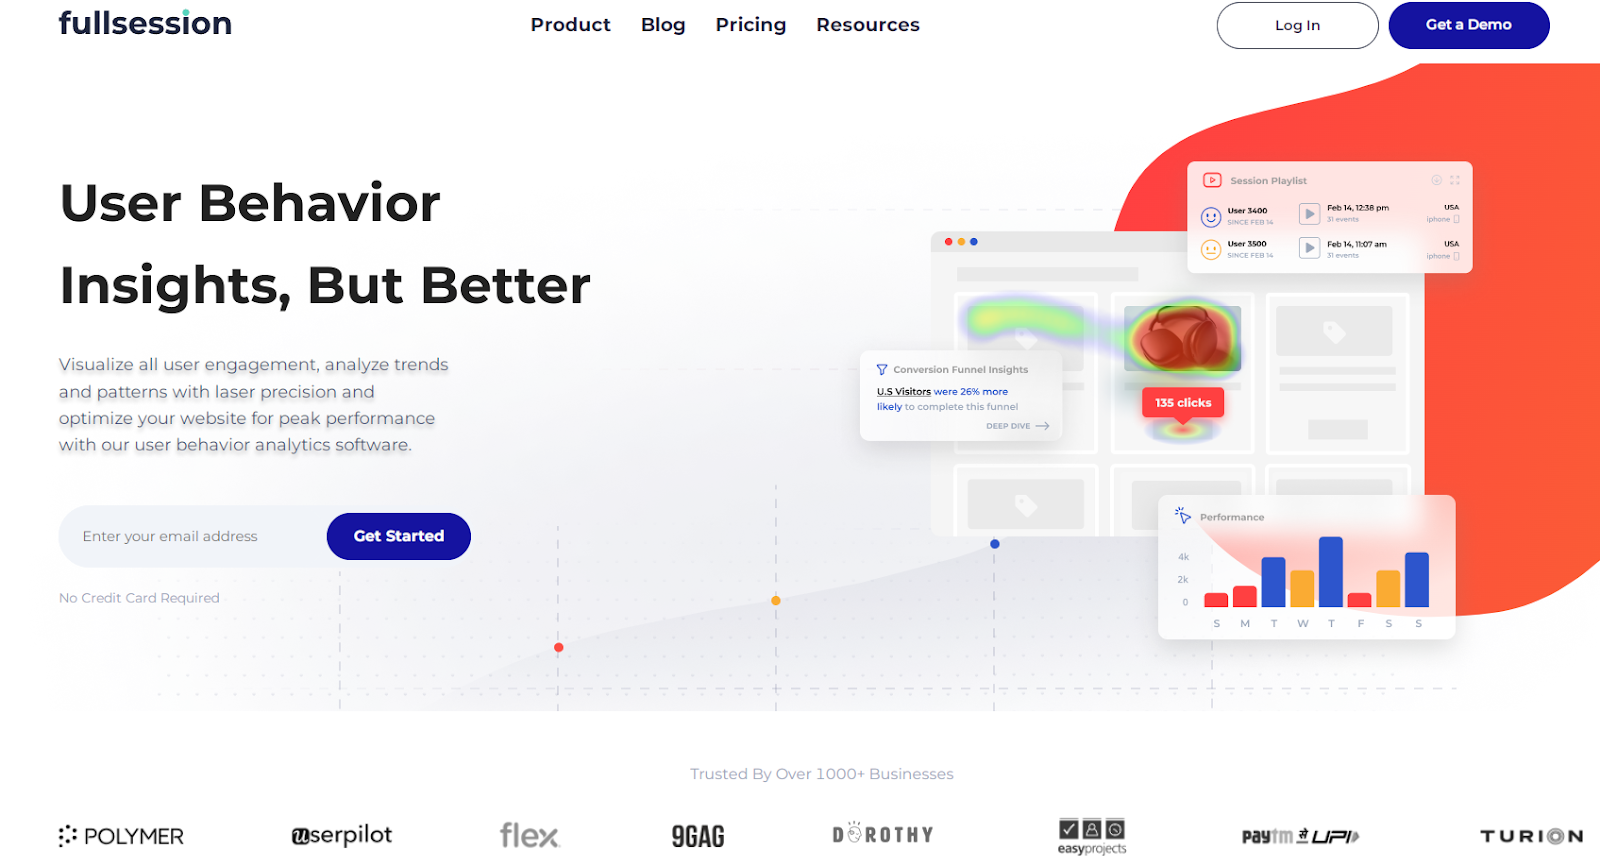
FullSession is a user behavior analytics software for measuring, monitoring, analyzing and optimizing the effectiveness of your website, web app, or landing page.
Thanks to its features, you can better understand how the users interact with your product and make business decisions based on qualitative and quantitative data.
Here’s a closer look at how FullSession can benefit your business:
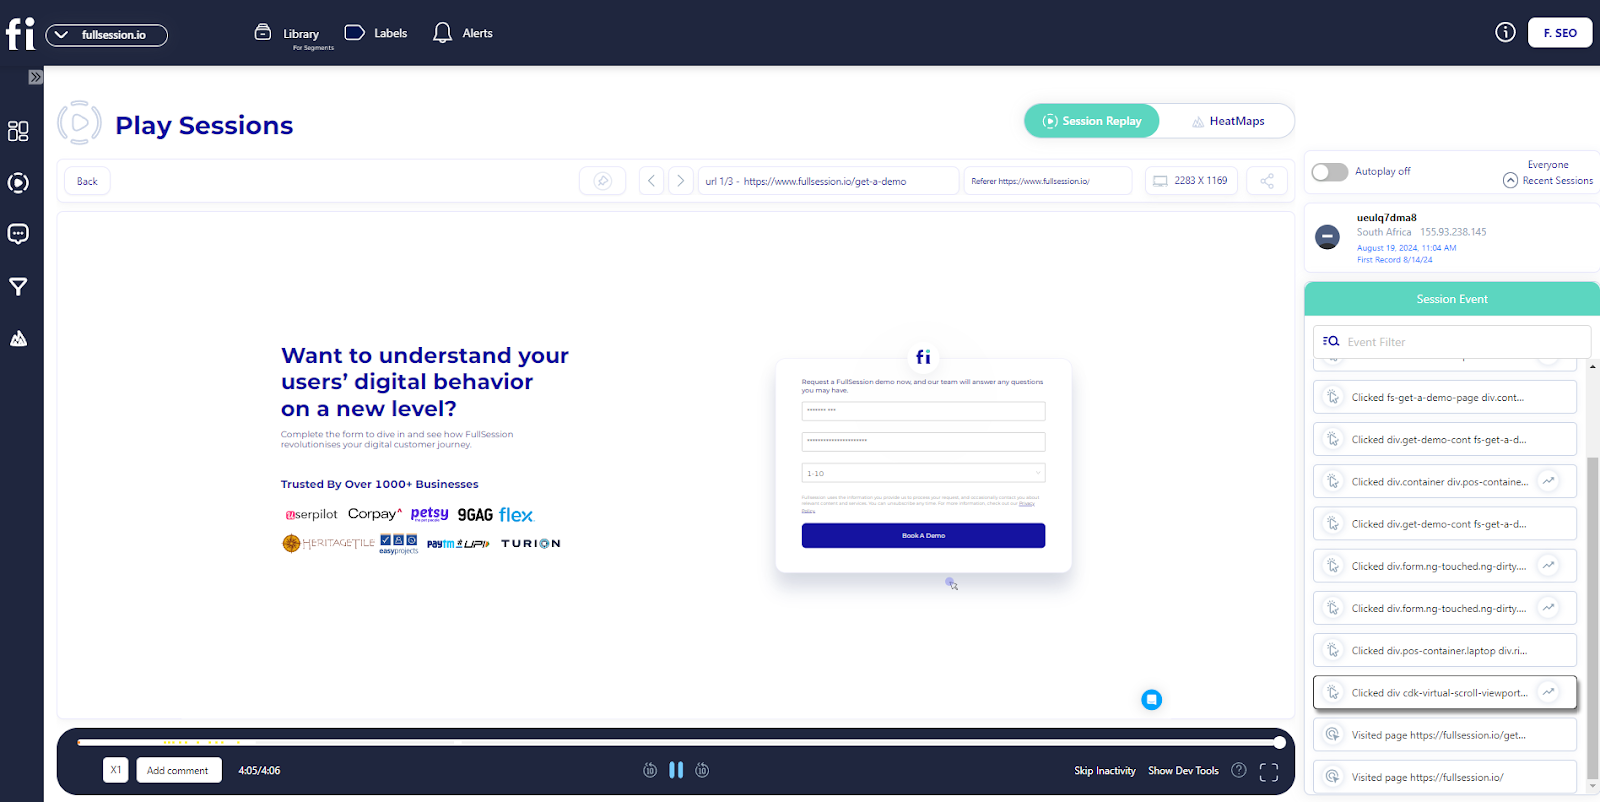
- Real-time session recording: See customer interactions as they happen, giving you immediate insights into how users engage with your site.
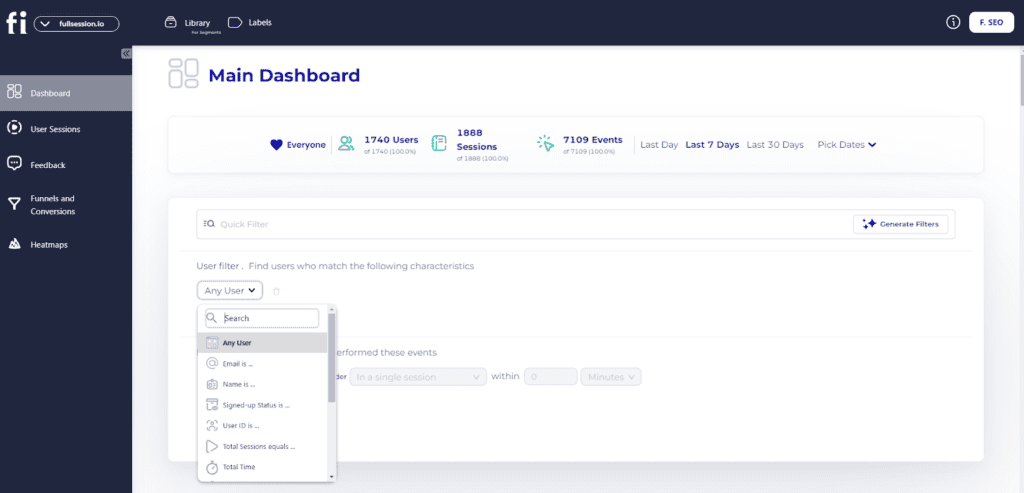
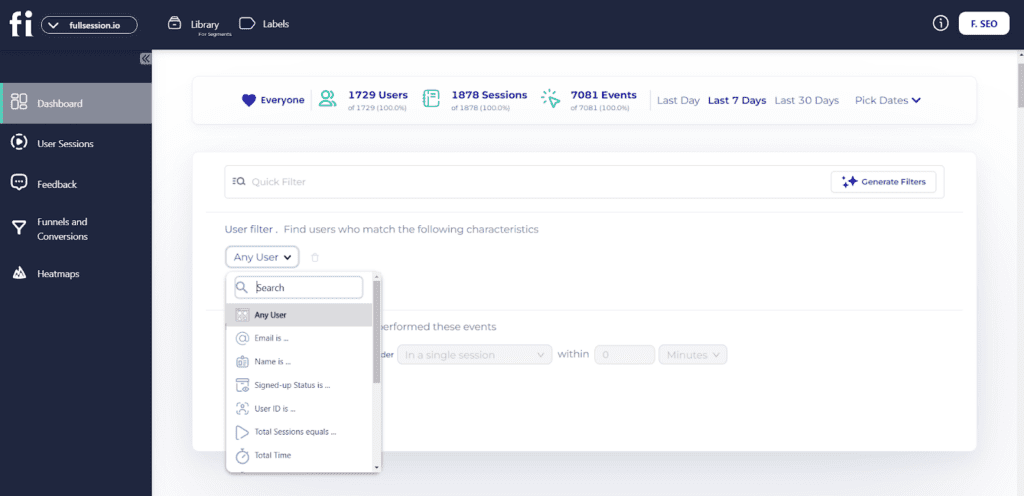
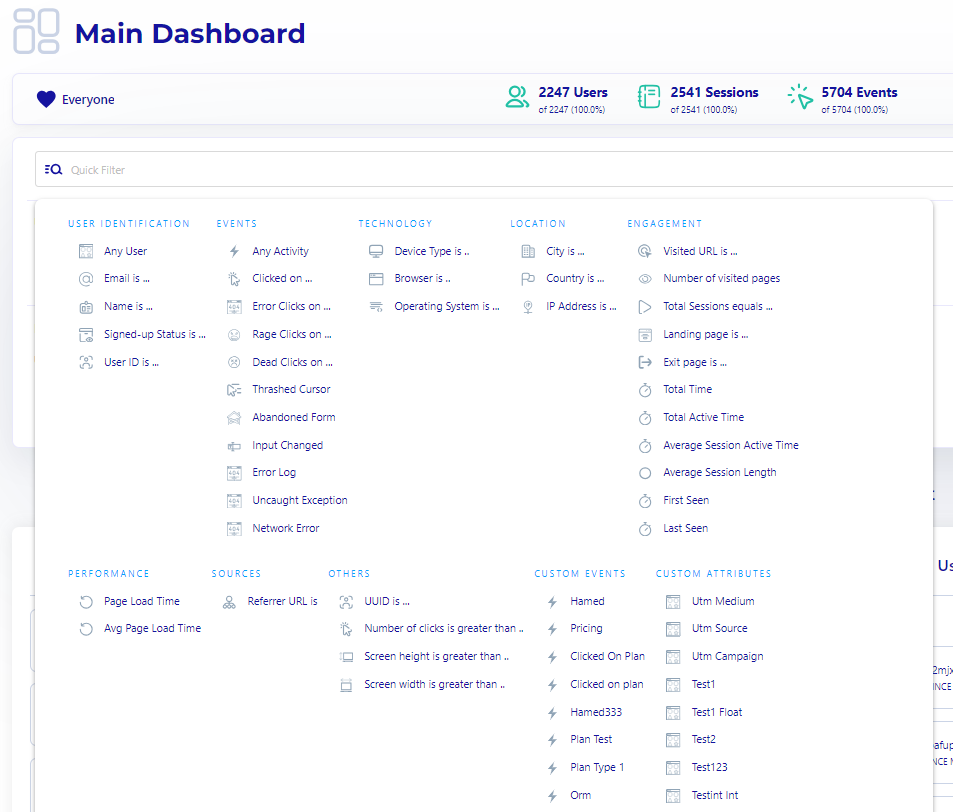
- Advanced filtering options: Quickly find specific user actions and events with smart filters, making your analysis a breeze.
- Dynamic element tracking: Improve engagement by better understanding how users interact with dynamic elements on your site.
- Heatmap analysis: Track clicks, mouse movements, and scrolls to see where users are most active—all without slowing down your site.
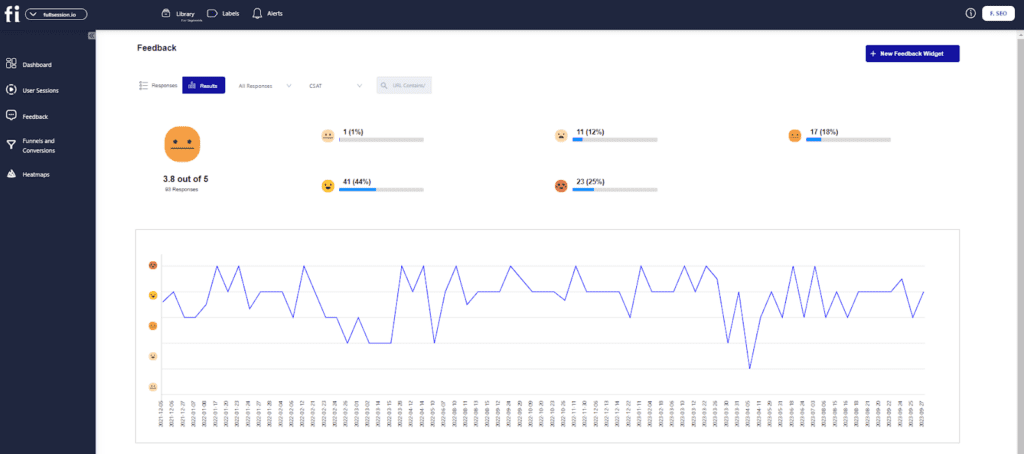
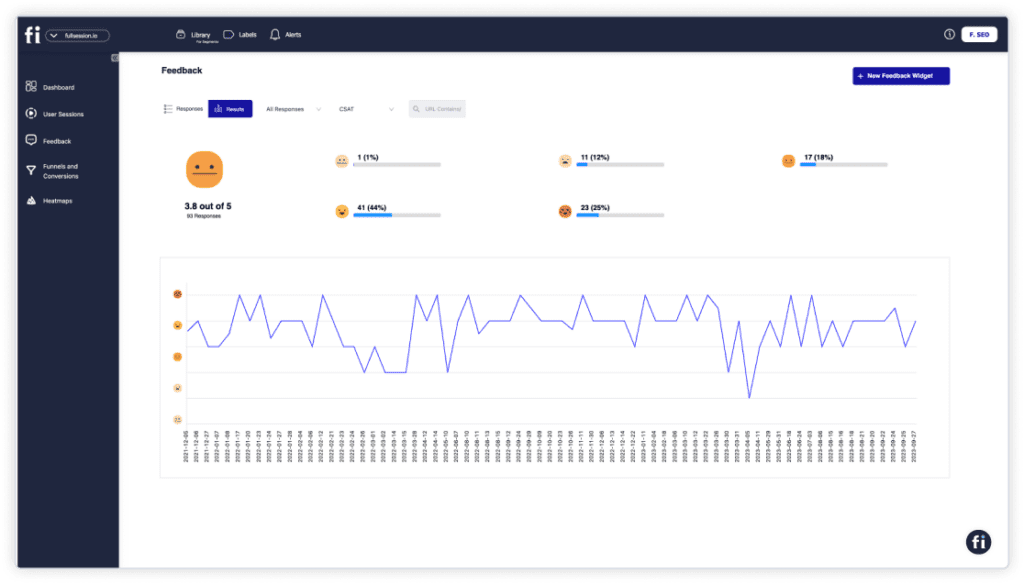
- Customer feedback tools: Collect direct insights from your audience with surveys like NPS and CSAT, right on your site.
- Integrated user feedback: Connect user feedback directly to session recordings for a complete picture of what’s working and what’s not.
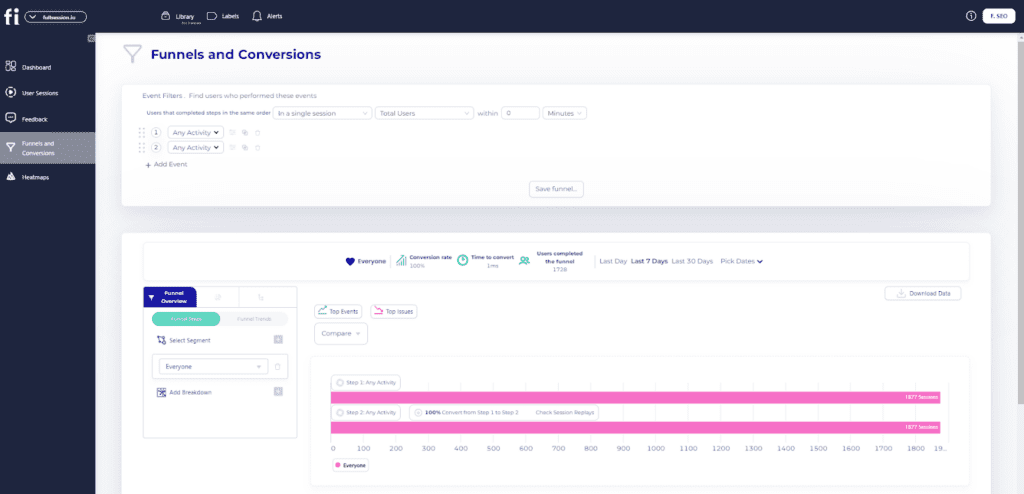
- Funnels and conversions: Dive into your conversion funnel to see what’s driving success and where you can make improvements in the user journey.
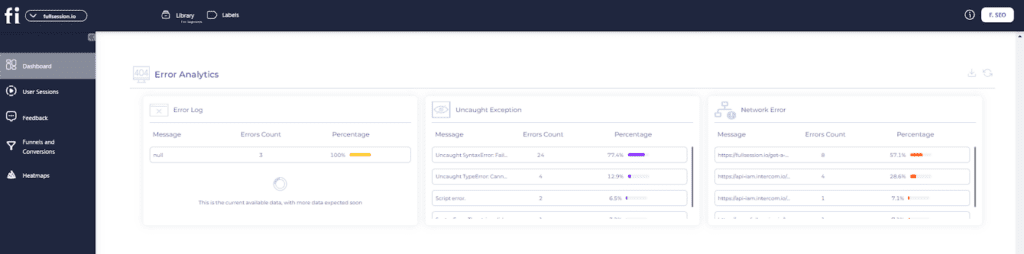
- Error analysis: Spot and fix issues that impact user experience, from error clicks to network problems, to keep your site running smoothly.
- Data privacy compliance: Keep user data secure and meet GDPR, CCPA, and PCI standards while automatically excluding sensitive information from recordings.
Want to see it in action? Book a demo today and discover how FullSession can help transform your website’s performance.
What is UserZoom?
UserZoom, the platform previously known as Validately and is now part of UserTesting, is a well-known brand in the user testing market.
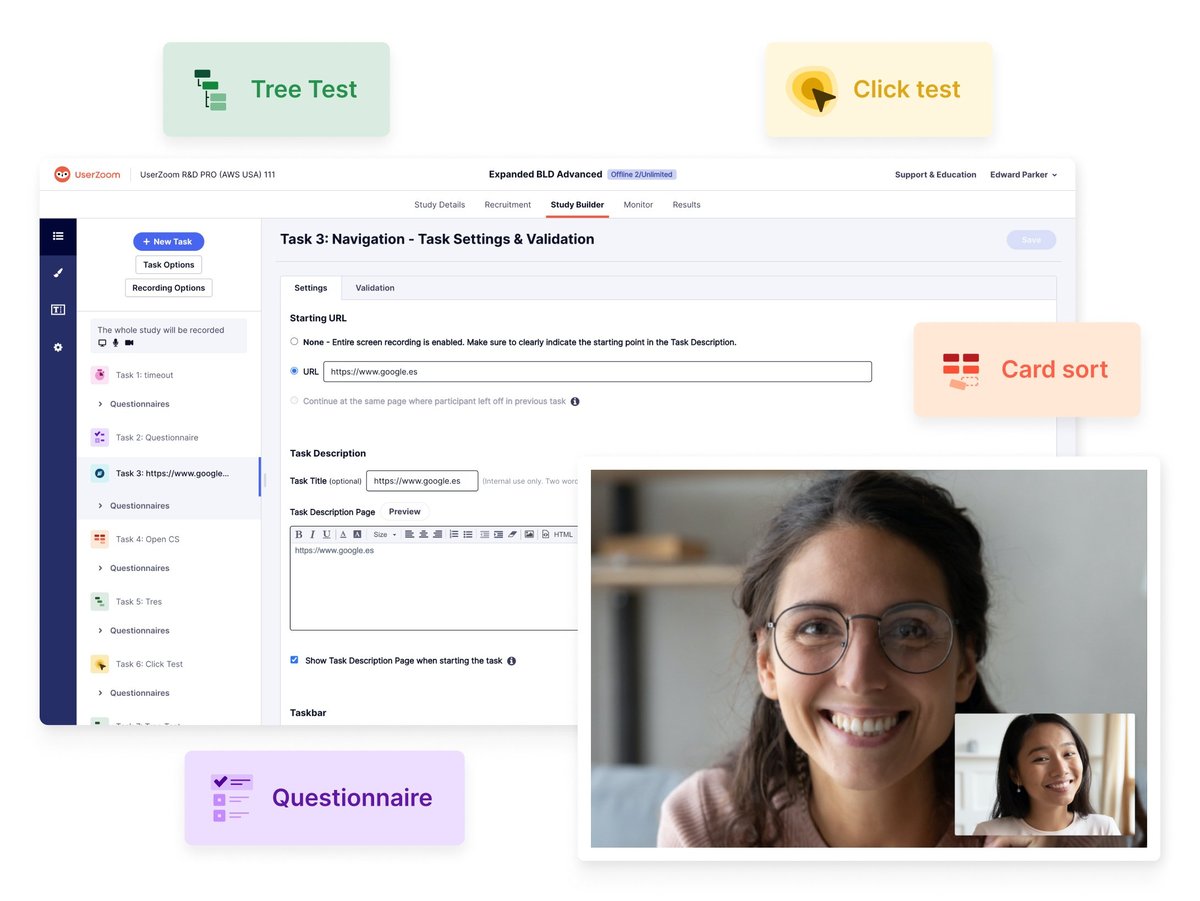
Image source: G2
You can use the solution to test applications, websites, prototypes, and wireframes. You can carry out interviews, conduct surveys, and usability tests. You can also do card sorting, tree testing, and click testing, among other things.
UserTesting acquired UserZoom in 2023, but you can use both platforms separately.
What is UserTesting?
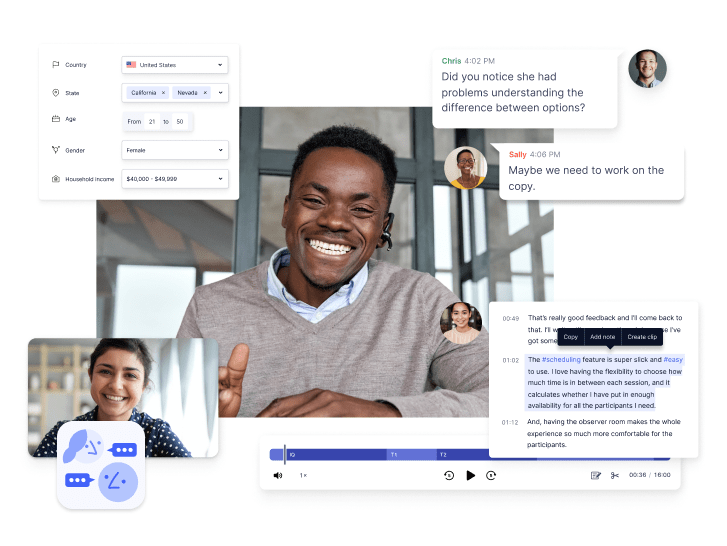
UserTesting is a platform for testing website or app functionality. It focuses on video recordings and human insights to help you understand users’ authentic experiences when interacting with your product.
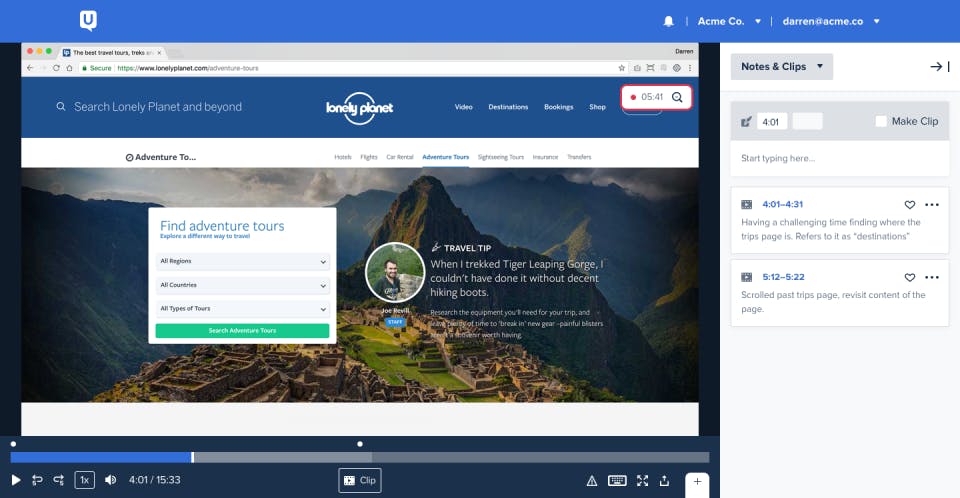
Image source: G2
The researchers can observe user reactions to your website or app in real time. They can study facial expressions, emotions, body language, and tone of voice.
UserTesting allows a good deal of customization. You can create specific questions and tasks and define test groups. You can carry out the tests with members of the UserTesting Contributor Network or invite your test participants.
With UserTesting, you can gather, analyze, and draw conclusions from data—it provides transcripts, metrics, and visualizations.
UserZoom vs UserTesting: How They Compare And Contrast
We’ve introduced you to the tools outlined in this article. Now, let’s see how they compare. We’ll consider available features, user ratings on popular review platforms, deployment, integrations, languages, pricing, and customer support. We will also examine typical use cases.
We’ll also highlight how FullSession compares to these tools.
UserZoom vs UserTesting: Basic differences
The main difference between these tools is that they serve different purposes or, at the very least, have different focus.
UserZoom helps you conduct full-scale user research and detect issues with the user experience. UserTesting, on the other hand, concentrates on website functionality.
UserZoom focuses on quantitative testing, which evaluates website usability and customer experience. It’s a complex platform that offers different research methodologies and test types. The downside is that some businesses probably won’t need such a comprehensive tool, and learning to use it might take some time.
UserTesting is a more straightforward solution. It’s a good option for product teams that need qualitative data. You can collect video-based human insight, conduct tests, assign specific tasks, and watch how users complete them. This helps you evaluate how users perceive your product.
If you’re looking for a balanced solution that combines ease of use with powerful insights, FullSession could be the perfect fit. It offers a comprehensive set of tools, including real-time session recordings, heatmaps, funnels and conversions, error analysis, and customer feedback integration, allowing you to analyze both quantitative and qualitative data.
FullSession is designed to be user-friendly while providing the depth needed to optimize your website and enhance the user experience.
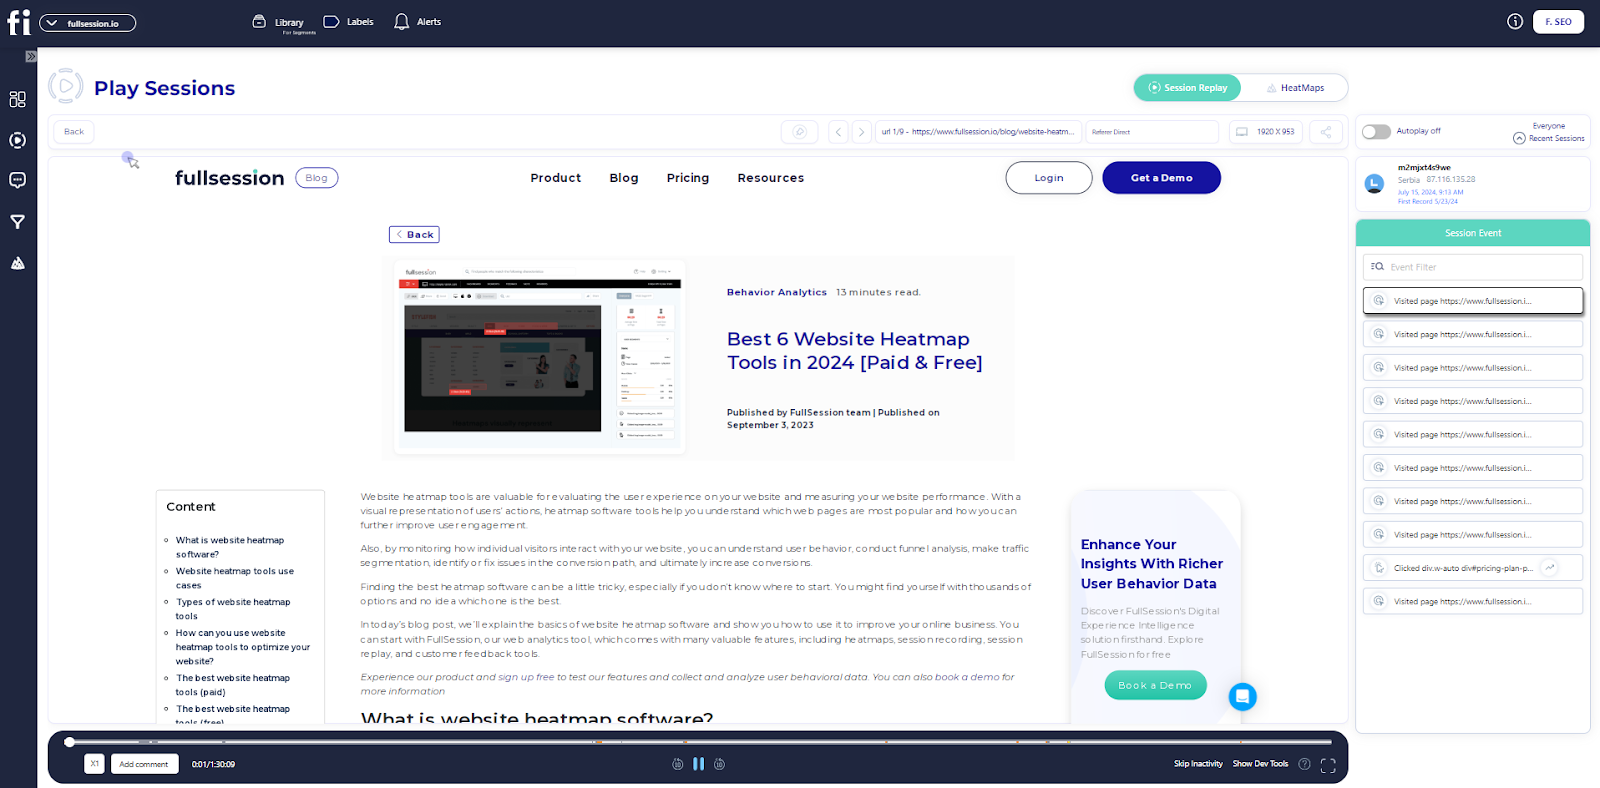
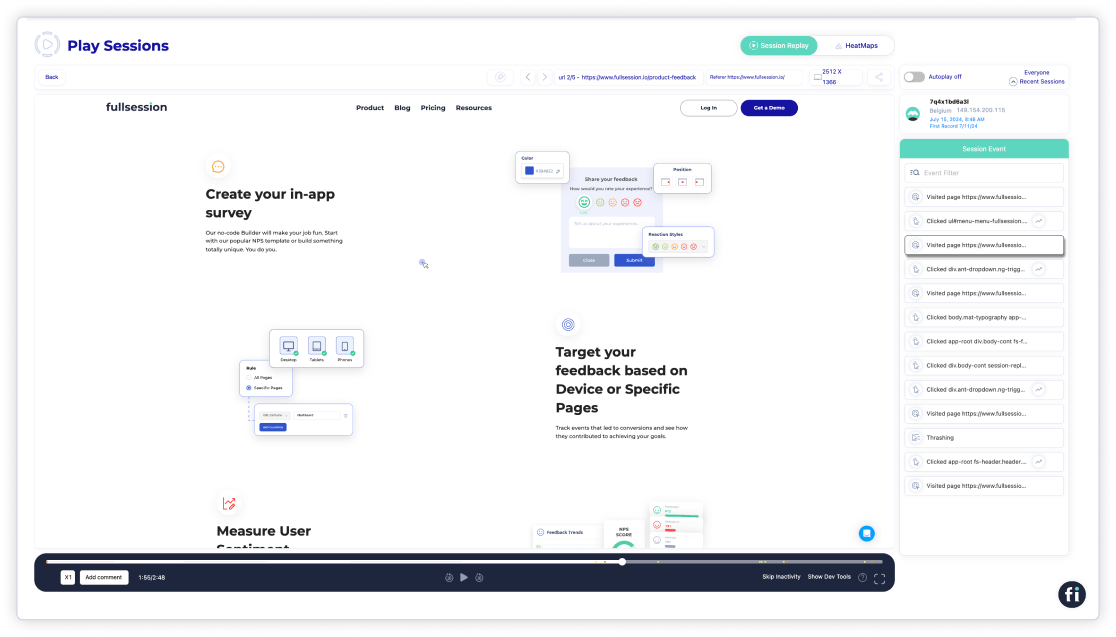
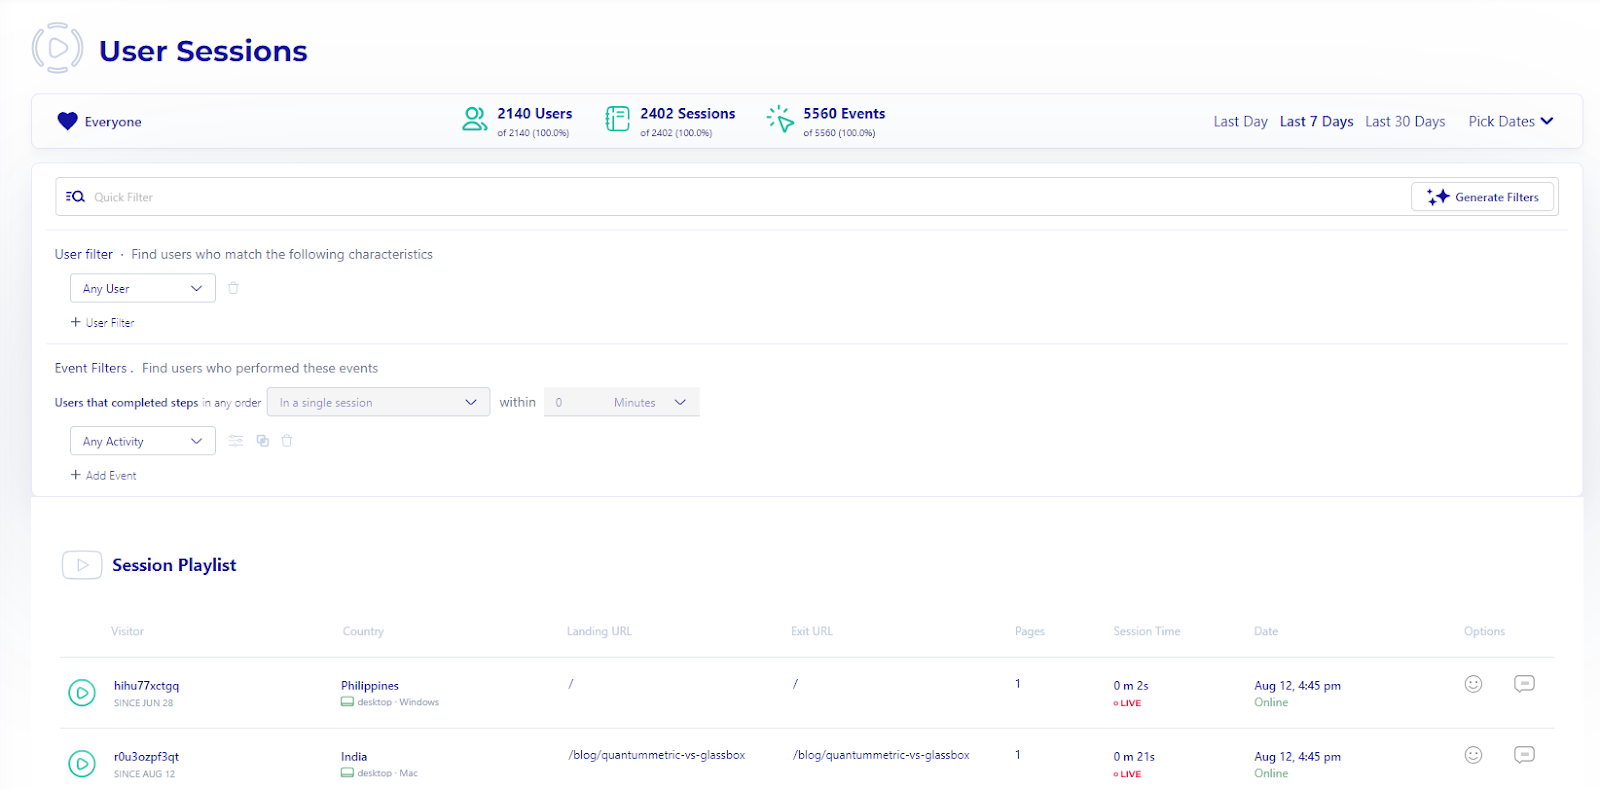
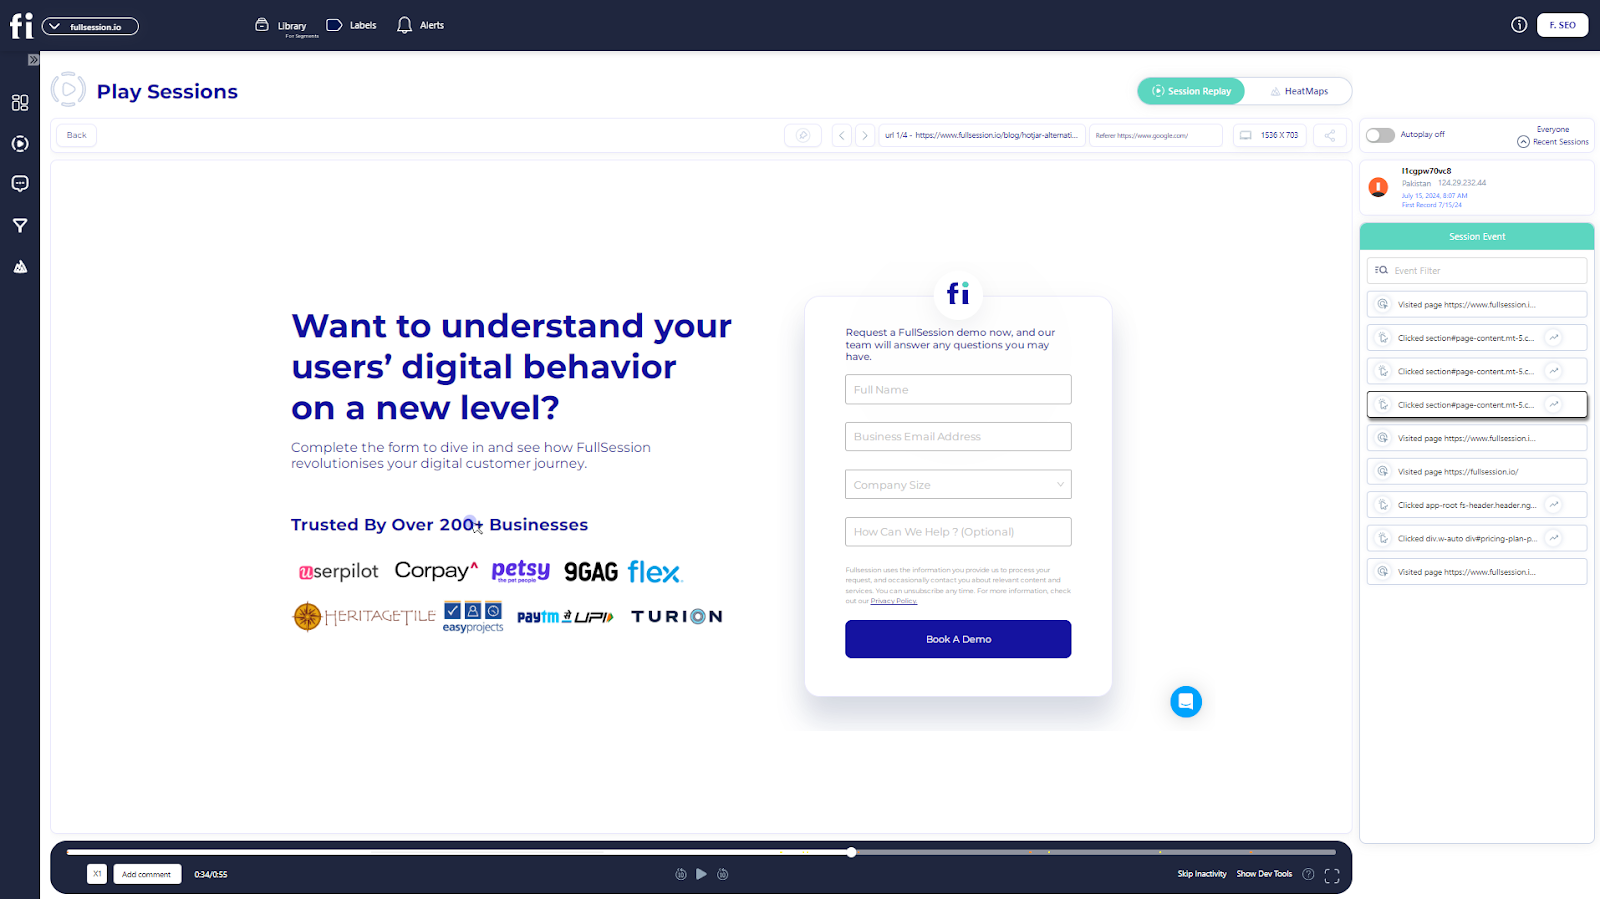
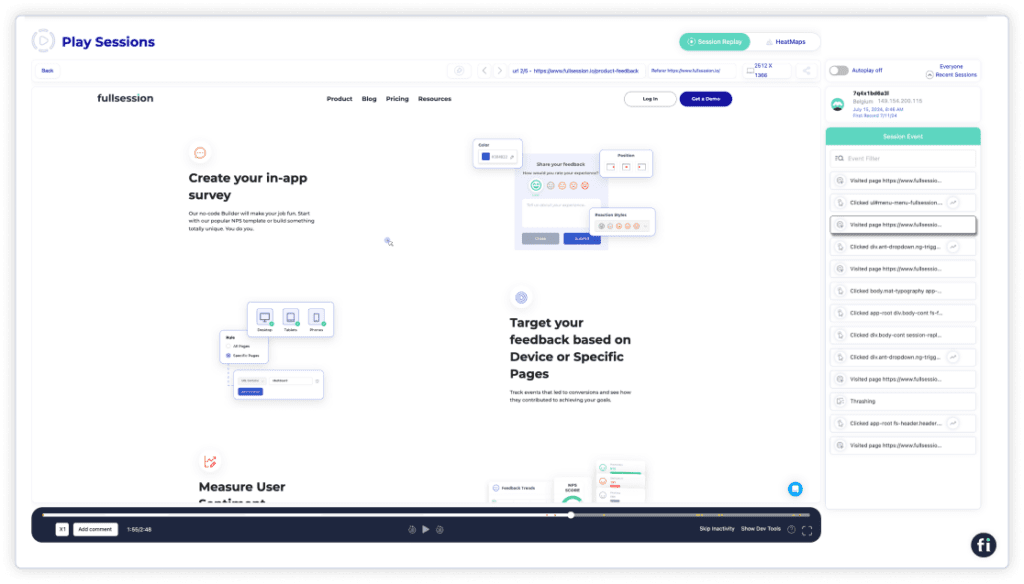
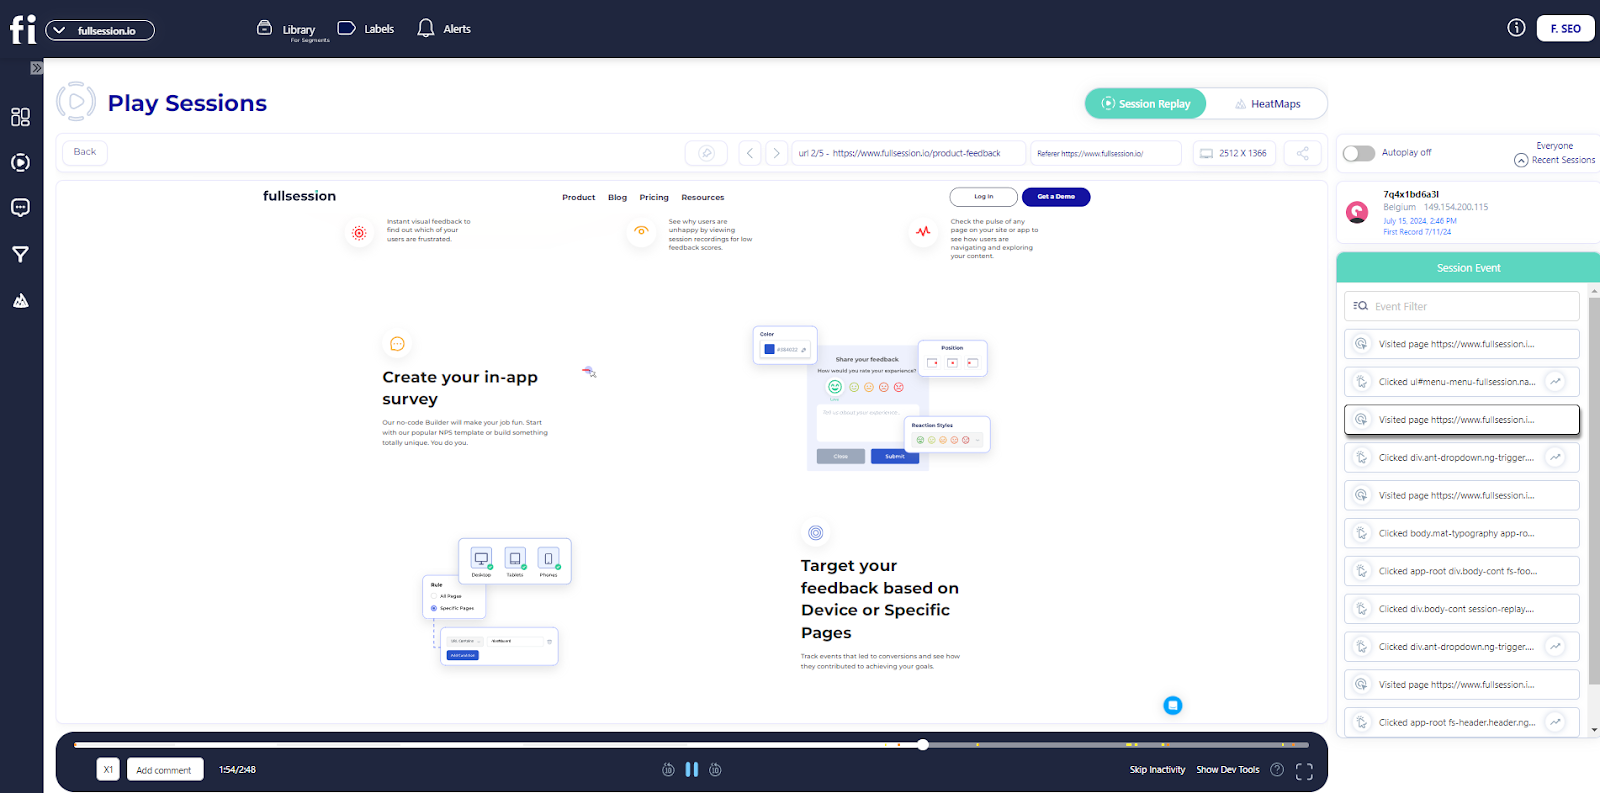
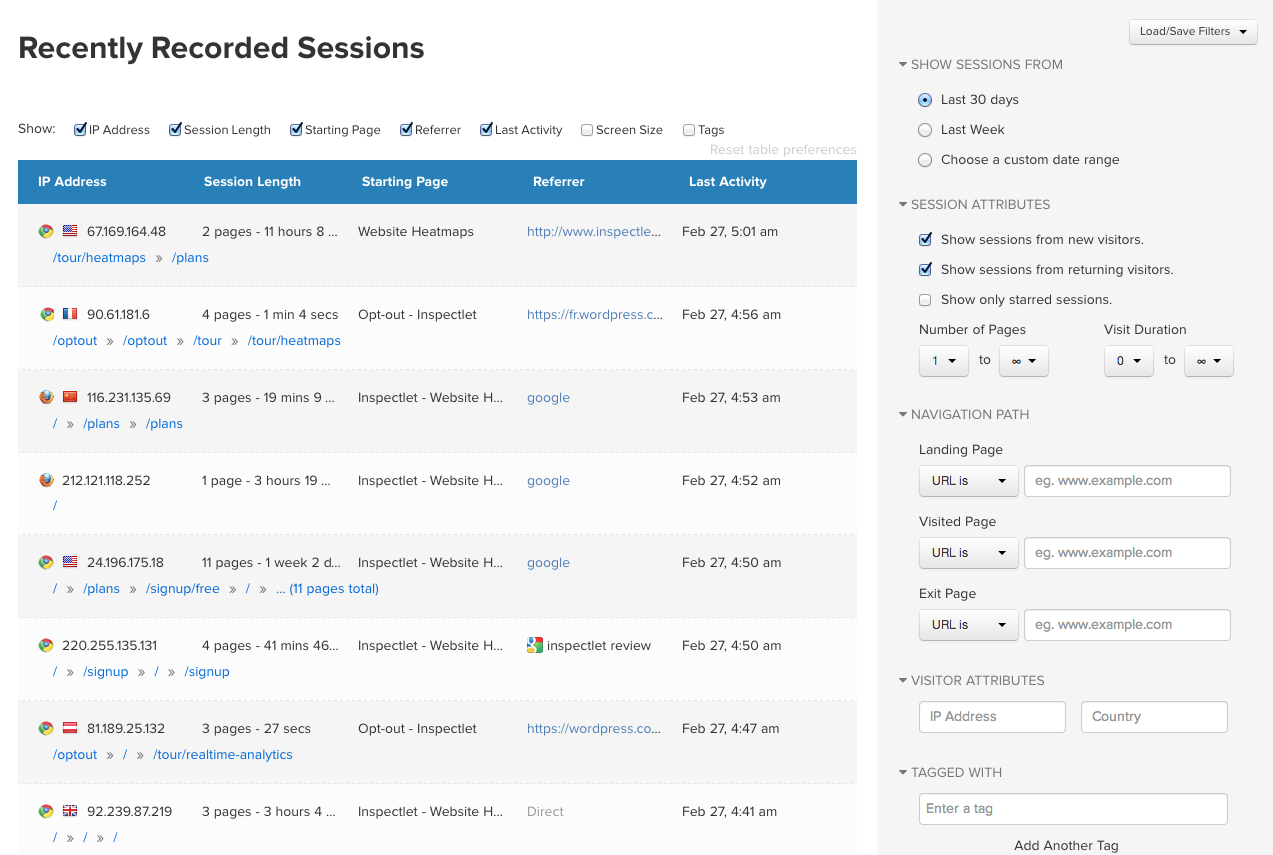
Session recordings
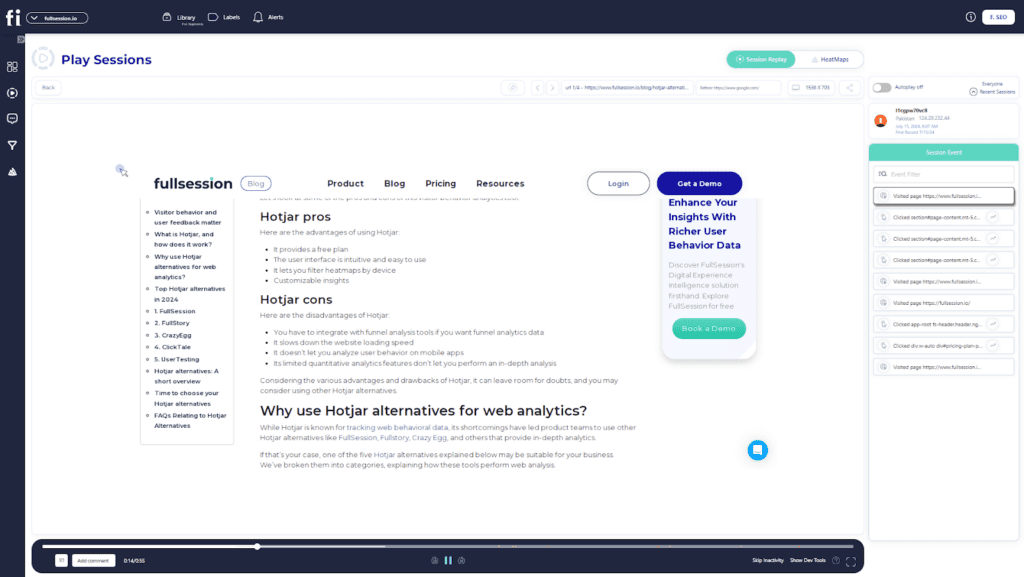
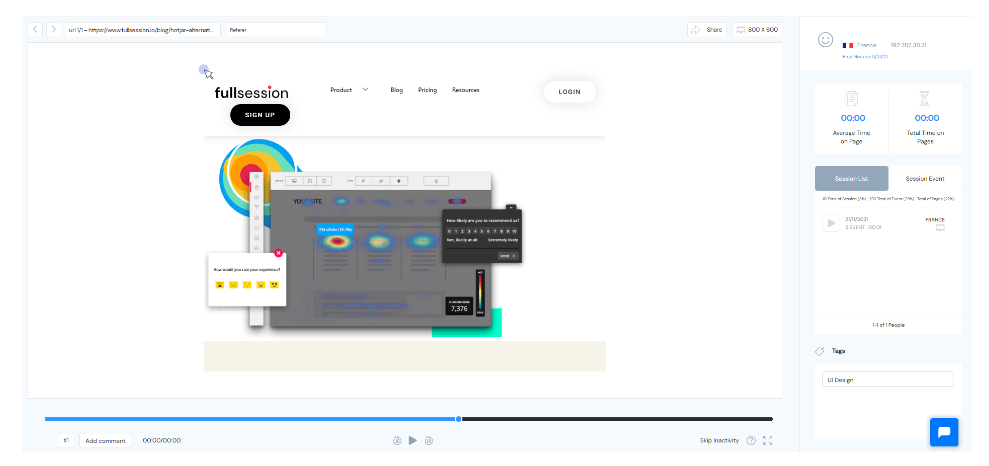
For instance, FullSession allows you to watch recordings of real users interacting with your product—not just test participants who look like your target audience.
Thanks to this feature, FullSession provides more value than the competition. It’s also easier to use because you don’t have to waste time finding participants and carrying out tests. You can conduct research at your own pace and have all user data in one place.
FullSession helps you spot issues on your website quickly. If users have a negative experience with your product, they can leave feedback, and you can watch session recordings to identify user frustrations and fix them quickly.
UserZoom vs UserTesting: User ratings
UserZoom has a 4.2 score on G2 based on 140 reviews. It has a 4.4 rating on Capterra, but there are only ten reviews in this case.
UserTesting’s rating on G2 is slightly higher—4.5, based on 685 reviews. Its score on Capterra is slightly lower, at 4.5, based on 127 reviews.
UserZoom vs UserTesting: Use cases
Both UserZoom and UserTesting are used by UX researchers, UX designers, marketers, and product managers for UX testing. UserTesting also lists executives and product teams.
UserZoom is used in technology, finances, retail, travel, healthcare, gaming, and gambling. Some government entities also employ it.
UserTesting is also popular in many industries mentioned above but adds others to the list, such as communications, non-profit, media and entertainment, automotive, manufacturing, and education.
However, FullSession stands out as the best option if you’re in the eCommerce sector. It’s specifically designed to enhance eCommerce websites by providing deep insights into user behavior through session recordings, heatmaps, conversion funnel analysis, error tracking, and integrated customer feedback.
FullSession helps you optimize the shopping experience, boost conversions, and ensure your site meets customer expectations.
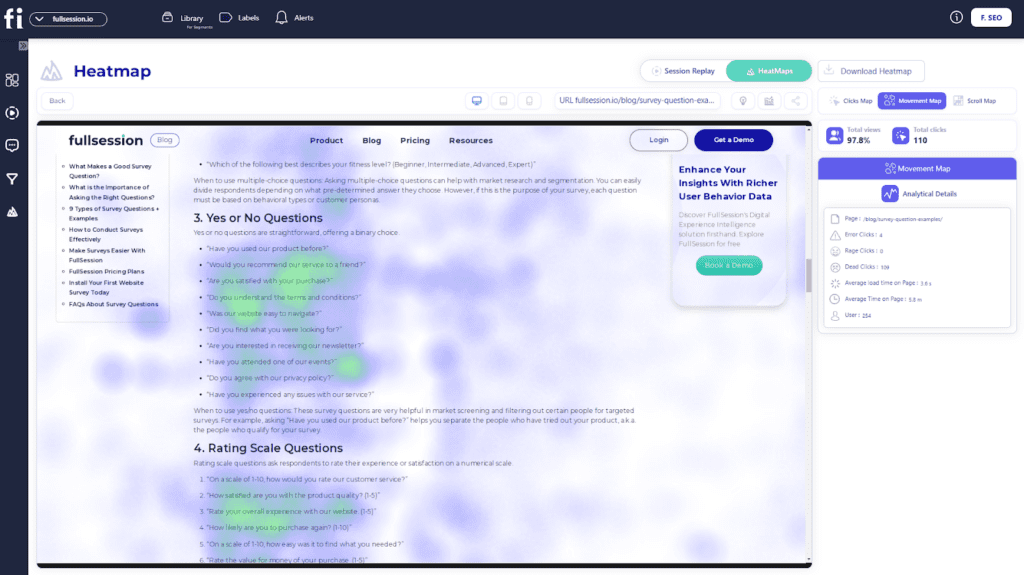
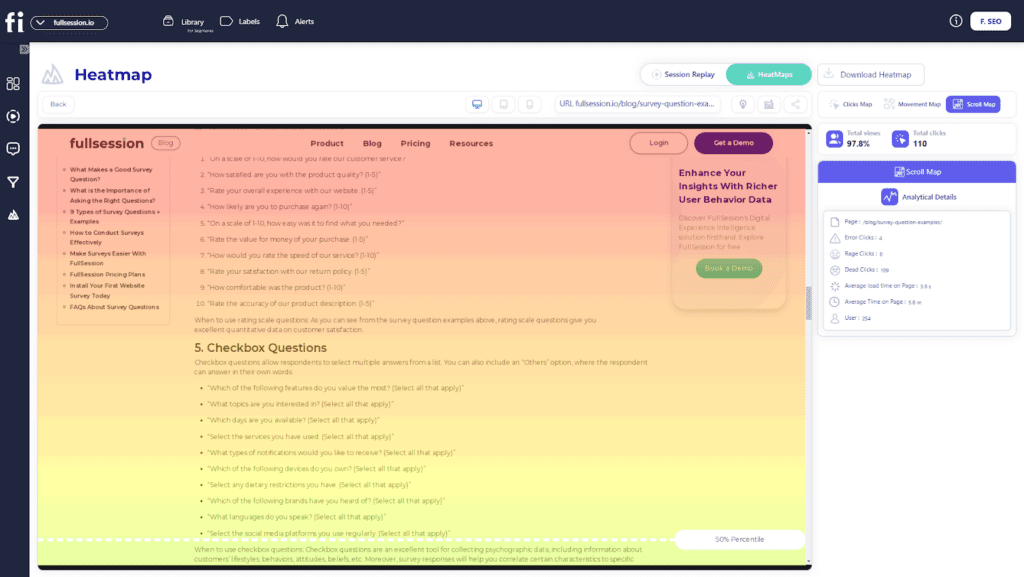
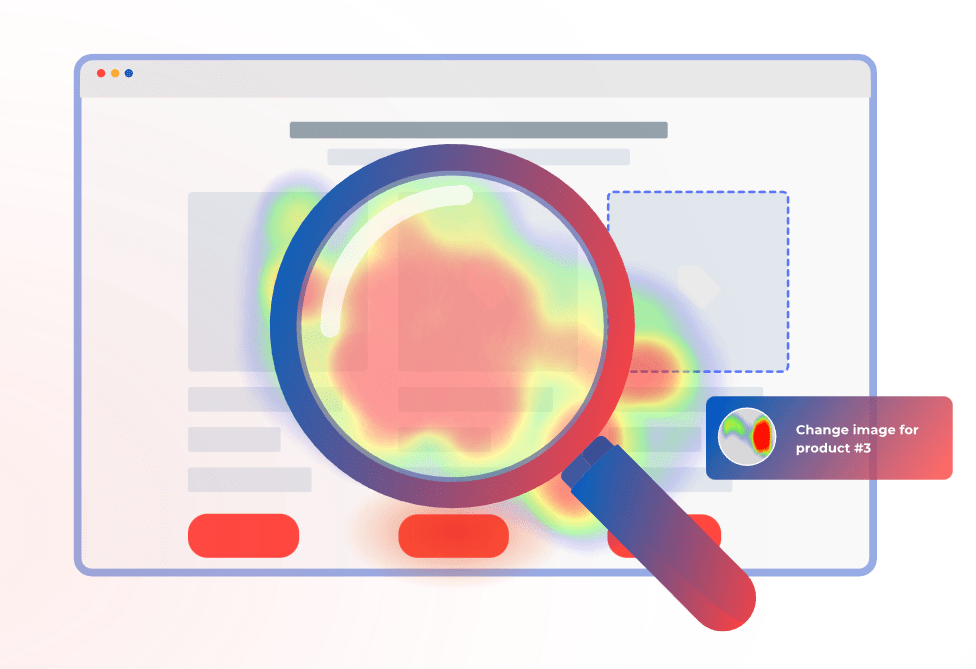
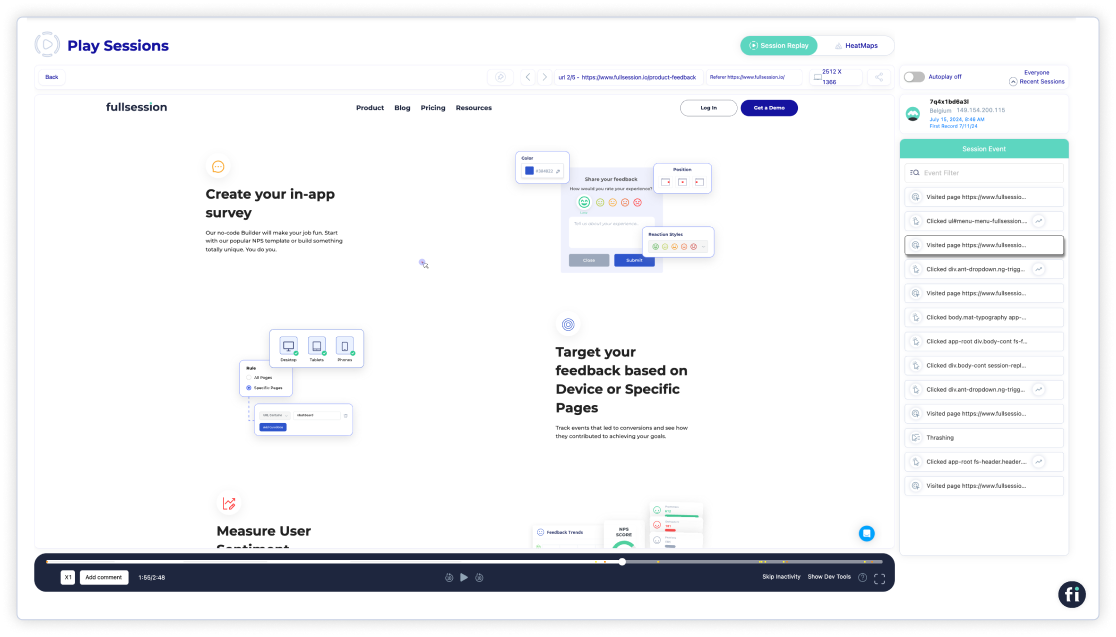
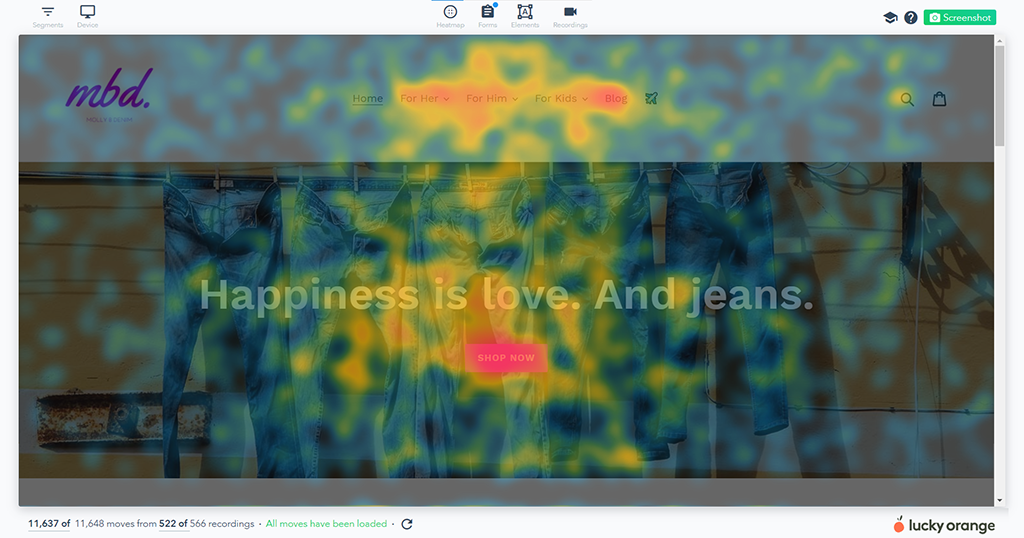
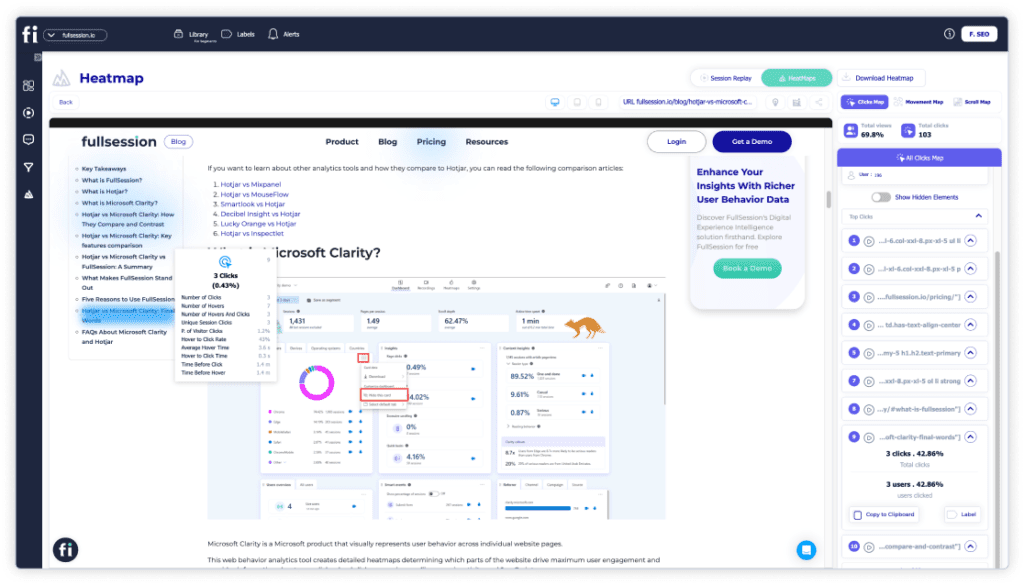
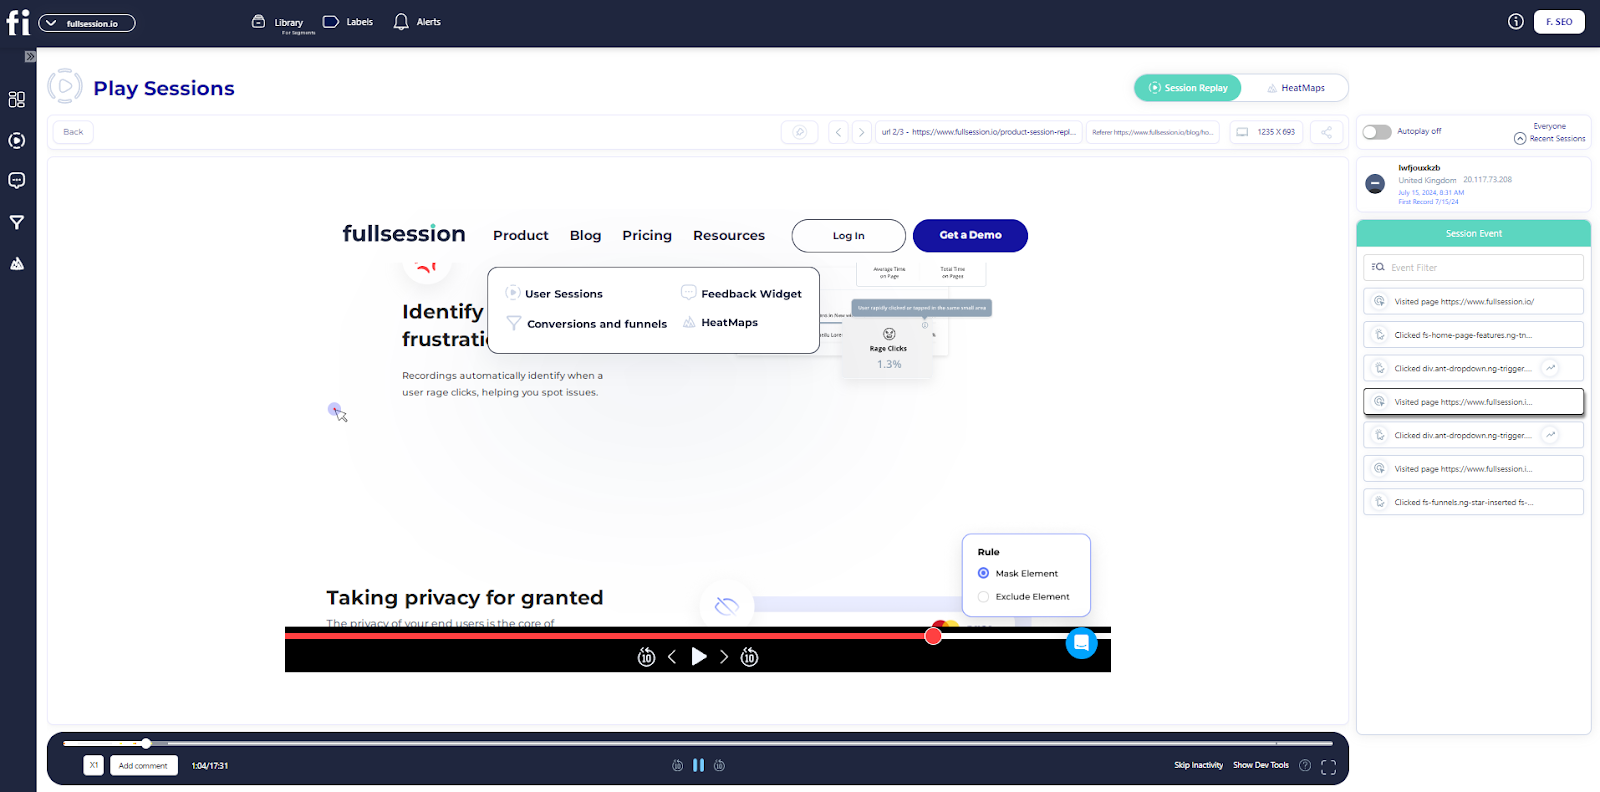
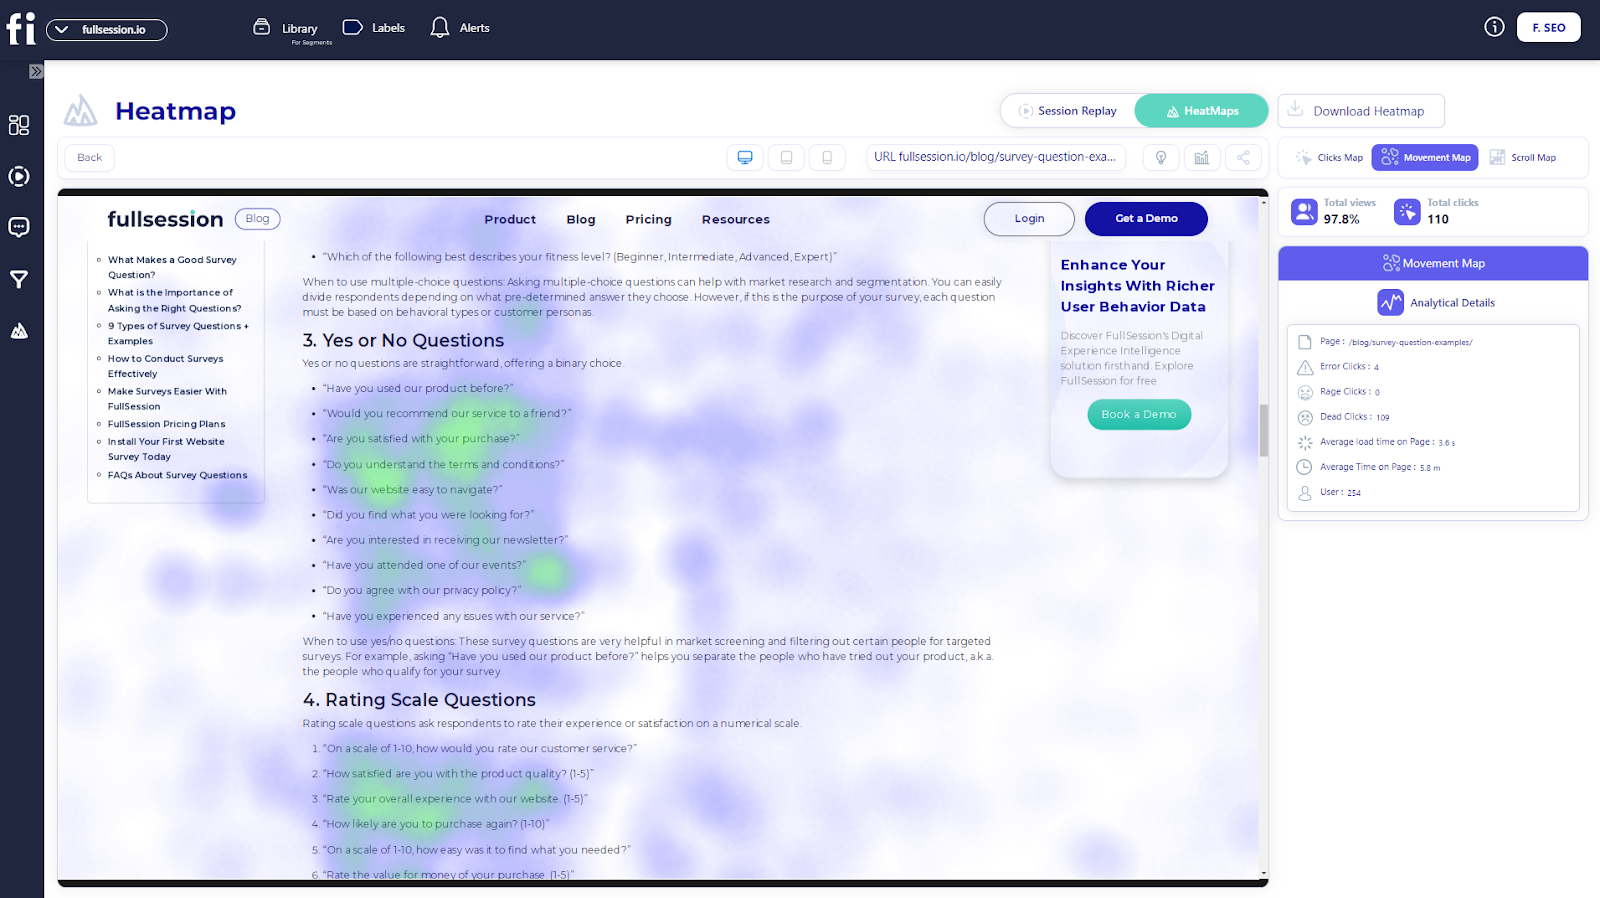
Heatmaps

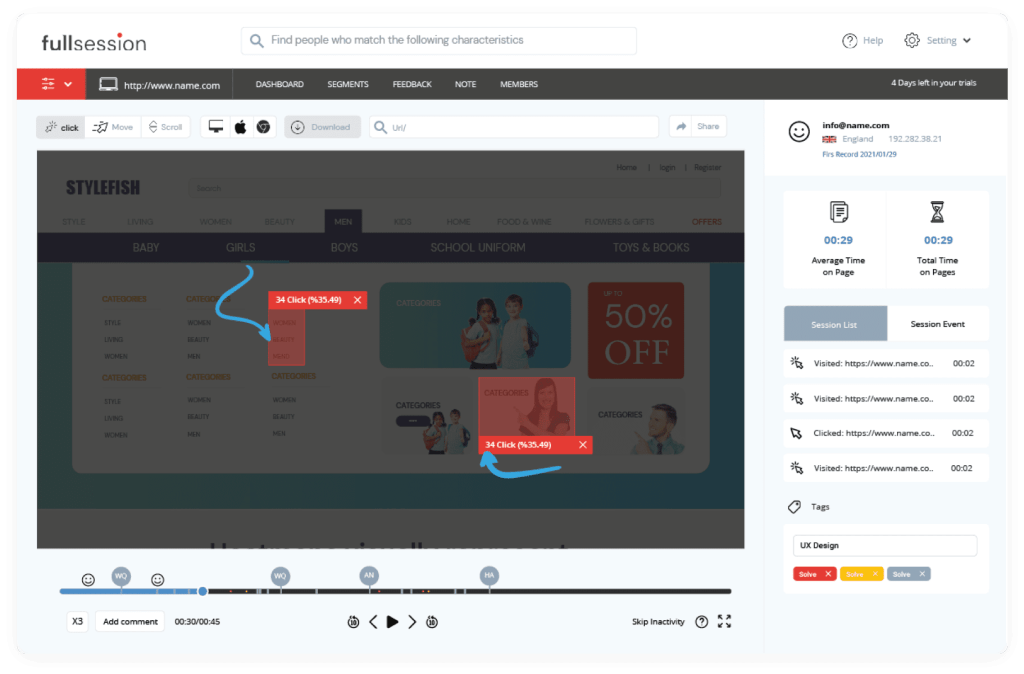
Take this feature for example. Instead of identifying general issues in session recordings, you can use our advanced filtering feature to segment them and pinpoint specific problems your users have.
The recordings show how users navigate the website and track where they click. You can also check how much time they spend on the website overall and compare it to the average time. FullSessions offers you the option to speed up the recordings and skip periods of inactivity.
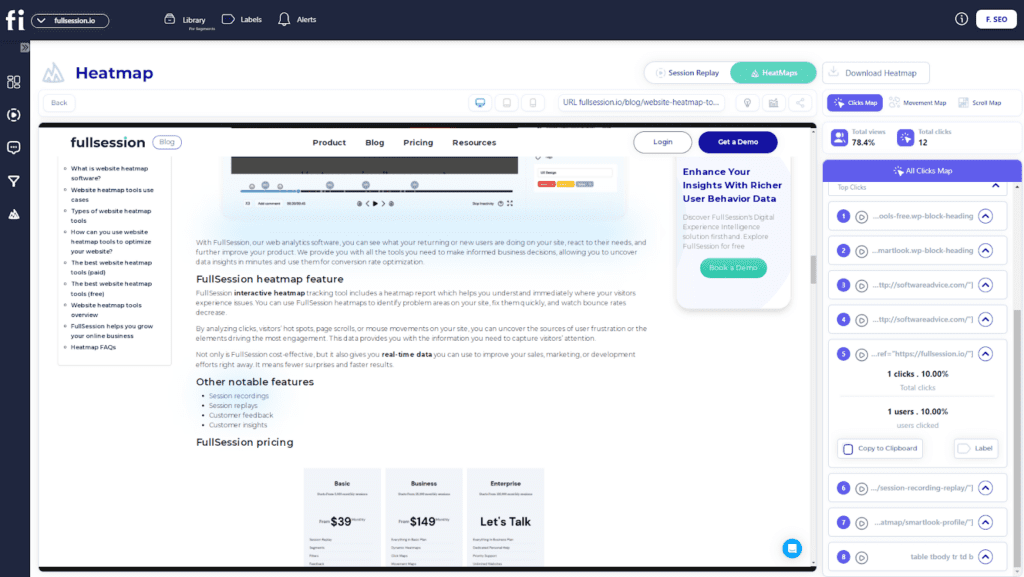
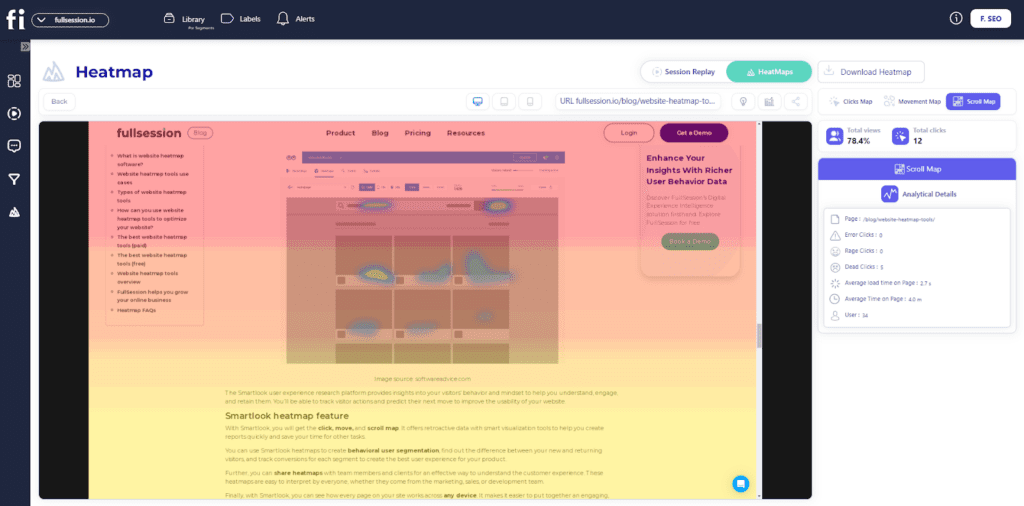
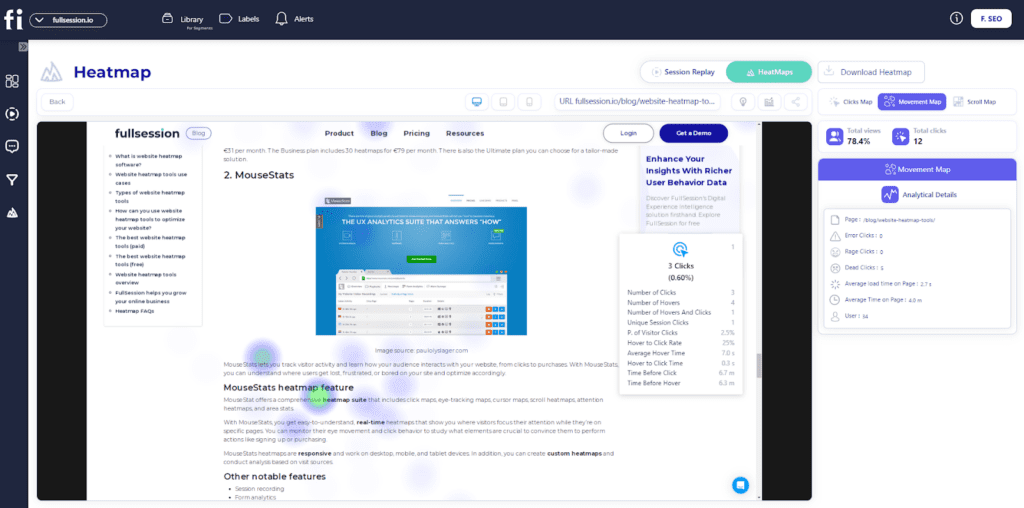
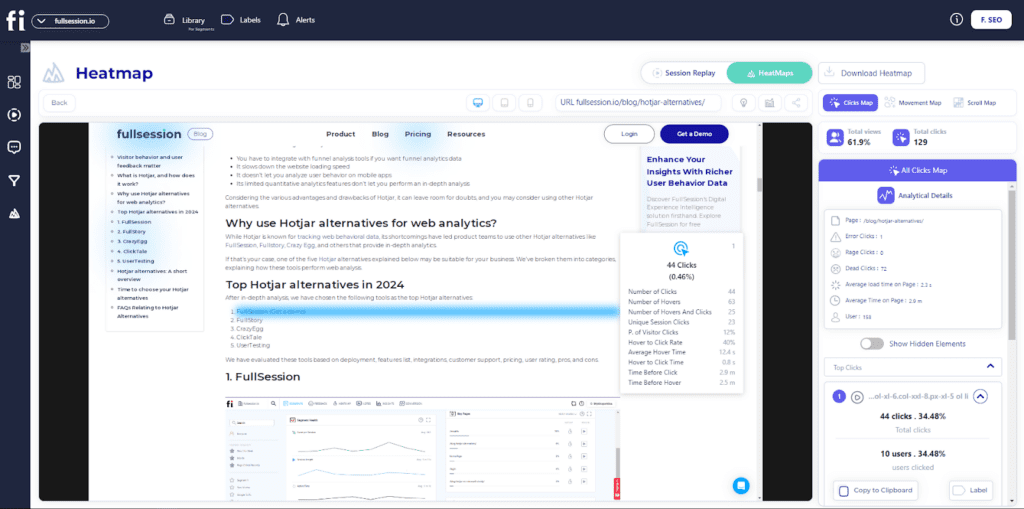
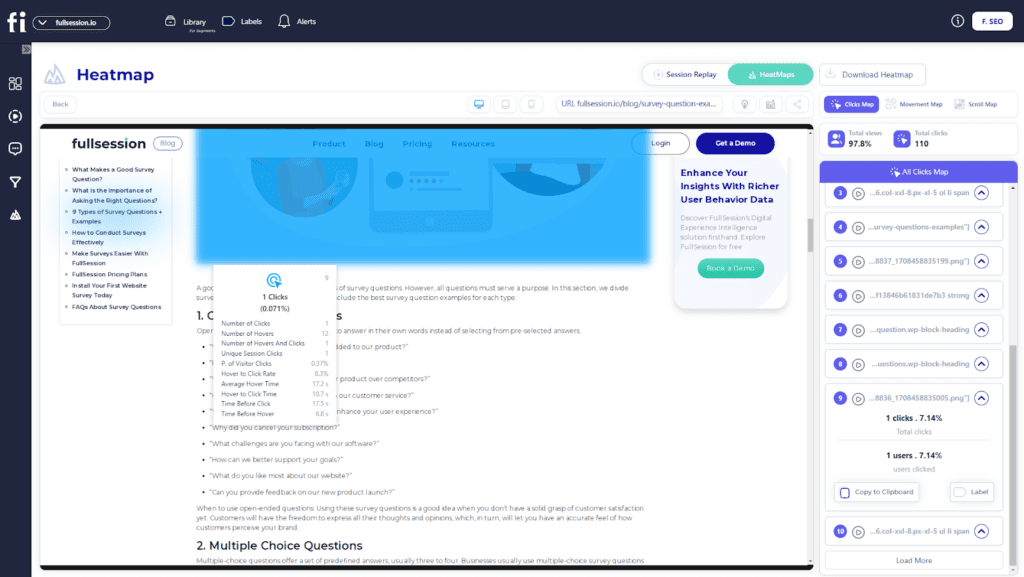
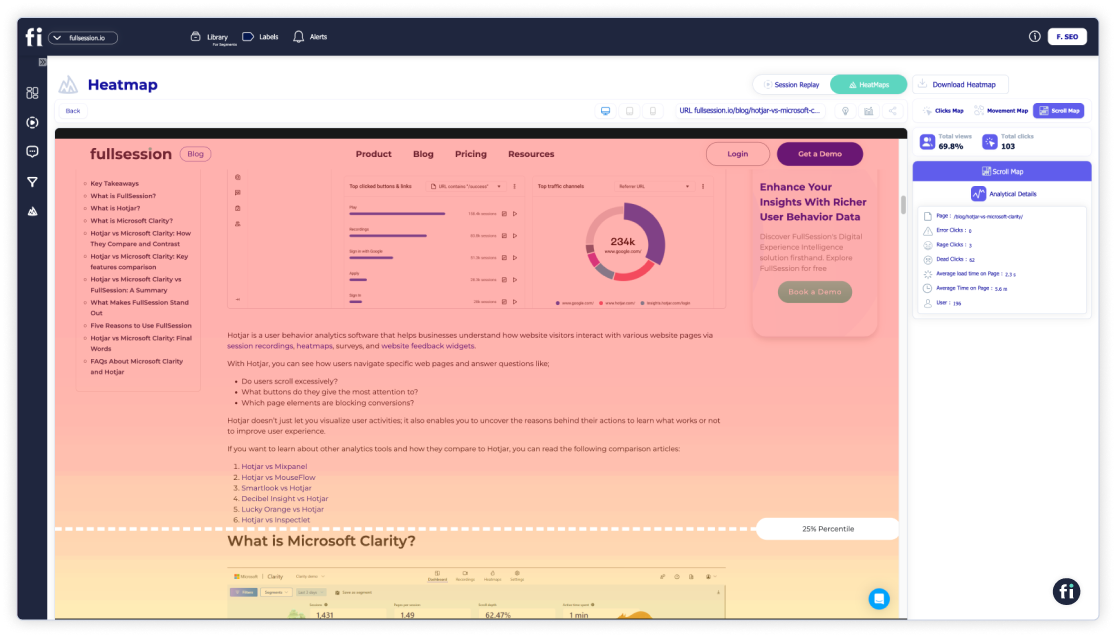
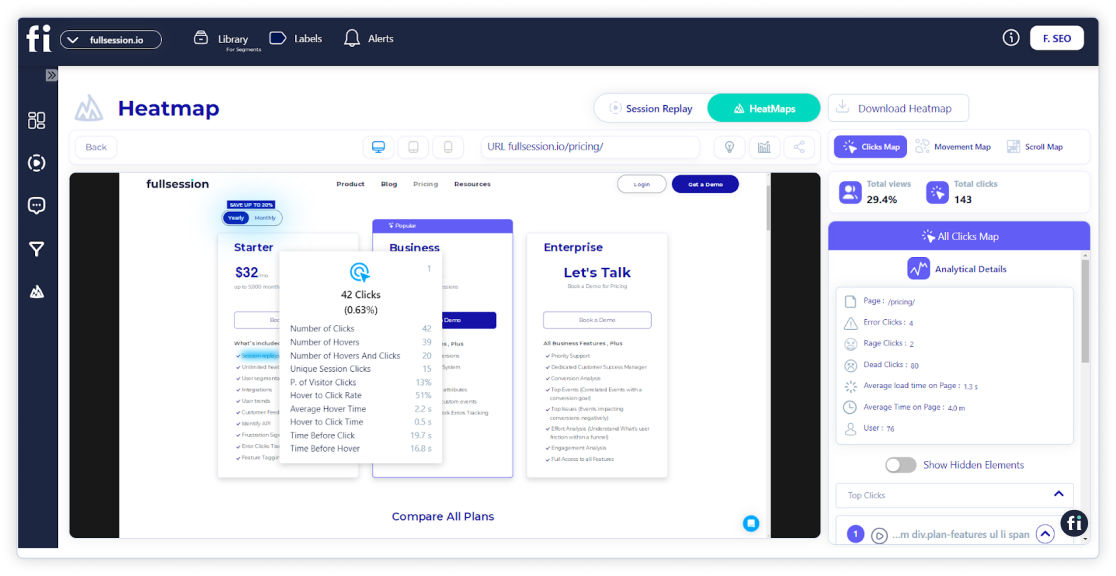
Heatmaps allow you to see which website elements get the most attention from your users and which don’t. Thanks to this, you’ll be able to address areas that need improvements. With FullSession, you can do all that in real time—you don’t need to wait for the data to be processed.
FullSession has three different maps to choose from:
- Click map: Visualizes where users click on your website, highlighting popular and underutilized areas.
- Mouse movement map: Tracks mouse movements to show how users navigate and interact with different elements.
- Scroll map: Displays how far users scroll down a page, helping identify if critical content is being seen or ignored.
UserZoom vs UserTesting: Deployment
Both UserZoom and UserTesting are web applications. To use them, you have to register on their websites and log in to your account.
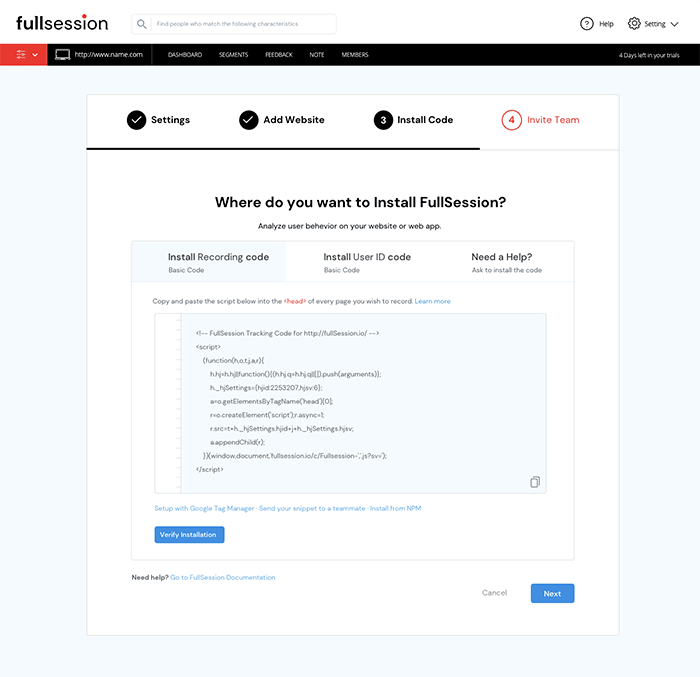
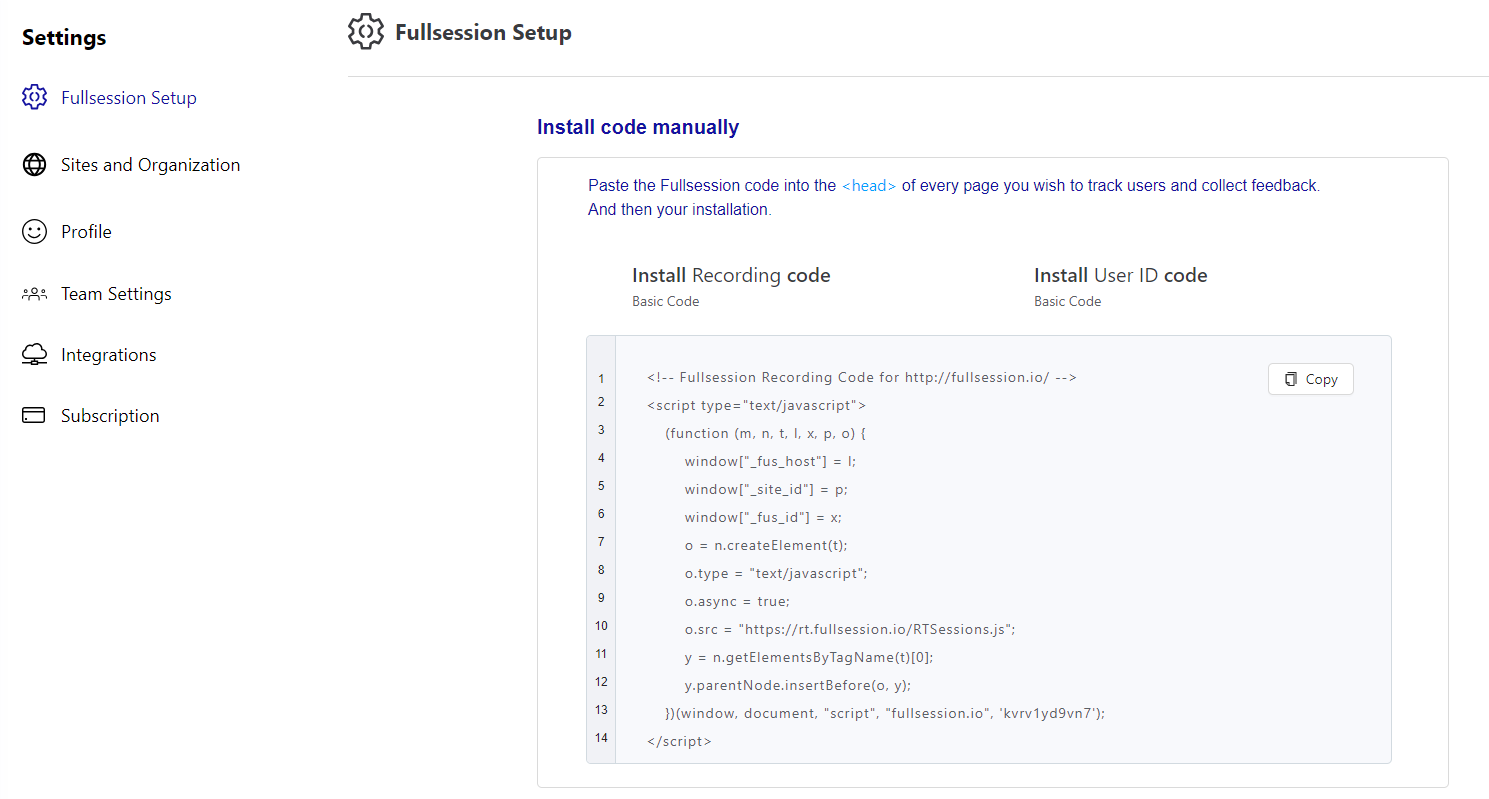
On the other hand, deploying FullSession is easy. Simply go to Settings > Data Capture and Privacy > FullSession Setup to get the snippet, then paste it into the <HEAD> section of your website’s code or CMS. The snippet automatically captures all user interactions without slowing down your site.
For privacy, you can exclude sensitive data by setting up exclusions under Settings > Data Capture and Privacy > Privacy. Once set up, sessions will appear in your dashboard and be ready for analysis.
UserZoom vs UserTesting: Features
What makes these research tools tick? Let’s take a look at the key features of each user testing tool.
| FullSession | UserZoom | UserTesting | |
| Session recordings | Yes | Yes | Yes |
| Surveys | Yes | Yes | Yes |
| Heatmaps | Yes | Yes | No |
| Funnel analysis | Yes | Yes | Yes |
| Website and mobile apps comparison | Yes | Yes | Yes |
| Key insights | Yes | Yes | Yes |
| Error analysis | Yes | No | No |
| Free trial | Yes | Yes | Yes |
| Languages | English, Arabic, French | English, German, and Spanish | English and German |
As you can see, UserZoom and UserTesting are more focused on gathering detailed insights through testing. FullSession, on the other hand, gives you all the tools you need to understand user behavior from a more holistic perspective. Here are other notable features:
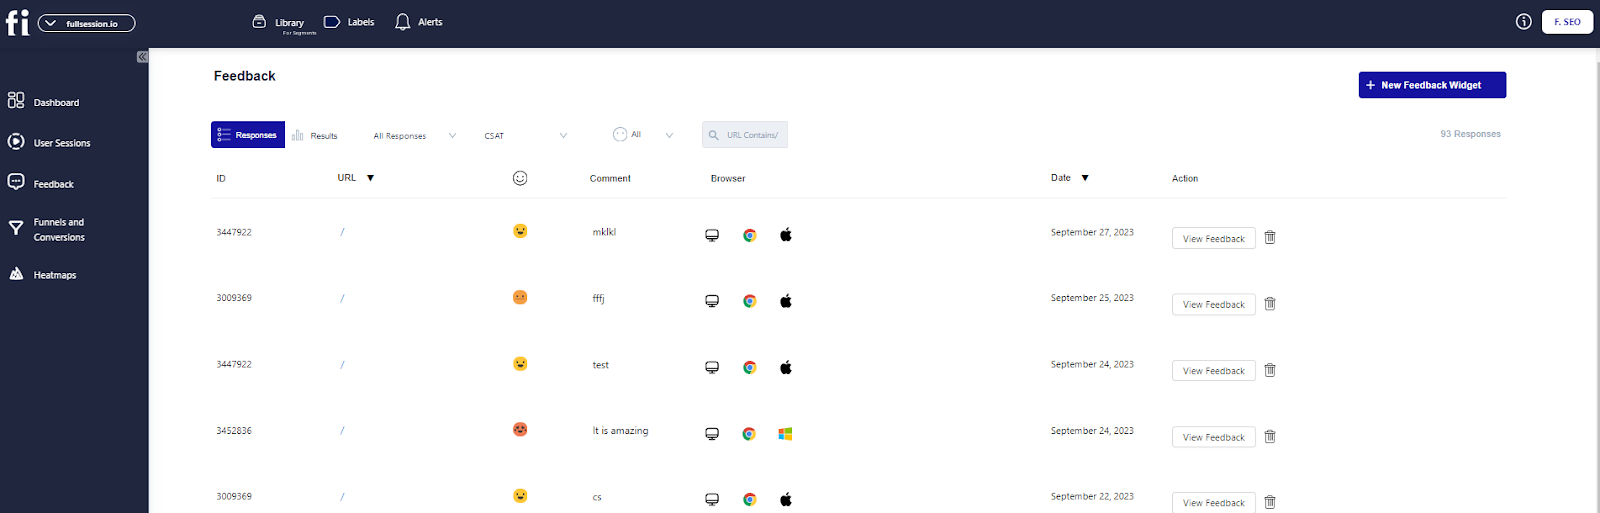
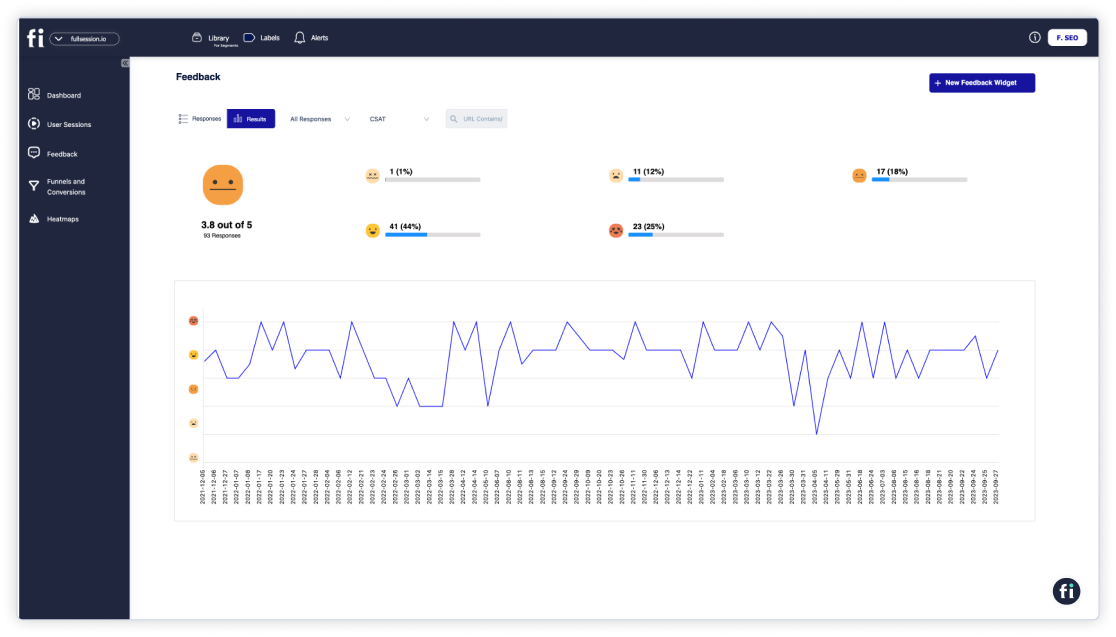
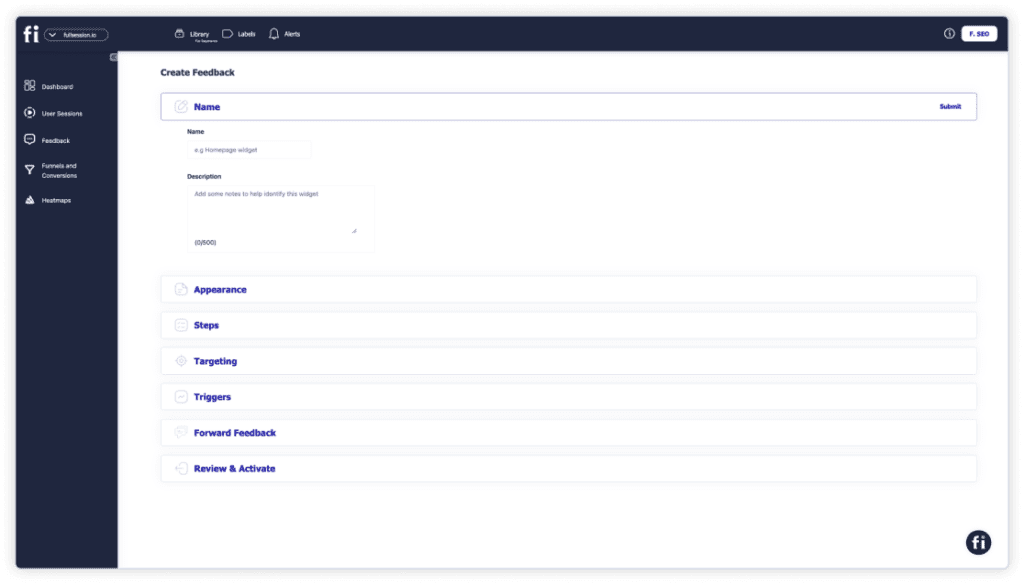
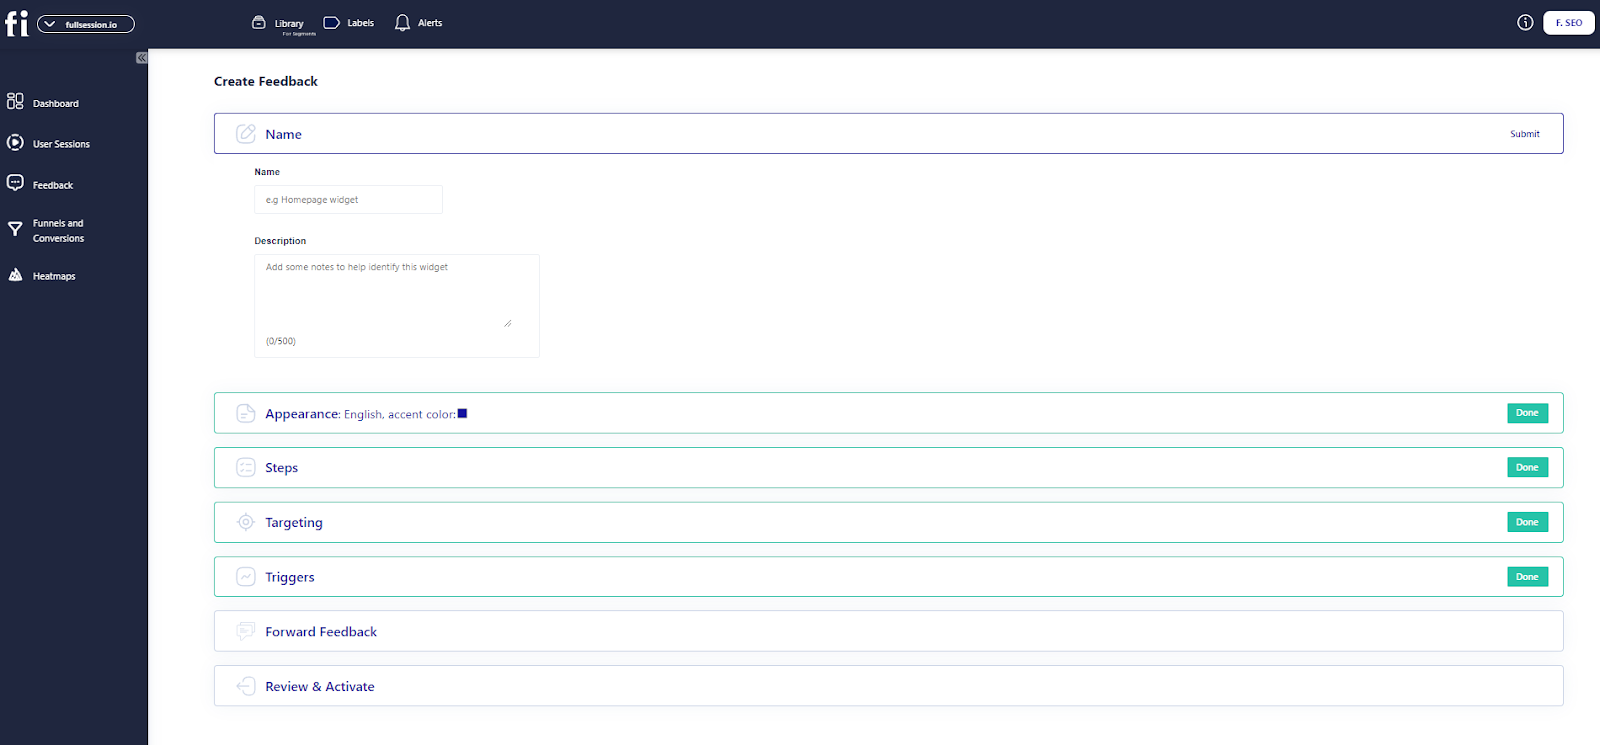
Customer feedback
You can use our software to ask your participants what problems they have and what frustrates them.
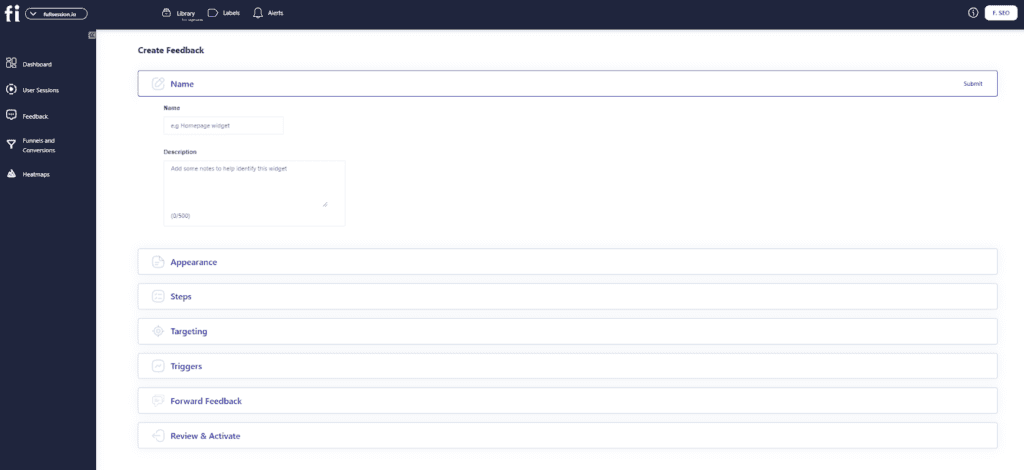
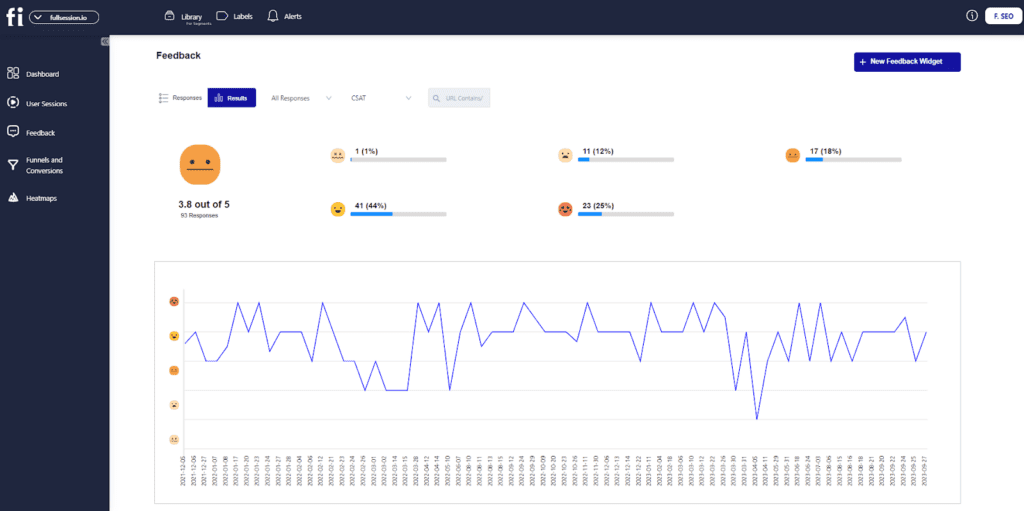
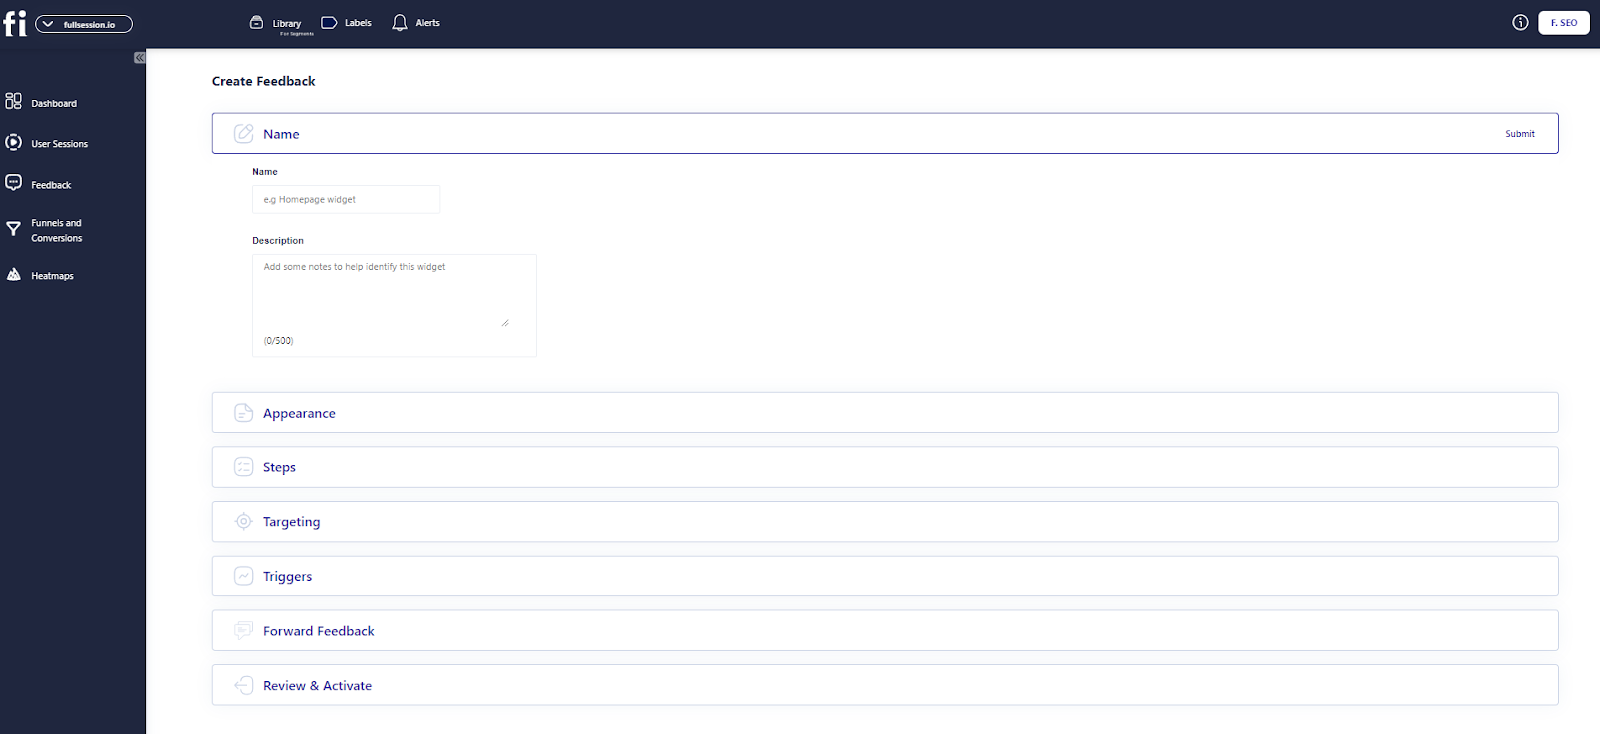
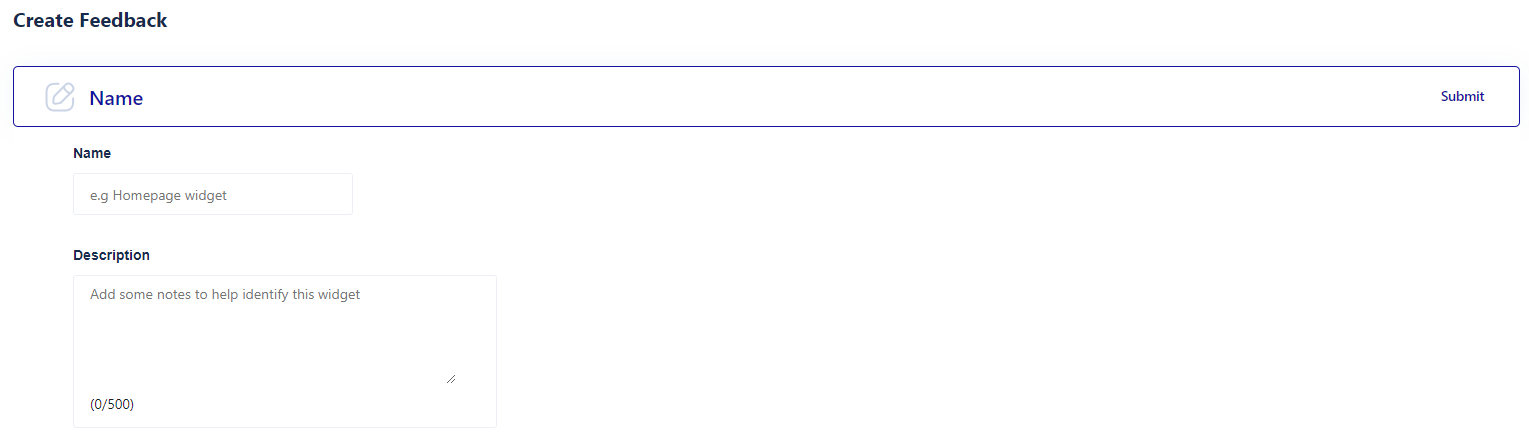
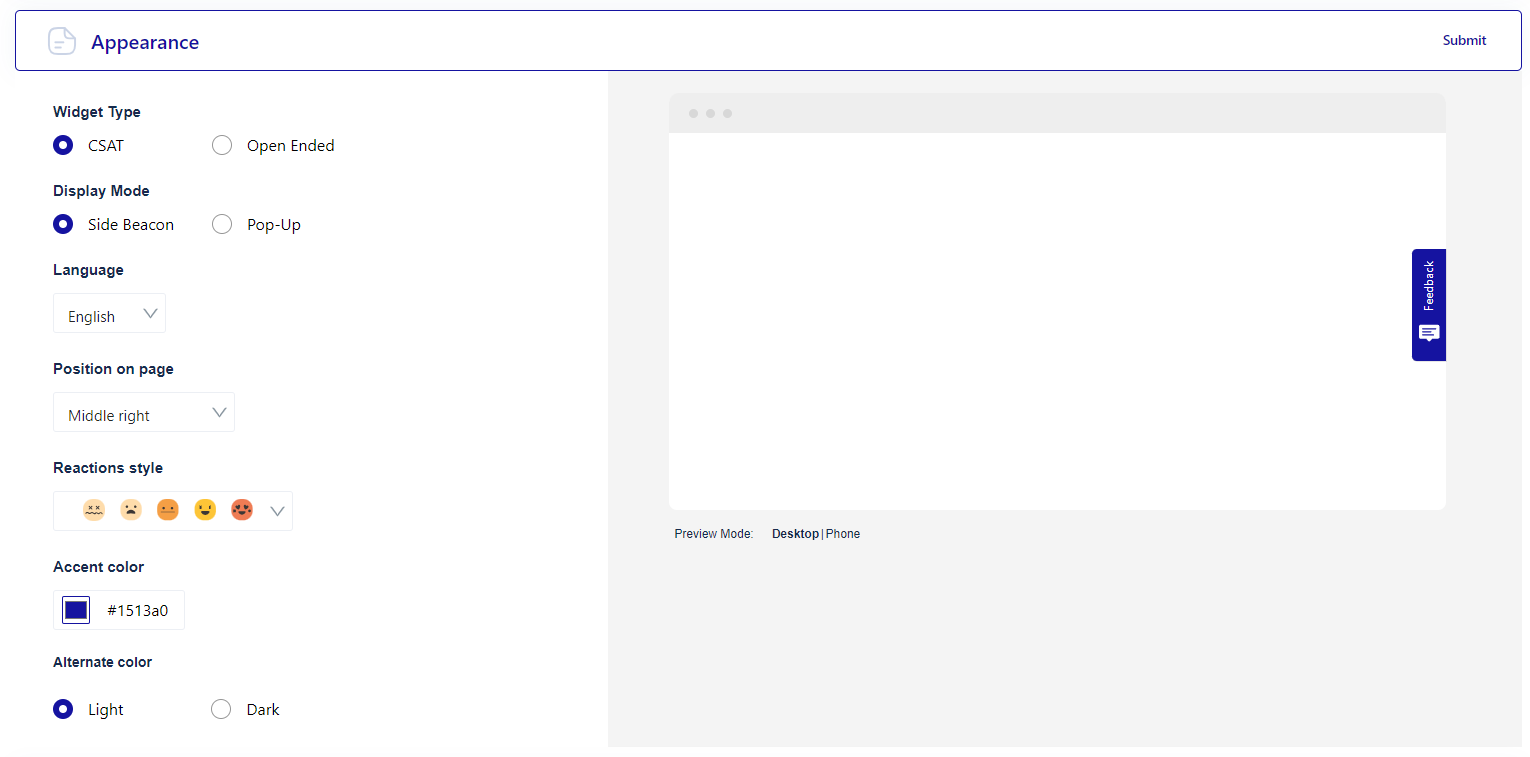
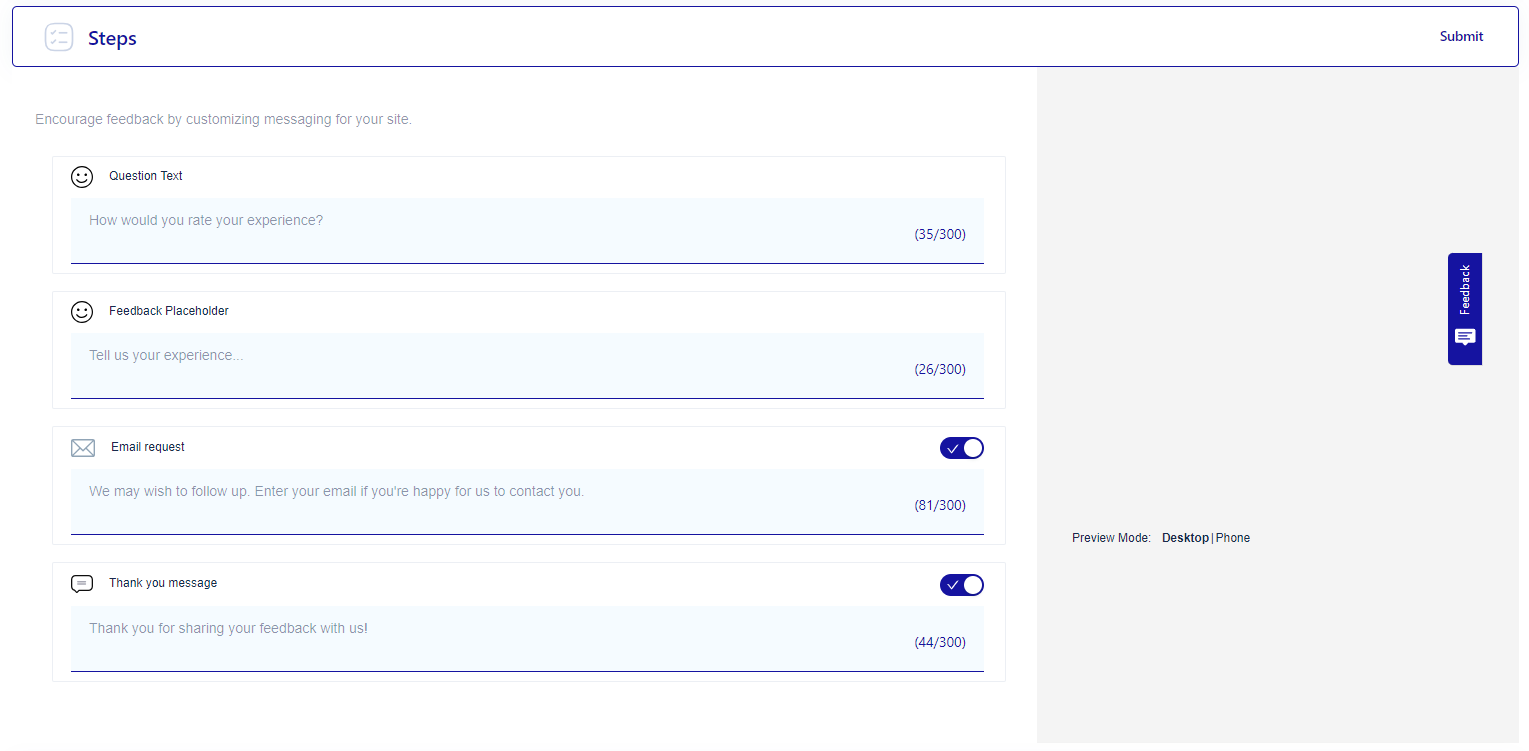
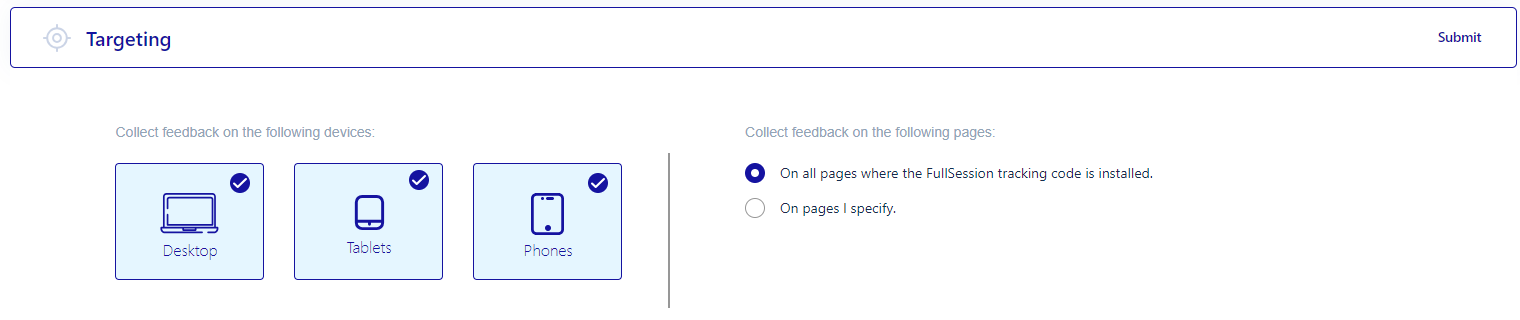
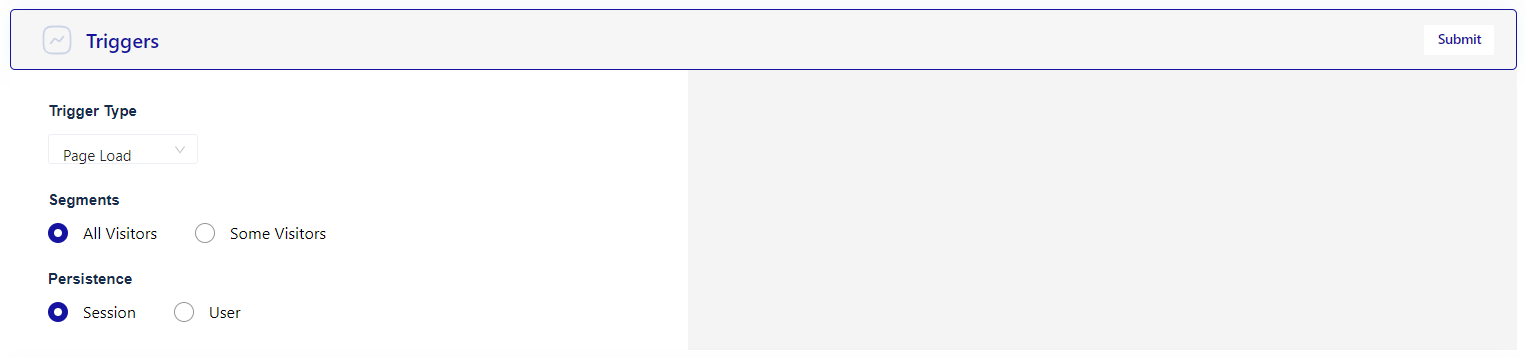
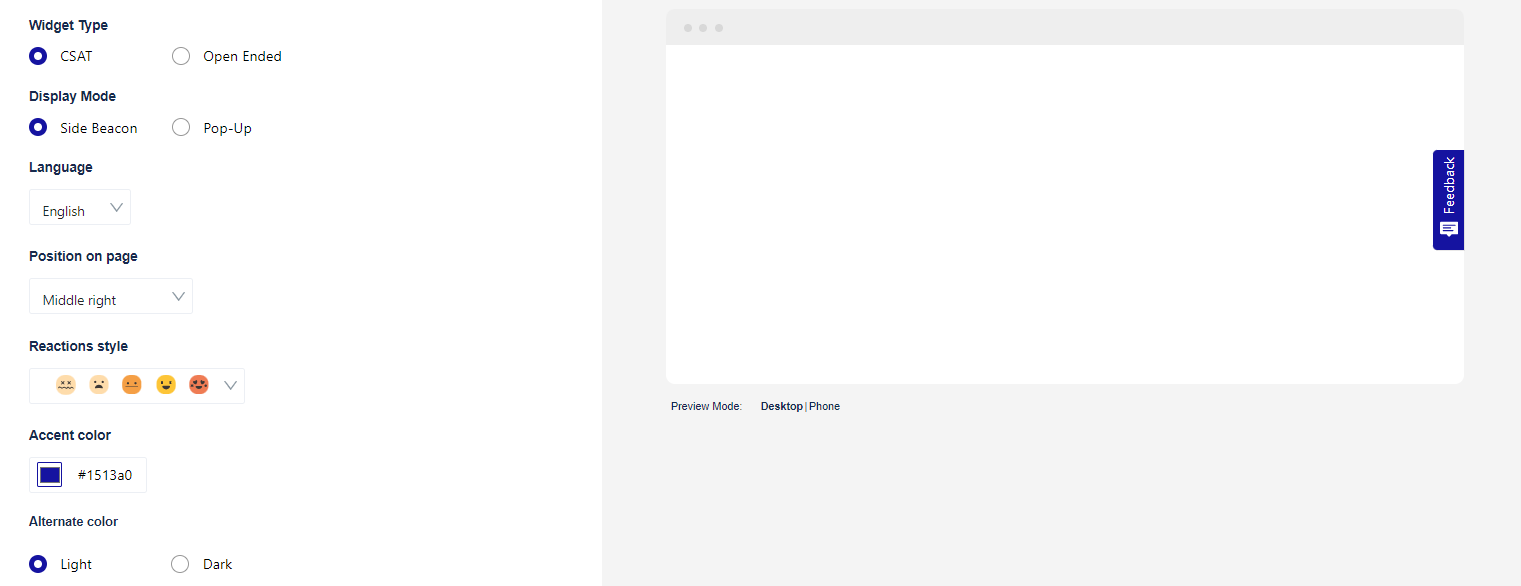
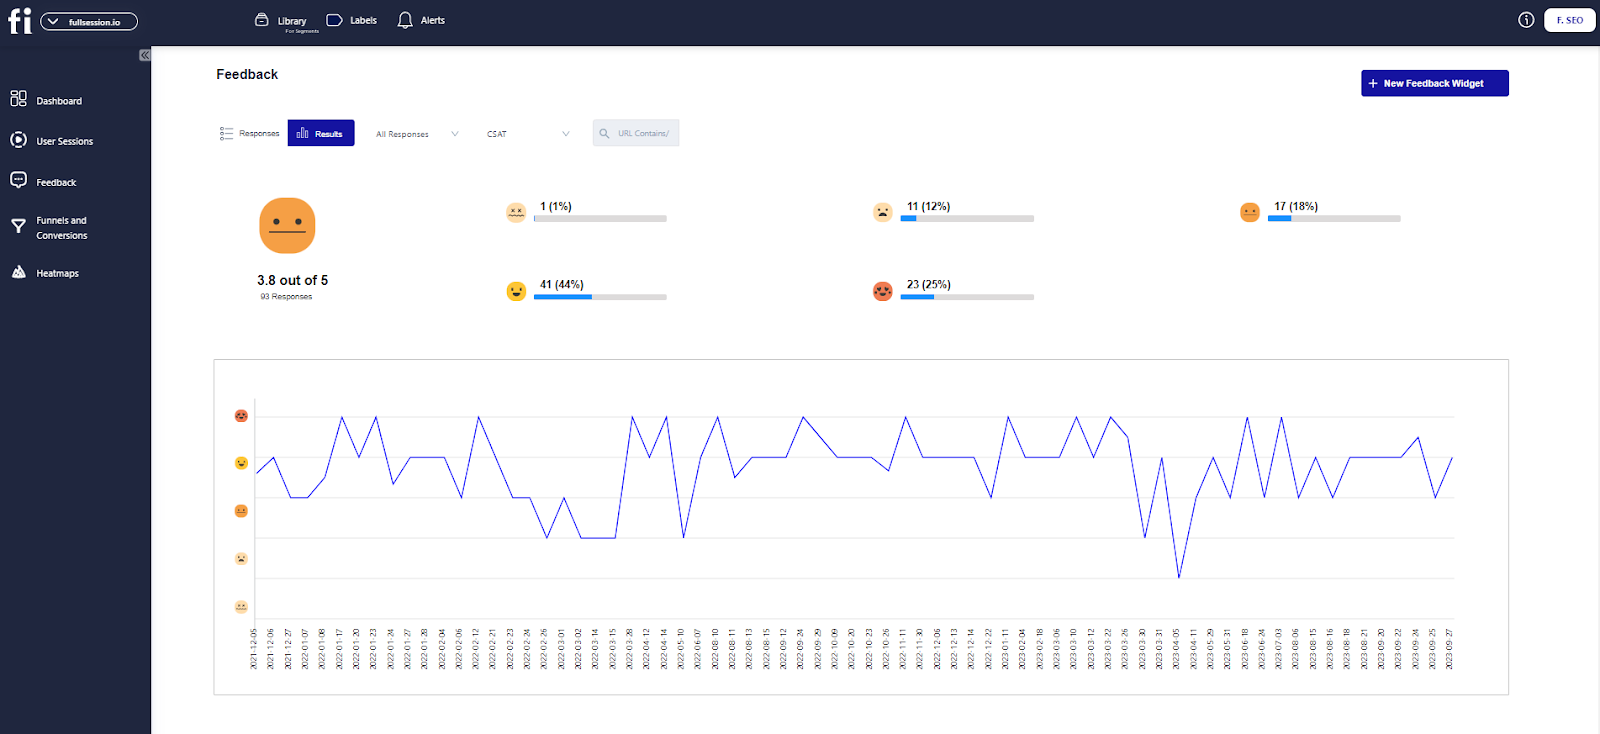
FullSession offers on-page surveys. You can customize branding elements and add questions such as open-ended, multiple-choice questions, etc. The FullSession interactive feedback widget also includes a scoring scale.

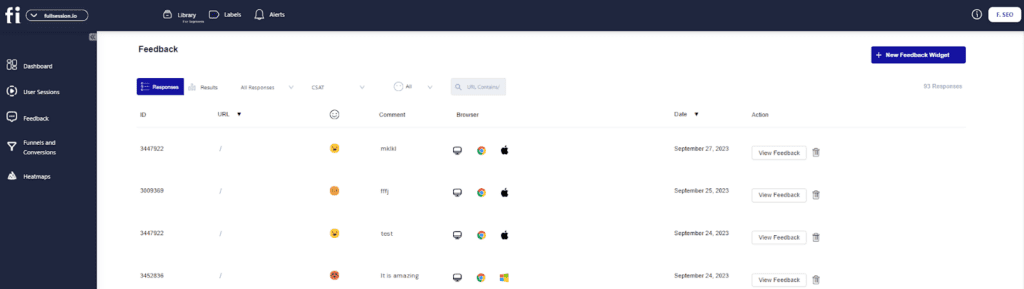
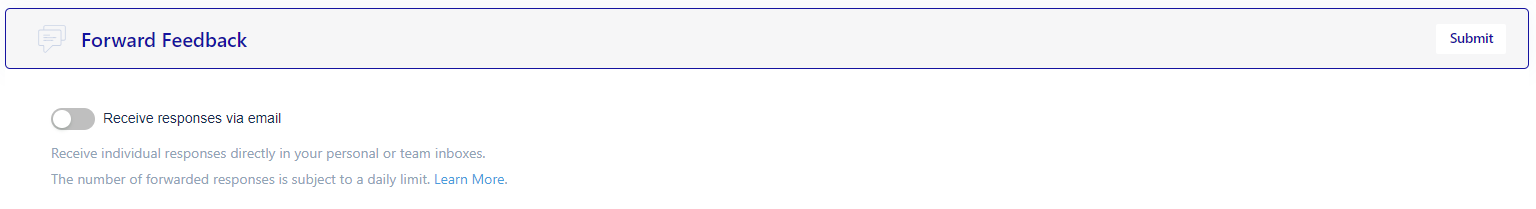
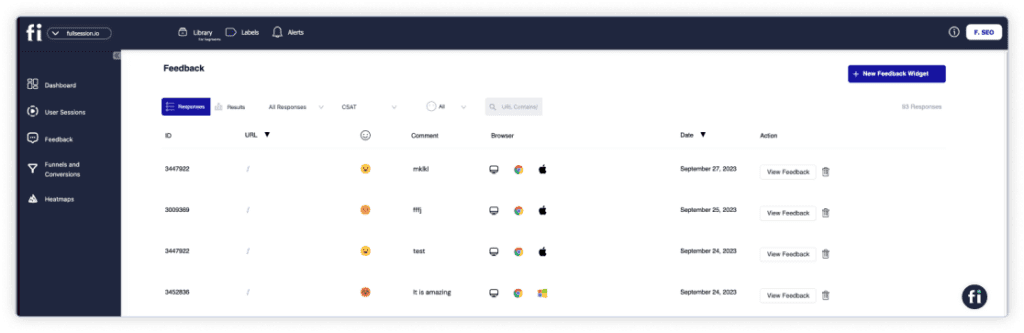
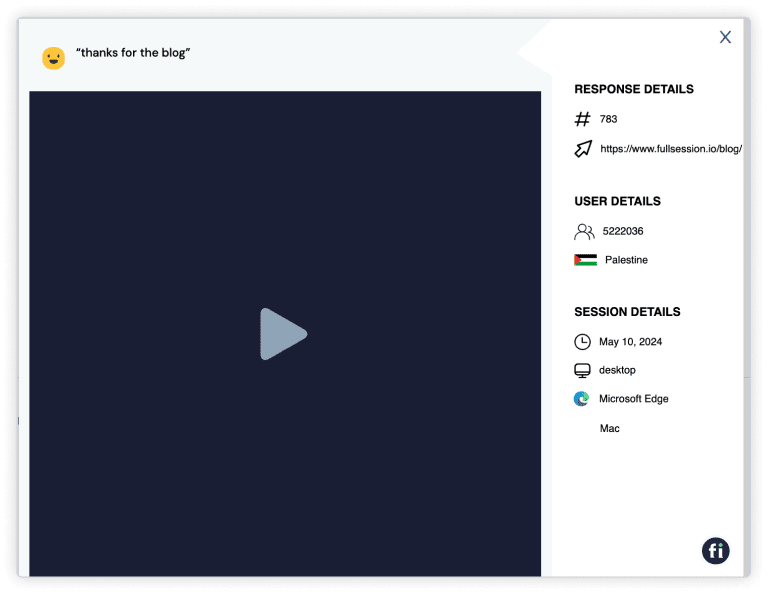
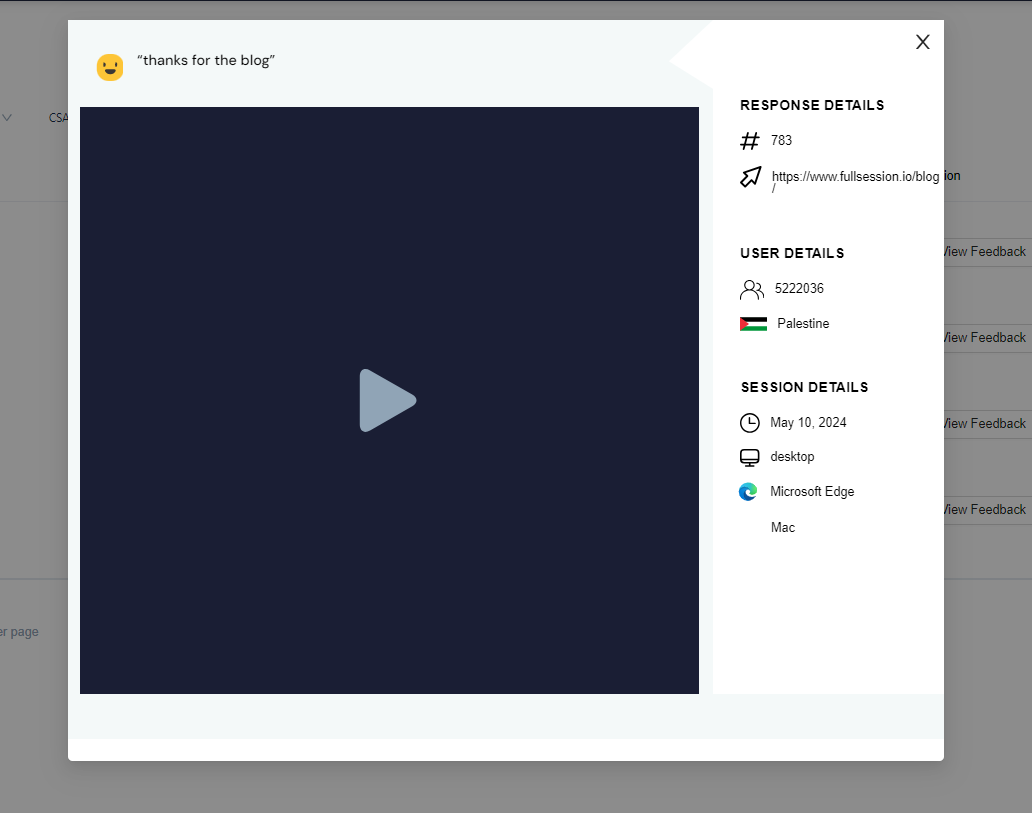
Our customer feedback widget allows you to gather data and analyze individual feedback by replaying user sessions to see how users’ words relate to their actions.
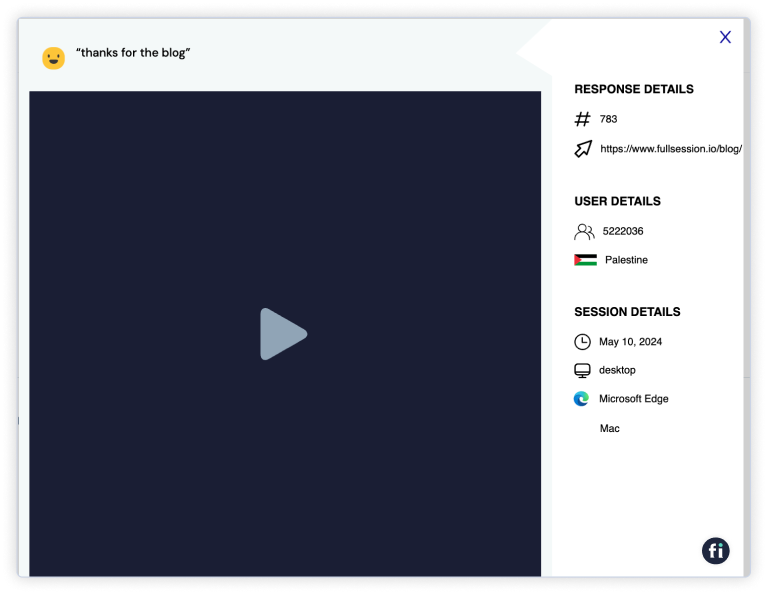
Thanks to the FullSession search options, you can always jump to a specific session recording to get more details. This allows you to fix these issues and improve the customer experience.
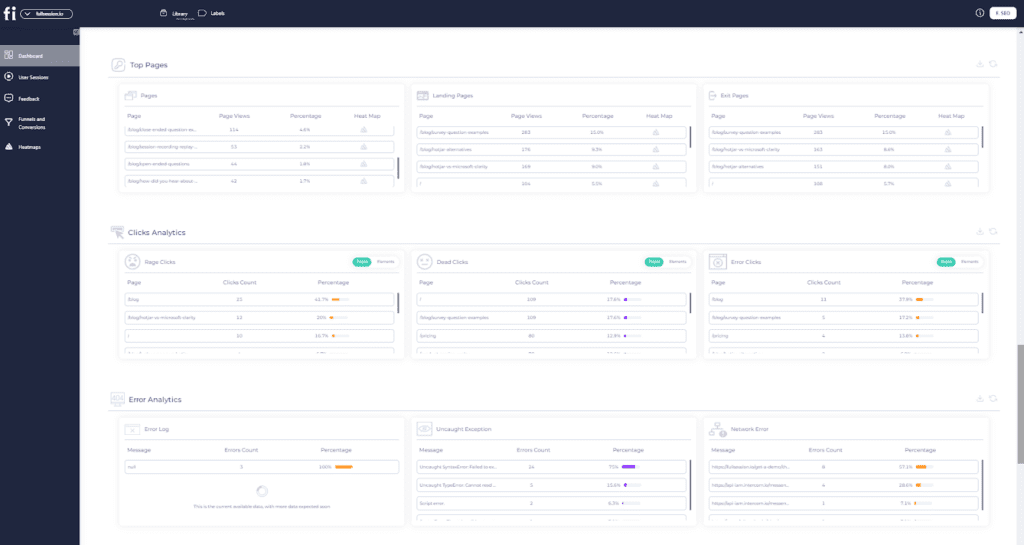
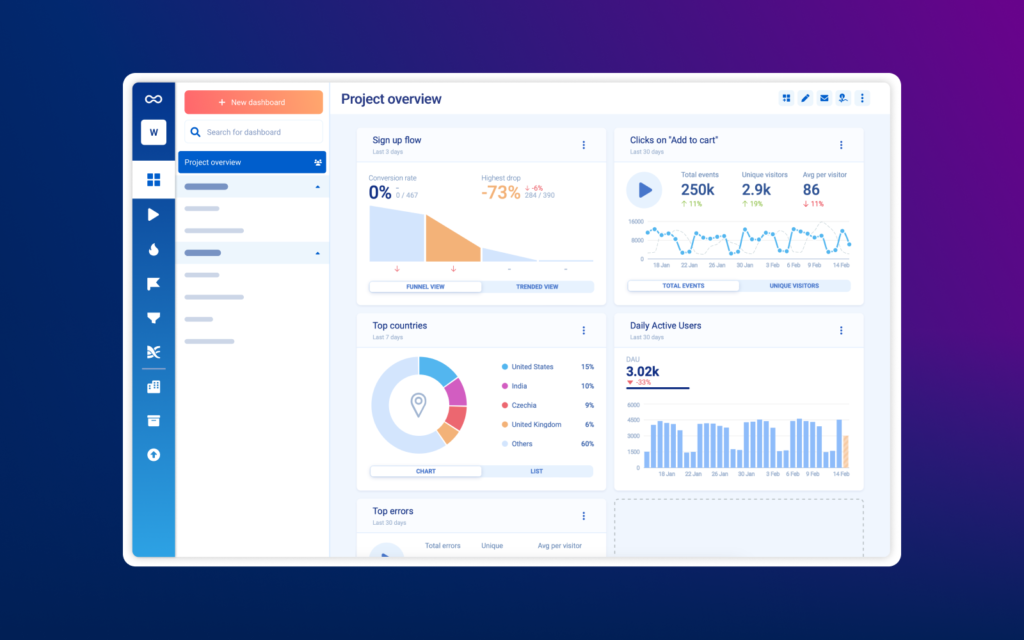
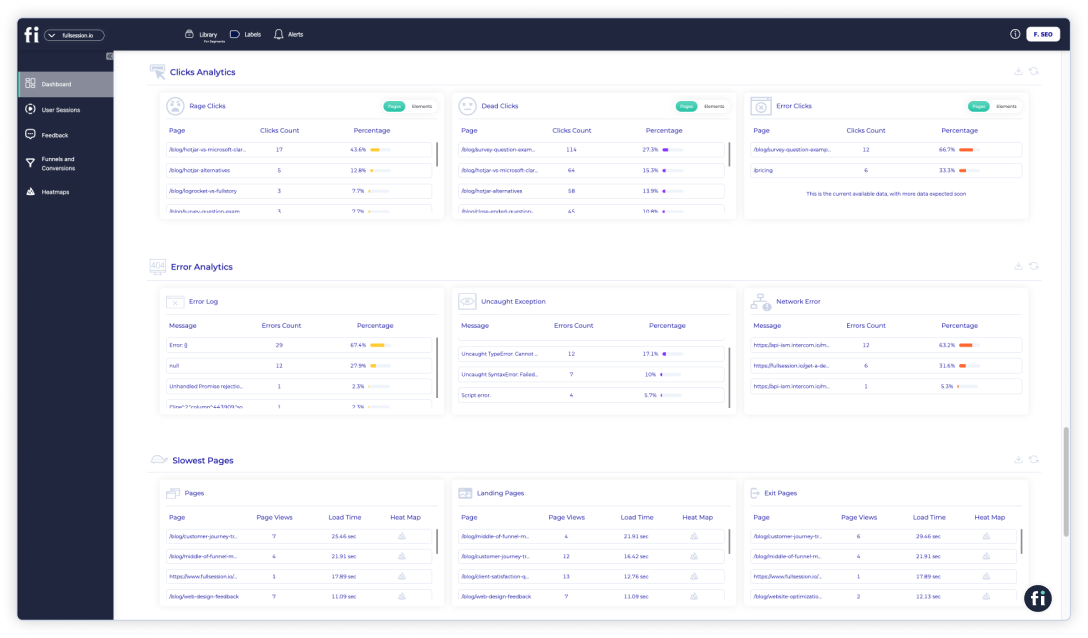
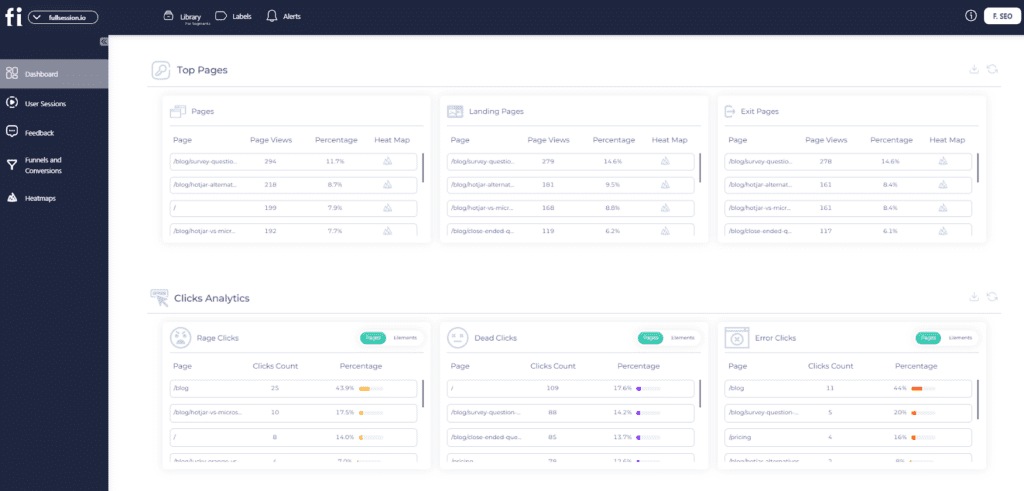
Insights
FullSession will give you insights that provide a comprehensive analysis of the visitors’ behavior on your website. This feature will allow you to detect any friction points that may cause problems. As a result, you’ll be able to reduce unnecessary funnel dropouts and positively affect conversion rates.
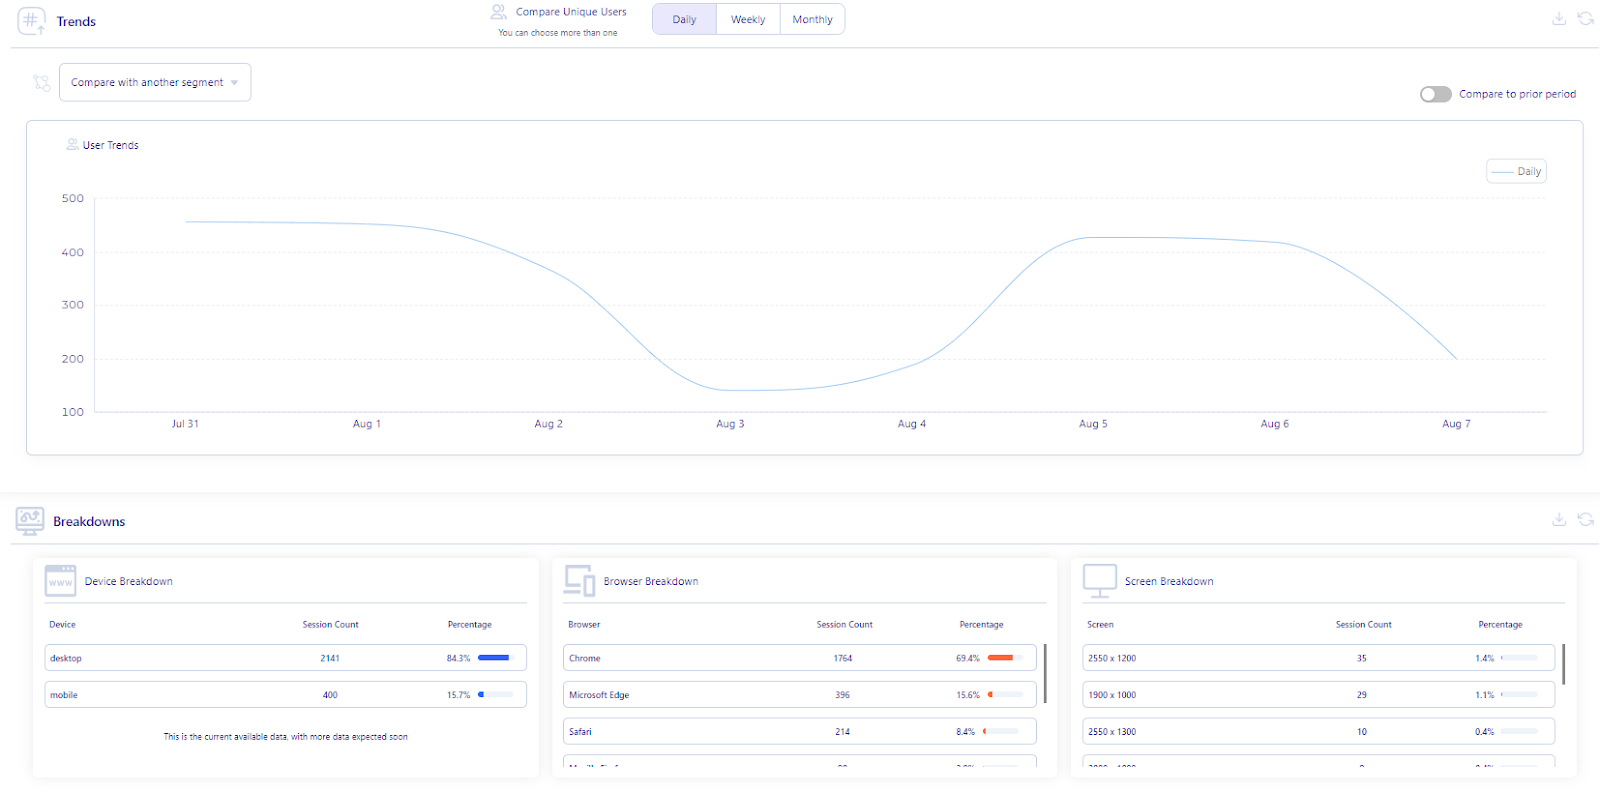
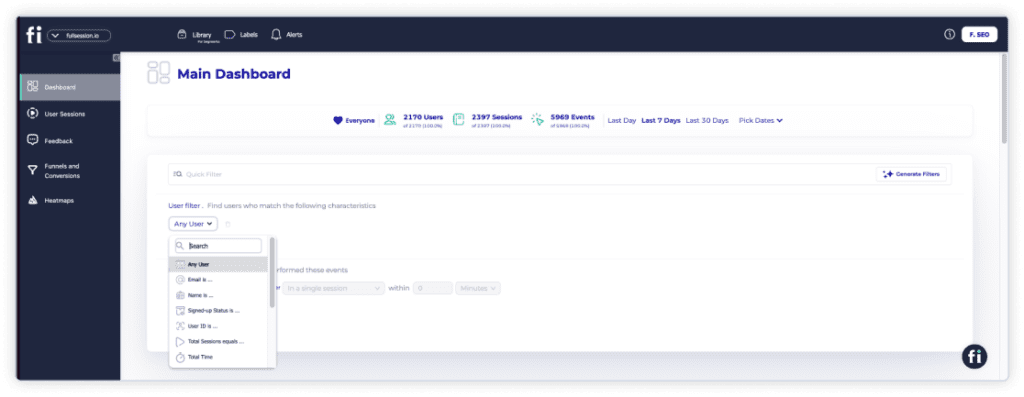
You can access the essential data directly from the dashboard. Customer insights are divided into three categories:
User engagement
- Median scroll depth by device
- Page load speed by browser
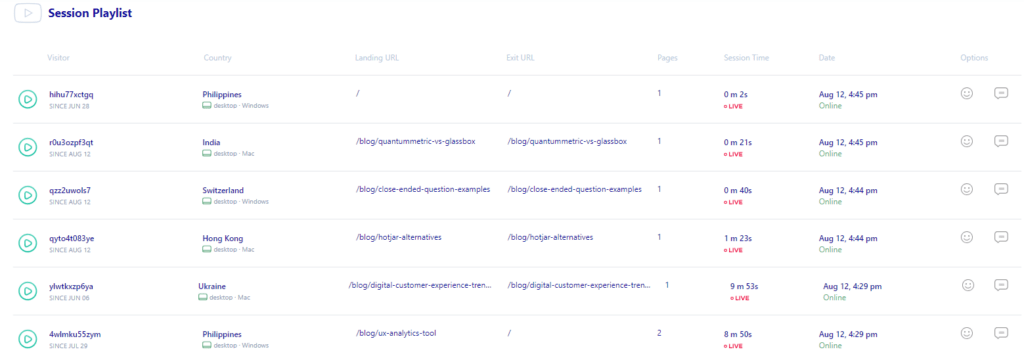
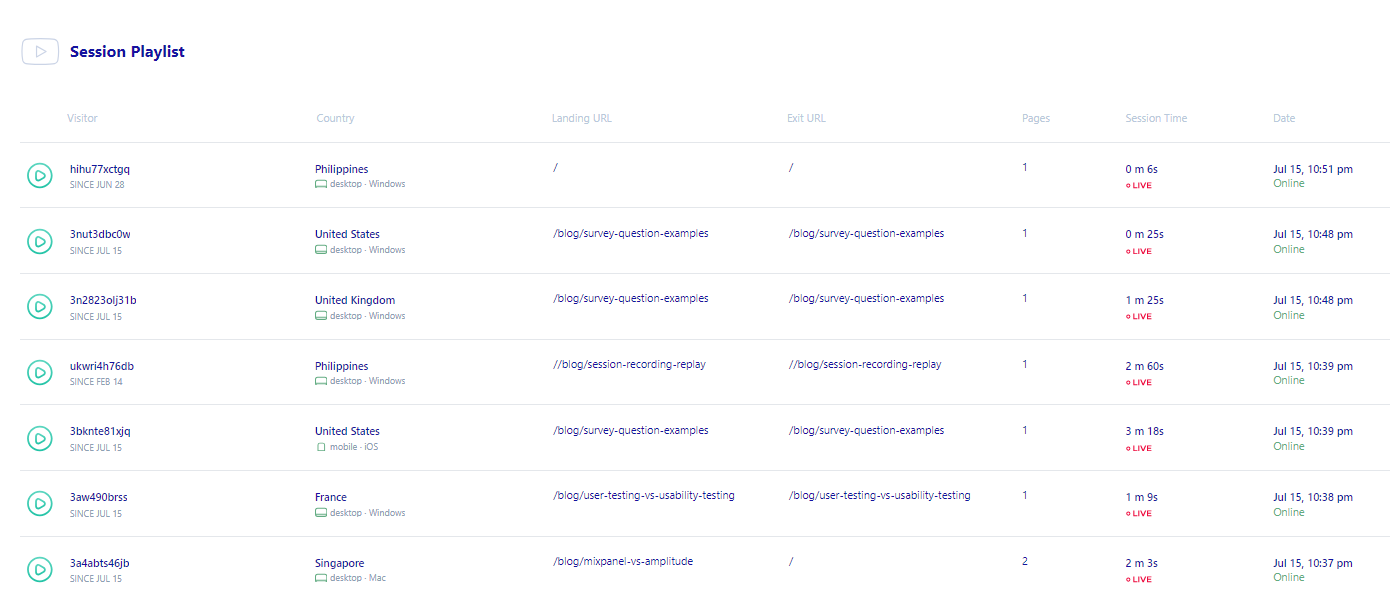
- Session playlist
- Top users
- User trends
- Breakdowns (based on device, browser, and screen)
User experience
- Event per session
- Session length
- Active time
- Feedback data
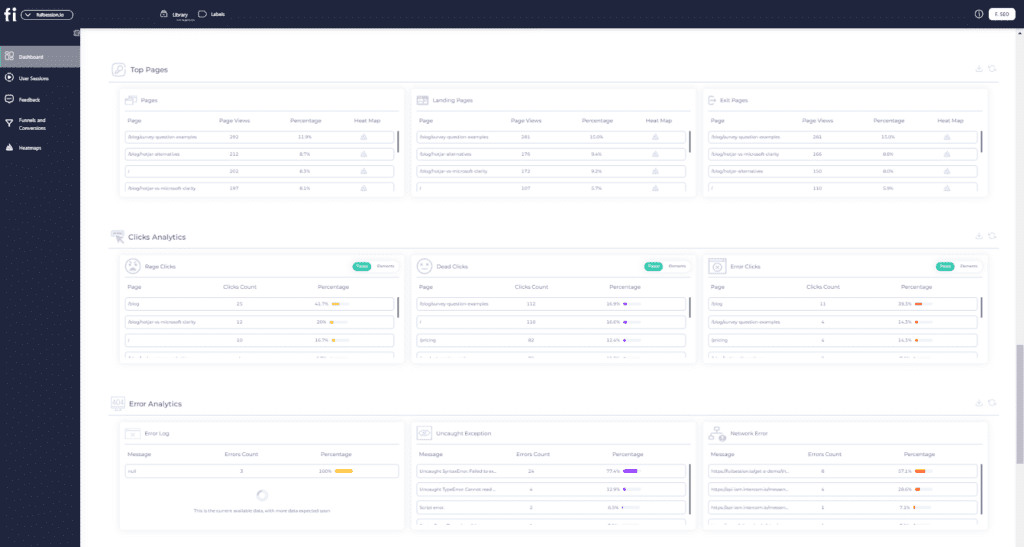
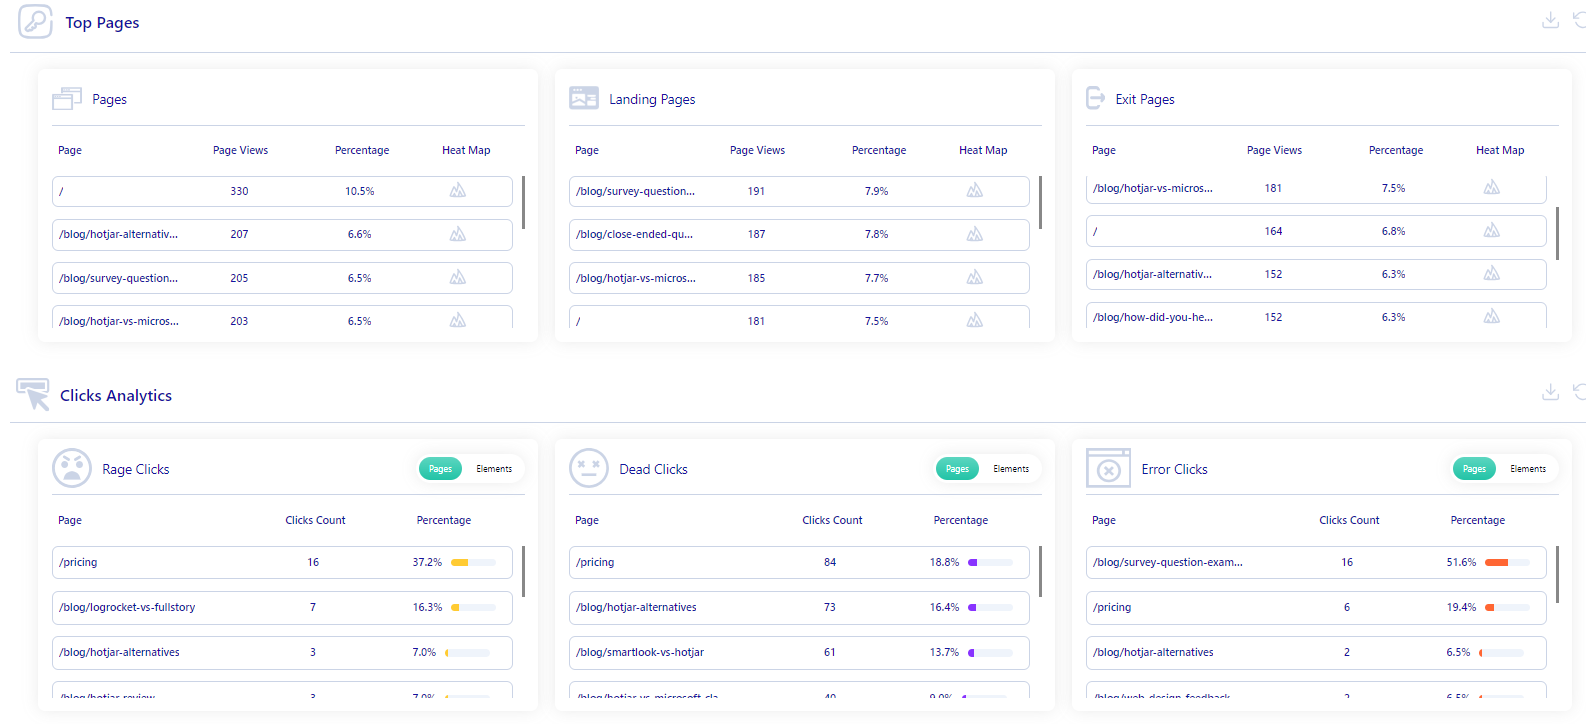
- Top pages
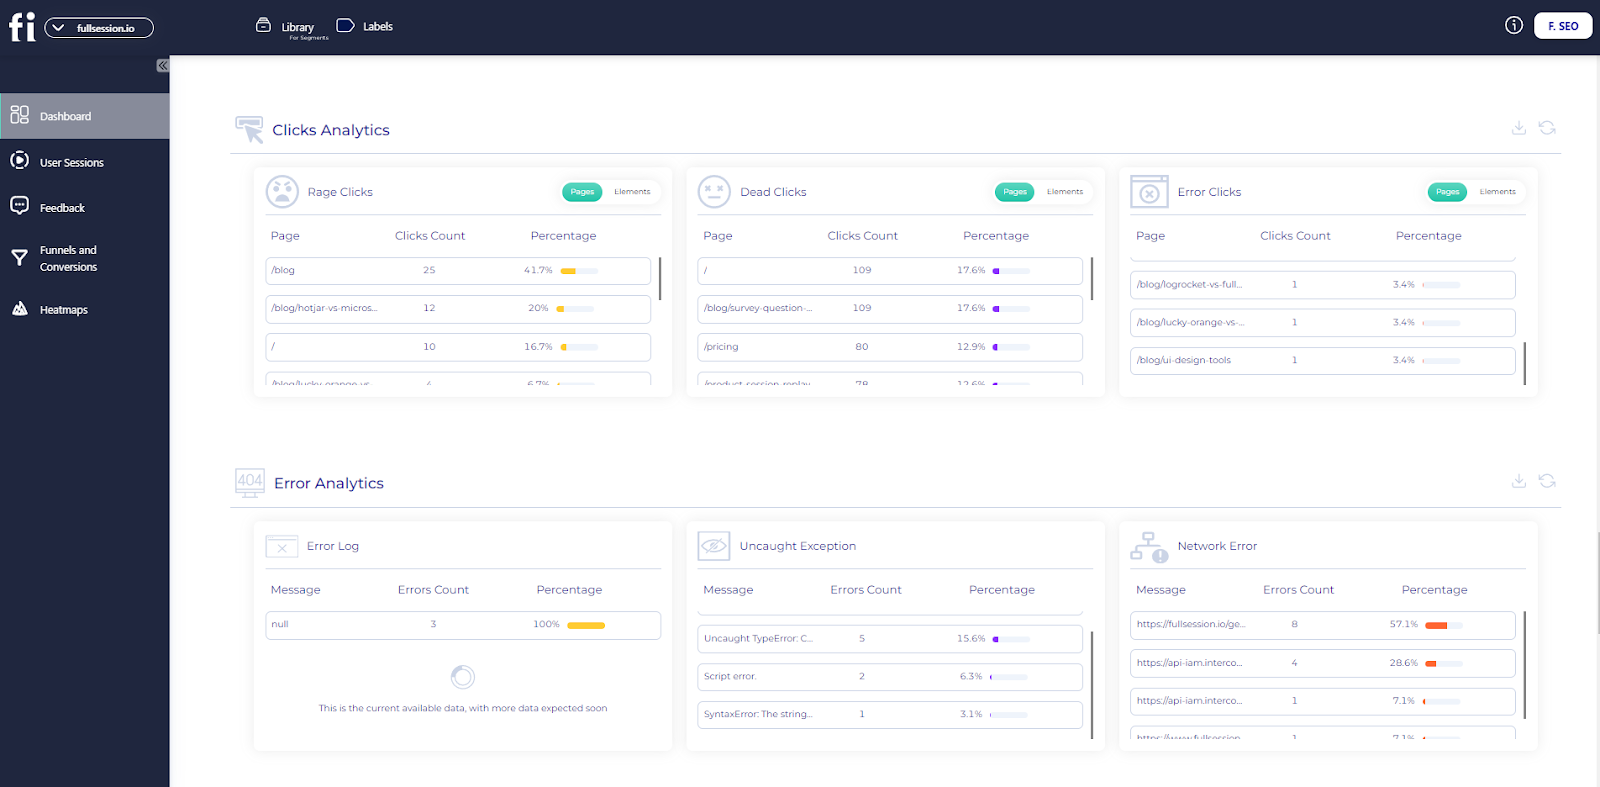
- Clicks analytics
- Error analytics
- Slowest pages (pages, landing pages, and exit pages)
Marketing channels
- UTM analytics
- Top referrers
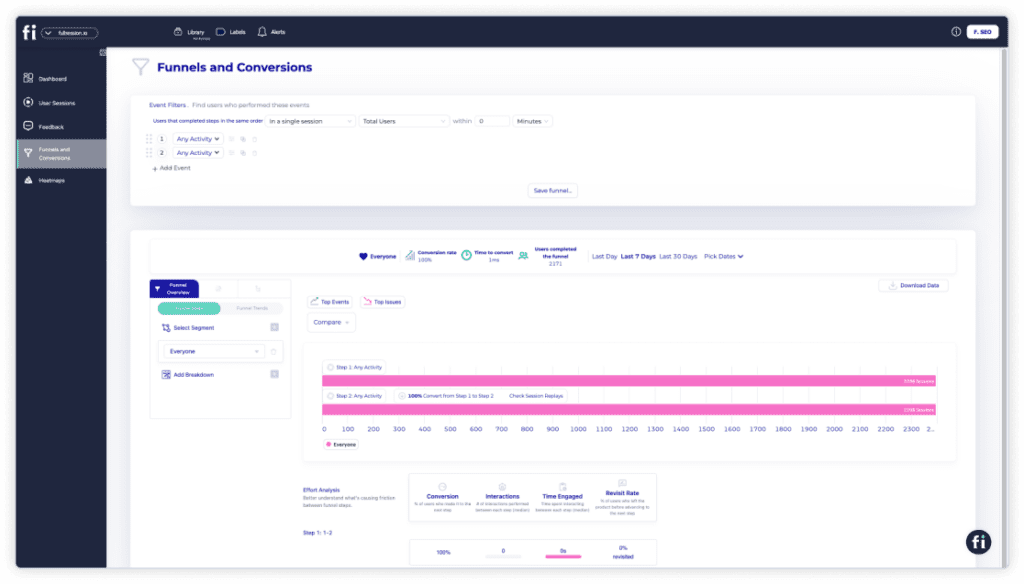
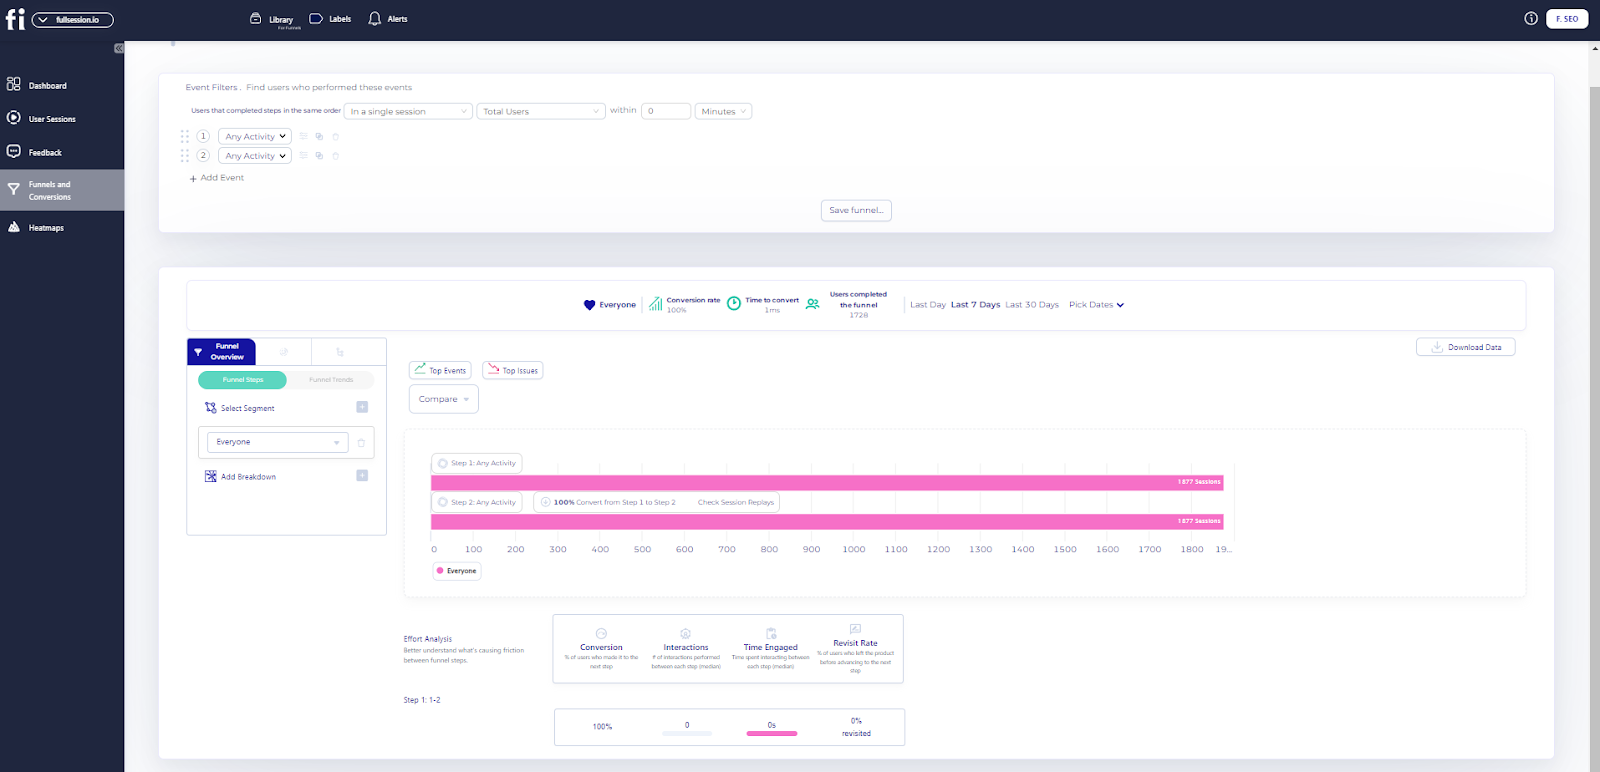
Conversion funnel analysis
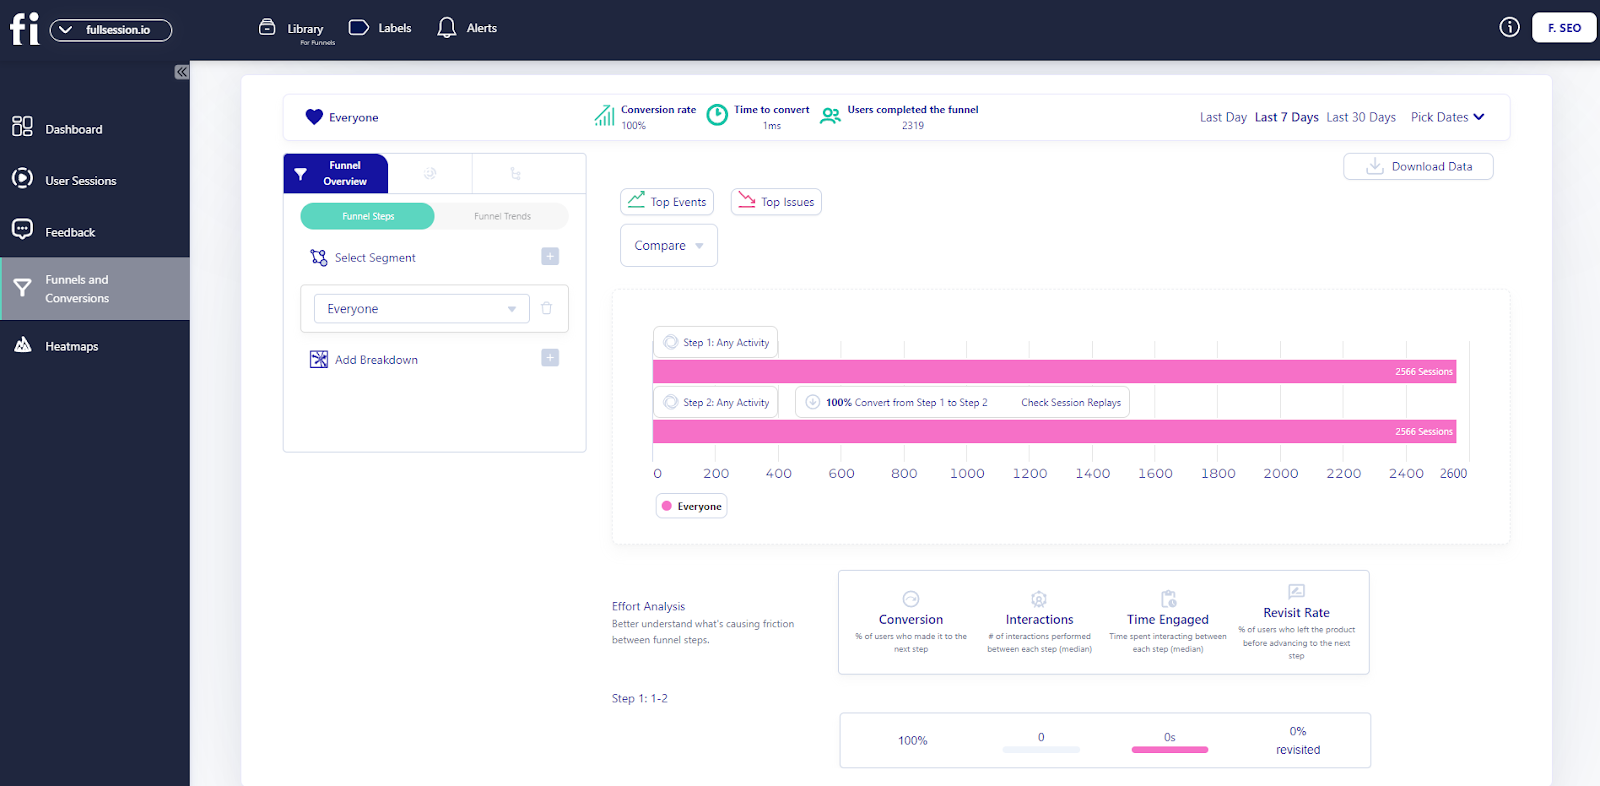
The FullSession funnels and conversions feature is like having a magnifying glass on your user journey. It helps you see how users move through your funnel, where they’re dropping off, and which steps drive conversions.
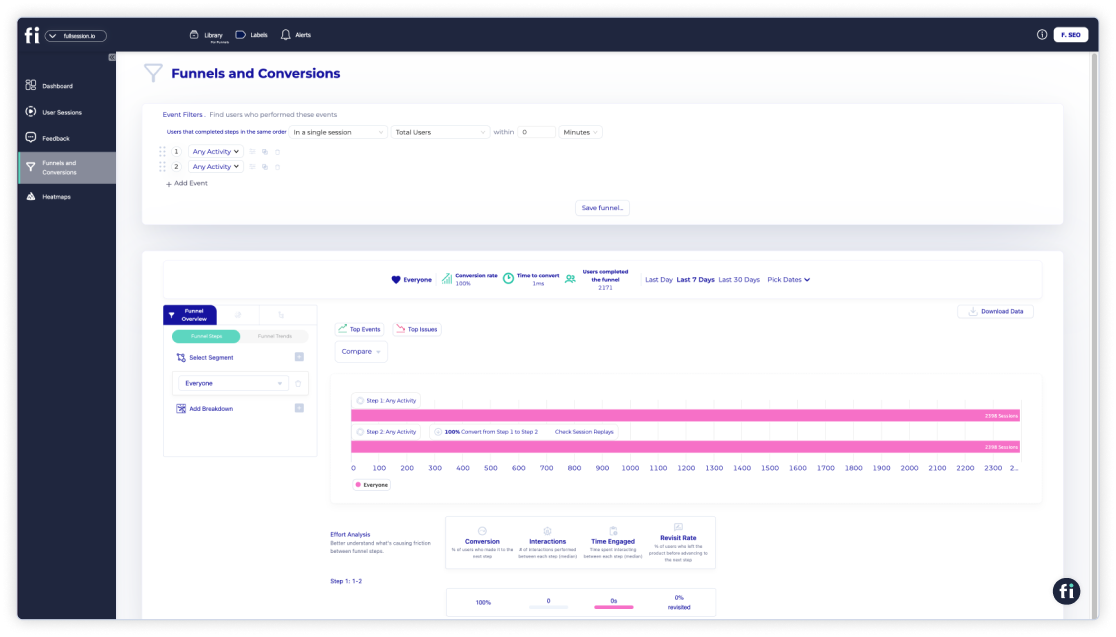
You can dive into trends over time, spot what’s working, and fix what’s not. Plus, it breaks down performance by user segments so you can tailor your strategies. Whether you’re tracking engagement or comparing time periods, this tool helps you fine-tune the user experience and maximize conversions.
Let’s say you’re analyzing your purchase process using the FullSession conversion funnel feature. You set up the funnel to track key steps: Product View, Add to Cart, Checkout, and Purchase Confirmation. The funnel shows how many users complete each step and where they drop off.
For instance, if many users drop off at the Checkout step, you can use session replays and error analysis to see what’s going wrong—maybe a complicated form or a payment issue. Identifying and fixing these problems can reduce drop-offs and increase conversions in one test.
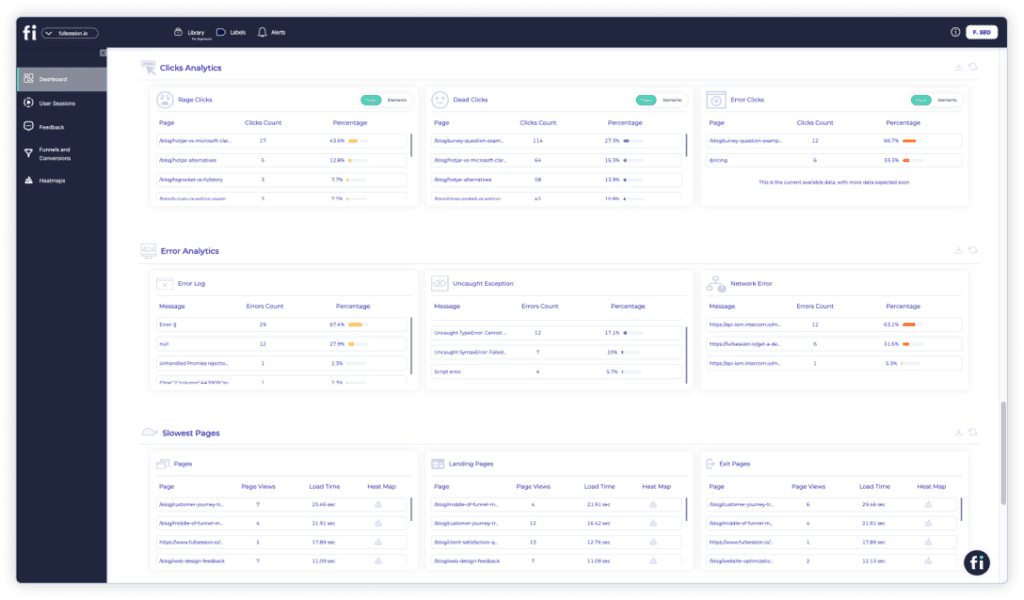
Error tracking and analysis
This feature is like your digital safety net, tracking everything from error clicks, network hiccups, and console errors to uncaught exceptions and error logs. With tools like session replays and error click maps, you can see exactly what went wrong and where.

Plus, you can monitor trends over time, segment errors by user group, and get real-time alerts via Slack, keeping your app reliable and your users happy.
Get a 360° View of User Behavior
Learn how to visualize and analyze all user interactions in one intuitive dashboard.
UserZoom vs UserTesting: Languages
UserZoom is available in English, German, and Spanish languages. UserTesting supports the same languages, but it doesn’t include Spanish.
FullSession is available in English, Arabic, and French.
UserZoom vs UserTesting: Integrations
You can integrate UserZoom and UserTesting with Slack, Jira, Trello, and more. Recent integrations also include Microsoft Entra for SSO (Single Sign-On), which facilitates secure and seamless user access.
UserTesting additionally offers integrations with Adobe XD, Google Calendar, Outlook Calendar, Qualtrics, and more.
Thanks to open APIs and modern webhooks, FullSession integrates with major third-party tools, including Wix, WordPress, BigCommerce, and Shopify.
UserZoom vs UserTesting: Support
The UserZoom website has a help center. The company also offers a UserZoom Academy, a collection of helpful articles about UX testing. You can contact UserZoom via phone or email.
UserTesting offers a customer help section. You can contact the company via phone, e-mail, Twitter, Facebook, LinkedIn, and Instagram. They also provide extensive support resources, including a knowledge base, community forums, and UserTesting University for training and development.
FullSession offers top-notch customer support to help you get the most out of the platform. Whether you’re just starting or need help with advanced features, their team is available via live chat, email, and a detailed knowledge base.
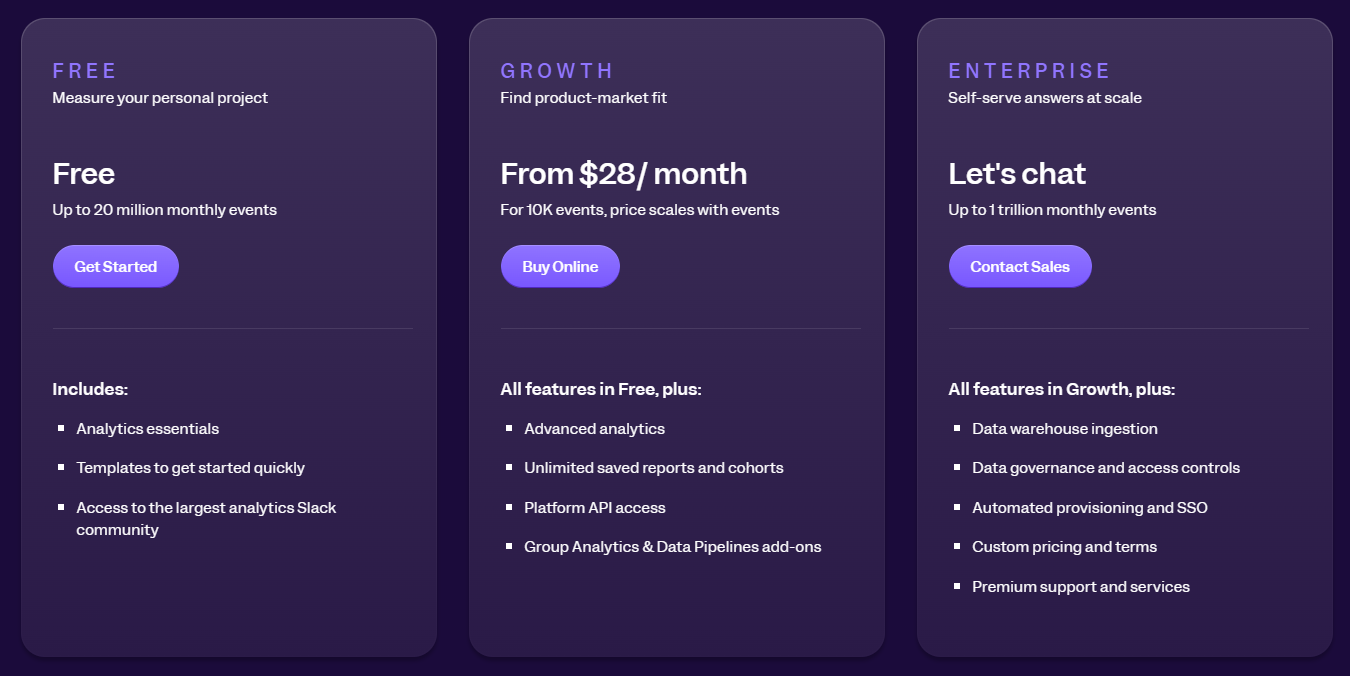
UserZoom vs UserTesting: Pricing
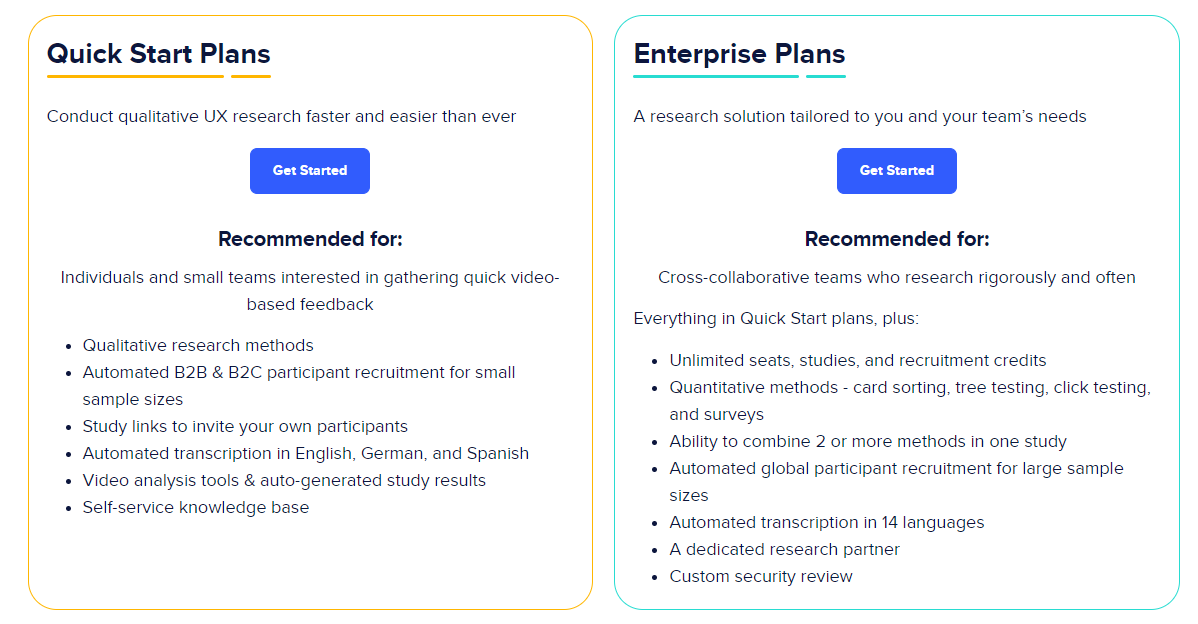
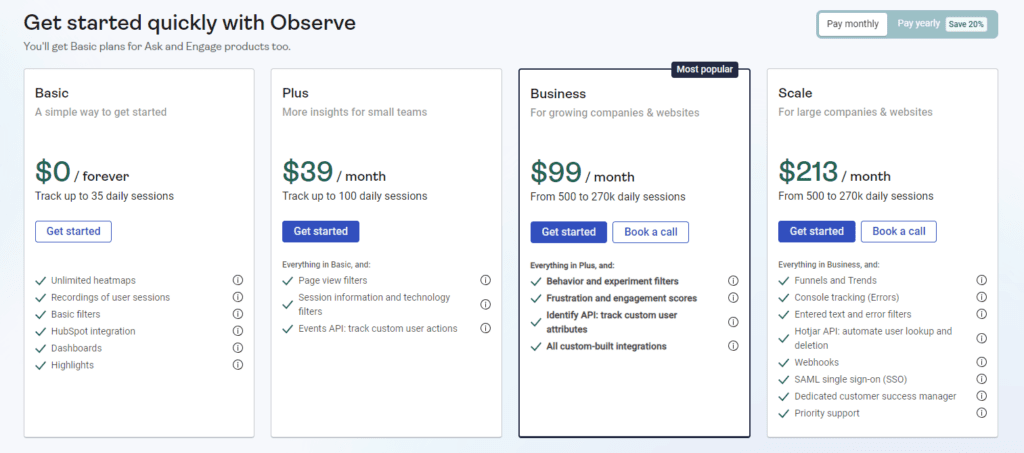
UserZoom offers two basic plans: Quick Start and Enterprise. The first one is best for individuals and small teams. Features include qualitative research methods, automated transcription, video analysis tools, and self-service knowledge base.
The second option is designed for cross-collaborative teams. It includes all Quick Start features plus quantitative methods (card sorting, tree testing, click testing, surveys), global participant recruitment, a dedicated research partner, and advanced security options.
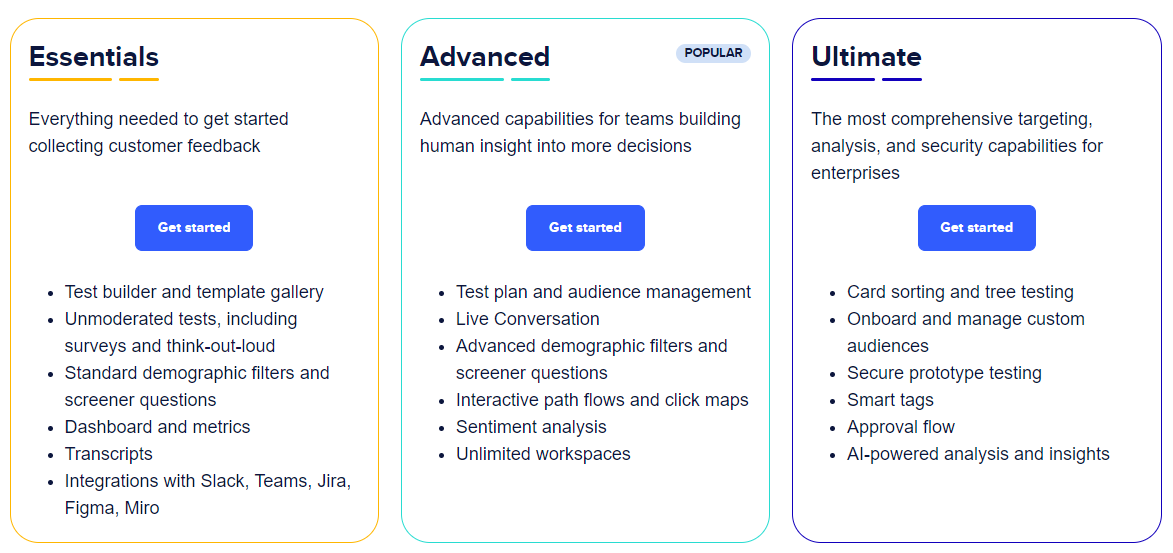
UserTesting offers three subscription tiers:
- Essentials: Provides access to basic features suitable for collecting user feedback.
- Advanced: Includes more tools for comprehensive test creation and research, such as mobile testing and advanced demographic targeting.
- Ultimate: Geared towards large companies, offering high security and advanced analysis features.
Unfortunately, you’ll need to contact the companies directly to get pricing information, as it isn’t available on their websites.
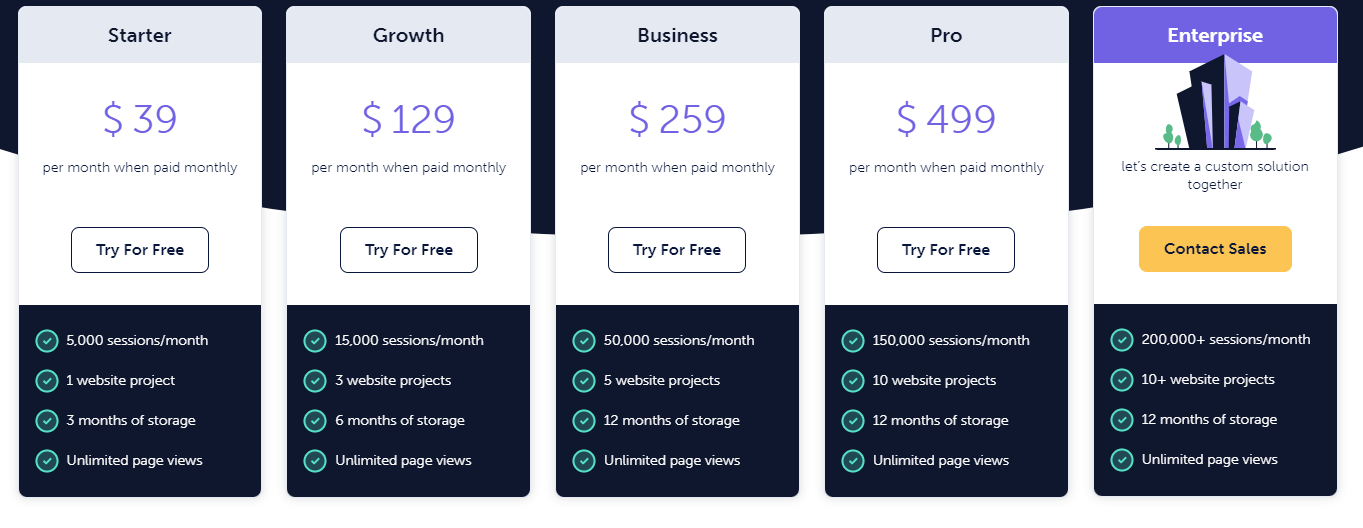
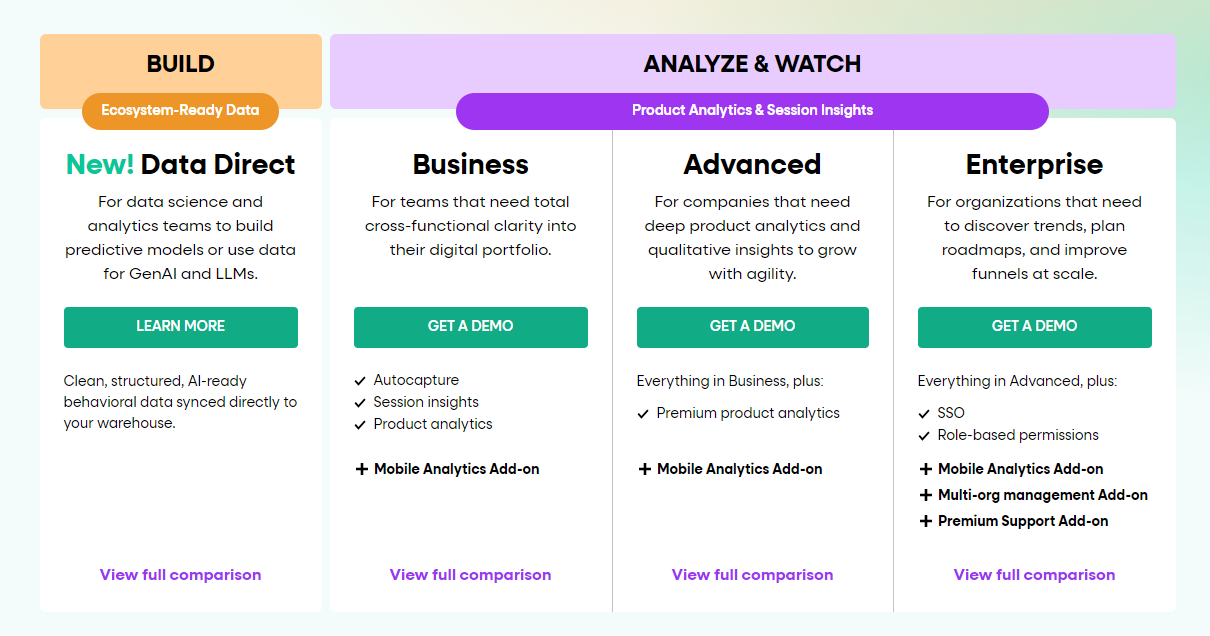
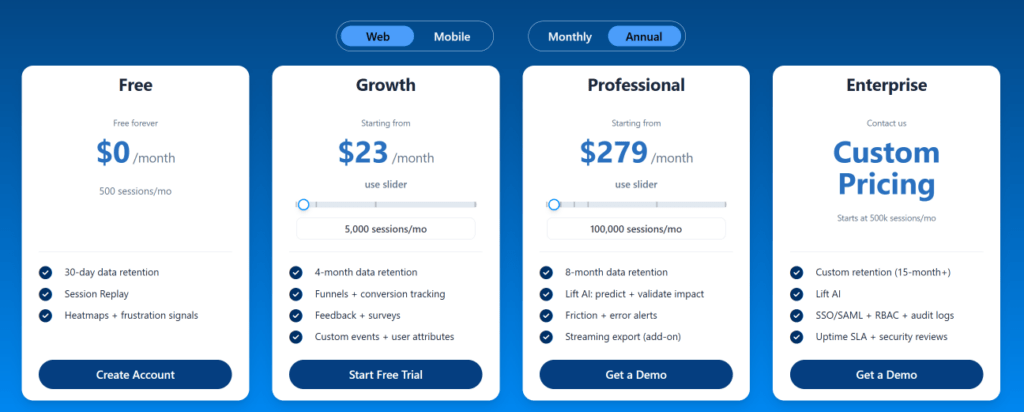
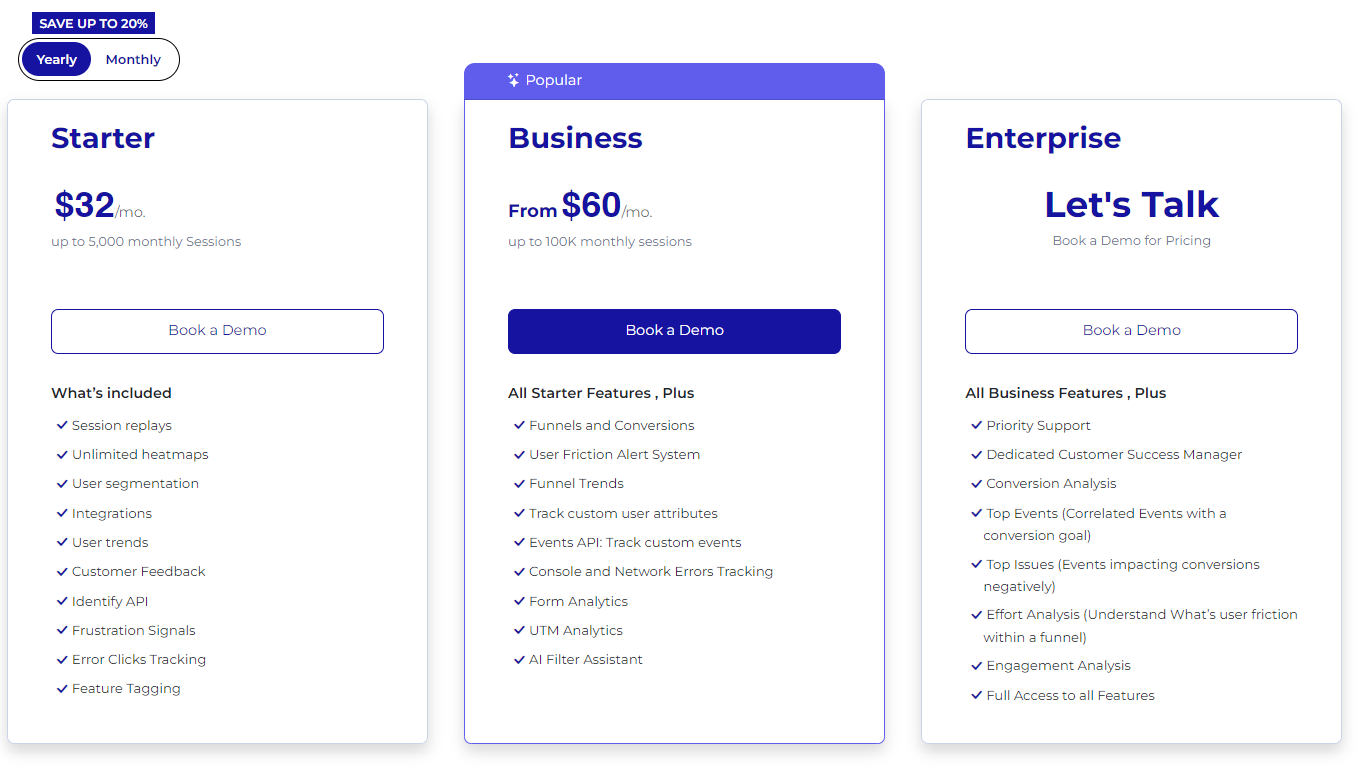
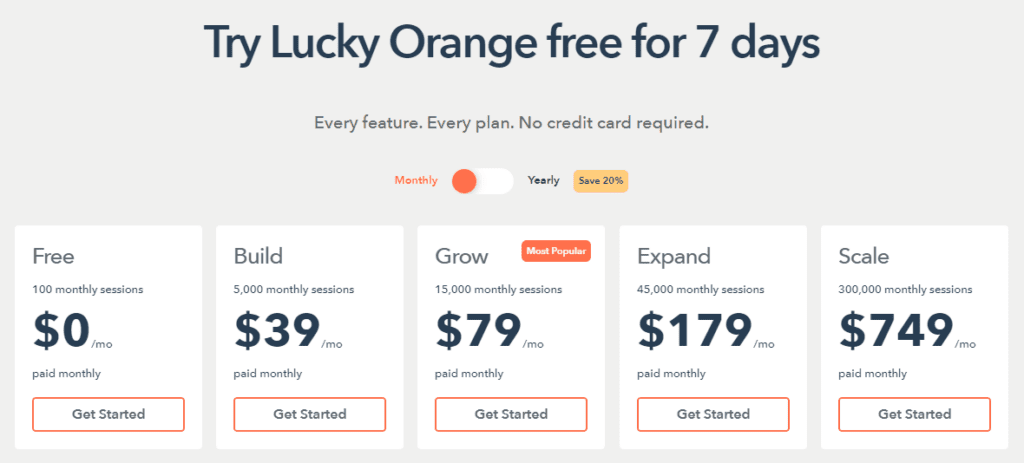
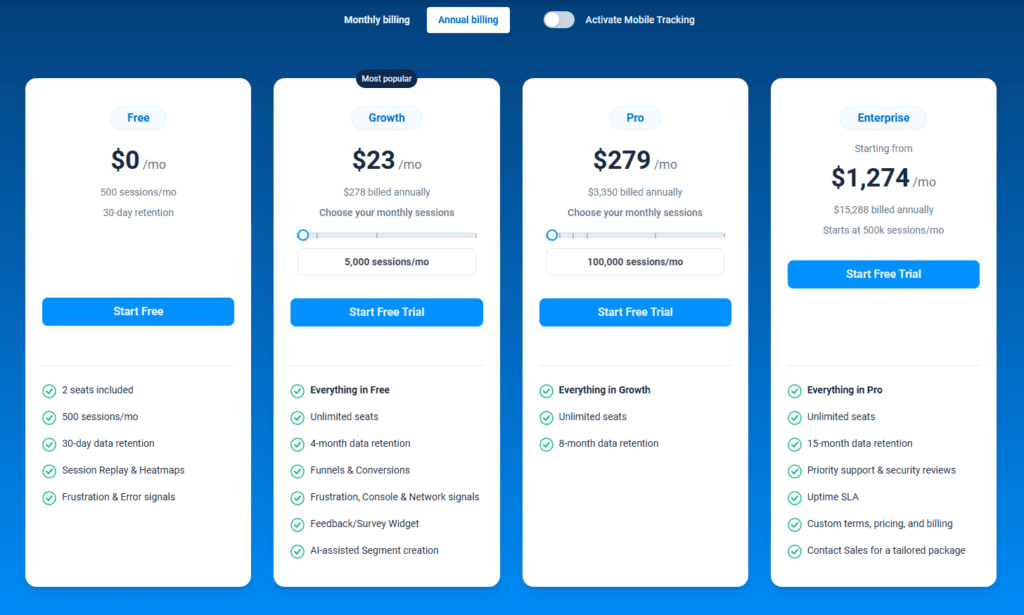
FullSession offers a 14-day free trial and three paid plans: Starter, Business, and Enterprise. A yearly subscription can save you up to 20%!
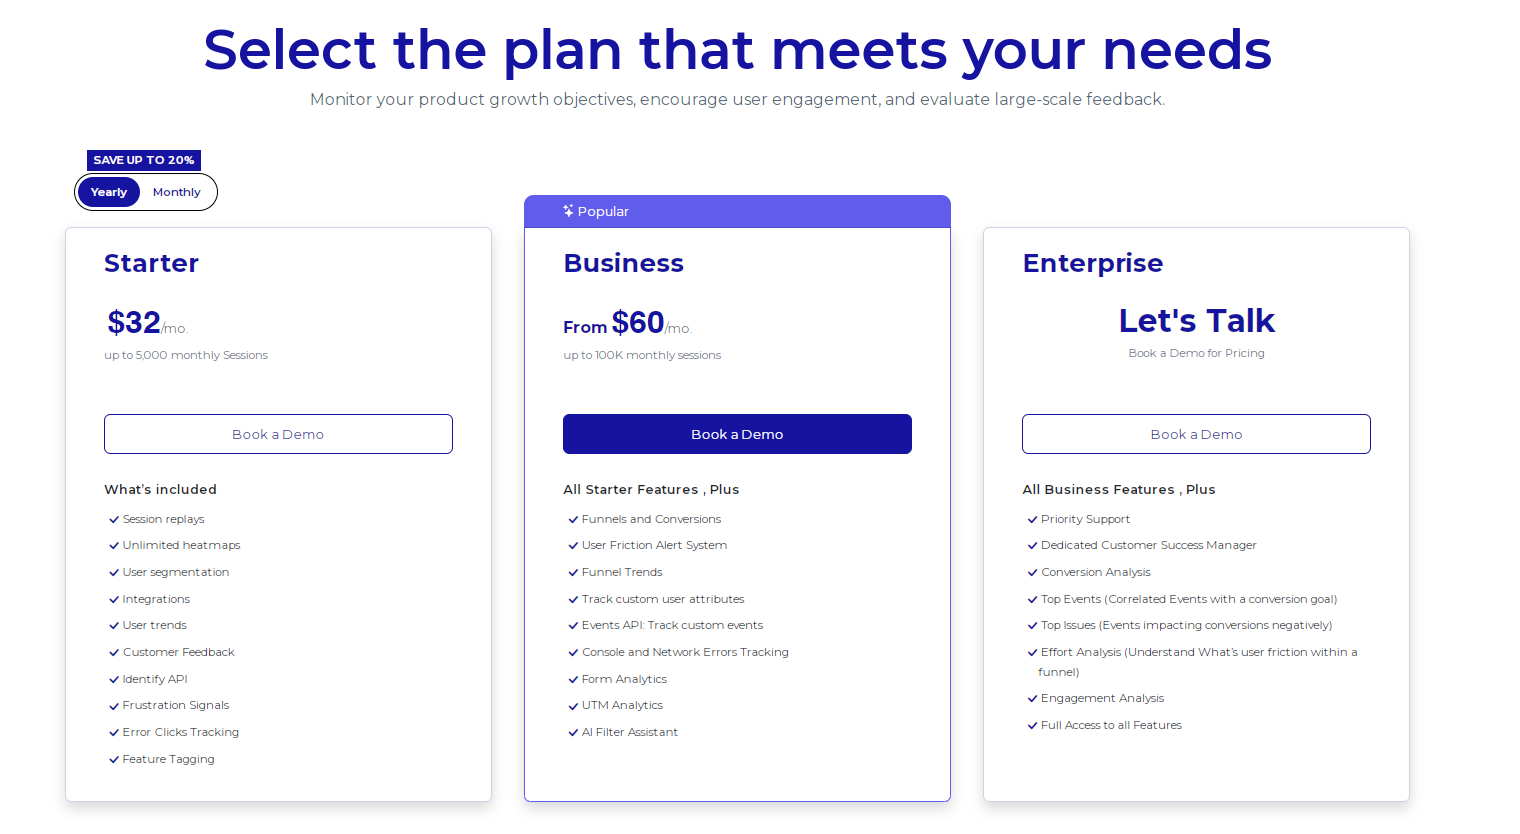
Here are more details on each plan.
- The Starter plan costs $39/month or $32/year and allows you to monitor up to 5,000 monthly sessions
- The Business plan costs $75/month or $60/year and helps you to track and analyze up to 100,000 monthly sessions
- The Enterprise plan has custom pricing and offers customizable sessions plus full access to all features.
If you need more information, you can get a demo.
Why Choose FullSession Over UserZoom and UserTesting?
FullSession is a comprehensive yet user-friendly behavioral analytics platform packed with valuable features designed to optimize your website’s performance. Thanks to our advanced filtering options and broad analytic tools, you can easily watch session recordings of real users and quickly filter through data—all on a single, intuitive platform.
With FullSession, you can track dynamic elements in real time, giving you precise insights into user behavior. Our real-time, interactive heatmaps offer up-to-date data without slowing down your site, and the customer feedback feature provides instant visual insights into the elements that frustrate your users.
We prioritize user privacy by allowing you to exclude sensitive data from recordings, ensuring GDPR, CCPA, and PCI compliance and high security. Plus, FullSession is designed to manage extensive datasets efficiently, quickly revealing key insights to help you optimize conversion rates. You can also limit tracking to your site, preventing any misuse of data.
FullSession facilitates cross-team collaboration, unifying efforts on one platform and providing pricing transparency with customizable plans that scale with your business.
Ready to see how FullSession can enhance user satisfaction on your website? Book a demo today.
FullSession Pricing Plans
The FullSession platform offers a 14-day free trial and three paid plans: Starter, Business, and Enterprise. A yearly subscription can save you up to 20%!
Here are more details on each plan.
- The Starter plan costs $39/month or $32/year and allows you to monitor up to 5,000 monthly sessions
- The Business plan costs $75/month or $60/year and helps you to track and analyze up to 100,000 monthly sessions
- The Enterprise plan has custom pricing and offers customizable sessions plus full access to all features.
If you need more information, you can get a demo.
UserZoom vs UserTesting: Final Words
The simple truth is that people aren’t going to use products—even potentially groundbreaking ones—that they find challenging and cumbersome. You need to test websites or apps to ensure they are easy to use. They need to provide valuable features to solve users’ issues.
The only effective way is through specialized tools such as FullSession. This cost-effective solution offers the best mix of features—great session recordings, powerful analytical tools, insights, real-time, interactive heatmaps, and new features like conversion funnel and error analysis.
We have whatever you need to identify potential issues with your product and make your customers happy.
If you want to evaluate FullSession yourself, book a demo today!
FAQs About UserTesting vs UserZoom
What is user testing?
User testing helps businesses understand how real users interact with their digital products, such as websites and apps. It involves observing your own users as they complete tasks, gathering feedback, and identifying pain points to improve usability and overall user experience.
Is UserZoom the same as UserTesting?
No, UserZoom and UserTesting are distinct platforms, but they have merged under the UserTesting brand to offer comprehensive UX research and usability testing tools.
Is UserZoom any good?
Yes, UserZoom is highly regarded for its robust UX research capabilities, offering both qualitative and quantitative testing methods.
Did UserTesting buy UserZoom?
Yes, UserTesting acquired UserZoom, and they now operate as a combined entity under the UserTesting brand.
What’s better than UserTesting and UserZoom?
UserTesting helps market research teams make data-driven decisions to improve the customer experience, but it’s not perfect for everyone. Alternatives or complementary apps to UserTesting include platforms like FullSession, Optimal Workshop, and Lookback. You can find more alternatives in our comparisons of Mouseflow vs VWO, Hotjar vs FullStory, and Lucky Orange vs Hotjar or Hotjar alternatives.
Who should use FullSession?
FulSession offers an intuitive platform for project management teams, product managers, prototype testing teams, customer service teams, marketing professionals, and more.
Mohamed oversees operations and finance at FullSession and has contributed to the company’s UX analytics knowledge base.


![Website Tracking: How to Do It + 5 Tools [Free & Paid]](https://www.fullsession.io/wp-content/uploads/2022/11/unnamed-7.jpg)