
Qualitative and quantitative data are two of the most common approaches used in research and data analysis. While both methods help organizations understand user behavior and make informed decisions, they serve different purposes.
Qualitative data focuses on understanding experiences, opinions, and motivations, while quantitative data measures behaviors using numerical values and statistics.
In this guide, we’ll explain the key differences between qualitative and quantitative data, explore their advantages and limitations, and show when each method is most useful.
In this article, we’ll see what they mean, how they differ, and, most importantly, when to use them.
Understanding Qualitative and Quantitative Data
Qualitative and quantitative data are fundamental for all kinds of research and data analysis. They both serve a good purpose and choosing one over another is tricky. Let’s see what each brings to the table.
What is Qualitative Data?
Qualitative data analysis involves examining non-numerical data to understand concepts, opinions, or experiences.
It often comes from interviews, open-ended survey responses, or observational studies focusing on the ‘why’ and ‘how’ of human behavior and experiences.
The data type provides insights that help understand the depth and complexity of the subject under study.
Examples of qualitative data questions:
- What are your main reasons for choosing our product over competitors?
- Can you describe your experience using our customer service?
- How do you feel about the latest changes we made to our software interface?
What is Quantitative Data?
Researchers work with numerical data to analyze quantitative data. It often comes from structured data sources like surveys with closed-ended questions, experiments, and statistical records.
Quantitative data analysis is used to quantify attitudes, opinions, behaviors, and other defined variables.
It often uses different statistical tools to identify patterns, trends, or correlations within the data set. Such analysis is essential for making general conclusions and predicting future trends based on the data.
Examples of quantitative data questions:
- How many hours per day do you use our product?
- On a scale of 1 to 10, how satisfied are you with our customer service?
- How often (in a month) do you encounter issues with our software interface?
What Are the Main Differences Between Qualitative and Quantitative Data?
| Qualitative Data | Quantitative Data |
| Focuses on opinions and experiences | Focuses on numerical measurements |
| Provides detailed insights | Provides measurable patterns |
| Collected through interviews or open responses | Collected through surveys and metrics |
| Used to understand motivations | Used to measure trends |
Qualitative and quantitative data serve different purposes. Qualitative research is more about the individual; thus, you can create a better image of your ideal customer and profile your target audience more precisely.
However, quantitative data might be a powerful weapon if you can afford a considerable sample size, as you can collect many results and create in-depth charts.
Yet, both methods have pros and cons, and we will touch base in the next section.
Advantages and Disadvantages of Qualitative Data
Qualitative data is available through many methods, like in-depth interviews and observations in a natural setting. It offers broader pictures of human behavior and social phenomena. While qualitative studies excel in interpreting non-numerical data to provide depth and context, they could be better if used by others.
Advantages of Qualitative Data
- Qualitative data gives a more detailed view of people’s attitudes, behaviors, and experiences.
- Qualitative studies allow for flexibility in research methods since they adapt to changing behaviors.
- Gathering data in natural settings allows qualitative research to spot the complexities and nuances of real-life situations.
- The qualitative approach gives a voice to study participants and lets them express their perspectives and experiences in their own words.
- Qualitative data is ideal for exploring new areas of research.
Disadvantages of Qualitative Data
- The interpretation of qualitative data can be highly subjective and depends on the researcher’s perspective so it can be biased.
- Due to typically smaller sample sizes and non-standardized data collection methods, the findings from qualitative studies may need to be more usable for colossal sample sizes.
- Collecting and analyzing qualitative data, such as transcribing and interpreting in-depth interviews, might be time-consuming and labor-intensive, requiring significant resources.
Advantages and Disadvantages of Quantitative Data
Quantitative data shines with its numerical nature and often contrasts with qualitative data collected through open-ended questions. Still, it has its own “place” in many research fields. It provides a strong foundation for statistical analysis and objective conclusions, but like any method, it has its own advantages and disadvantages.
Advantages of Quantitative Data
- Quantitative data offers a significant perk in statistical reliability and is known for its precise and objective analysis that can be replicated and verified.
- Quantitative data can be picked up from large populations, which makes it ideal for studies requiring a broad overview.
- Numerical data simplifies the process of comparing groups or variables. Doing that will help you make straightforward conclusions and trend analysis.
- Due to standardized feedback collection methods, results from quantitative research are often generalizable to a larger population.
- Modern techniques for collecting quantitative data, like surveys and automated data capture, enable efficient and swift data collection
Disadvantages of Quantitative Data
- Quantitative data may need more depth and detail found in qualitative data, potentially overlooking the subtleties of human behavior and experience.
- The structured nature of quantitative data collection can be restrictive, limiting the ability to explore unanticipated phenomena during the research process.
- Without the contextual background of qualitative data, there’s a risk of misinterpreting quantitative data, significantly when complex human behaviors are reduced to numbers.
Qualitative vs Quantitative Data: Real-World Examples
Qualitative and Quantitative data are both solid tools if you want to see how people see your product. Let’s see a couple of examples.
Qualitative Data Examples
- Customer Feedback Interviews: Gathering detailed opinions and feelings about a new product through individual interviews.
- Ethnographic Research: Observing and documenting the behaviors and interactions of a specific cultural group in their natural environment.
- Case Studies: In-depth analysis of a single event, situation, or individual to comprehensive insights into complex issues.
Quantitative Data Examples
- Survey Results: Analyzing responses from 1,000 participants on their product preferences, with 60% preferring Product A over Product B.
- Educational Achievement: Measuring students’ performance in a standardized test, where 75% scored above the national average.
- Market Analysis: Evaluating sales data to find that a particular product saw a 30% increase in sales following a marketing campaign.
How Can FullSession’s Tools Help You Gather Customer Feedback?
FullSession is entirely focused on providing valuable insights that you can utilize at a later stage. Our Customer Feedback tool will help you understand customers’ demands in much more depth. You can capture and analyze user interactions and draw result-driven conclusions, which are way more efficient than standard “guessing” methods.
With FullSession, you can quickly discover areas of improvement and bolster your strengths to increase your traffic even more.
Install Your First Website Feedback Form Right Now
It takes less than 5 minutes to set up your first website or app feedback form with FullSession, and it’s completely free!
FullSession Pricing Plans
Here are more details on each plan.
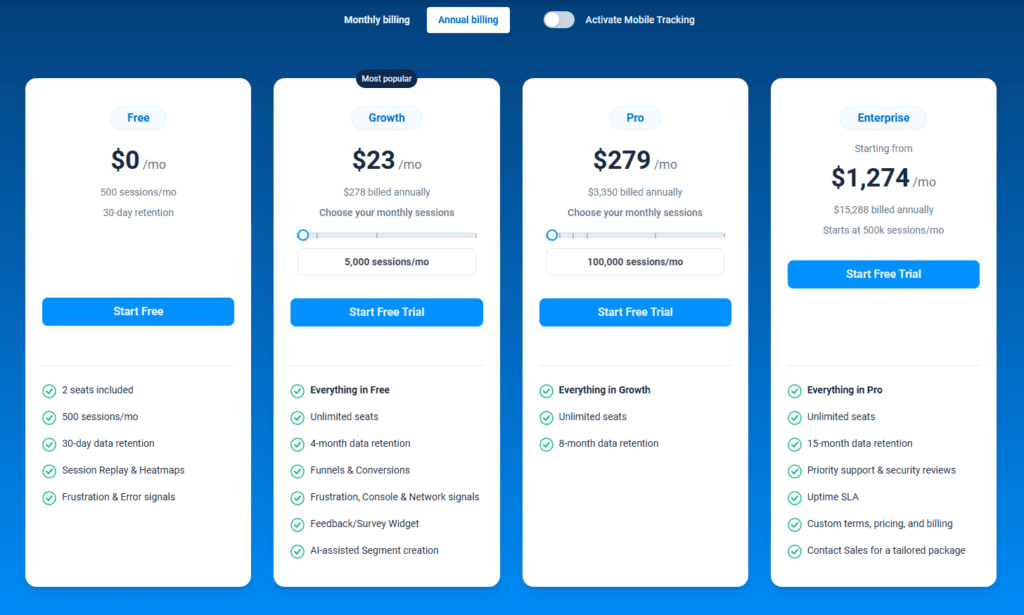
- The Free plan is available at $0/month and lets you track up to 500 sessions per month with 30 days of data retention, making it ideal for testing core features like session replay, heatmaps, and frustration signals.
- The Growth Plan starts from $23/month (billed annually, $276/year) for 5,000 sessions/month – with flexible tiers up to 50,000 sessions/month. Includes 4 months of data retention plus advanced features like funnels & conversion analysis, feedback widgets, and AI-assisted segment creation.
- The Pro Plan starts from $279/month (billed annually, $3,350/year) for 100,000 sessions/month – with flexible tiers up to 750,000 sessions/month. It includes everything in the Growth plan, plus unlimited seats and 8-month data retention for larger teams that need deeper historical insights.
- The Enterprise plan starts from $1,274/month when billed annually ($15,288/year) and is designed for large-scale needs with 500,000+ sessions per month, 15 months of data retention, priority support, uptime SLA, security reviews, and fully customized pricing and terms.
Conclusion
So, you’ve journeyed through the maze of qualitative vs quantitative data. You’ve seen how each has its place—qualitative with its rich, detailed narratives and quantitative with its hard numbers.
Remember this: Qualitative paints the picture; quantitative frames it. One gives depth, the other scale.
Combine them, and what do you get? A complete view—a 360-degree take on whatever’s at hand. FullSession can help you blend both, so you can really see the full picture and enjoy much better results.
FAQs in Relation to Qualitative vs Quantitative Data
What is the difference between quantitative and qualitative data?
Difference between quantitative and qualitative data: Quantitative data is numerical and used for measuring and counting, while qualitative data is descriptive and categorizing and conceptualizing.
What is an example of quantitative data?
The percentage of people in a survey who rate service as “excellent,” “good,” “average,” “poor.”
How do you determine if the data is qualitative or quantitative?
If the data can be counted or measured and expressed in numbers, it’s quantitative. In case it’s descriptive and involves characteristics that can’t be counted, it’s qualitative.
Mohamed oversees operations and finance at FullSession and has contributed to the company’s UX analytics knowledge base.