As an online business owner, you must know how your users interact with your web app, landing page, website, or...

Categorical Data: How to Use It For Website Conversions
Anyone who’s taken a statistics class is probably already familiar with qualitative and quantitative data. One includes numerical values and the other describes qualities or traits. One can be counted, and the other cannot, plain and simple. But wait, are we forgetting another type of data?
Categorical data takes qualitative data and divides them into specific categories. It seems complicated at first glance, but as you read further, you’ll find that it’s the most simple form of data to collect and analyze.
In this guide, we’ll go over the details of categorical data, how it differs from quantitative data, its applications in the business world, and much more.
What is Categorical Data?
Categorical data is defined as qualitative data divided into distinct groups or categories. This is different from numerical data, which consists of numbers that can be calculated. Categorical data focuses on classification instead of values that can be added, subtracted, or measured.
For example, if you had a collection of different fruits, categorical data would organize them according to specific characteristics, such as color or fruit kind.
Types of Categorical Data
Categorical data primarily branches into two distinct types: nominal and ordinal data. Each type has specific characteristics and applications, emphasizing the importance of understanding the differences to use the most appropriate analytical approaches and accurately interpret the results.
The two main types of categorical variables are:
Nominal Data
Nominal data, also known as “label” or “named” data, is the most basic type of categorical data. The main characteristic of nominal data is that it distinguishes between things or subjects based on name or category without assuming any kind of order or ranking among the categories.
Essentially, nominal data labels and categorizes data, but the categories have no underlying numerical value or hierarchical position.
Ordinal Data
Ordinal data differs from nominal data as it not only categorizes and labels but also assigns a clear order or ranking to the categories. This form of categorical data is distinguished by the relative order of the categories, implying a hierarchy or sequence. However, the separations between these ranks or places are not always equal or quantifiable.
Features of Categorical Data
With its unique characteristics and analytic approaches, categorical data is essential to many fields, such as business intelligence, research, and statistics. Handling and interpreting this kind of data effectively involves an understanding of its features.
Here’s a closer look at the key features of categorical data:
- Categories: Categorical data is defined by the way it’s organized into groups or categories. These categories are typically determined by similar characteristics among the data fragments and are not numerical. For instance, a survey might categorize respondents by their favorite type of music, with options such as rock, jazz, classical, and pop.
- Qualitative Data: Since categorical data describes traits or attributes rather than quantity, it is fundamentally qualitative. Instead of measuring or counting the data, it offers insights into the type or nature of the data.
- Interval Scale: Ordinal data, a subtype of categorical data, involves categories with a meaningful order or ranking among them. However, the intervals between these rankings are not necessarily consistent or quantifiable. An interval scale, more common in quantitative data, has equal distances between points, which is not a feature of ordinal categorical data but is relevant when considering the relationship between different types of data.
- Analysis: Categorical data analysis often involves statistical procedures that differ from those used for numerical data. Chi-square testing, logistic regression, and frequency distribution analysis are standard methods for identifying patterns, correlations, and differences between categories.
- Numeric Values: Interestingly, categorical data can sometimes take on numeric values, but these numbers serve as labels rather than quantitative measures. For example, a survey might use numbers to represent different categories of satisfaction (e.g., 1 for ‘Very Unsatisfied’, 2 for ‘Unsatisfied’, etc.), but these numbers simply categorize responses rather than indicate any mathematical value.
Categorical Data Examples

Categorical data is widely used in a variety of sectors and scenarios, showing its broad applicability and effectiveness. Here are some situations demonstrating how categorical data is used in real-world contexts:
- Feedback Ratings: Customer feedback in surveys often uses categories like “satisfied,” “neutral,” or “dissatisfied.”
- User Engagement Types: Interactions on social media platforms can be categorized into likes, shares, comments, etc.
- Accommodation Types: Options are categorized into hotels, hostels, bed and breakfasts, or vacation rentals.
- Course Categories: Academic courses can be categorized by their subject area, such as sciences, humanities, arts, etc.
- Customer Types: Shoppers might be classified based on their behavior or purchasing patterns, such as “frequent buyers,” “first-time visitors,” or “seasonal shoppers.”
- Census Data: Information collected includes categories like marital status, employment status, and educational attainment.
- Credit Risk Ratings: Credit scores are often categorized into ranges such as “excellent,” “good,” “fair,” and “poor.”
- Climate Zones: Geographic areas are categorized by climate types, such as tropical, arid, temperate, or polar.
- Species Classification: Organisms are classified into categories like mammals, birds, reptiles, amphibians, or insects.
What is Numerical Data?
Numerical data, often known as quantitative data, is information presented in numerical form and can be quantified or measured. This type of data is characterized by its ability to undergo mathematical operations, such as addition, subtraction, multiplication, and division, allowing a wide range of statistical analysis.
Numerical data is used in a variety of industries, including science, finance, and social research, as a basis for quantitative analysis, projections, and decision-making processes.
Types of Quantitative Data
Quantitative data is divided into two types: discrete data and continuous data. Each type has distinct properties that make it suitable for different analytical methods.
Discrete Data
Discrete data consists of countable numbers representing unique entities or categories that cannot be split. The main feature of discrete data is that it contains a finite or countably infinite number of values. This type of qualitative data is typically represented by whole numbers.
Some examples of discrete data include the number of students in a classroom, the number of cars in a parking lot, and the number of books on a shelf.
Continuous Data
Continuous data can have any value within a specific range, including fractions and decimals. This form of data is measured rather than counted, and it often involves observations or measurements that fluctuate indefinitely along a continuum.
Examples of continuous numerical data include the height of individuals, weight produce in the grocery store, and the temperature of a room throughout the day.
Categorical and Numerical Data: What’s the Difference?
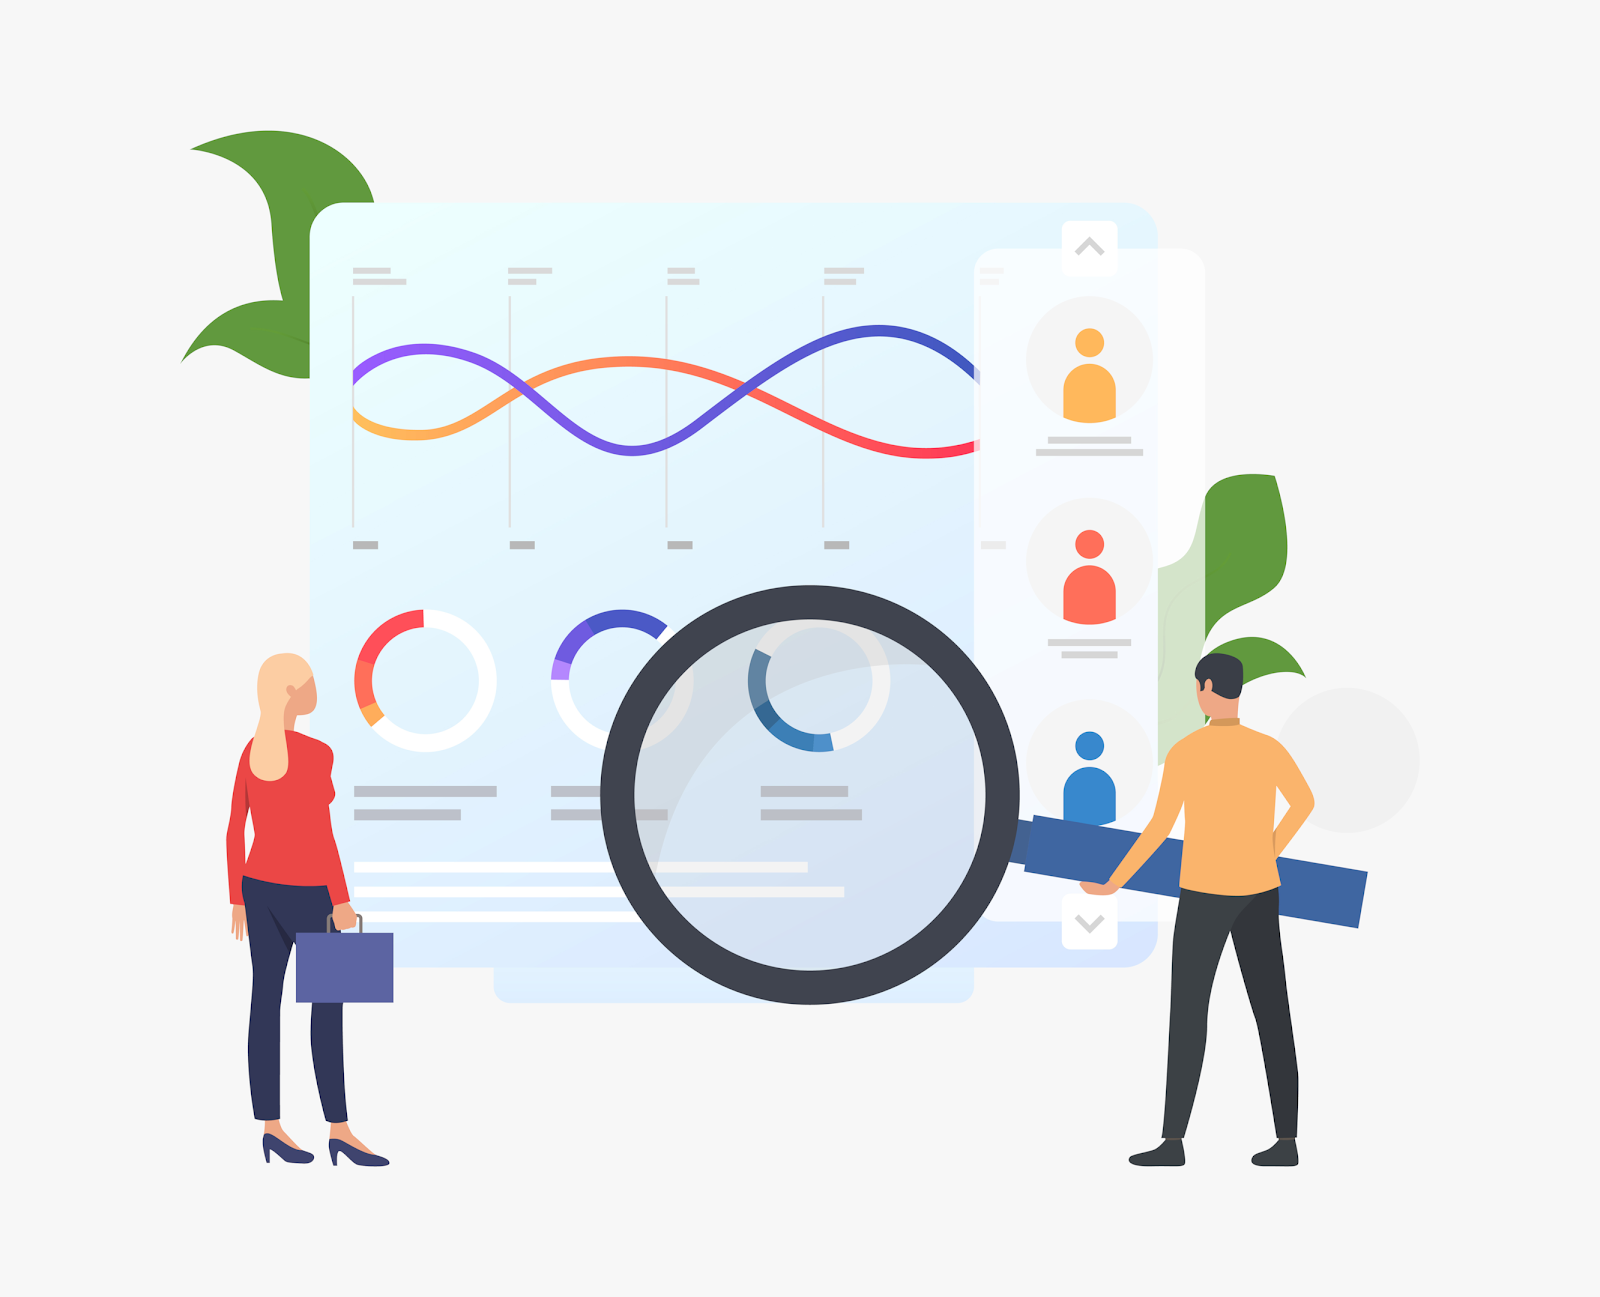
Categorical data is qualitative in nature, meaning it describes attributes or properties that are not inherently numerical. On the other hand, numerical data (sometimes known as quantitative data) deals with numbers and values that can be measured or quantified.
Key Differences Between Categorical and Numerical Data
You need to understand the differences between categorical and numerical data to be able to each type effectively. Let’s take a closer look at how these two types of data differ:
- Nature of Data: The key difference between these two data types is in the nature of the data itself—categorical data is qualitative and concerned with traits, whereas numerical data is quantitative and focused on measurable quantities.
- Statistical Analysis: The types of statistical analyses that can be performed vary greatly. Categorical data analysis may include frequency counts, mode, or chi-square tests, while numerical data analysis may involve a broader range of mathematical computations such as mean, median, standard deviation, and correlation coefficients.
- Visualization Techniques: When it comes to data visualization, categorical data can be presented as bar charts, pie charts, and histograms (for ordinal data) that highlight the distribution across categories. Line graphs, scatter plots, and histograms (for discrete data) are commonly used to show numerical data, highlighting trends, correlations, or value distributions.
- Data Collection Methods: The methods used to collect the type of data may also differ. Categorical data is often collected via surveys, observations, or established classifications. On the other hand, numerical data usually comes from measuring and counting.
How Does Categorical Data Apply in Business?

Categorical data provides valuable information that businesses can use to guide decision-making, improve customer experiences, and optimize operations. Here are some of the most common applications of categorical data in business:
eCommerce
Categorical data helps organize goods into specific categories such as apparel, electronics, and home goods, which improves site navigation and search functionality. This categorization enables targeted marketing methods and simplifies the shopping experience for customers by making it easier to find the products they want.
Additionally, customer segmentation enables customization of marketing efforts and recommendations based on purchasing habits, preferences, or demographics, thereby increasing conversion rates and promoting client loyalty.
Categorizing transactions based on their type, such as online purchases or in-store pickups, also provides a deeper understanding of customer behavior. This benefit allows businesses to fine-tune their inventory management and logistics strategies.
Customer Service
Customer service benefits significantly from the strategic application of qualitative data. Businesses can speed up the resolution process by categorizing customer inquiries and complaints and routing them to the right departments. Plus, this categorization helps optimize service ticket prioritizing by ranking issues based on urgency or severity, assuring that the most crucial concerns are addressed first.
Customer Feedback
Customer surveys are a vital tool in measuring customer satisfaction and preferences. These surveys often ask customers to rate their level of satisfaction across multiple characteristics of the product or service, using categories like “very satisfied” to “dissatisfied,” to help businesses identify operational strengths and weaknesses.
Plus, asking customers to select their preferences from a specified list of categories can provide meaningful insights into current consumer trends and preferences, which can prove extremely useful for adapting products and services to better suit market demand.
How Can You Collect Categorical Data?
Categorical data collection is an essential part of generating insights that guide business decisions and improvement efforts. You can collect this type of data using different methods, such as:
- Surveys and Questionnaires: Surveys and questionnaires are some of the most direct ways to collect categorical data. They can be created with multiple-choice questions, checkboxes, or drop-down menus allowing respondents to select from specified categories. For example, a survey may ask participants to use a Likert scale to indicate their age group, income range, or level of satisfaction with a service.
- Observational Studies: Observational research involves gathering data by observing participants in their natural setting without interfering. This method can categorize behaviors, actions, and events that are not often self-reported or easily recorded. A store, for example, may use observation to categorize shopper activities such as browsing, pricing comparison, and purchasing.
- Transactional Data Analysis: Businesses can gather categorical data by reviewing transactional records. This involves classifying transactions according to specific criteria, such as the type of product purchased, the payment method utilized, or the time of purchase. Transactional data analysis can reveal patterns in consumer behavior, preferences, and purchase trends.
- Social Media and Online Analytics: Social media sites and web analytics tools provide an abundance of numerical and categorical data. Businesses who track social media interactions can categorize comments, likes, and shares to evaluate public sentiment, discover trends, and understand consumer preferences. Similarly, website analytics can divide visitor data based on demographics, site behavior, and conversion actions, providing useful insights for digital marketing and content strategy.
How Can Categorical Data Help Your Website Analysis
Collecting qualitative data for your business often requires multiple approaches to cover a wider scope of people and categorical variables. Unfortunately, this can take up a lot of time, which you may not have enough of.
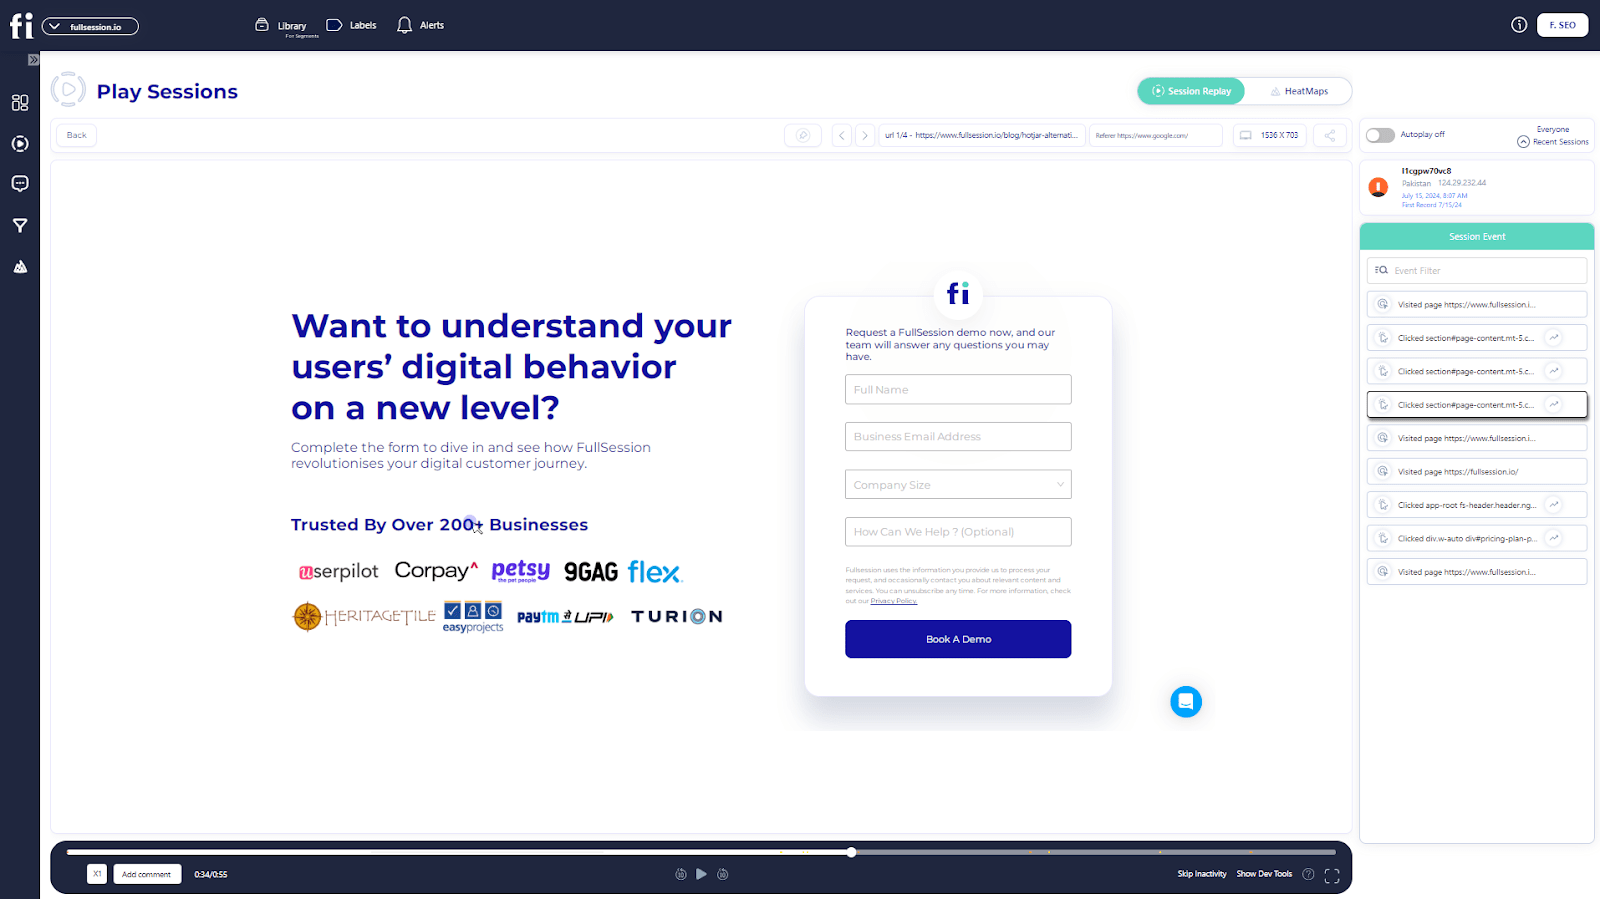
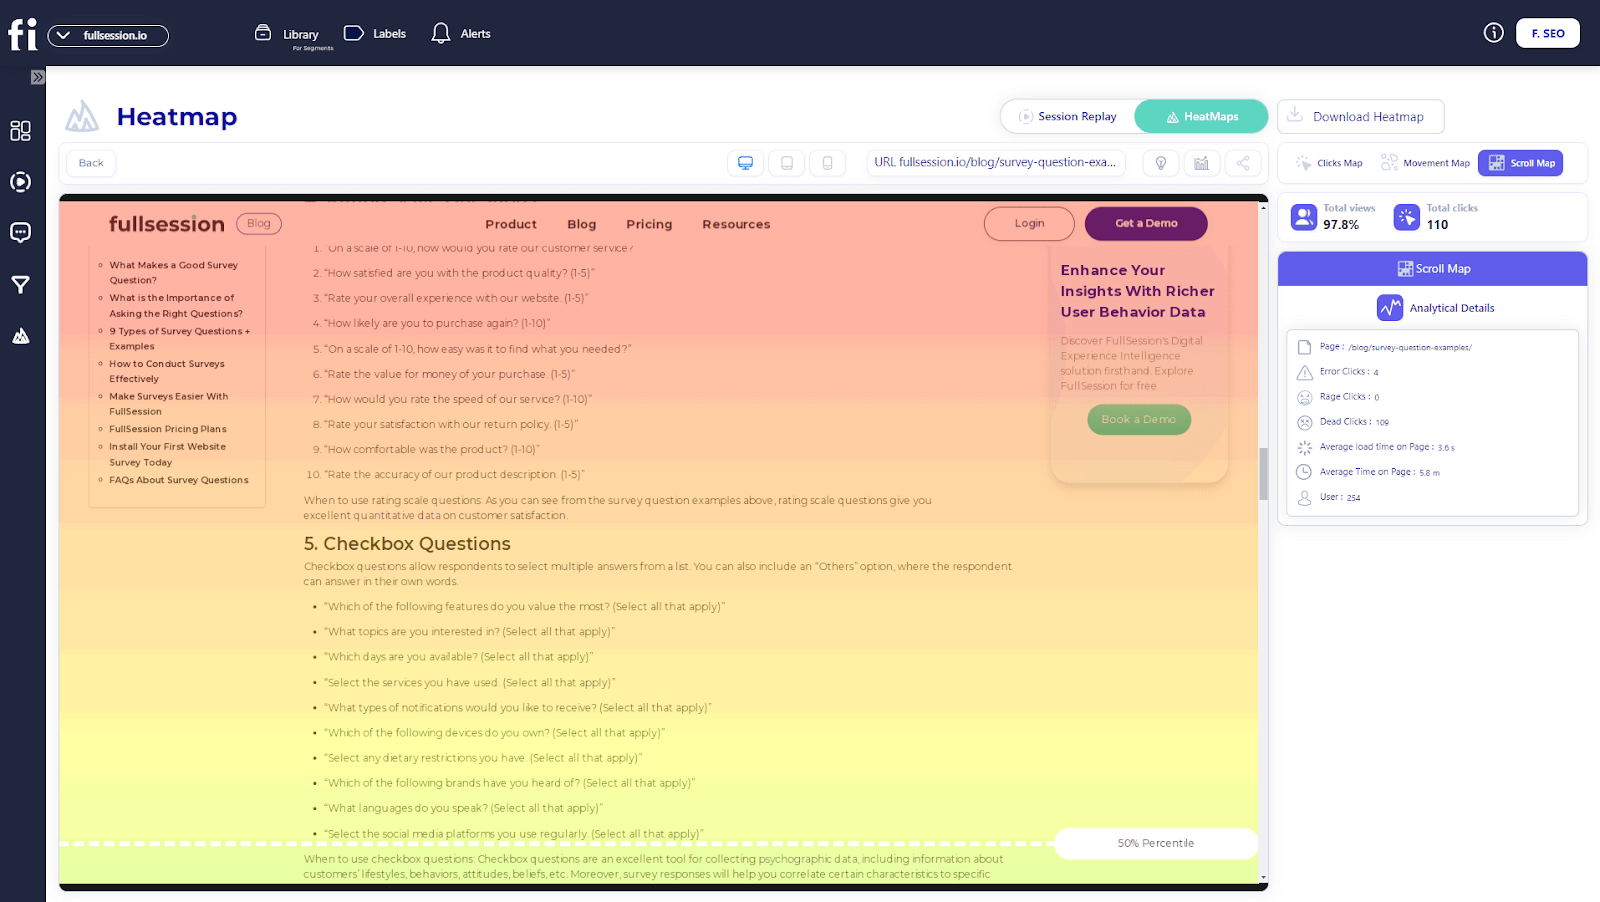
This is where web analytics tools like FullSession come in handy. FullSession automatically collects both qualitative and quantitative data from your website that can help you optimize multiple aspects of your business. Plus, it can translate categorical data into quantitative data for easier statistical analysis.
Don’t let data collection intimidate you. With FullSession, you can gather different types of categorical data and gain deeper insights into what you can improve for a better conversion rate.
FullSession Pricing Plans
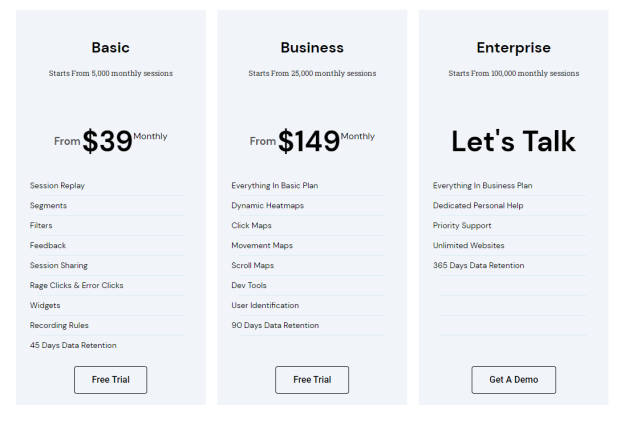
The FullSession platform offers a 14-day free trial. It provides two paid plans—Basic and Business. Here are more details on each plan.
- The Basic plan costs $39/month and allows you to monitor up to 5,000 monthly sessions.
- The Business plan costs $149/month and helps you to track and analyze up to 25,000 monthly sessions.
- The Enterprise plan starts from 100,000 monthly sessions and has custom pricing.
If you need more information, you can get a demo.
Install A Better Web Analytics Tool Within Minutes
It takes less than 5 minutes to set up your first website analytics tool with FullSession, and it’s completely free!
FAQs About Categorical Data
Details
How important is categorical data for businesses?
Categorical data is crucial for businesses as it aids in market segmentation, customer profiling, and trend analysis, enabling targeted marketing strategies and informed decision-making.
Can businesses use categorical data to improve customer service?
Yes, businesses can use categorical data to classify customer inquiries and feedback, which helps in prioritizing and efficiently addressing customer needs.
Can categorical data be used to monitor business performance?
Absolutely. By categorizing sales, customer feedback, and service quality, businesses can identify performance trends and areas for improvement, guiding strategic adjustments.

