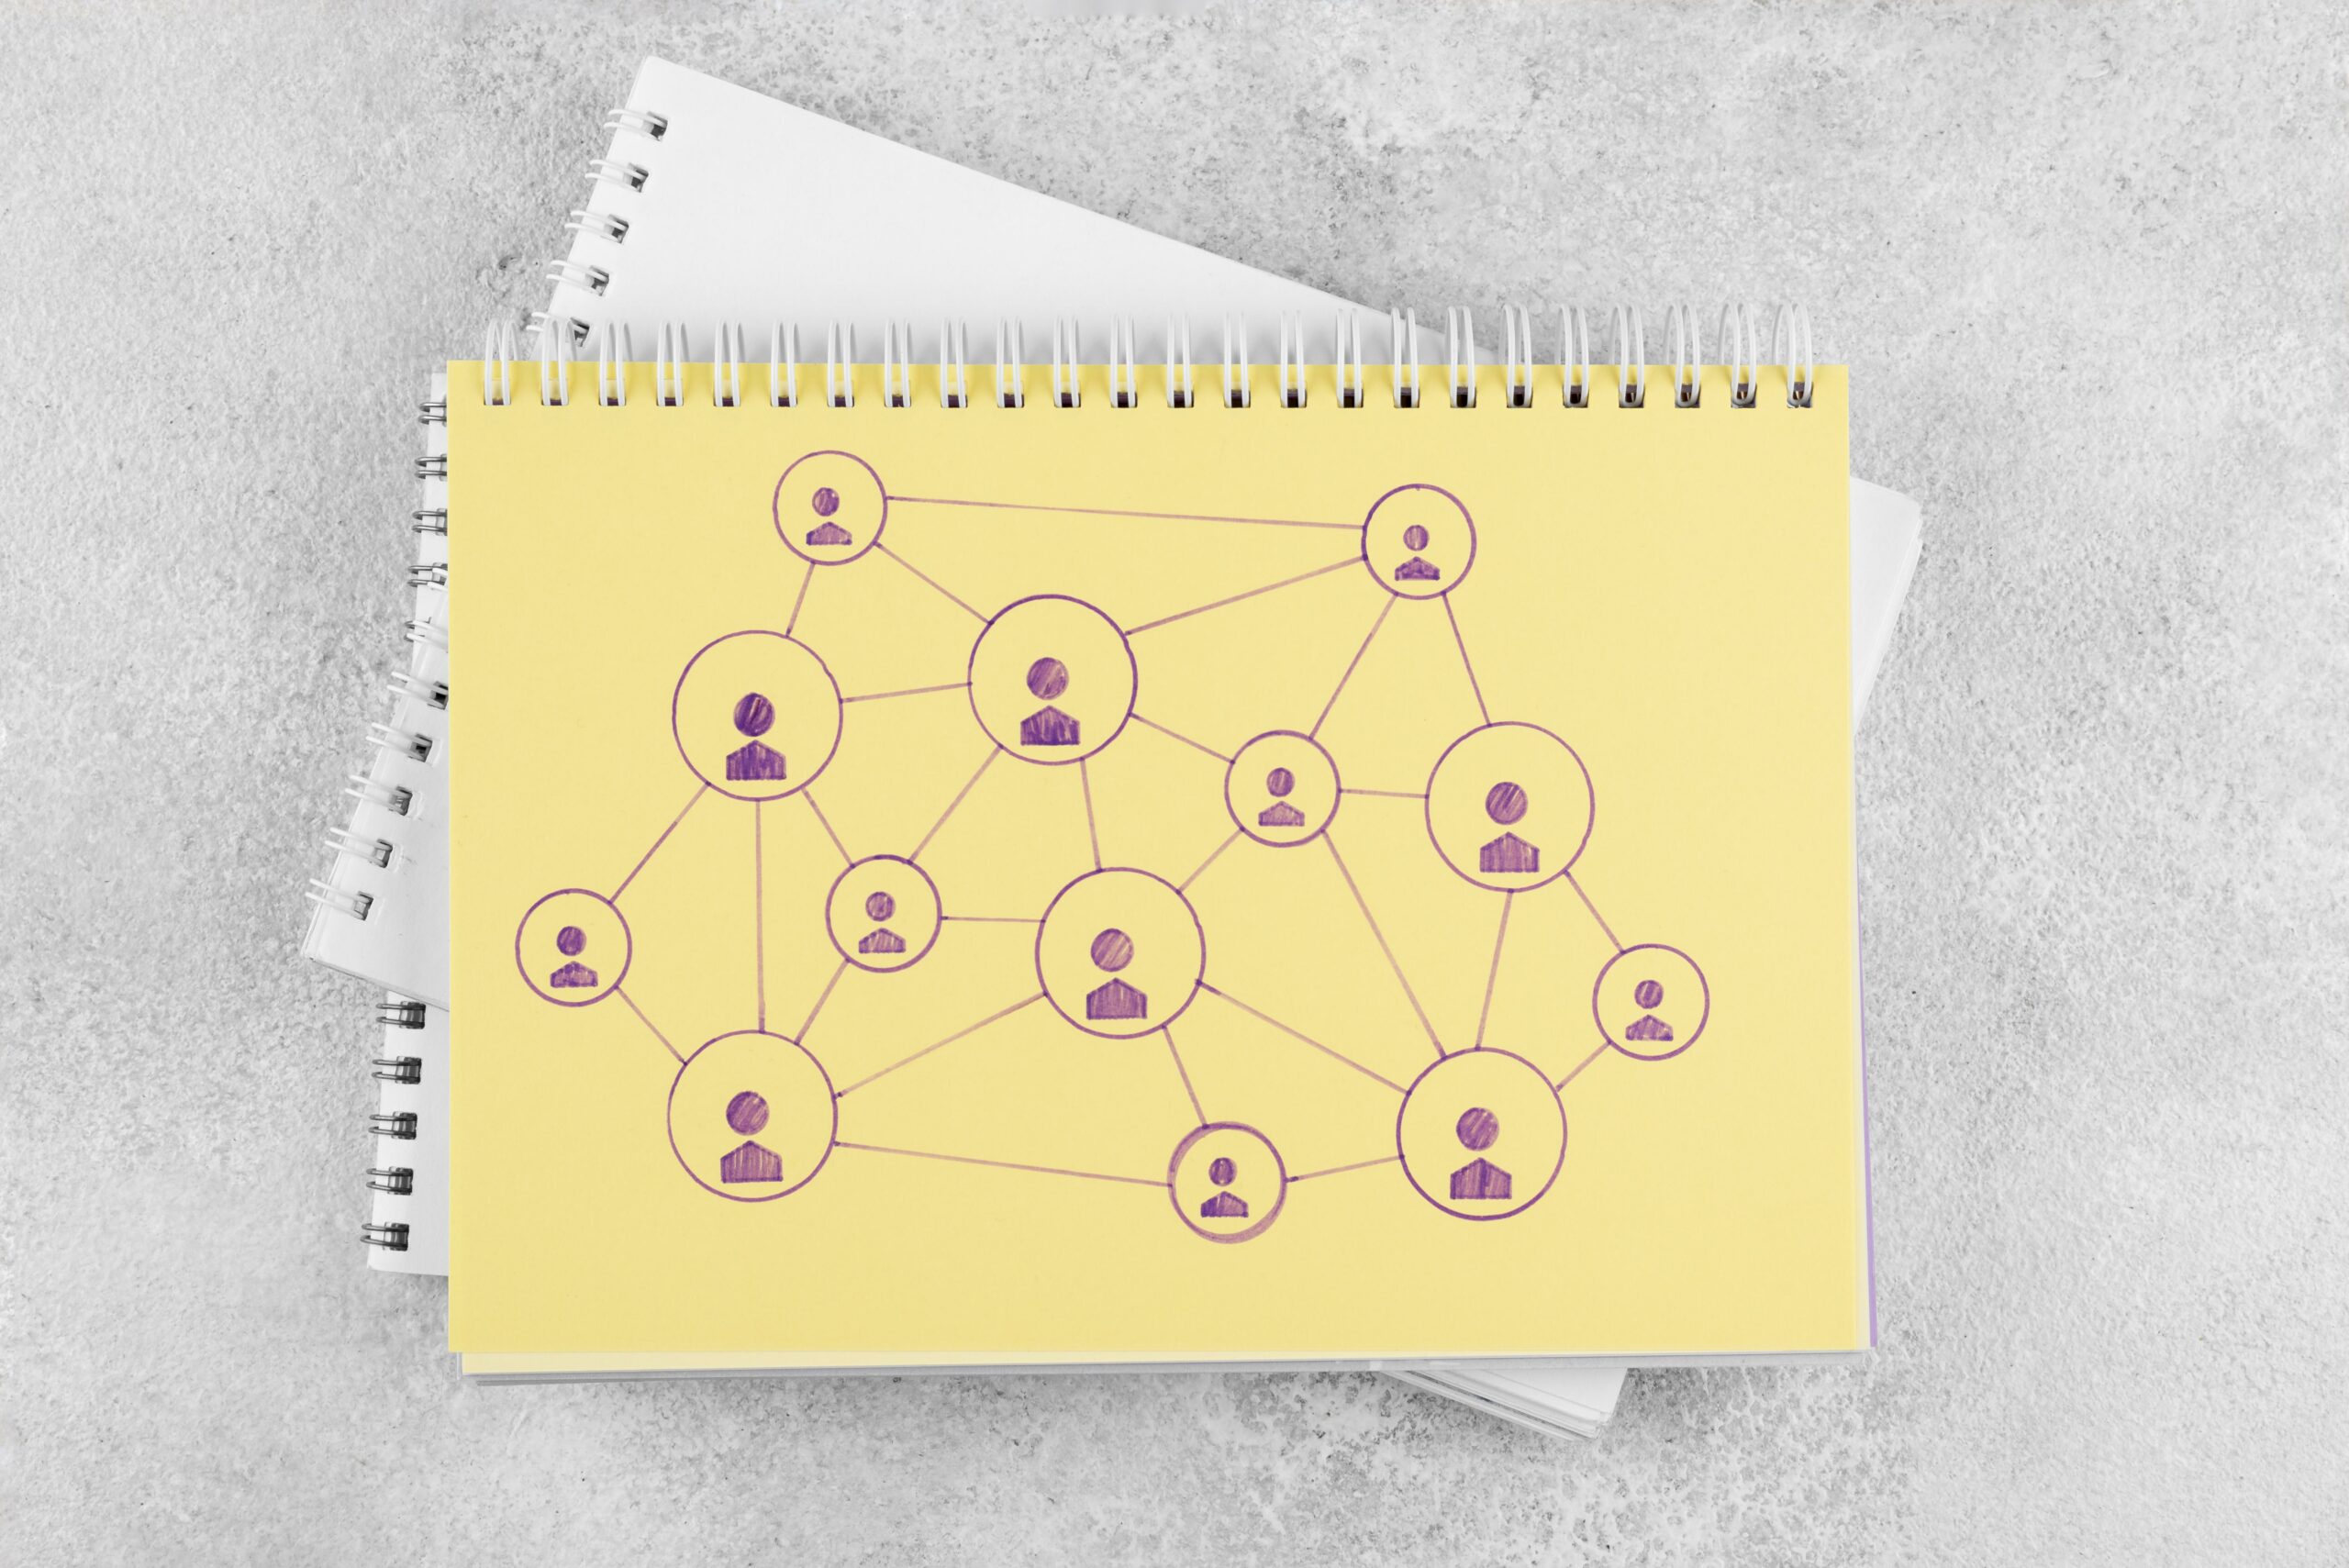
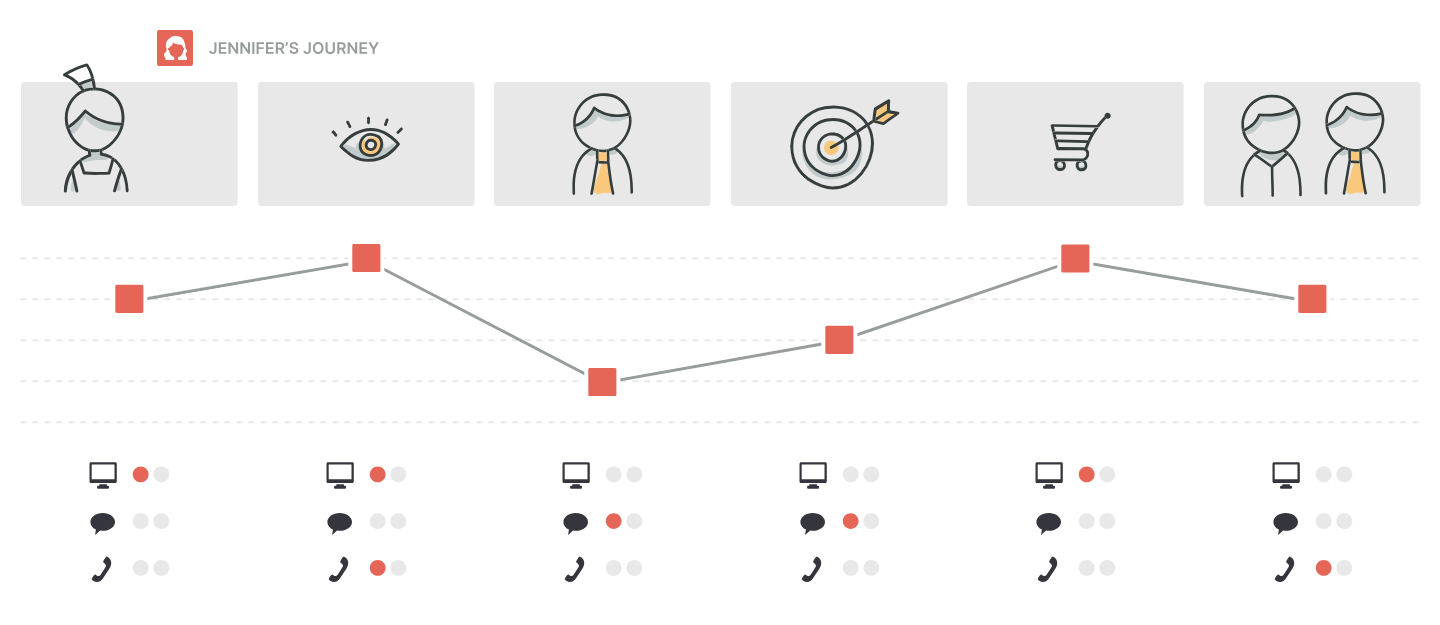
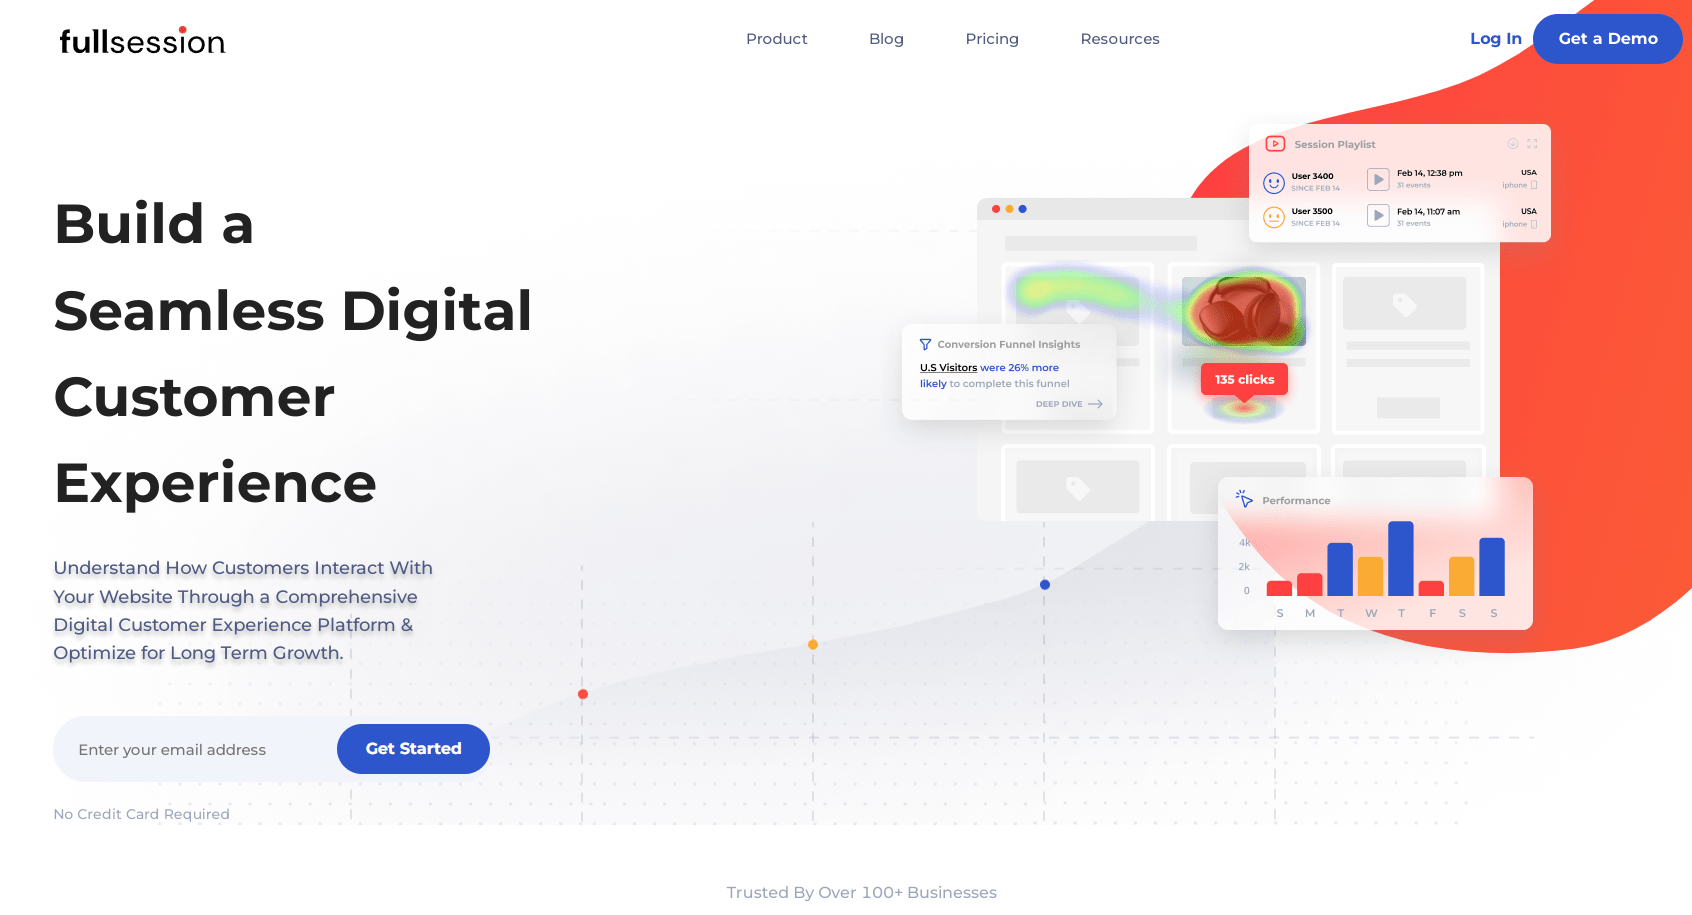
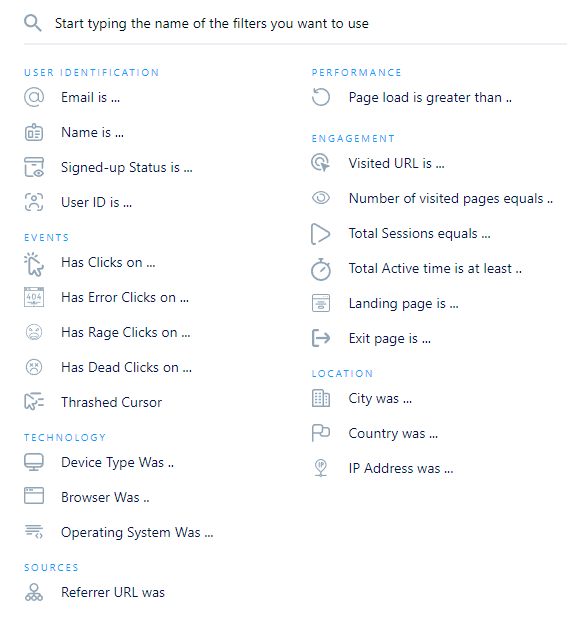
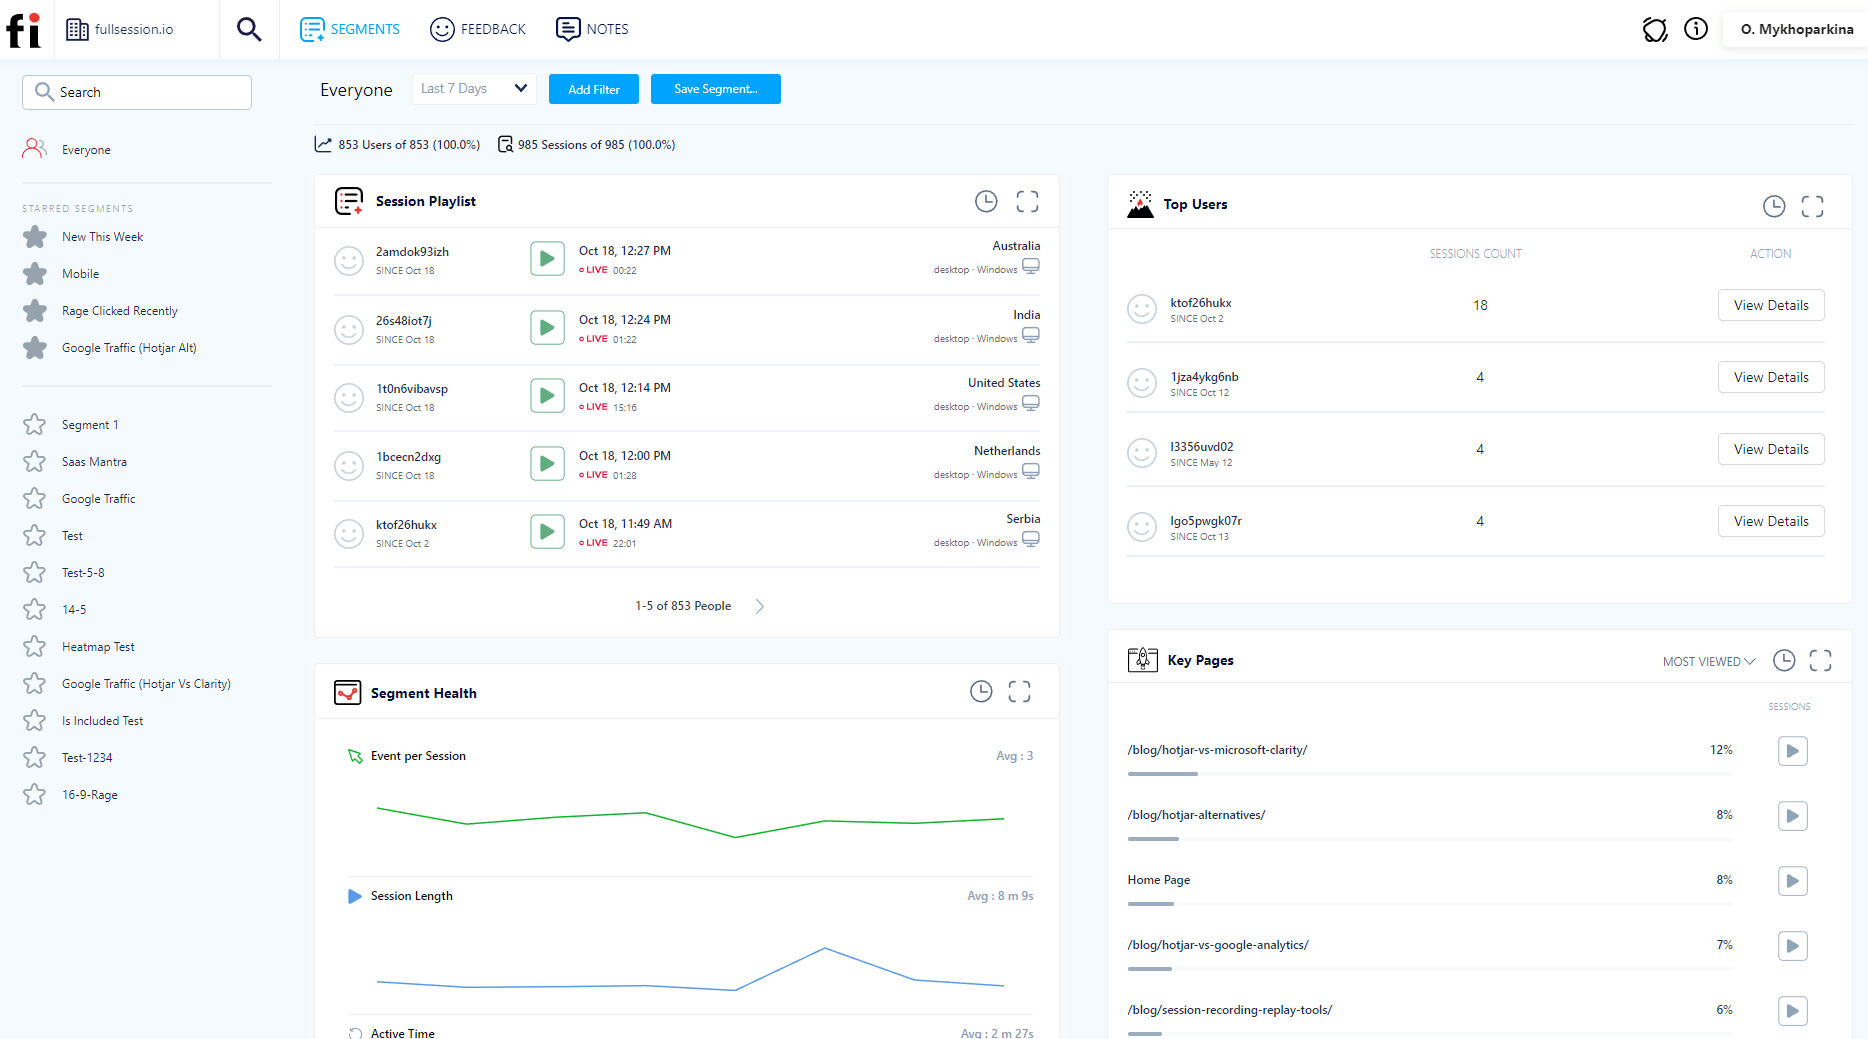
Understanding your customer’s journey is the root of increasing conversions. Customer journey mapping tools give you the ability to visualize their path, pinpointing where users join or drop off.
In this article, we’ll take a look at the best customer journey mapping tools that help you plan and understand your customer funnel.
What Are Customer Journey Mapping Tools?
Customer journey mapping softwares are used to analyze your current customer or user journey on your website or product, and optimize it using that analyzed data. Essentially, these tools give you the ability to run a customer experience analysis.
These tools capture data at every touchpoint you have along your customer journey, highlighting where customers love your UX or product, or where they get frustrated.
These analytics and insights into your customer journey help tweak marketing strategies and targeting. You’ll ensure for people land on your site, or go through your product onboarding, their experience is optimized to give them the highest level of satisfaction. The only way of doing this is by understanding each step on their journey, and optimizing them.
Luckily, there are tools that do this all for you.
List of the Best Customer Journey Tools In 2024
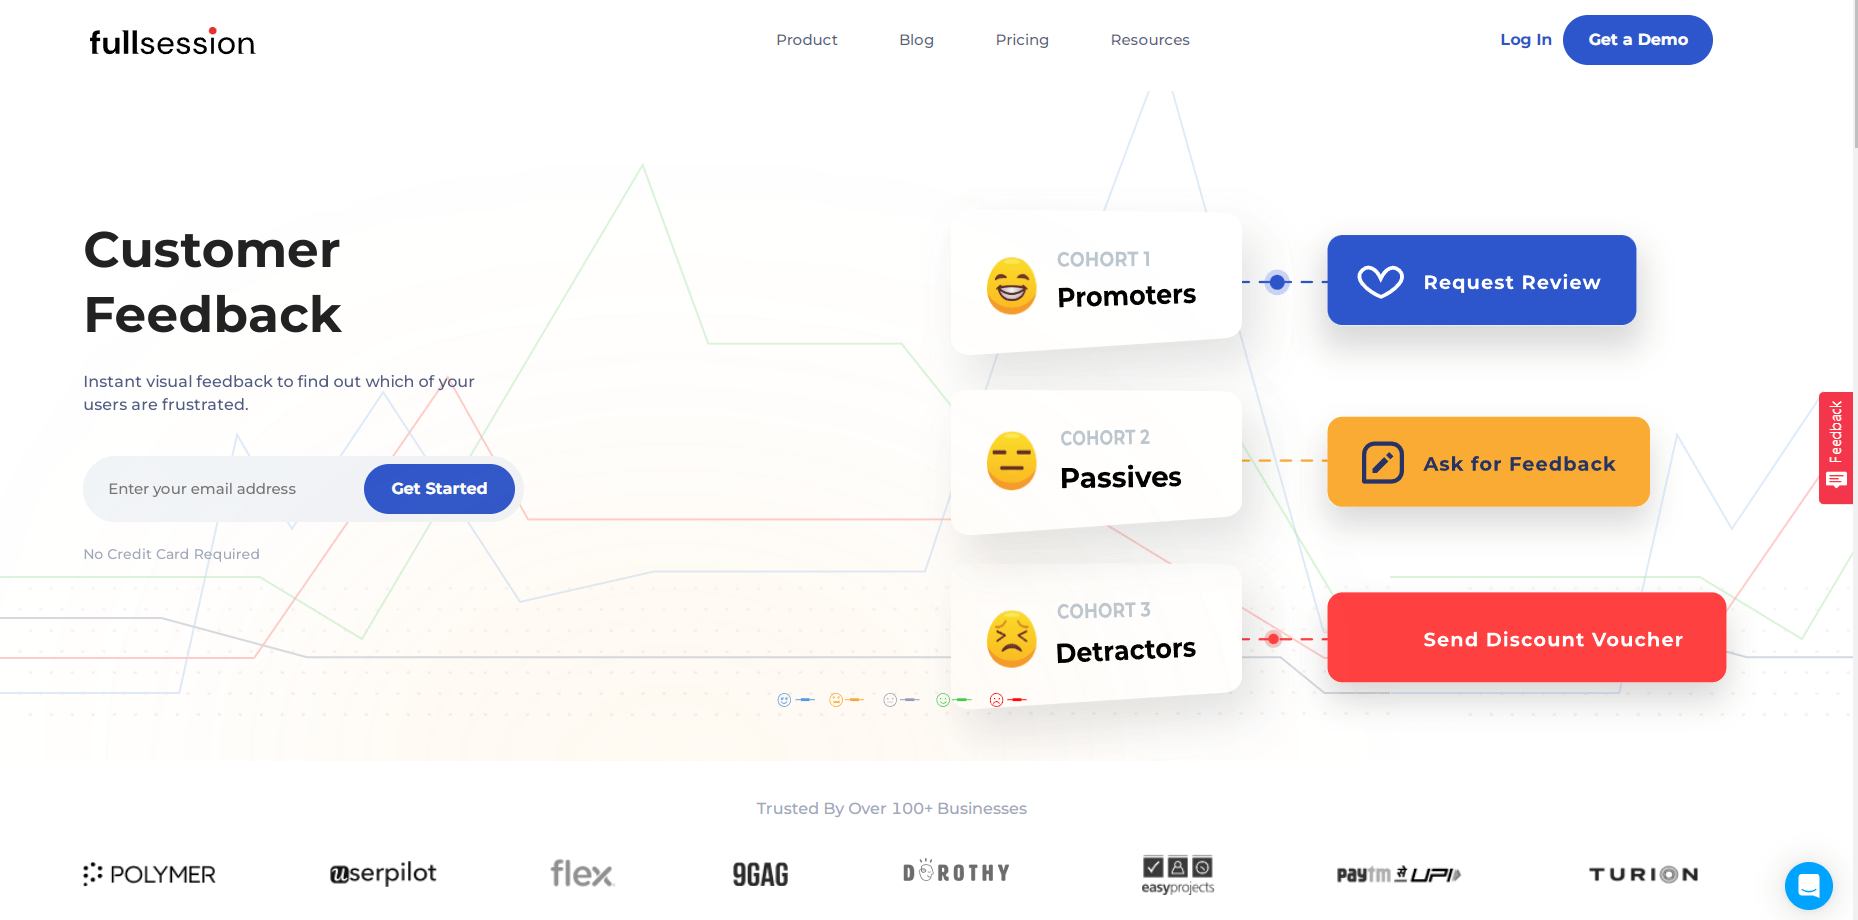
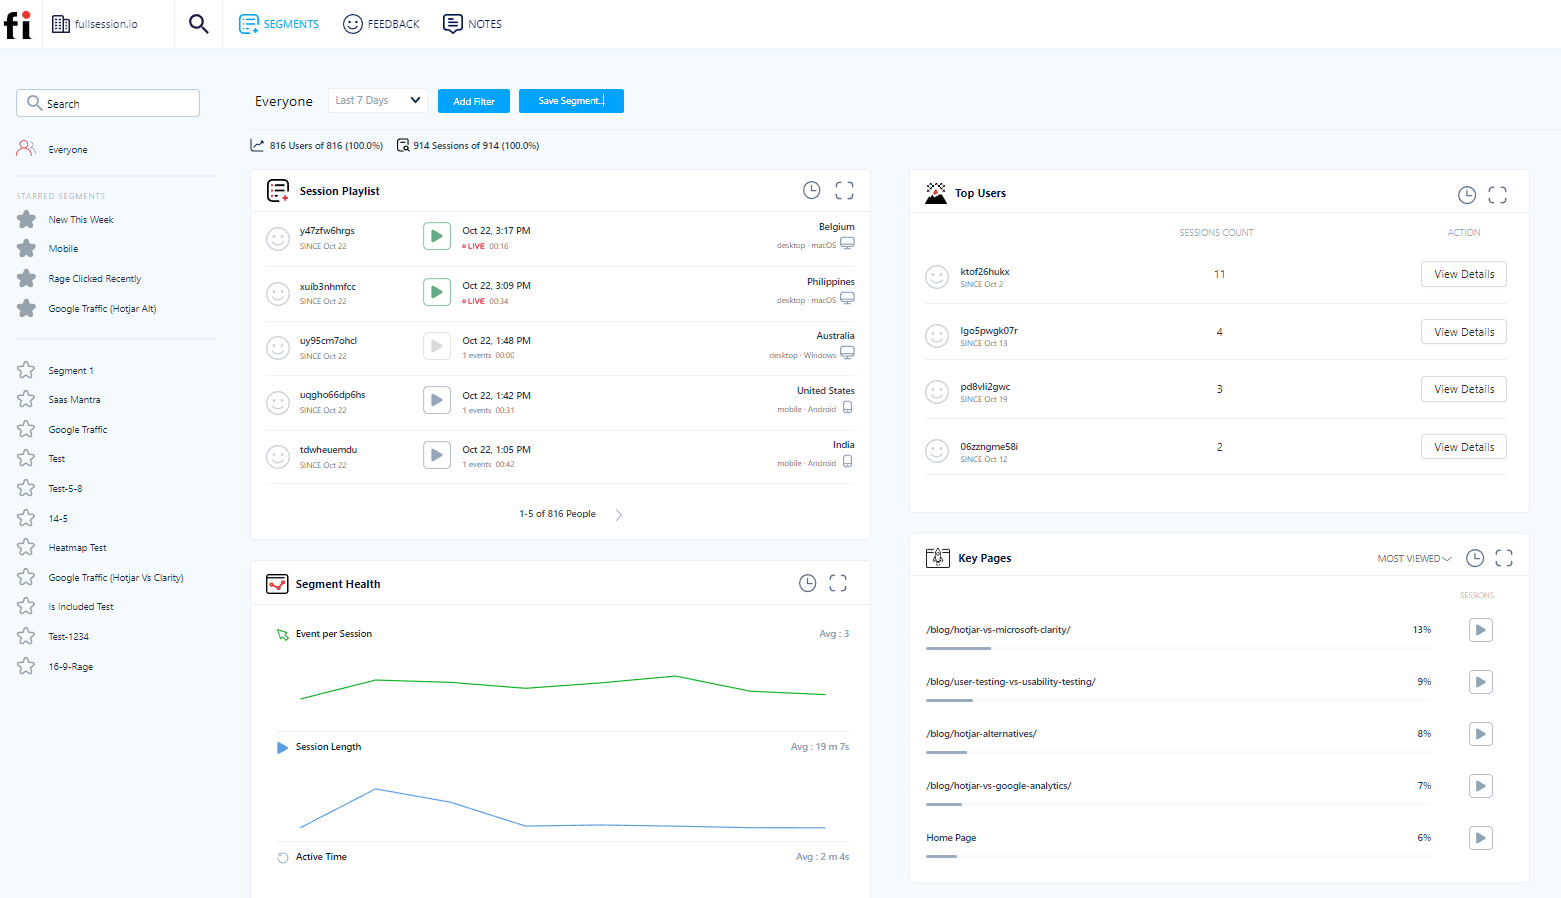
1. FullSession
When it comes to customer journey mapping, FullSession stands out for its ability to breakdown each step of the customer journey, in several ways. You get insight into each step of the customer journey through:
Session Recording
Heatmaps
Feedback and Surveys
FullSession also has a funnel optimization and analysis tool that brings all data points from those tools, and breaks it down for you.
Visualize, Analyze, and Optimize with FullSession
See how to transform user data into actionable insights for peak website performance.
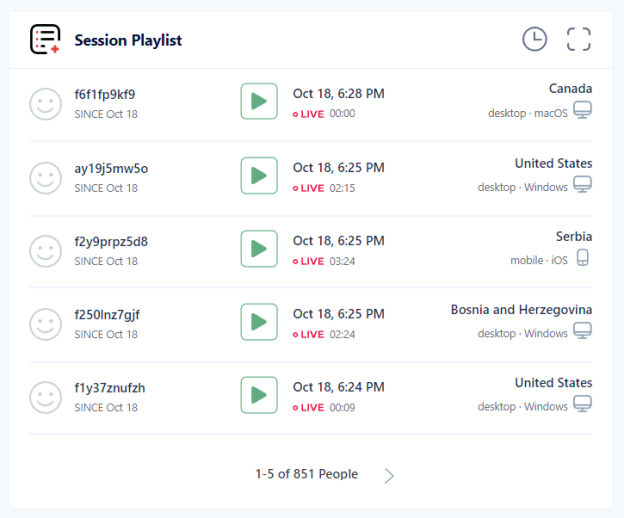
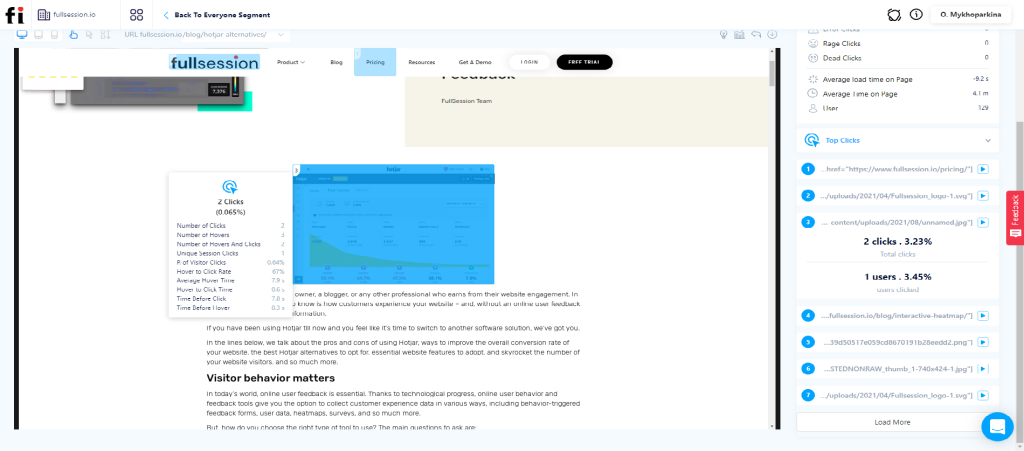
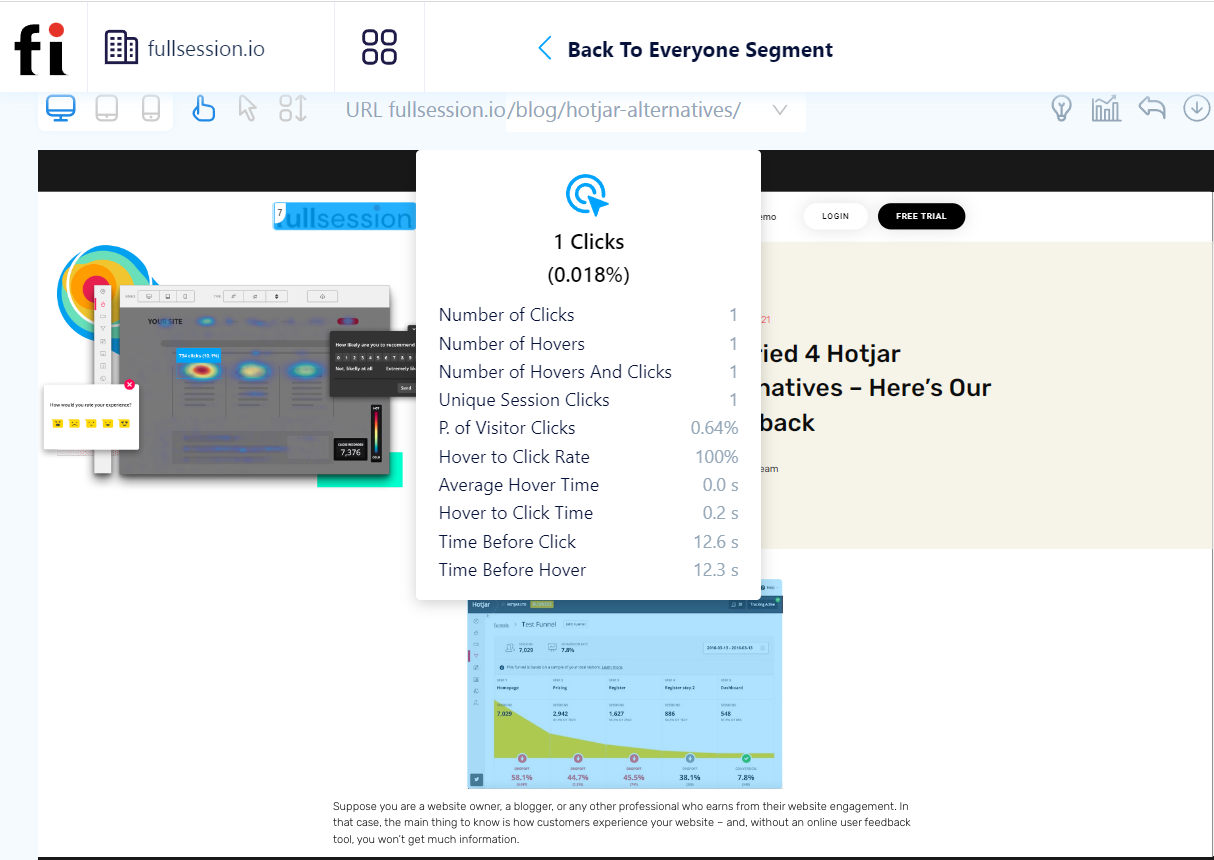
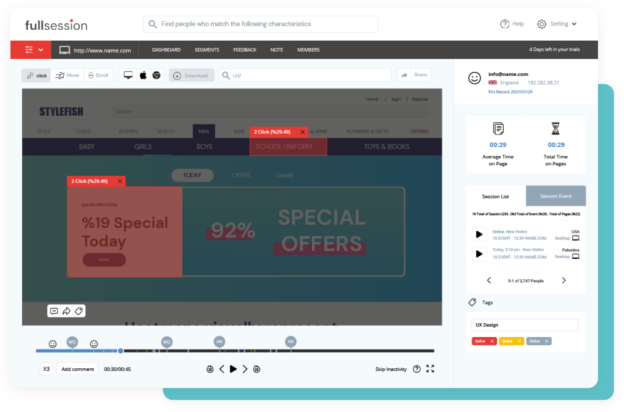
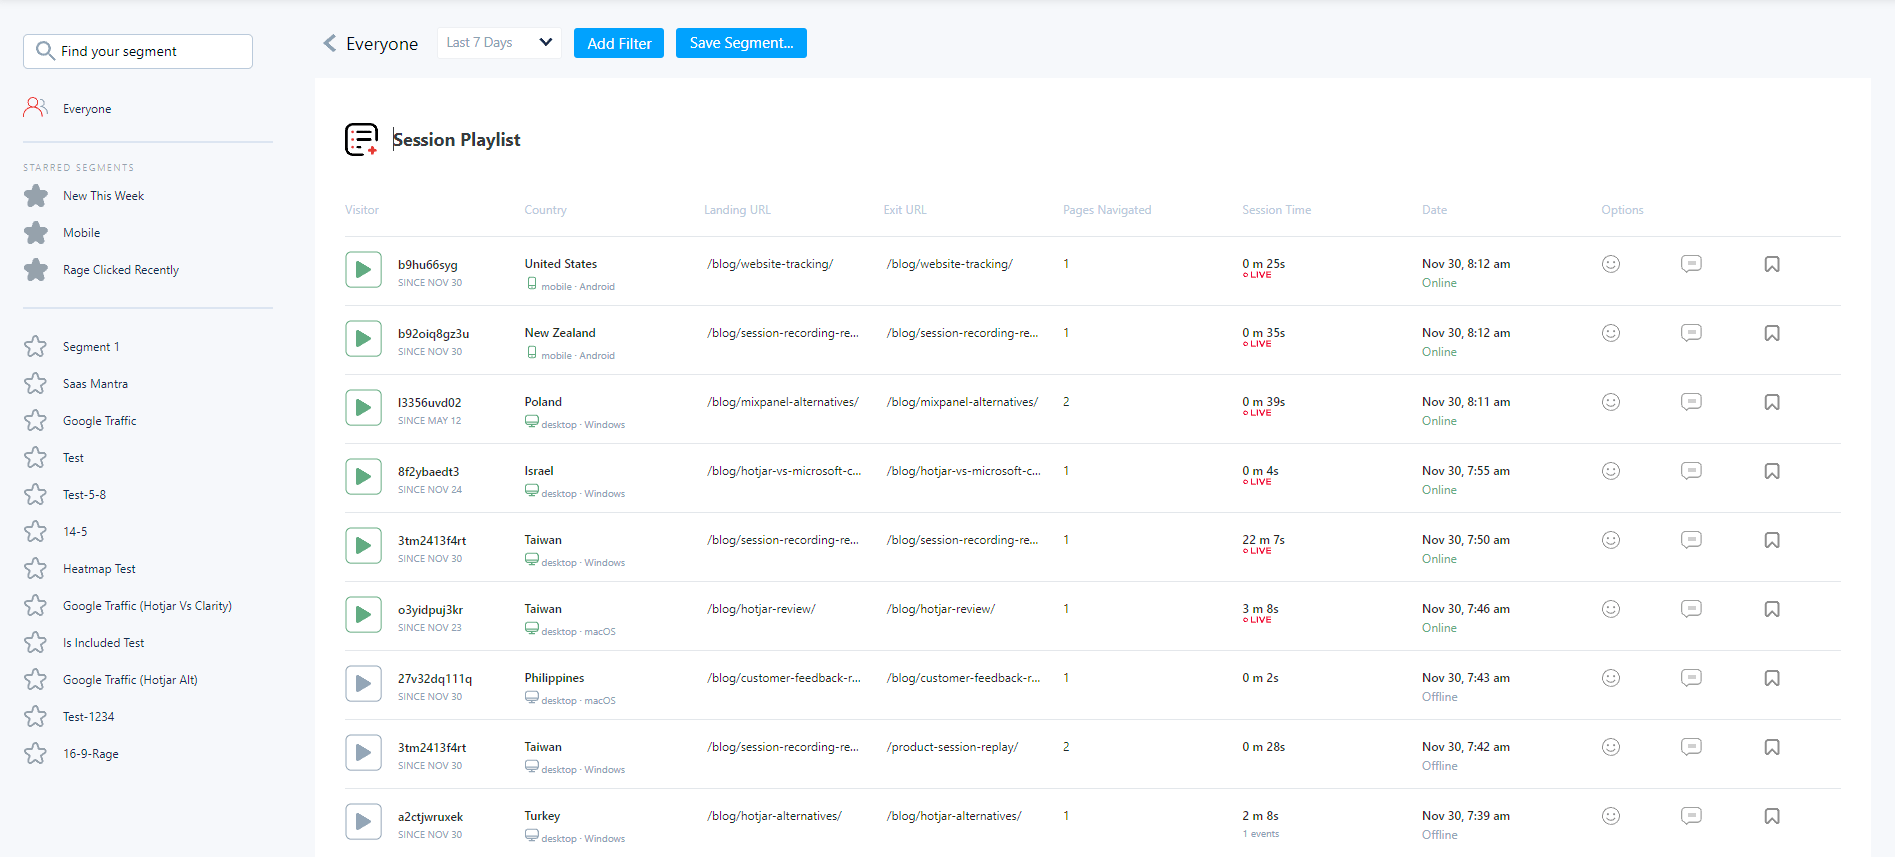
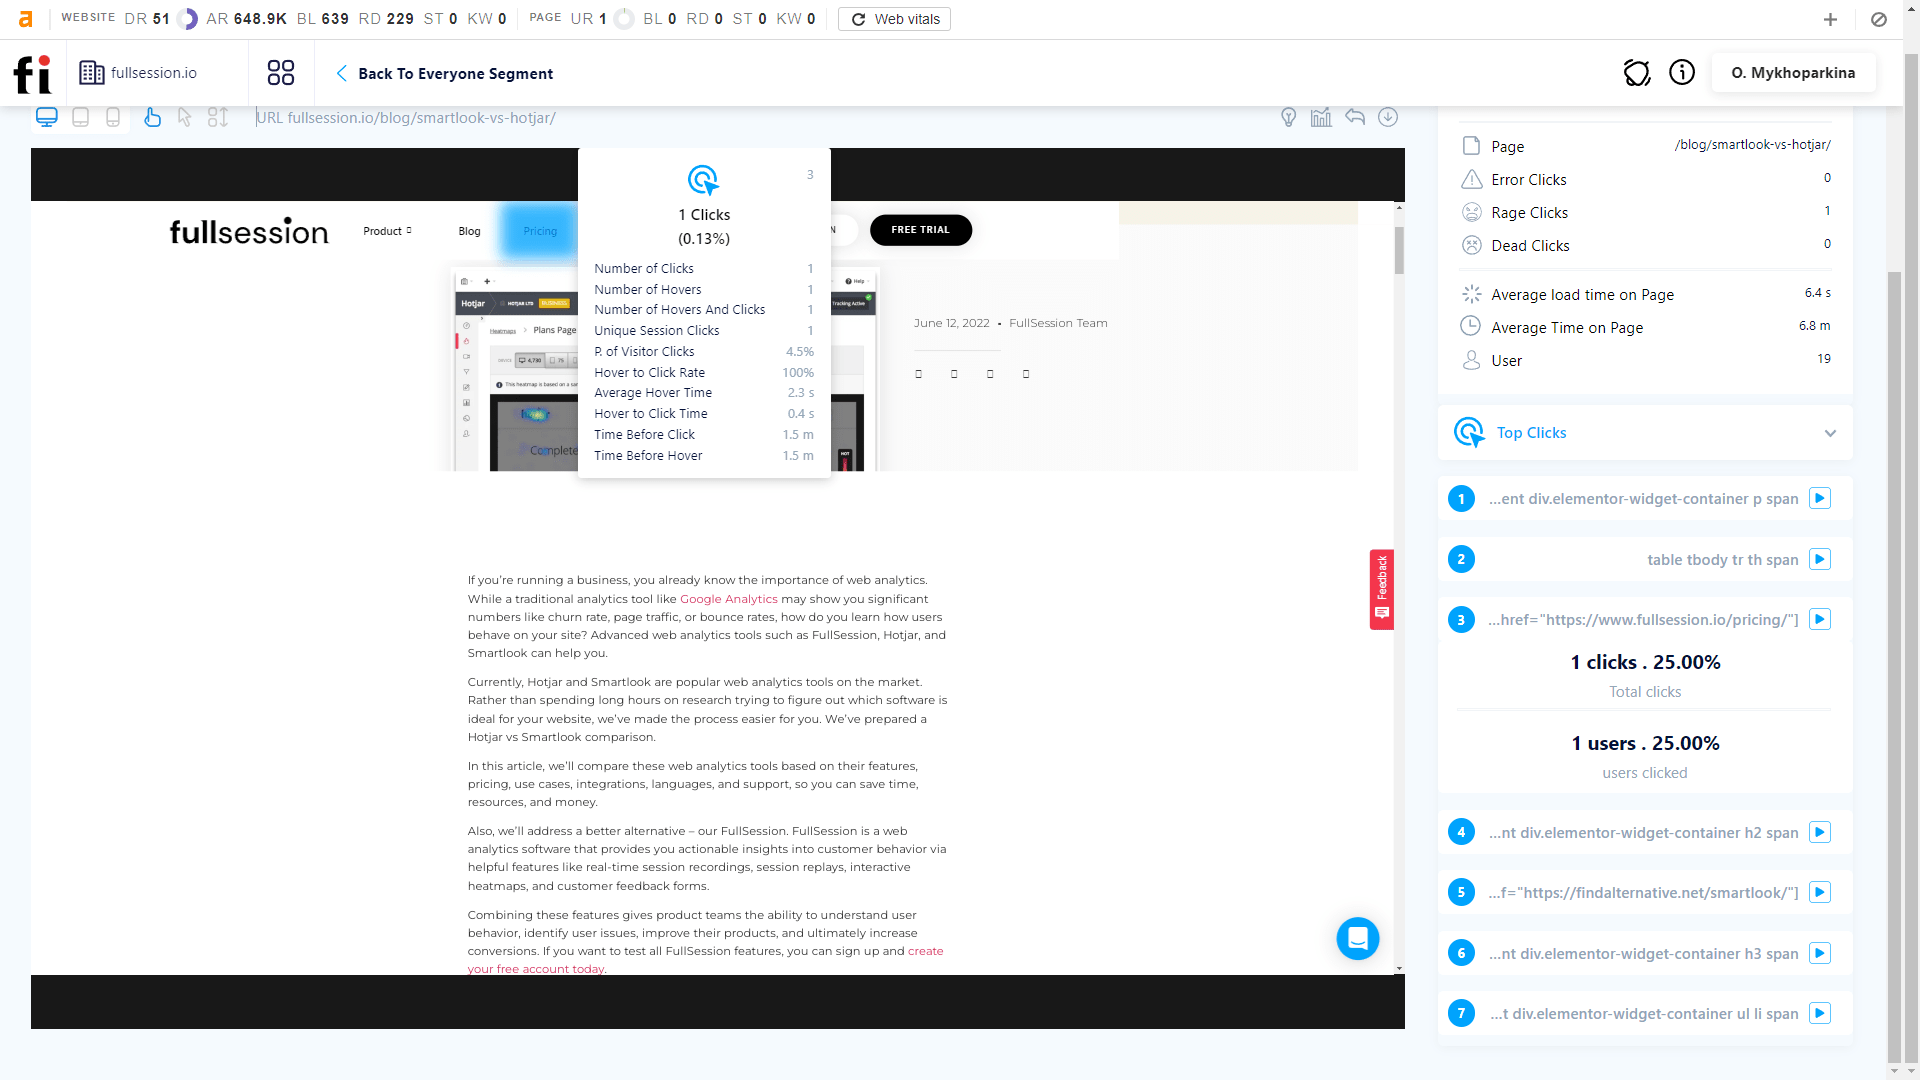
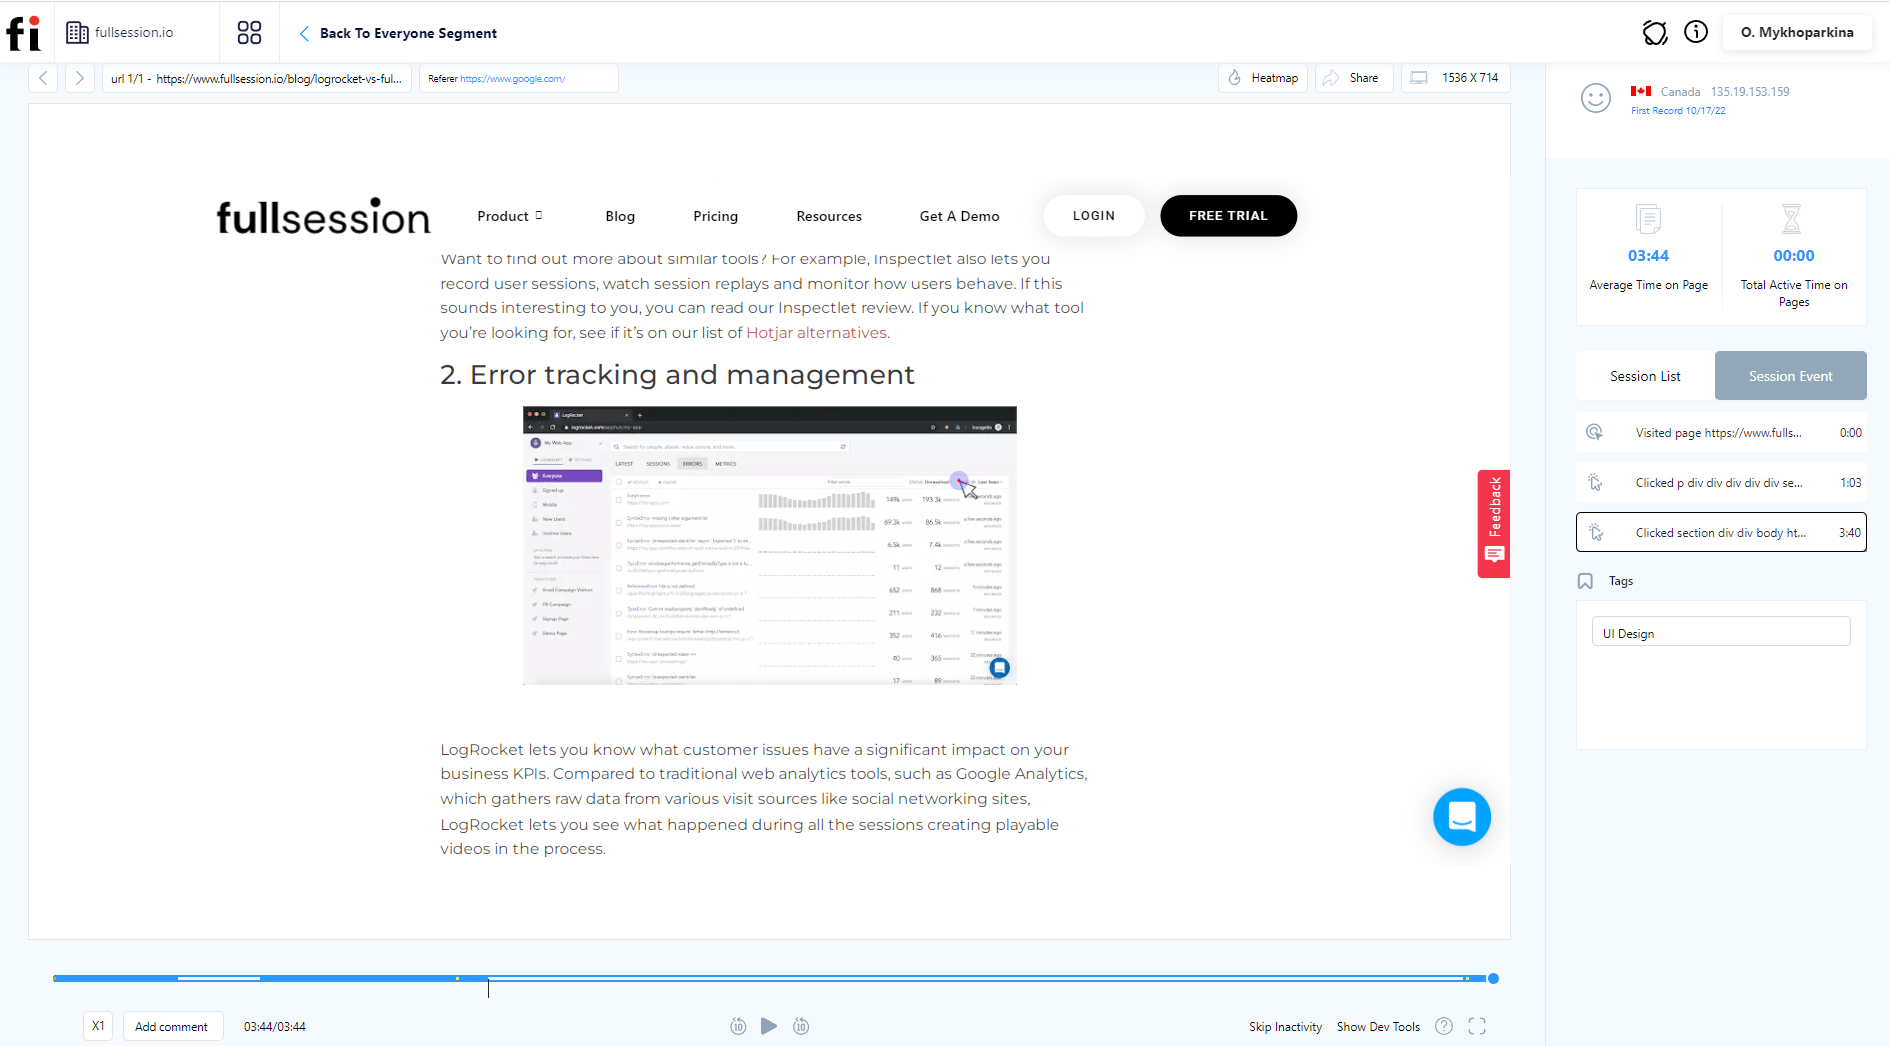
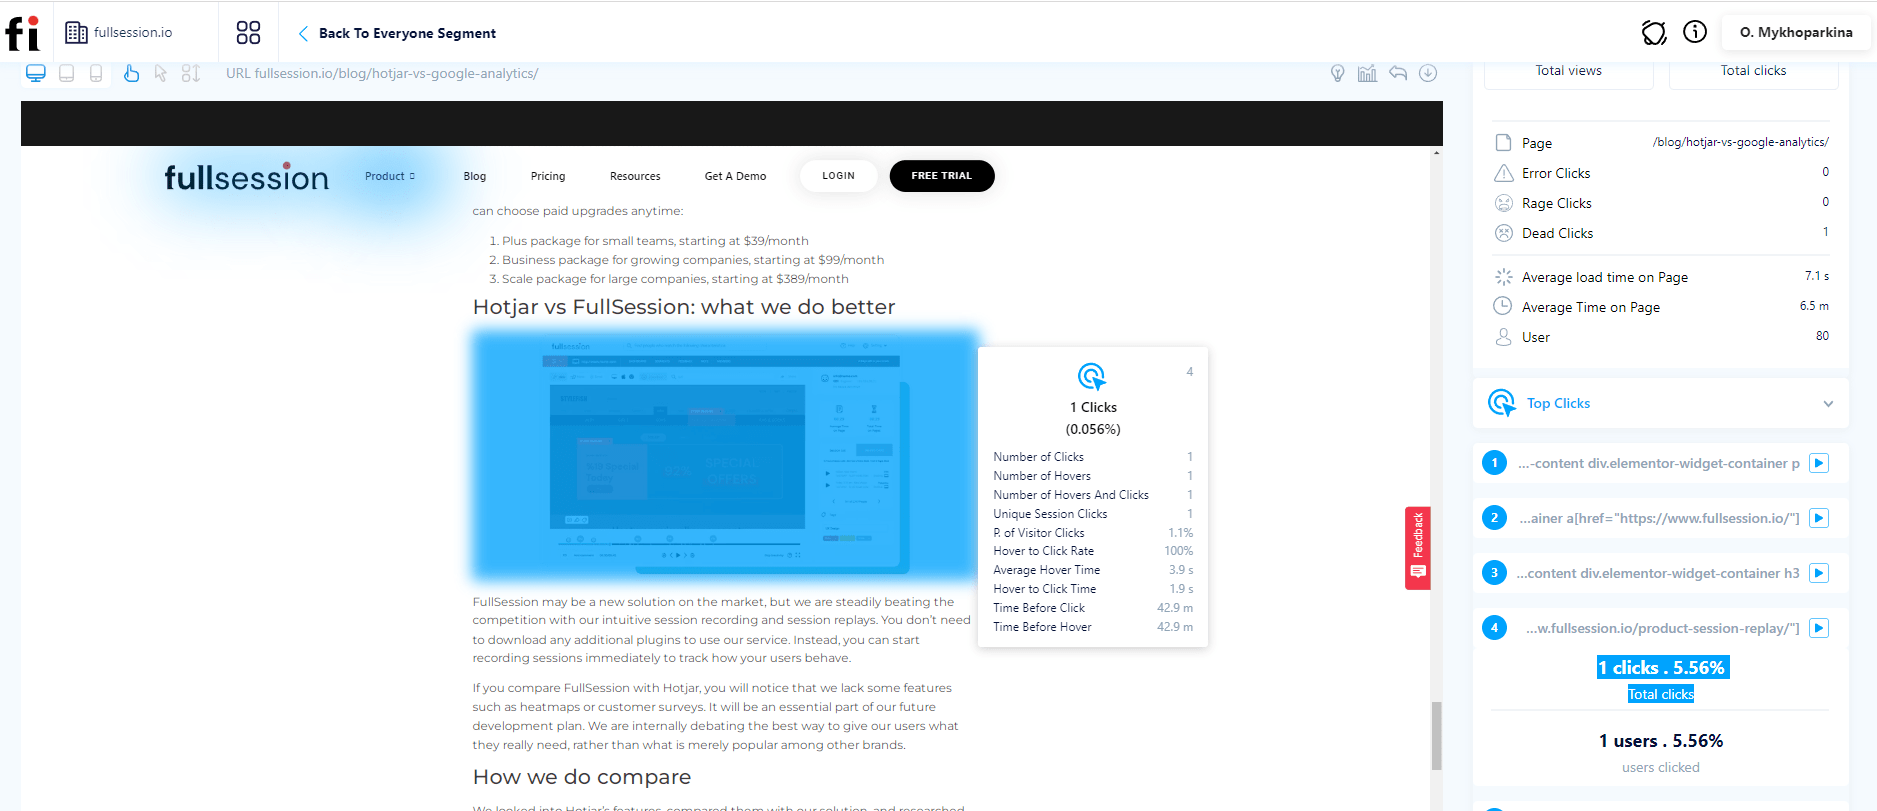
Session recording software provided by FullSession allows you to see the recording of every visitor to your site. Alongside the actual recordings, you get data points to analyze with each user.
Utilizing this tool means you can see the way user’s interact with certain sections of your site, CTA’s, etc. And this is all broken down for you by FullSession’s software using custom analytics like “U-turns” which shows user confusion.
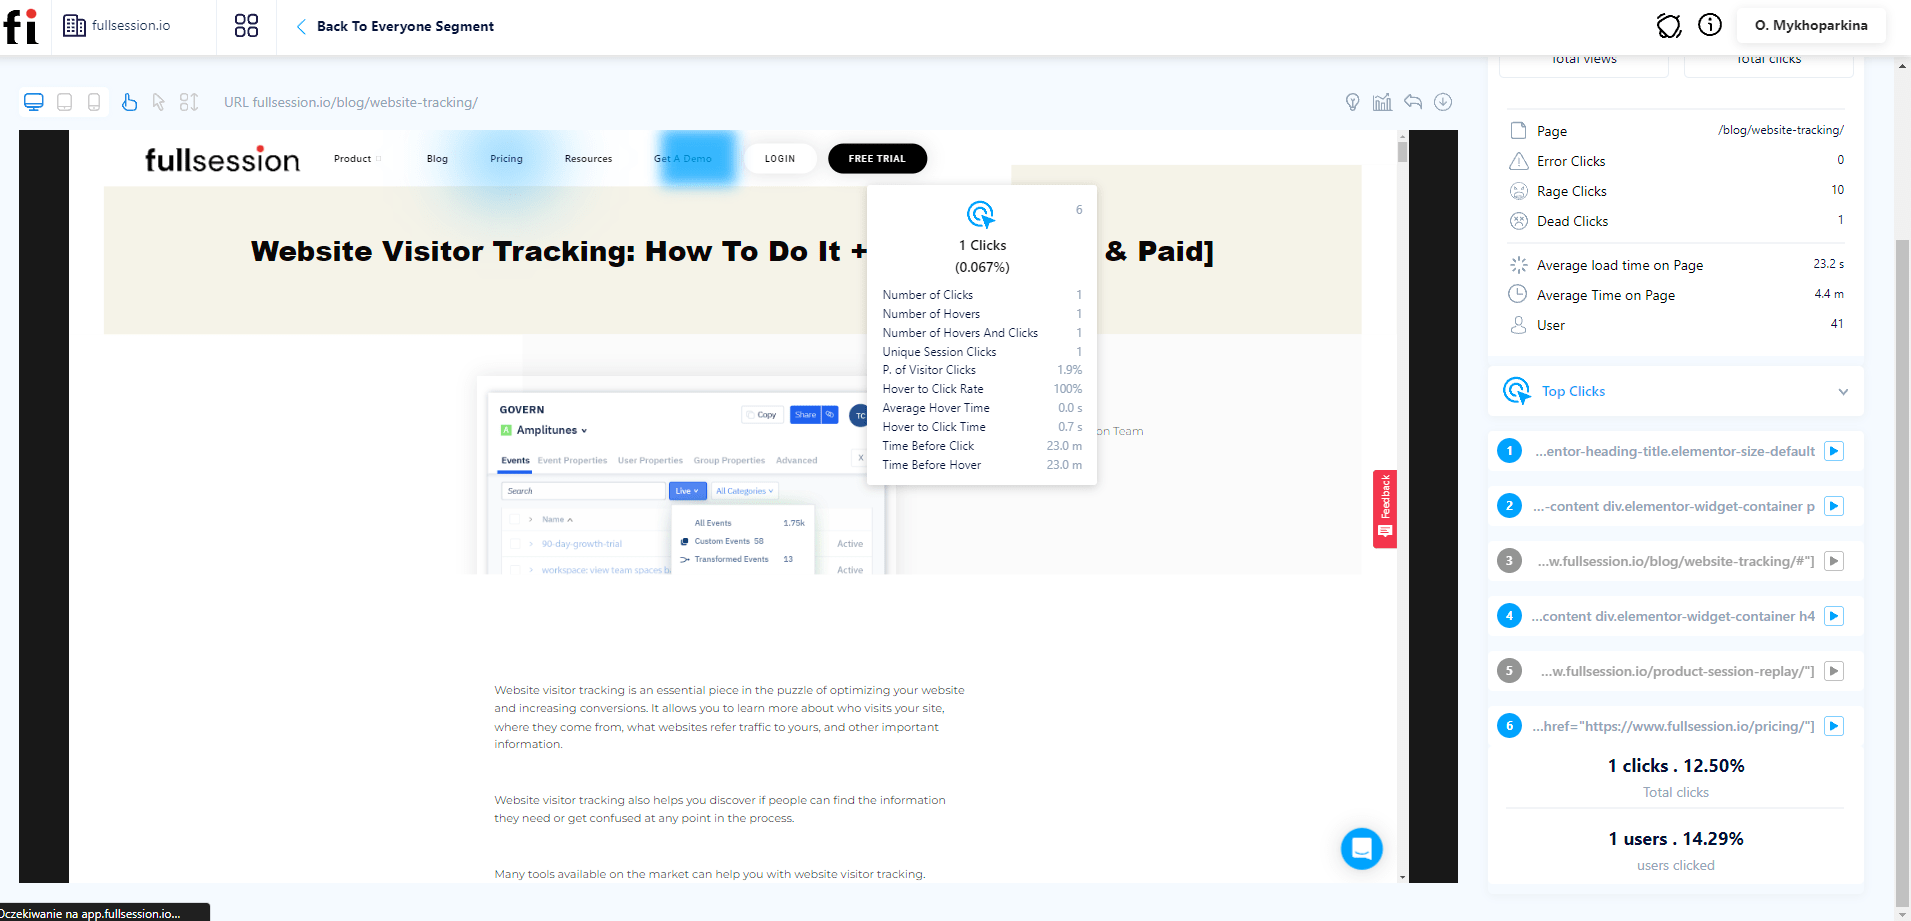
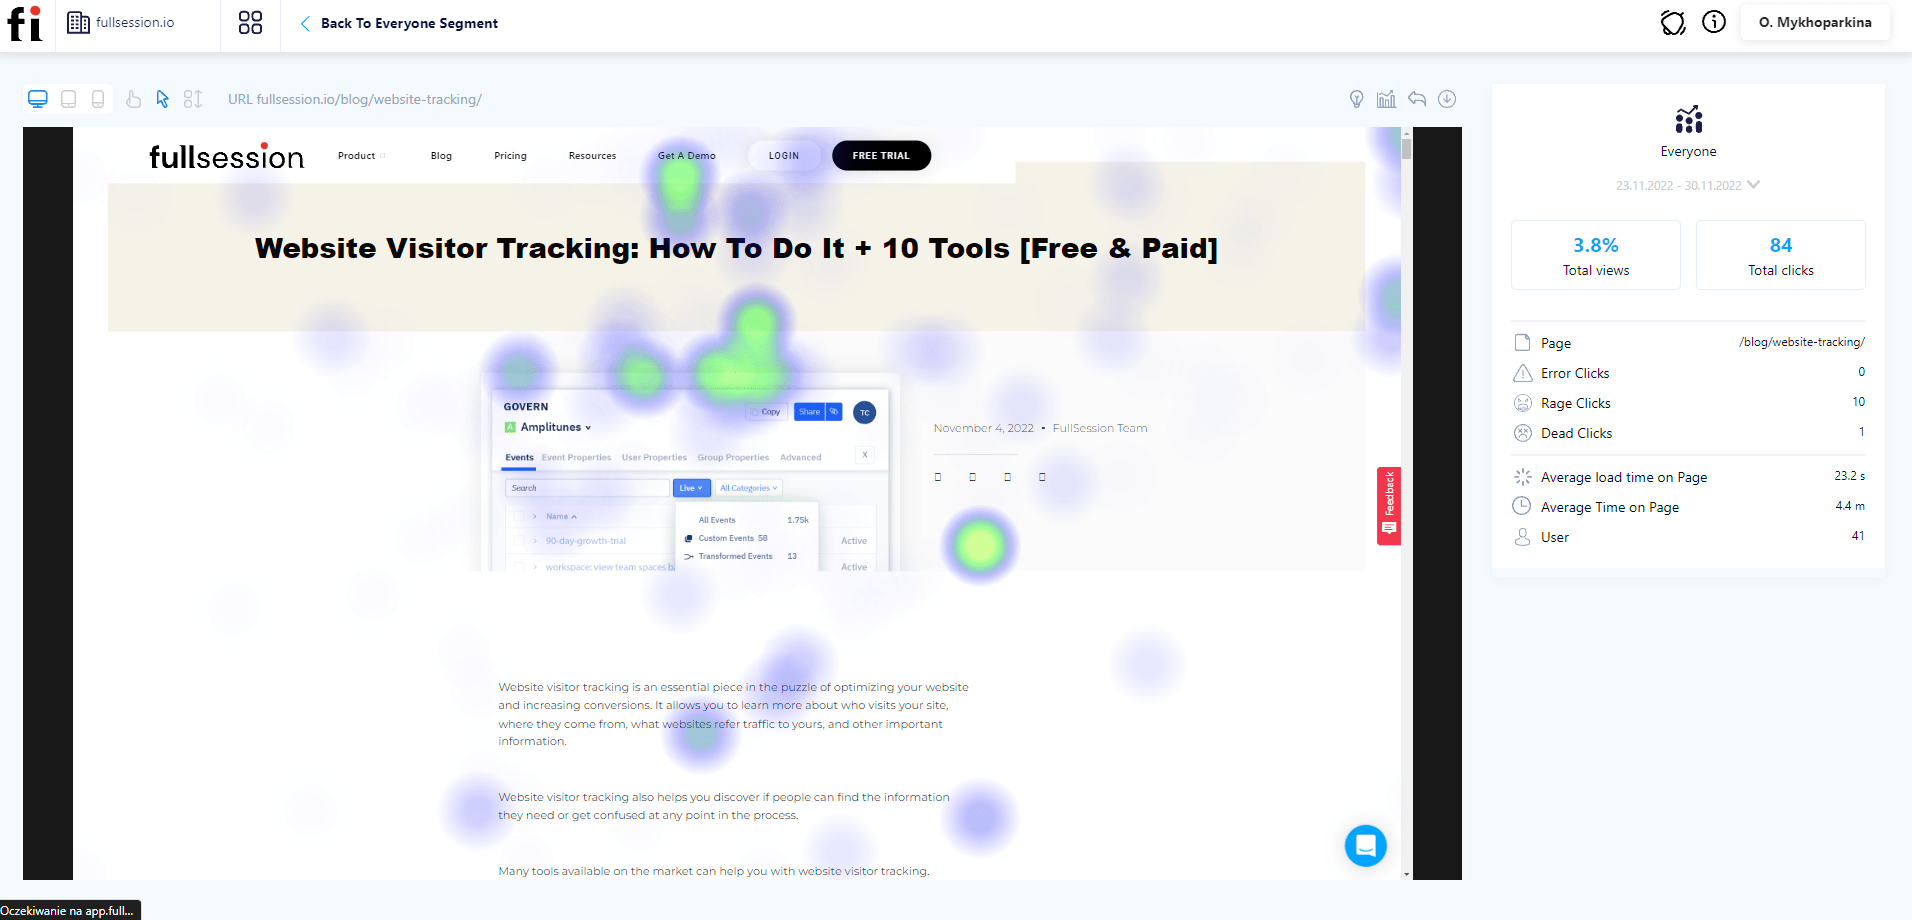
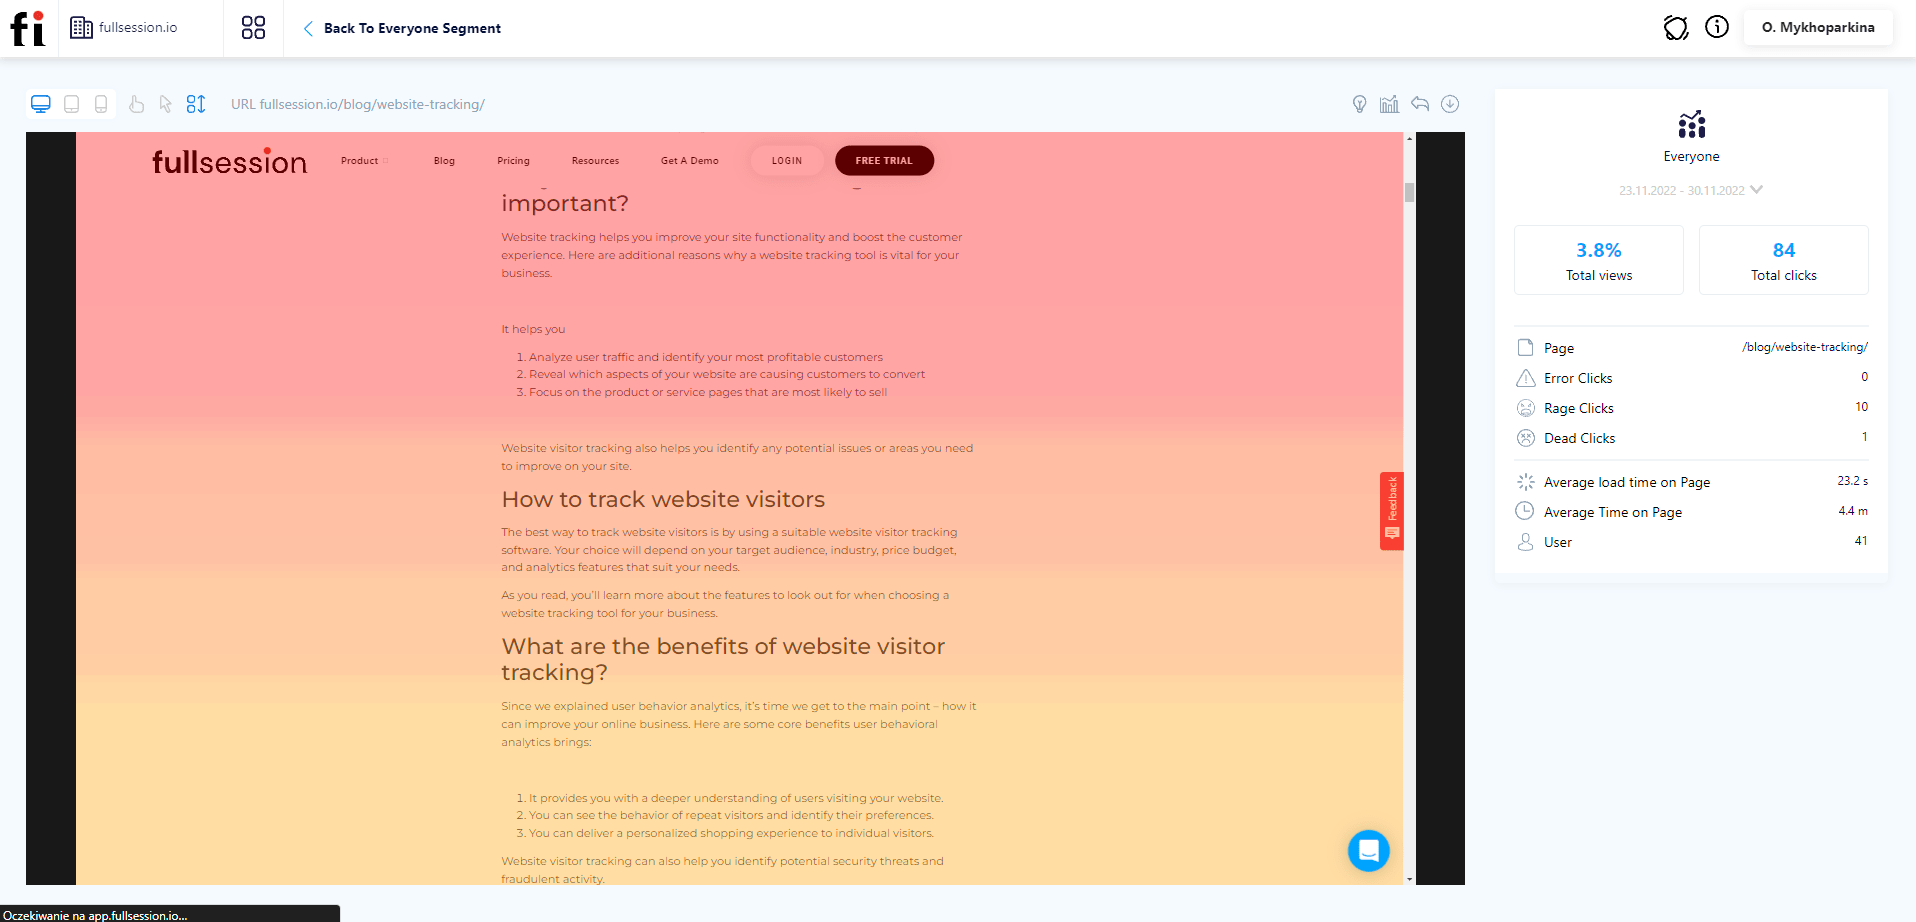
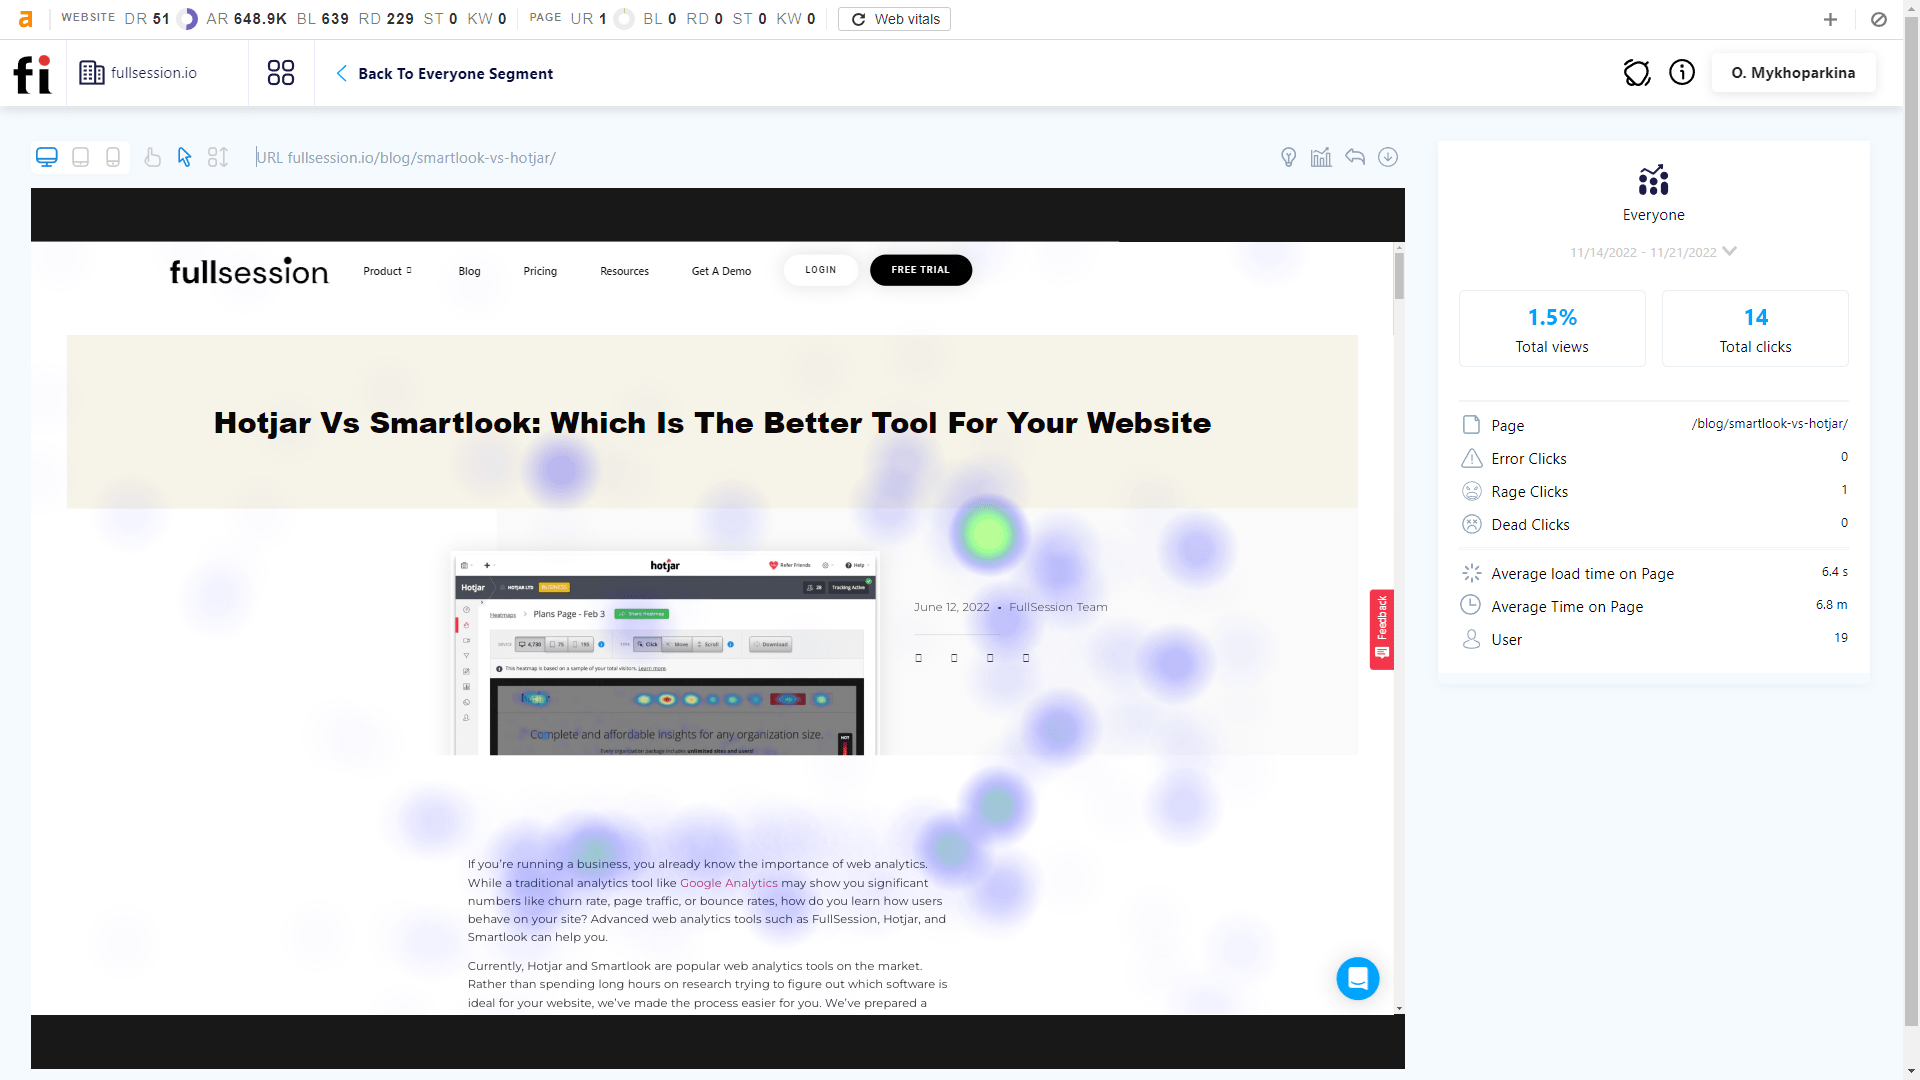
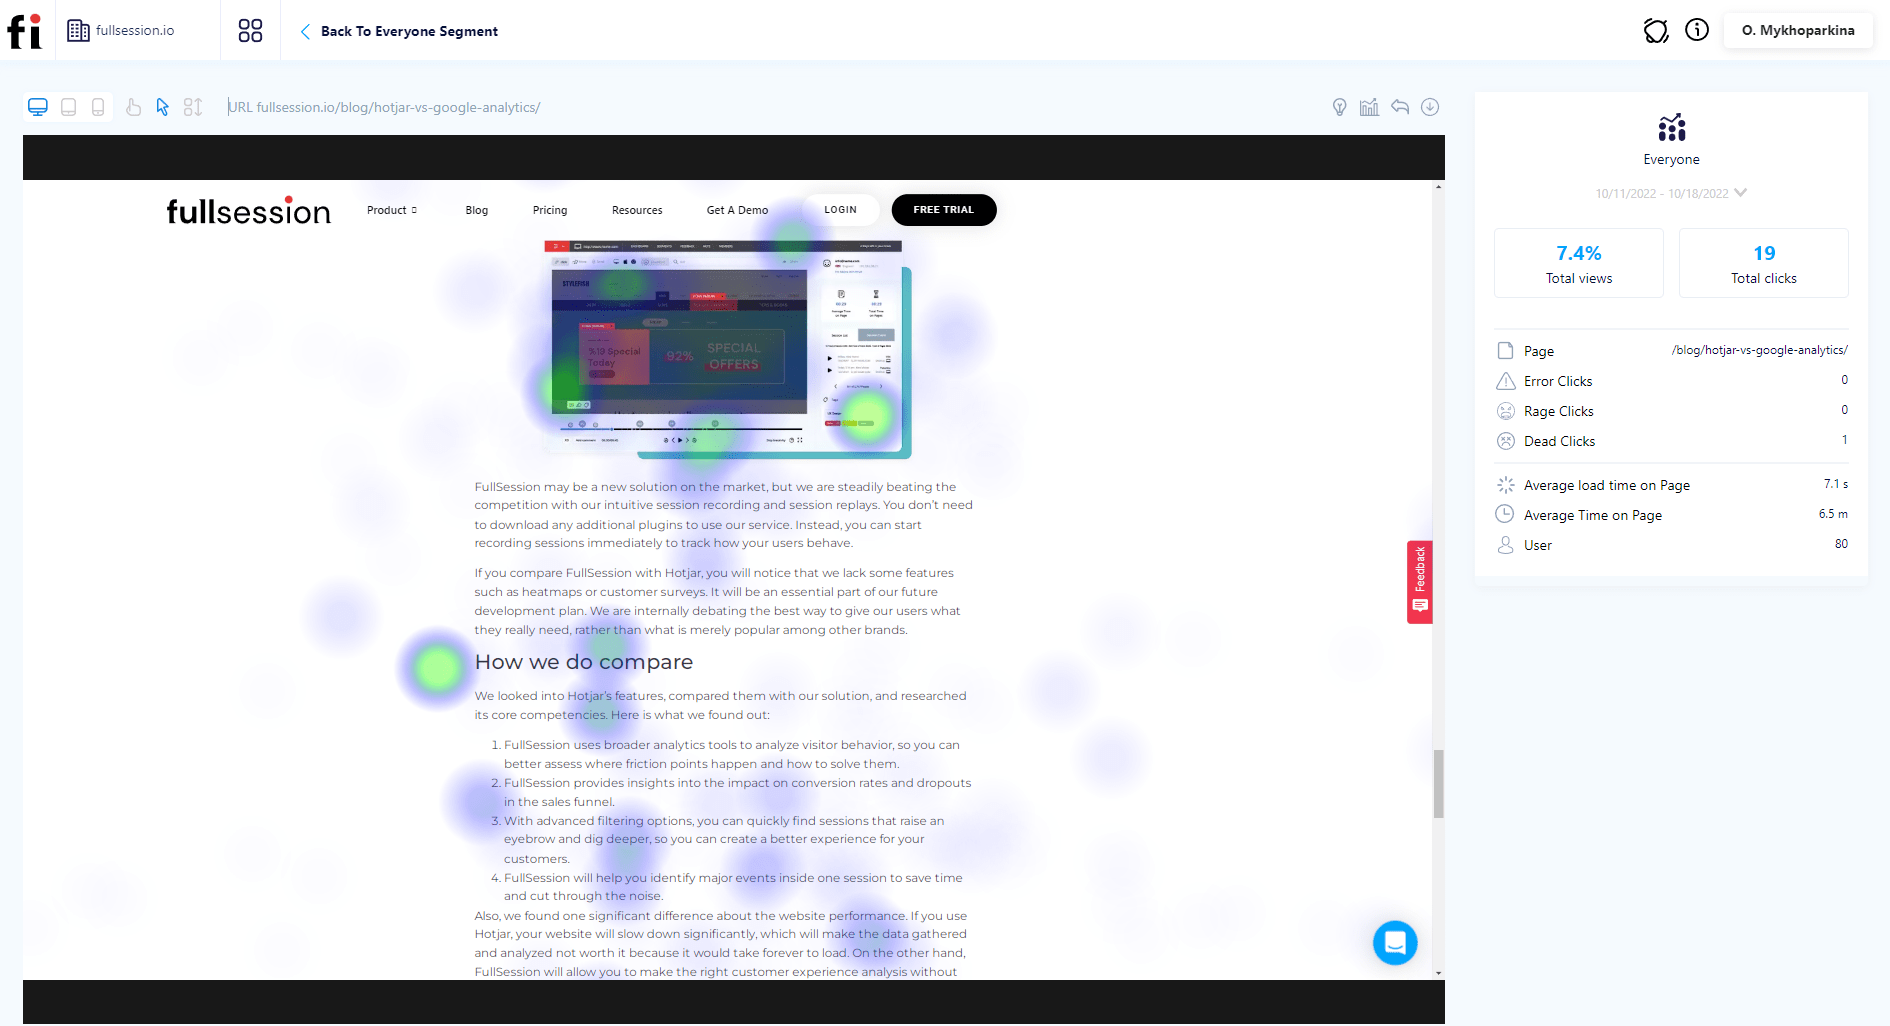
Heatmaps
Heatmaps provided by FullSession take complex data points and create different thermal visuals. There are various types of heatmaps, and these work alongside session recordings. The various types of heatmaps are:
Click Maps
Scroll Maps
Mouse Movement Maps
Learn more about what a heatmap is, and how to best use them to increase conversions.
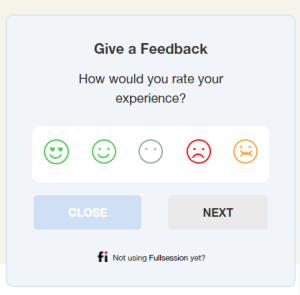
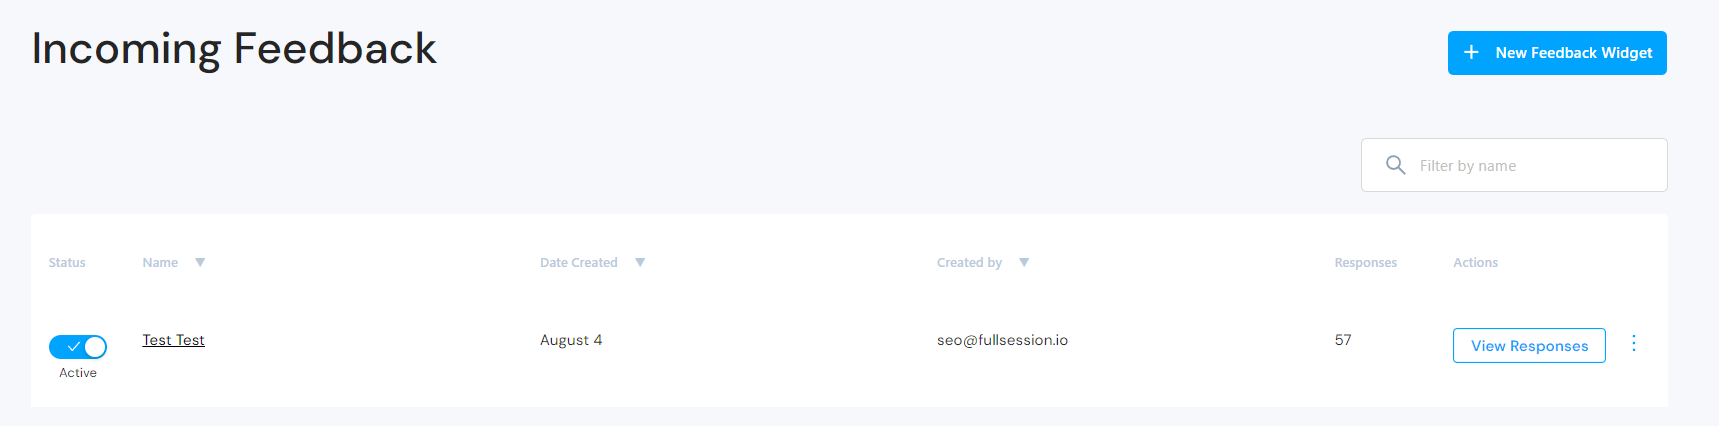
Feedback and Surveys
Feedback surveys help you understand and map the customer journey on your site by surveying customers at any point in their journey. FullSession gives you the flexibility to choose any point in the customers journey to survey them or collect feedback, and with several different methods of distributing them.
A disclaimer to this is, you may need a substantial amount of site visitors to collect effective results for optimizing the customer journey. Although, any amount of survey or feedback responses is valuable.
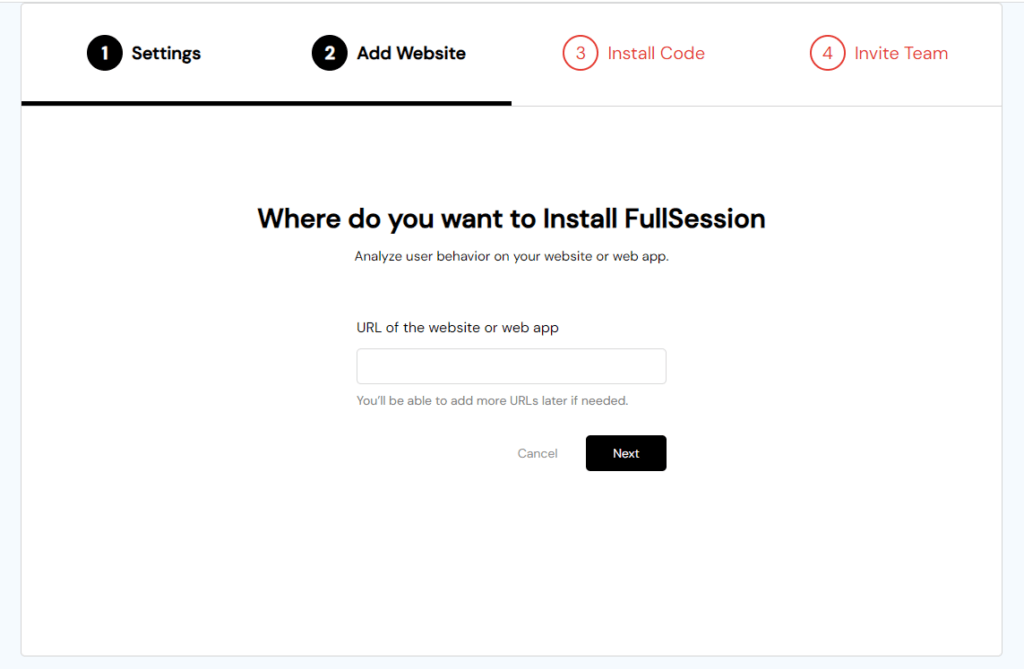
Connect FullSession and Map Your Customer’s Journey Instantly
It takes less than 5 minutes to set up your first website or app, with FullSession, and it’s completely free!
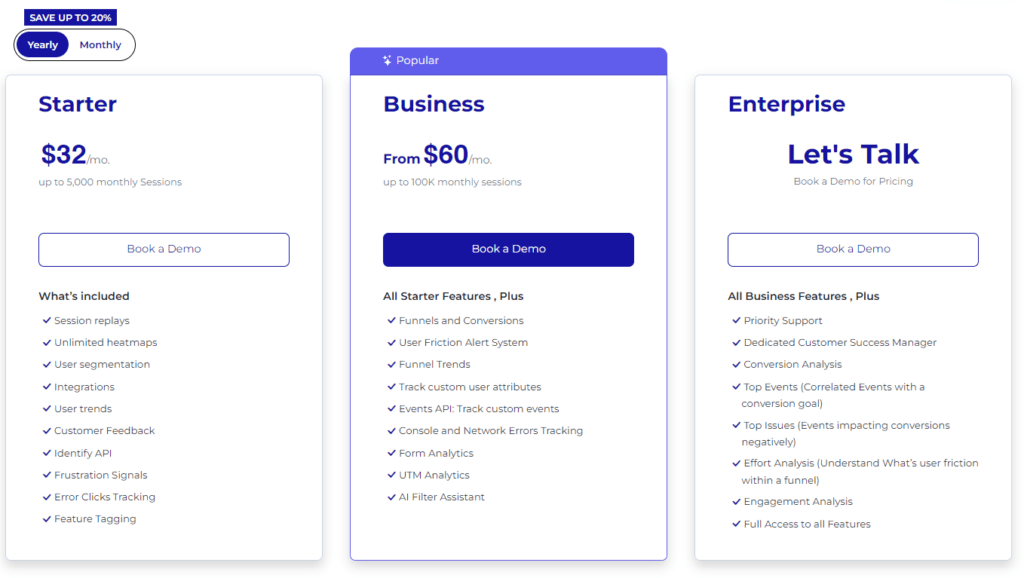
FullSession Pricing Plans
Here are more details on each plan.
The Starter plan costs $39/month or $32/year and allows you to monitor up to 5,000 monthly sessions with up to 6 months of data storage.
The Business plan costs $75/month or $60/year and helps you to track and analyze up to 100,000 monthly sessions with up to 12 months of data storage.
The Enterprise plan has custom pricing and offers customizable sessions plus full access to all features.
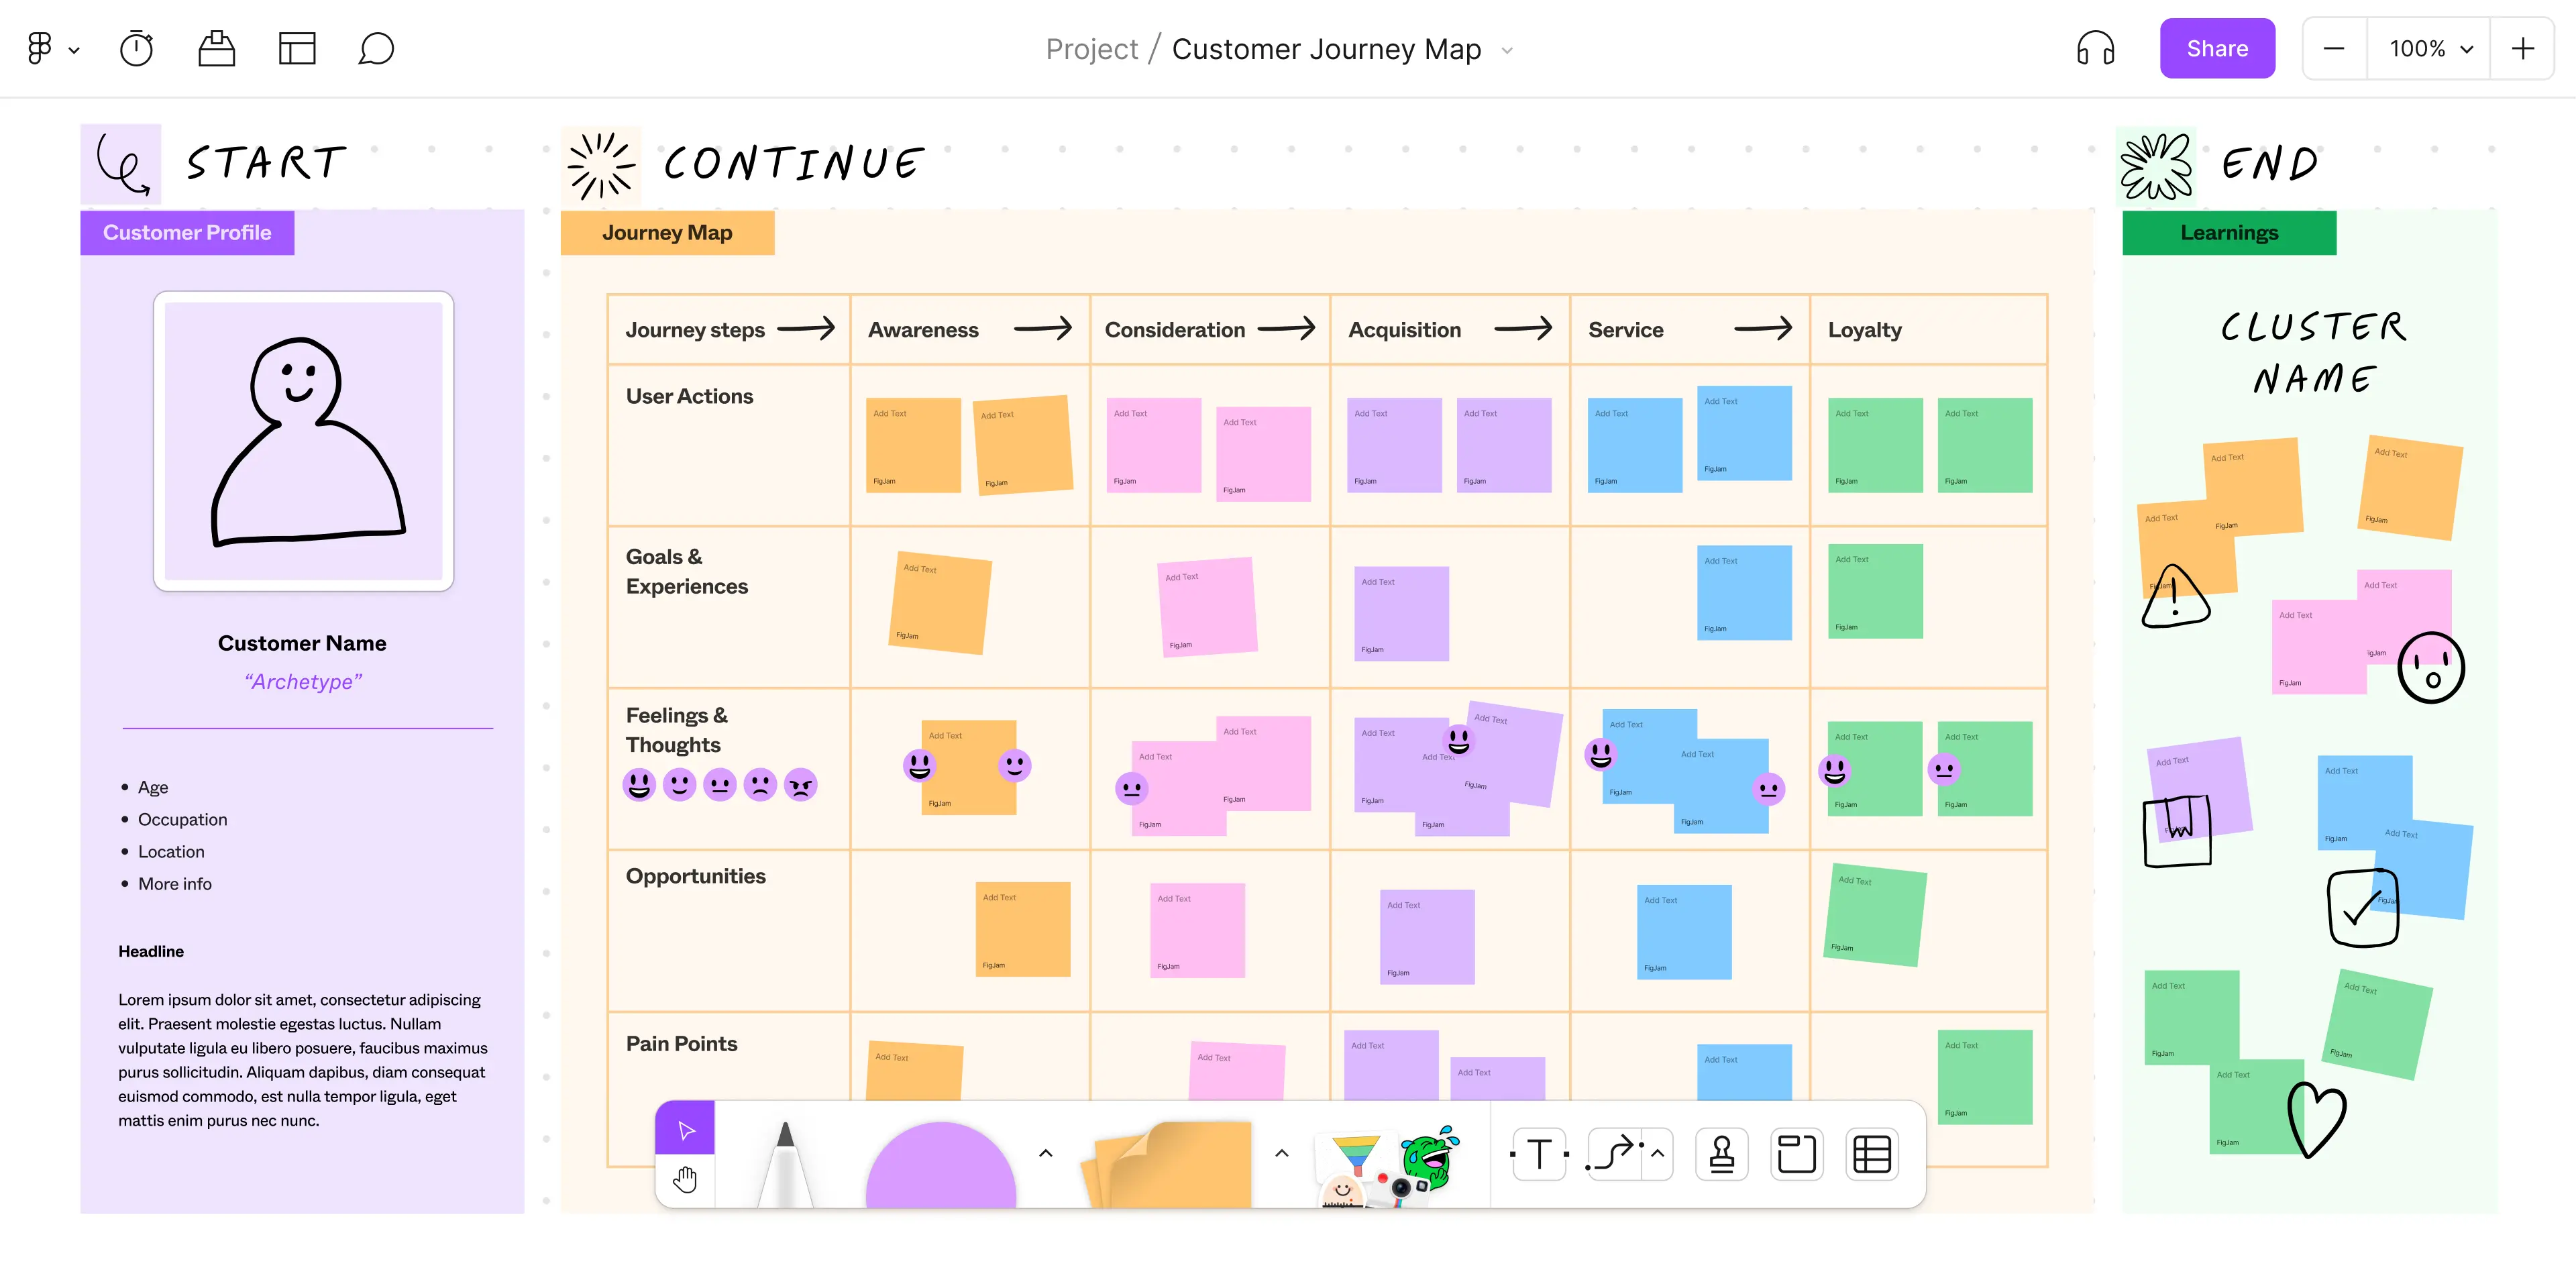
Smaply is a tool is all about visualizing the journey of your customers and mapping out every single touchpoint. Smaply lets businesses craft detailed maps showcasing not just actions but also emotions and thoughts along the way. You can also integrate direct feedback from customers right into these maps to garner a better understanding.
Once you gather enough data around each user, and every action they take, you can start to build personas based on different types of actions, thoughts or emotions.
Smaply Features
Unlike FullSession, Smaply doesn’t offer any external features alongside customer journey mapping, so you’re missing out on tons of data points. This tool is very centric on specifically the ability to map your customers journey.
3. Google Analytics
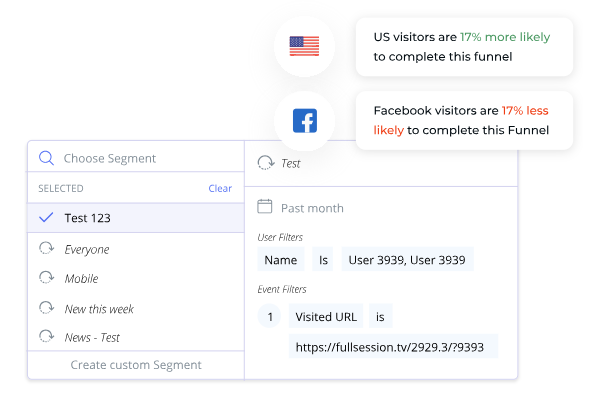
With Google Analytics, you can track how visitors find and use your website, which is key for mapping out their journey. Analytics breaks down where users came from, and other data points. The benefit of Analytics is it has the most up to date and accurate data regarding all of your site URLs.
You can set up parameters and conversion tracking which is necessary for customer journey mapping, since conversions are your end goal.
Here is a full comparison on data points that both Google Analytics and a tool like FullSession provide, but also data points that FullSession provides, and Google Analytics doesn’t.
Click Funnels isn’t tailored towards customer journey analytics, although it does give you great data. The tool is really meant for building a customer journey, with guides, templates and an easy to use software.
You can build every step of a funnel in a more robust way than any other tool. The best way to use Click Funnels is alongside a tool that will give you the data points and analytics after the funnel is built. A tool like FullSession seamlessly integrates with Click Funnels for example, since you just connect Click Funnels to your domain, FullSession can track your data right on your funnel.
Once you have this data, Click Funnels is the best tool to act on that data, and optimize your customer journey.
When it comes to customer journey mapping, Lucid Chart stands out for its flexibility and UI. This is strictly a tool designed to map the journey, otherwise known as the flow. Lucid Chart has conducted a way to diagram any type of flow, in a very seamless way, allowing team collaboration and a really good looking UI.
Drawing the line from point A to B in your customer’s journey should be as easy as clicking an dragging.
Figma gives you the ability to design unlimited layouts and prototypes for your customer journey. It’s a design tool that lets you map out essentially anything you want in any way, shape or form.
As far as increasing conversions, using Figma alongside an analytics tool that tracks real time customers, you can consistently map out new ideas and strategies, and do it as a team, collaborating on the same design all within Figma.
In addition to implementing a new Figma design into the user journey, strategizing the mapping and design within Figma itself is also possible to do with a team.
7. FlowMapp
FlowMapp is a tool that helps visualize the big picture of your user’s experience in a good looking software. They give you the ability to build a user flow, this allows you to simulate the flow on your site a user might take.
Once you build out your user flow, you can visualize exactly how you should create your UX based on getting customer satisfaction.
Using a tool like FlowMapp and FullSession at the same time, gives you a way to analyze how users react to certain UX changes, while also giving you a way to strategize those UX changes.
Visualize the Complete Customer Journey
Capture every user interaction in real-time using our user behavior analytics software..
Before. you can efficiently analyze data, you need to define your user personas. You’ll need to use tools that give you a multitude of data points at different steps in your user’s journey. Two tools that do this effectively are FullSession and Smaply.
2. Identify touchpoints
Next, pinpoint every step that customers interact with your brand. Touchpoints are moments that will change outcomes in a customer journey, if changed.
3. Identify customer goals
Understanding the goal of a customer can be determined using conversion tracking tools. If you don’t have the right CTA’s in the right places, nobody is going to convert, this is called buying intent. You have to match your customers buying intent.
4. Evaluate the customer’s experience
This is where you take the time to understand customer experiences. This process is easily done using Heatmaps, tracking rage clicks, frustration and confusion from the user.
5. Map out the customer flow
Once you have all of the data about your funnel or customer journey, this is your time to map it all out. Once you map it out, you now have the ability to work things around and put new versions back to the test.
6. Test new flows
Your final step is to put new user flows to the test, based on your new map, and all of the “negative data” you found.
FAQs in Relation to Customer Journey Mapping Tools
What is a customer journey map tool?
A customer journey map tool sketches the route customers take, highlighting interactions and feelings with your brand.
What is a good customer journey map?
An effective map nails accuracy in user flows, brims with insights on pain points and peaks at key experiences.
What are the 6 steps to customer journey mapping?
1. Define user personas, 2. identify touchpoints, 3. identify customer goals, 4. evaluate the customer’s experience, 5. map out the customer flow, 6. test new flows
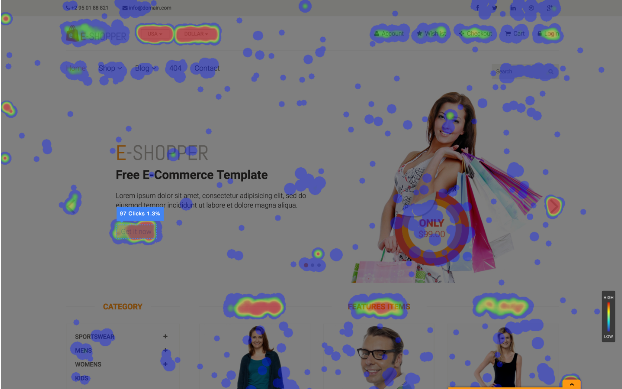
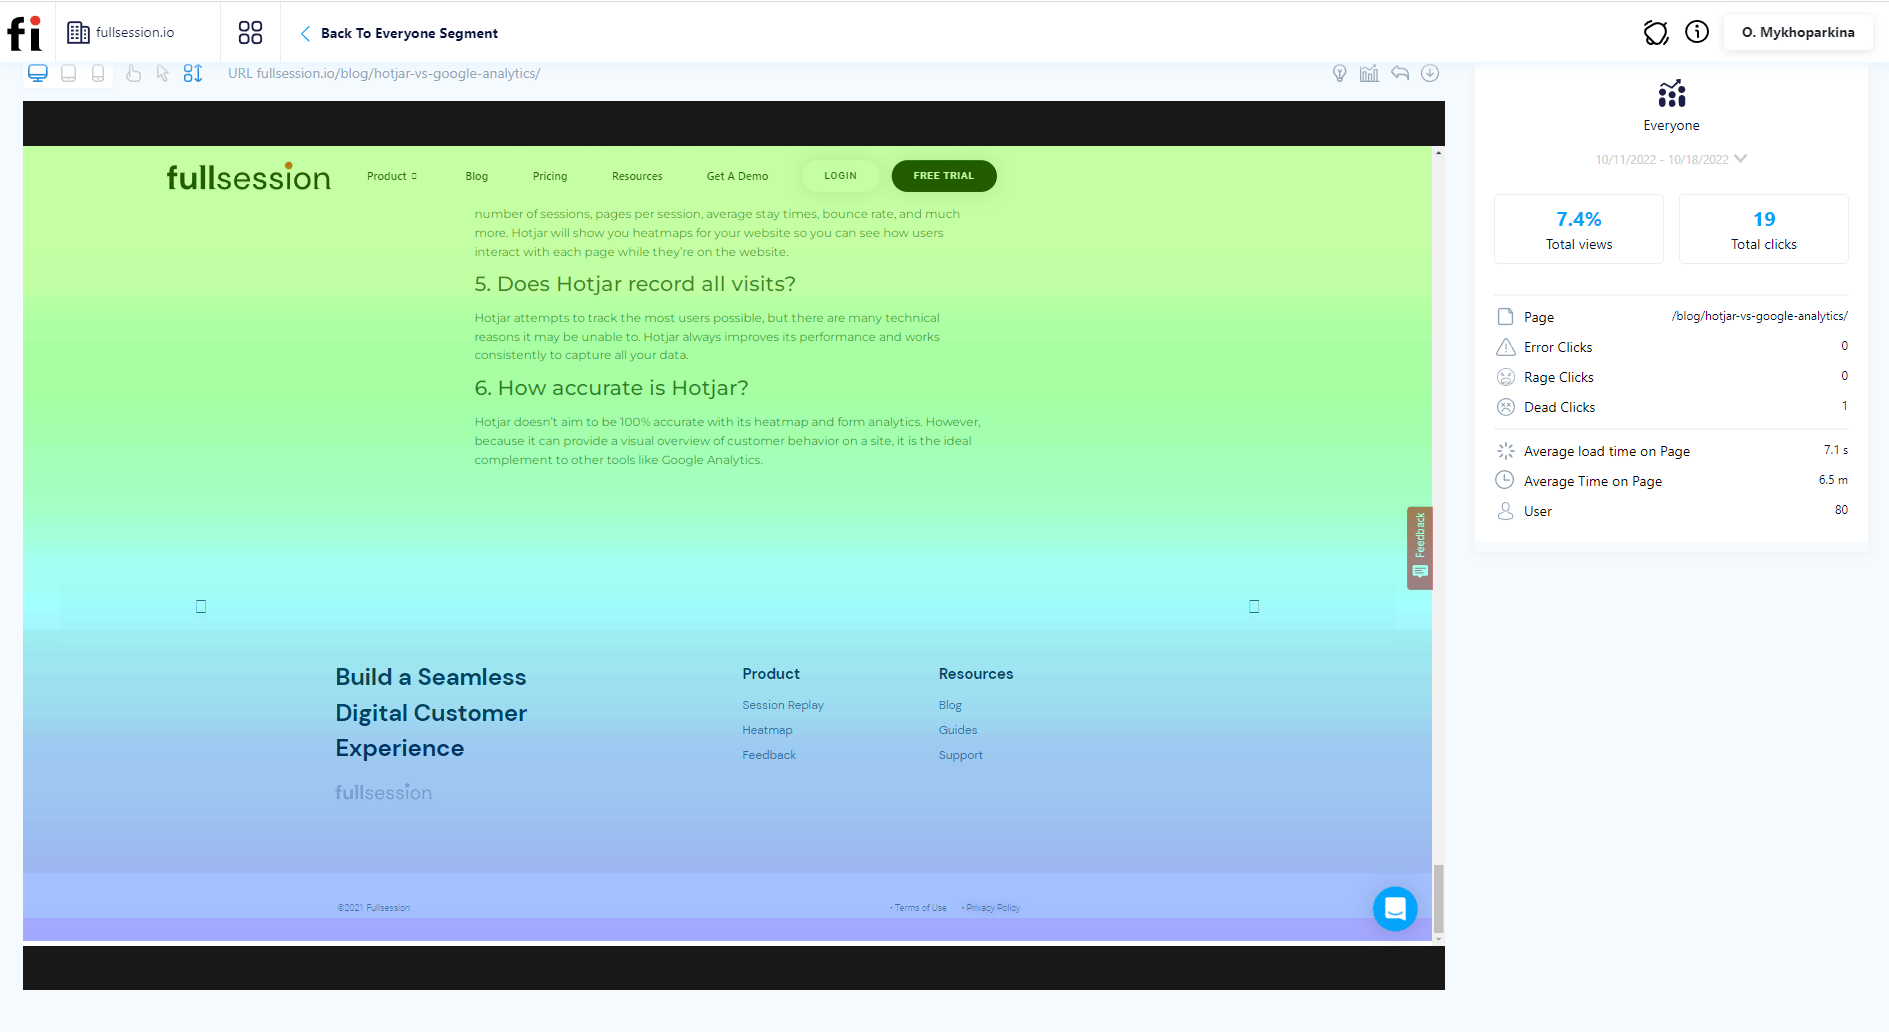
Heatmaps are a tool used to take complex data, and give you the ability visualize different ways user engage with your site based on that data. There are different types of website heatmap tools that portray different data points.
Below, we’ll dive deep into each type of heatmap, what their purpose is and how to use them effectively to increase conversions.
Types of Heatmaps
Scroll Maps
Scroll maps let you visualize your site visitors’ scrolling activity on your site. Using data from a scroll map, you can view how many visitors scroll to each depth of your page.
This data allows you to understand what section of your page most users drop off, which needs optimization. For example, you may get a report stating that 80% of users drop off at 3/4 page depth. This means that you need to optimize the section of that page, about 3/4 the way down.
Scroll maps are easy to read. The color visualization showcases hotter colors over the section of your page that has retained the most visitors, cooler colors as more visitors drop off.
Click Maps
Click maps showcase where your site visitors are clicking the most. These places on your site are portrayed as hot zones.
This data helps you understand which parts of your site are going unnoticed. For example, a certain CTA button might have a relatively low amount of clicks, which gives you insight into what to optimize.
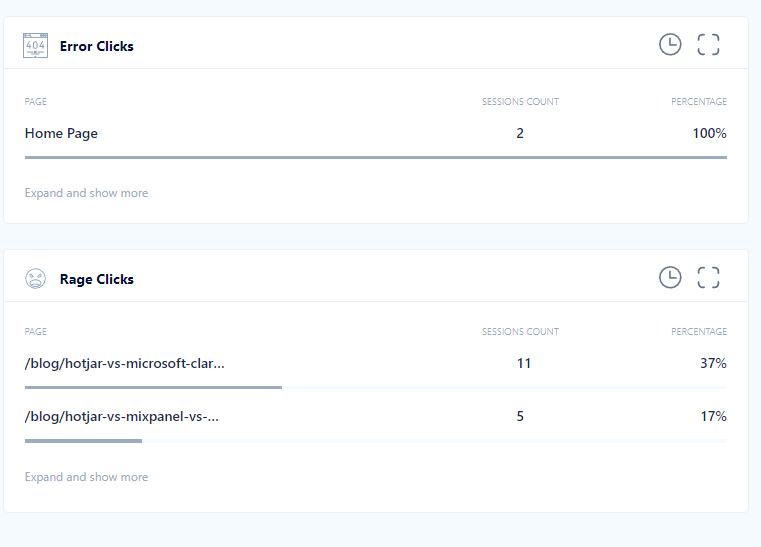
Alongside conversion rate optimization, click tracking also points out error clicks, dead clicks and rage clicks. These types of clicks work as a notifier of places on your site that need fixing.
Click maps also provide data and analytics alongside the visual aspect. This allows you to overview the data with the hot zone perspective, but then dive deeper into each section of your page.
Mouse tracking heatmaps, also known as mouse movement heatmaps track mouse movements made by your site visitors. This type of data gives you insight into areas of your site that cause frustration or impatience from the user.
Utilizing mouse tracking alongside the rest of the click tracking tools really wraps everything together. Visualizing where users click is one thing, but mouse movement visualization tells you how they got from click to click, and if there were any bumps along the way.
Here is a full breakdown of all of the types of heatmaps you can utilize on your site.
Benefits of Using Heatmaps
Optimizing Conversion Rates
The only way to increase your website conversion rate is through running a UX audit. A proper UX audit gives you real insight into the way users interact with your site, rather than just playing a guessing game.
Heatmaps are a huge factor in running a UX audit. They take casual data and analytics about your site, and create a visual on it. This benefits you by giving your data a human understanding and a physical element.
As a bonus, heatmaps also give you insight into usability issues. And as we know, sometimes these usability issues that go unknown, may hurt your conversion rate by 5-10%.
Analyzing Non-Clickable Elements
Think about those moments when users hover over something that looks clickable but isn’t, leading to confusion and frustration. Heatmap tools are brilliant at spotting these design flaws.
For example, you may find that users are clicking furiously on images and areas thinking they were CTAs or navigation buttons. Once you realize this through your heatmap data, you can feed in to the sentiment, and suddenly those dead zones turn into conversion gold mines as clicks translated directly into action.
Identifying Bounce Rates and Exit Points
Detective work gets real when studying bounce rates through heat maps display capabilities. By tracking mouse movements and seeing how far down users scroll before dropping, we get insights which help us adjust content placement so everything valuable is seen quicker by more users.
How to Install a Heatmap Using FullSession
It takes less than 5 minutes to set up your first heatmap, with FullSession, and it’s completely free!
FullSession Pricing Plans
Here are more details on each plan.
The Starter plan costs $39/month or $32/year and allows you to monitor up to 5,000 monthly sessions with up to 6 months of data storage.
The Business plan costs $75/month or $60/year and helps you to track and analyze up to 100,000 monthly sessions with up to 12 months of data storage.
The Enterprise plan has custom pricing and offers customizable sessions plus full access to all features.
FullSession provides all of the heatmap tools we discussed in this article. Unlike other heatmap softwares, you also unlock a full suite of valuable tools to boost your optimization campaign.
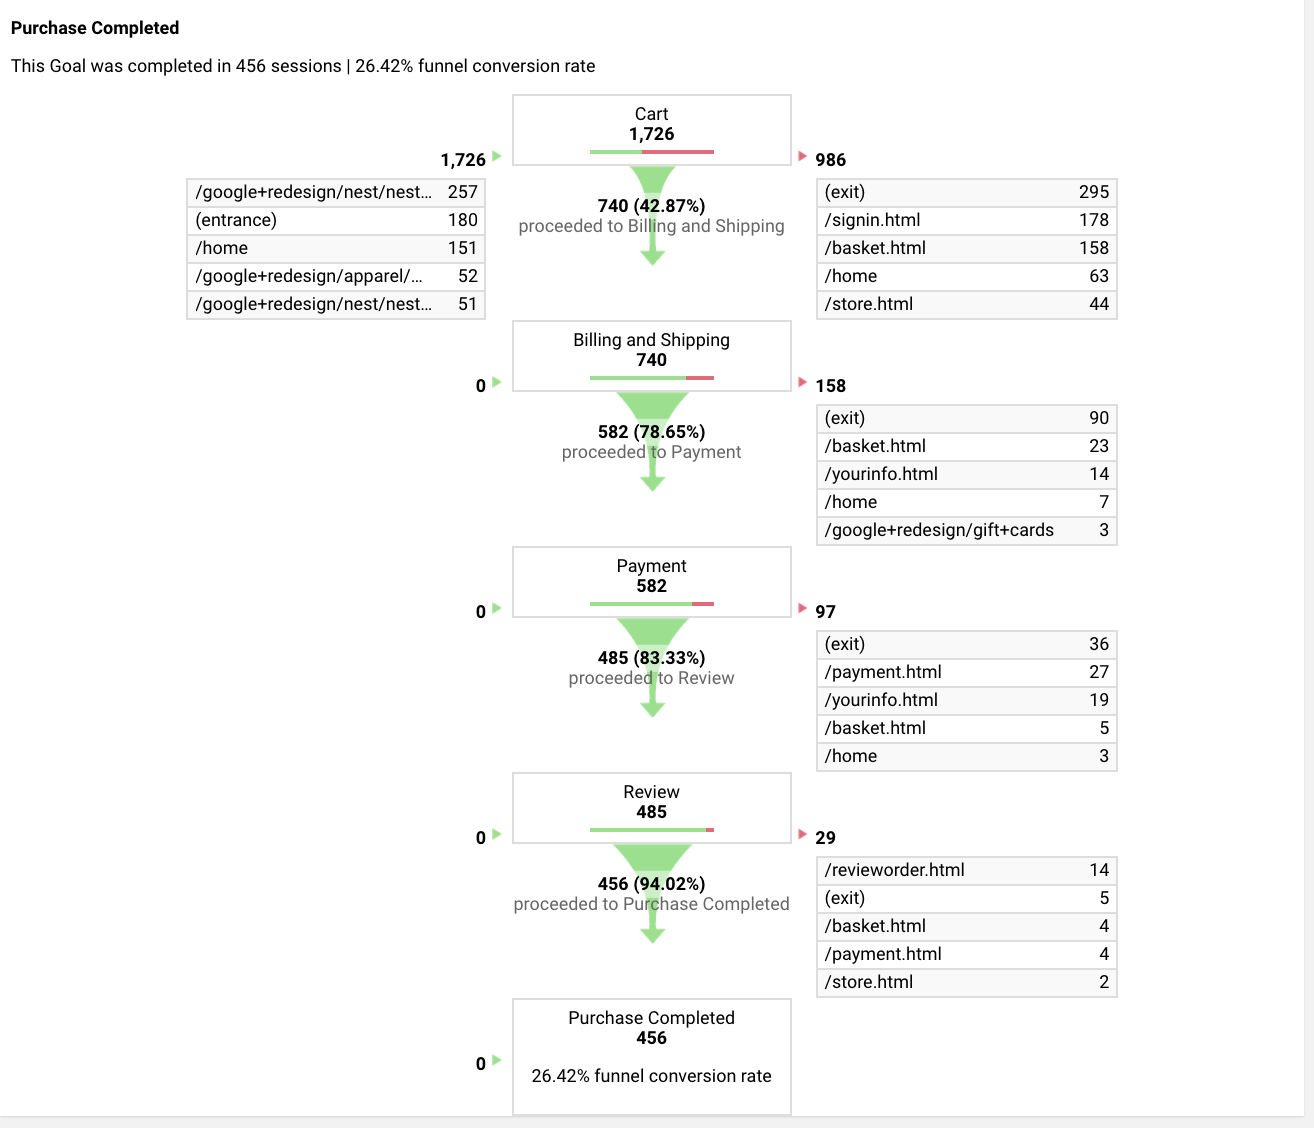
The customer acquisition funnel is the process from a customer landing on your website until the moment they sign up. Analyze each funnel stage to understand why users drop off, or why they finish their way through the funnel. The more catered your funnel is, the more sign ups or calls booked you will drive.
In this article, we will deep dive into what the customer acquisition funnel is, and how to optimize it.
The customer acquisition funnel, also known as a conversion or sales funnels, isn’t just some fancy business jargon. It’s the journey any visitor on your site takes from the first moment up until a sign up.
You might be wondering – why ‘funnel’? As potential leads enter the top of the funnel, only a select few will make it to the bottom and convert into customers. This process mimics an actual physical funnel, hence the name.
A Deeper Dive Into The Funnel
Customer acquisition funnels start when someone learns about your brand for the first time – they’ve entered the top of your customer acquisition funnel. At this stage, they’re simply gathering information and exploring what you have to offer without any commitment.
As these individuals move further down through each layer of your marketing efforts they transition from being casual browsers to interested leads who are considering purchasing from you.
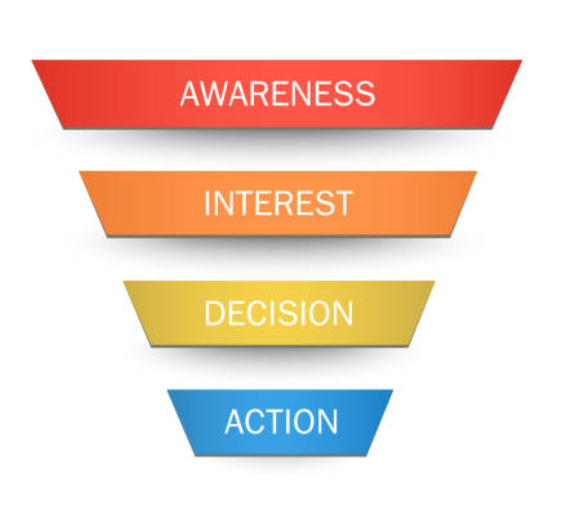
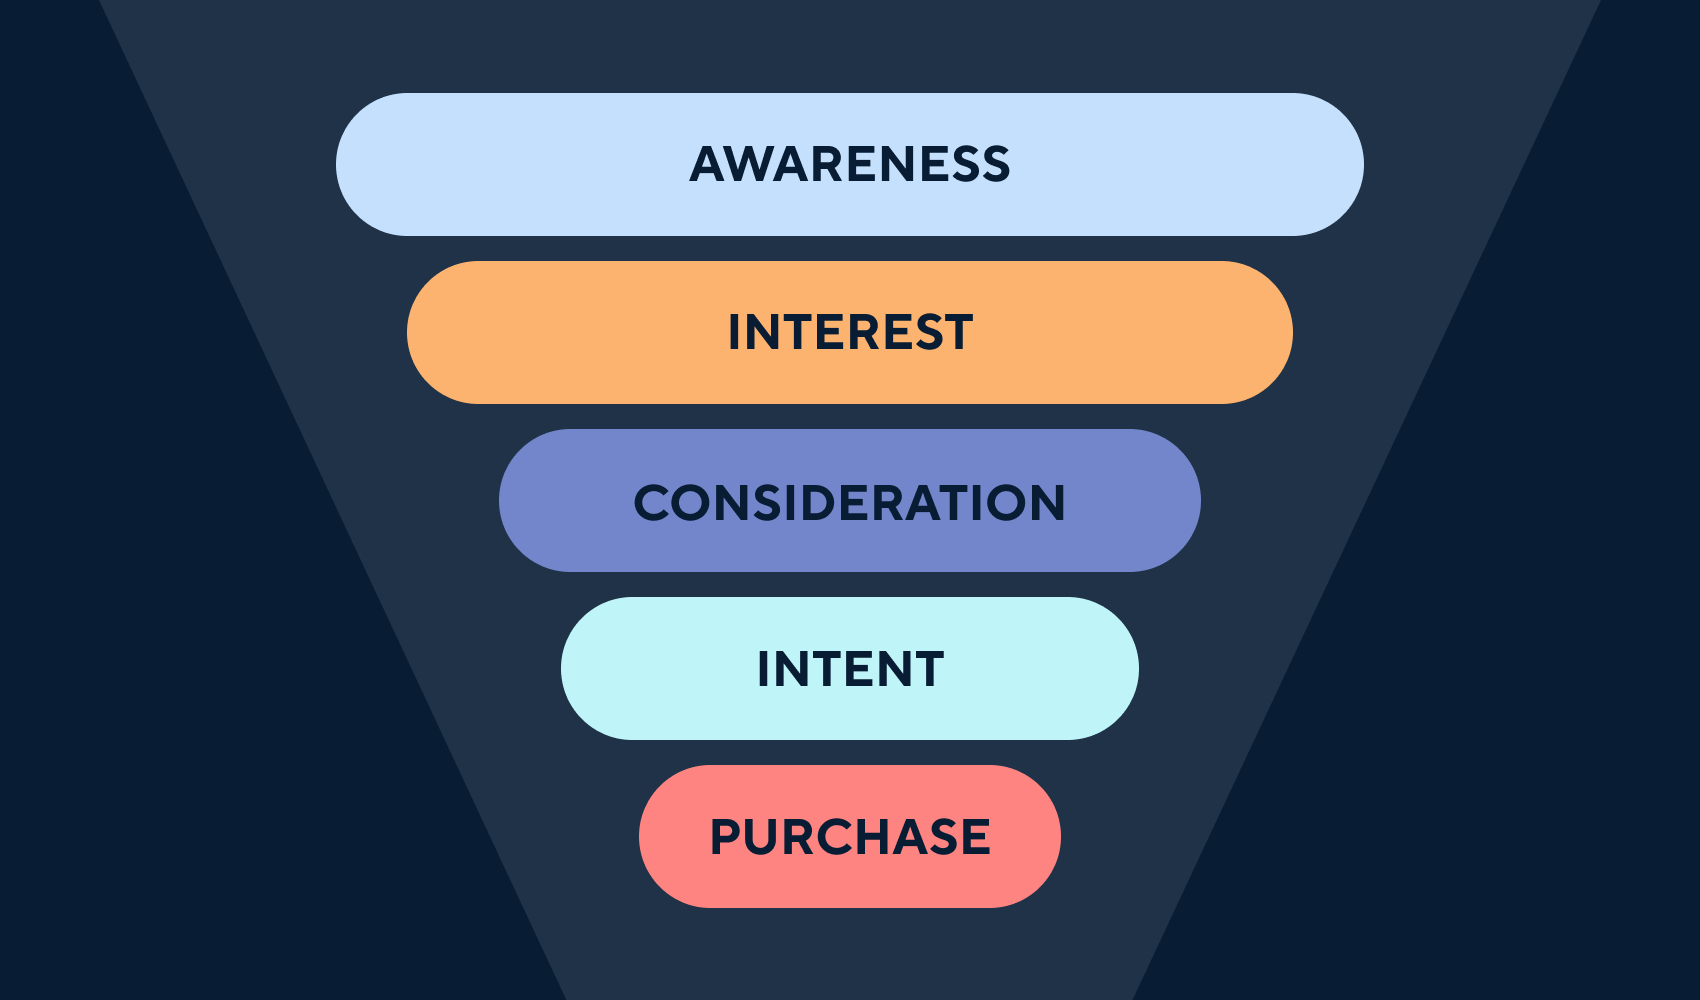
The 4 Stages of the Customer Acquisition Funnel
Understanding your customer acquisition funnel is important. It’s made up of four key stages: Awareness, Interest, Decision, and Action.
Awareness
This is where potential customers first discover your brand or product, called brand awareness. An effective customer acquisition strategy that appeals to your ideal audience is crucial to the success of your funnel.
Digital marketing acquisition channels such as SEO optimization, social media advertising, content marketing, and email campaigns can all help raise awareness in an engaging way that piques interest.
Interest
At this stage, individuals delve deeper into your offerings after through your website.
User experience design best practices suggest offering value upfront with free resources or trial offers – something tangible that helps prospects see firsthand how much your solution will help them.
Decision
This crucial stage is when prospects weigh their options before deciding whether or not they’ll become customers. The information available should make it easy for them compare features, benefits – basically everything relevant related their decision-making process.
This is the middle of funnel. The stage where you have peaked interest in your actively buying market, and now is when they want to decide if they choose you or your competitor.
Action
The final stage of the funnel represents when a prospect becomes a customer – they’ve taken action. Whether they’ve booked a sales call, signed up for your software, requested a quote, etc.
This is the stage where you calculate conversion rate. Conversion rate is the percentage of how many qualified potential customers convert and take action. You can tell how many of your potential customers are qualified in the “Decision” stage only.
This is also where you calculate your customer acquisition costs. Which is the total cost per customer acquisition channel it takes for 1 prospect to become a customer through the entire sales funnel. These two data points, once calculated, allow you to optimize your customer acquisition strategy.
For example, a potential customer might be interested in the “Interest” stage of the customer journey, but not know that they are not a qualified customer (in your target audience). Conversion rate also helps you shift your customer acquisition strategy, which is ironically all the way in stage one.
What you can control in optimizing your funnel
To optimize customer acquisition funnels and lower your customer acquisition costs, you need to actively manage and control the key factors that directly influence the customers experience on the journey.
Data Analysis
You can leverage data analysis tools to gain insights into how customers interact with your website or app to achieve your business goals. These observations help make informed decisions for improvements. Here is a curated list of the top website optimization tools that involve data analysis.
Analyzing metrics such as bounce rates, time spent on each page, and user flow patterns let you understand where potential customers may be dropping off from the acquisition process.
User Experience (UX)
The next aspect is enhancing UX design based on collected data. A smooth user experience makes sure visitors don’t leave midway due to frustrations stemming from poor site navigation or unappealing content.
Running a frequest UX audit is vital. Here is an in-depth guide on how to run a UX audit.
A/B testing various design elements and tracking visitor interactions using heatmap software will give insights into what works best for engaging visitors effectively throughout their journey within the funnel stages.
How to Optimize Your Customer Acquisition Funnel
Running a funnel analysis frequently is important for your business, let’s look at the optimization strategies that can turn prospects into loyal customers.
The Role of Heatmaps in Funnel Optimization
Heatmap tools are becoming a necessity nowadays for optimizing your acquisition funnel. They give a visual representation of user activity on your site – where they click or don’t and what parts get more attention.
This data offers a chance to identify and address obstacles swiftly. It also gives insights into which elements need improvement for better conversion rates.
Types of heatmaps
Click Maps
Mouse Movement Maps
Scroll Maps
Data that heatmaps offer
Preview the heatmap on different devices
See the number of total views and total clicks
Track error clicks
Track rage clicks
Track dead clicks
See the average load time on page
Session Recordings
Apart from heatmaps, session recording software lets you watch recordings of real users interacting with your website. This is like viewing the journey through their eyes.
You’ll see firsthand where visitors drop off and why some pages have lower engagement levels than others. With this information, you can make necessary adjustments that keep users moving smoothly down the funnel towards conversion.
Customer feedback
Customer feedback directly on your site has become a cheat code that only some businesses are using. If you’ve ever wondered how the big players in your industry are putting out product updates or offers that your customers just love?
Well they aren’t getting their info from just anywhere, it comes through mass customer feedback.
Fullsession has made it possible to get mass customer feedback, without spending months, or millions on acquisition. Fullsession has productized the ability. to get valuable customer feedback, and is rolling out features around curated AI integrations about your feedback if you have mass amounts of visitors. Here is a guide into customer feedback.
FullSession Pricing Plans
Fullsession offers everything you need to optimize your funnel. UX audits, session recording, heatmaps, customer feedback and funnel tracking and insights.
Here are more details on each plan.
The Starter plan costs $39/month or $32/year and allows you to monitor up to 5,000 monthly sessions with up to 6 months of data storage.
The Business plan costs $75/month or $60/year and helps you to track and analyze up to 100,000 monthly sessions with up to 12 months of data storage.
The Enterprise plan has custom pricing and offers customizable sessions plus full access to all features.
The customer acquisition funnel is like a well-oiled machine. To ensure optimal functioning, regular upkeep of the customer acquisition funnel is essential. Here are 15 tips to keep your funnel running smoothly.
1. Understand Your Audience
Run frequent UX audits and feedback campaigns. When. we say frequent, we mean the more you do these, the more customers you get.
2. Create Engaging Content
The content on your marketing, service or product pages should answer the questions that potential customers have about your product or service. Make sure it’s informative, engaging, and easy-to-read.
3. Use Effective Call-To-Actions (CTAs)
Make your CTA’s direct and concise. Saying “learn more here” is weak. Saying “speak to our team to learn more about our service” will convert much better.
4. Ensure Mobile Responsiveness
Guarantee that the whole marketing process functions effortlessly across every device and page size.
5. Frequent A/B Testing
This allows you to compare different versions of an element within the sales pipeline so as not to rely solely on assumptions but hard facts.
6. Offer Live Chat Support
Having live chat support can significantly improve customer experience, leading to higher conversions and customer retention.
FAQs in Relation to Customer Acquisition Funnel
What is the customer acquisition funnel?
The customer acquisition funnel maps a buyer’s journey from awareness to purchase. It helps businesses understand and optimize this path for higher conversion rates.
What is a customer purchase funnel?
A customer purchase funnel, like an acquisition one, traces a consumer’s route from discovering your brand to buying your product. The focus here though is on nudging potential buyers into making that final leap.
What are the three components of the customer acquisition funnel?
The core parts of any solid acquisition funnel include: Awareness (grabbing attention), Consideration (engaging interest) and Conversion (turning prospects into paying customers).
What are the stages of the acquisition funnel?
The main stages in most funnels cover Awareness, Interest, Decision-making, and Action – often dubbed AIDA for short. Each phase requires different strategies to guide leads further down towards becoming loyal customers.
Keeping up with customer demands and expectations is crucial for any company that wants to stay ahead of competitors.
You can collect product feedback to evaluate your product’s performance and customer satisfaction.
This customer feedback can come as solicited or unsolicited.
Solicited feedback refers to feedback that a company requests explicitly from its customers through surveys, focus groups, or website feedback forms.
On the other hand, you can receive unsolicited product feedback without asking customers, usually through online reviews or social media posts.
By listening to your customers, you can better understand their needs and wants and optimize your product to boost customer loyalty and drive growth.
In this article, we’ll take a closer look at the power of user feedback and explore some best practices for gathering and using it to your advantage.
We will also show you how to use FullSession, our behavior analytics platform, to collect and analyze customer feedback and employ it to drive product improvements.
Here are some crucial advantages of collecting product feedback for optimizing your product roadmap.
Understanding customers’ demands
If you collect product feedback, you can better understand what customers want and need from your business. It can help you improve your offerings and make them more suitable for your customers.
Identifying product deficiencies
Product feedback can also help you pinpoint problems or shortcomings with your products. It can be precious information you can use to make progress and ensure your products meet the highest quality standards.
Enhancing customer satisfaction
Adjustments based on customer feedback can lead to higher customer satisfaction and stronger customer relationships. It can translate to repeat business.
Increasing product loyalty
When your customers feel their feedback is being heard and acted upon, they will remain loyal to your brand. It can lead to increased sales and profitability over time.
Facilitating innovation and growth
If you collect customer feedback and refine the product, your business can stay ahead of the competition and remain innovative.
It can lead to new products and services, expanded markets, and increased revenue streams.
Reducing risk and costs
By collecting product feedback, you can reduce the risk of product failures and costly recalls by addressing potential issues early on. It can help you save resources in the long run.
These are just some reasons you shouldn’t hesitate to collect product feedback from your customers and use it to grow your business.
Let’s look at some common challenges you might face when collecting product feedback and how to overcome them.
Low response rates
When customers don’t provide feedback, making informed decisions about product improvements can be difficult.
You can offer incentives such as discounts to motivate users and increase response rates.
You can also improve product feedback surveys by making them shorter, more engaging, and easier to complete to boost customer engagement.
Biased feedback
It occurs when customers only provide feedback that aligns with their personal preferences or experiences, leading to inaccurate data and poor decision-making.
To avoid this, you should use a variety of feedback channels to gather solicited feedback from a diverse range of customers.
You can also use anonymous product feedback tools to encourage honest feedback and data analysis tools to identify and eliminate nonobjective feedback.
Inadequate feedback quality
It happens when customers provide feedback that needs to be more precise or actionable, making it difficult to pinpoint areas for improvement.
To overcome this, you can provide specific questions and prompts to encourage detailed input and identify patterns in customer responses.
Lack of actionable insights
Even with high-quality feedback, you may struggle to take action.
To overcome this, you can use feedback analysis tools like FullSession to identify customer feedback trends, prioritize responses, and implement changes in your product strategy.
Limited feedback channels
If you use only one feedback channel, you may miss out on responses from customers who prefer using other channels for communication with your brand.
To overcome this, you can collect feedback by email, social media, website forms and in-person interviews and use product feedback tools to identify the most effective channels for customer segments.
Insufficient resources and expertise
Collecting feedback takes time and resources, and it can be tricky if you are short on personnel or technology.
You might overlook important feedback or not address it promptly, leading to customer dissatisfaction.
Assess your available resources and find ways to optimize them. You might consider investing in product analytics tools or outsourcing workload to third-party providers.
It helps you ensure that every piece of feedback is given the attention it deserves without overburdening your team.
Difficulty in managing large volumes of feedback data
As more and more people start providing feedback, it can become quite challenging to manage data and analyze it correctly.
It’s easy for important feedback to get lost in the shuffle or go unaddressed if you don’t track everything effectively.
Advanced customer feedback tools like FullSession can automatically collect, manage and analyze product feedback. We provide detailed visual reports you can evaluate and share with your team members to drive product improvements.
As someone creating a product, you know feedback is essential, but did you know there are different types of feedback you should be looking for?
Here are ten types of product feedback you should keep in mind.
User experience feedback: This feedback focuses on the overall experience of using your product, including ease of use, intuitiveness, and design.
Feature requests and suggestions: It gives you insight into what users want to see in your product and what features they feel are missing.
Bug reports and technical issues: It is crucial for identifying and fixing technical problems or bugs impacting the user experience.
Performance and speed feedback: This feedback relates to the speed and performance of your product, including how quickly it loads and how responsive it is.
Pricing and value feedback: You can get insight into whether users feel your product is priced appropriately and whether they believe it provides good value for the money.
Competitive analysis feedback: It helps you understand how your product compares to similar products.
Customer service feedback: It relates to the quality of customer support and services your team provides.
Brand perception and reputation feedback: You can get insight into how users perceive your brand and whether it positively or negatively impacts their decision to use your product.
Product strategy and roadmap feedback: This feedback helps you understand how users feel about your product’s current direction and what they want to see in the future.
Market trends and demands feedback: It relates to broader market trends and demands, including what users are looking for in a product like yours and what changes may be on the horizon.
By gathering these ten types of feedback, you can better comprehend your product’s strengths and weaknesses and make the required improvements to ensure your users are happy and satisfied.
If you’re looking to collect feedback on your product, there are plenty of ways to do so.
Here are ten options to consider.
Customer surveys: You can use survey tools to create and distribute surveys to your customers in a structured and quantitative way.
Focus groups: Bringing together customers to discuss their experiences and opinions of your product can provide qualitative feedback.
Social media monitoring: You can monitor social media mentions and comments for unsolicited feedback from customers.
User testing and analytics: Tools like FullSession can provide valuable data and insights into how users interact with your product.
Feedback forms and comment sections: Including feedback forms or comment sections on your website or app allows users to provide feedback directly to you.
Online reviews and ratings: Review sites are excellent sources of feedback from customers, and you should implement them in your product feedback strategy.
Email and phone support interactions: Customer support interactions can provide valuable feedback on user experience and product features.
In-app feedback and prompts: These tools allow users to provide feedback directly within your app, making sharing their opinion more convenient and engaging.
Sales and CRM data: Sales and CRM data can provide valuable insights into customer behavior and preferences.
Competitive research and benchmarking: Researching your competitors can help you understand what features and experiences users seek and how your product stacks up.
Using one or a combination of these methods, you can gather valuable feedback and insights to improve your product and better serve your customers.
How to gather and analyze product feedback with FullSession
FullSession simplifies the complex process of gathering product feedback by automatically capturing and storing customers’ responses.
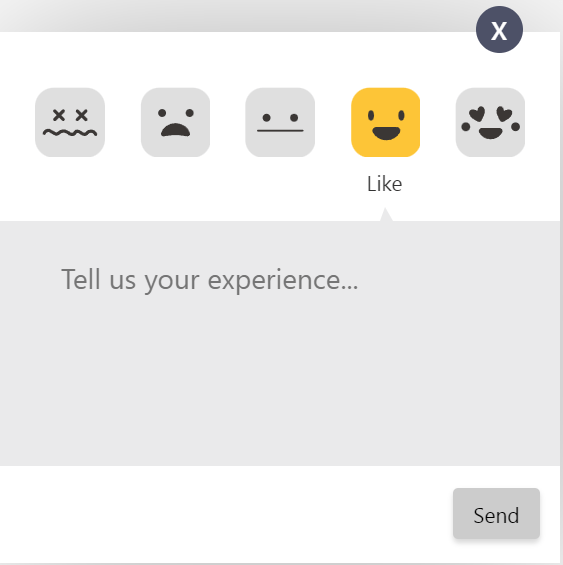
With FullSession, you can quickly create and customize a website form according to your needs and place it in a visible area of your website to attract users’ attention.
Users can add positive feedback and negative feedback using emojis and leave additional information you can use to address customer challenges.
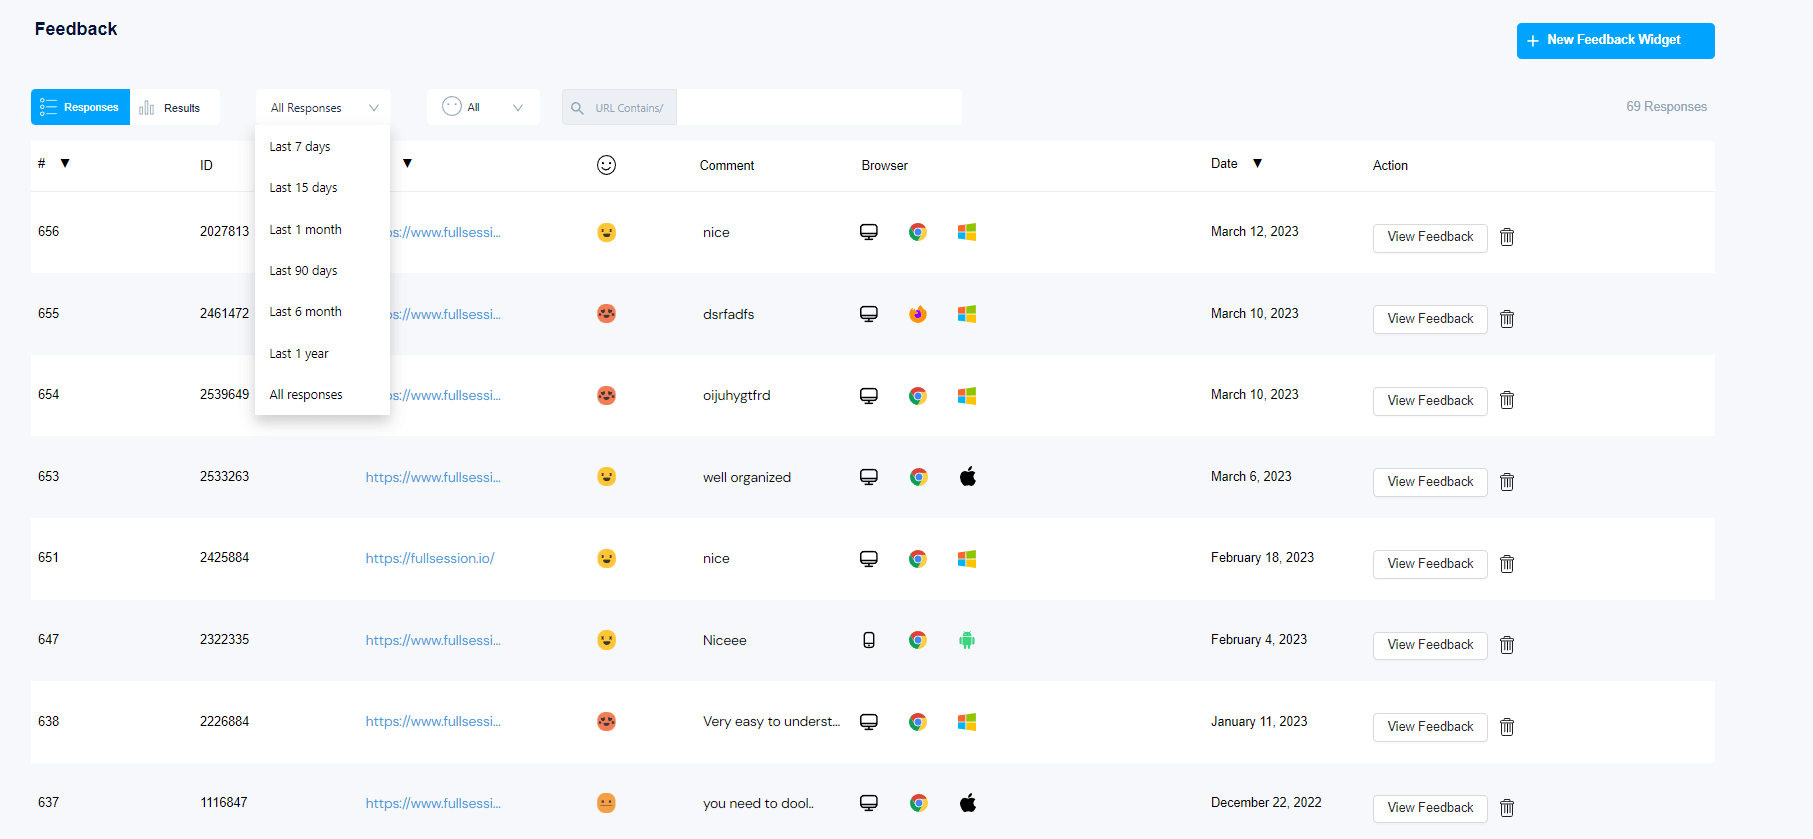
Our software then collects all data in one centralized location and allows you to swiftly address negative experiences, ensuring that you can promptly resolve any issues as they arise.
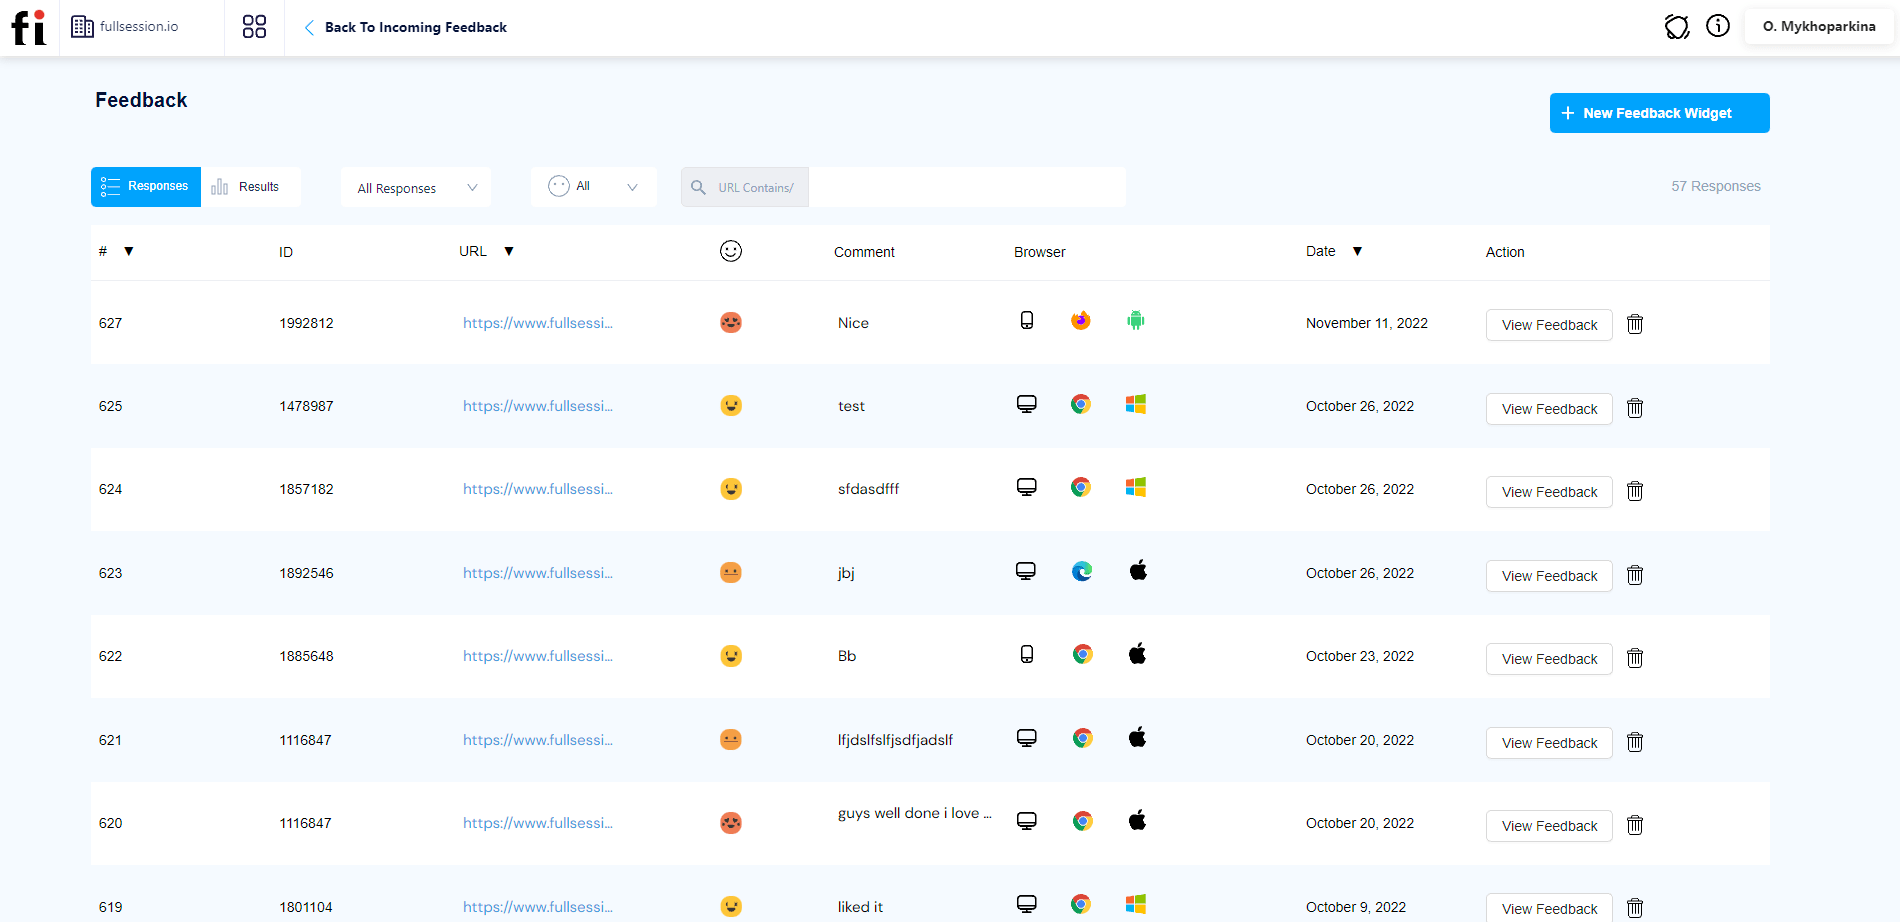
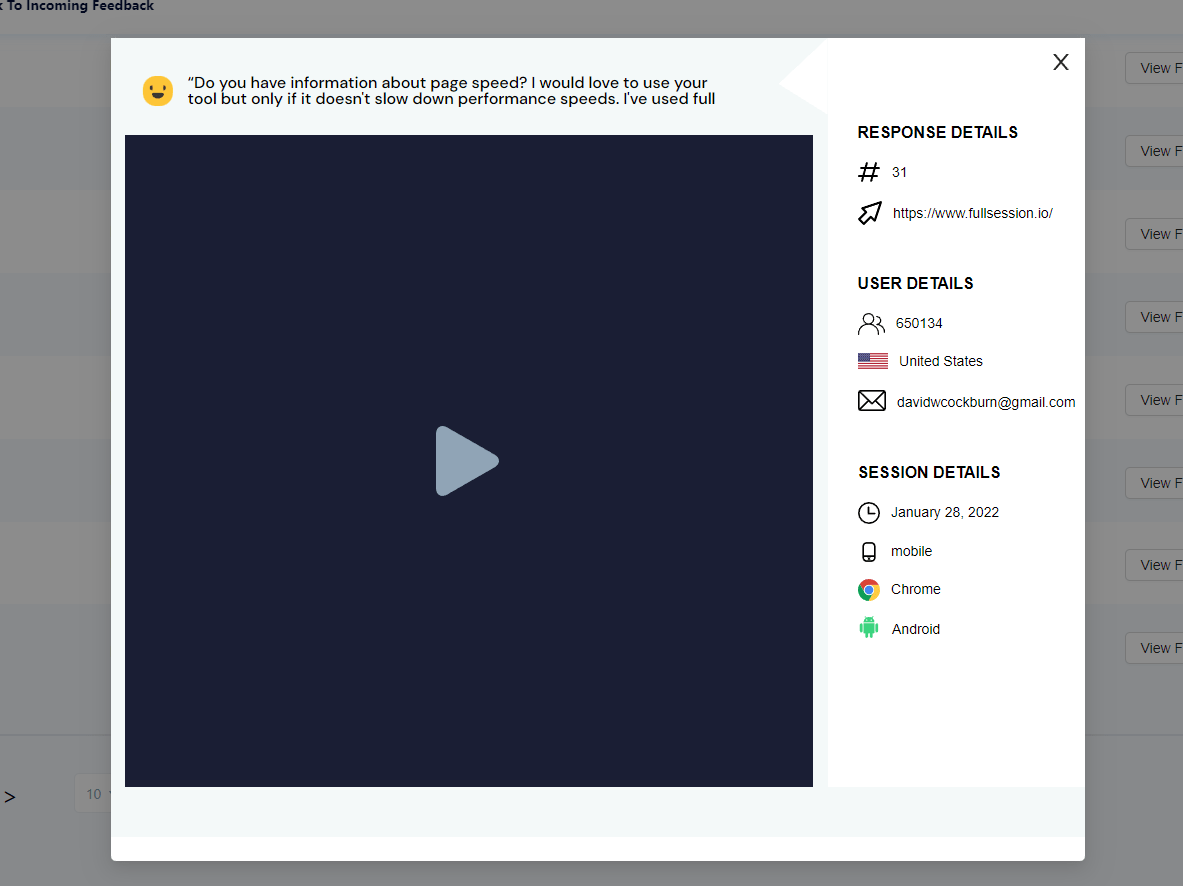
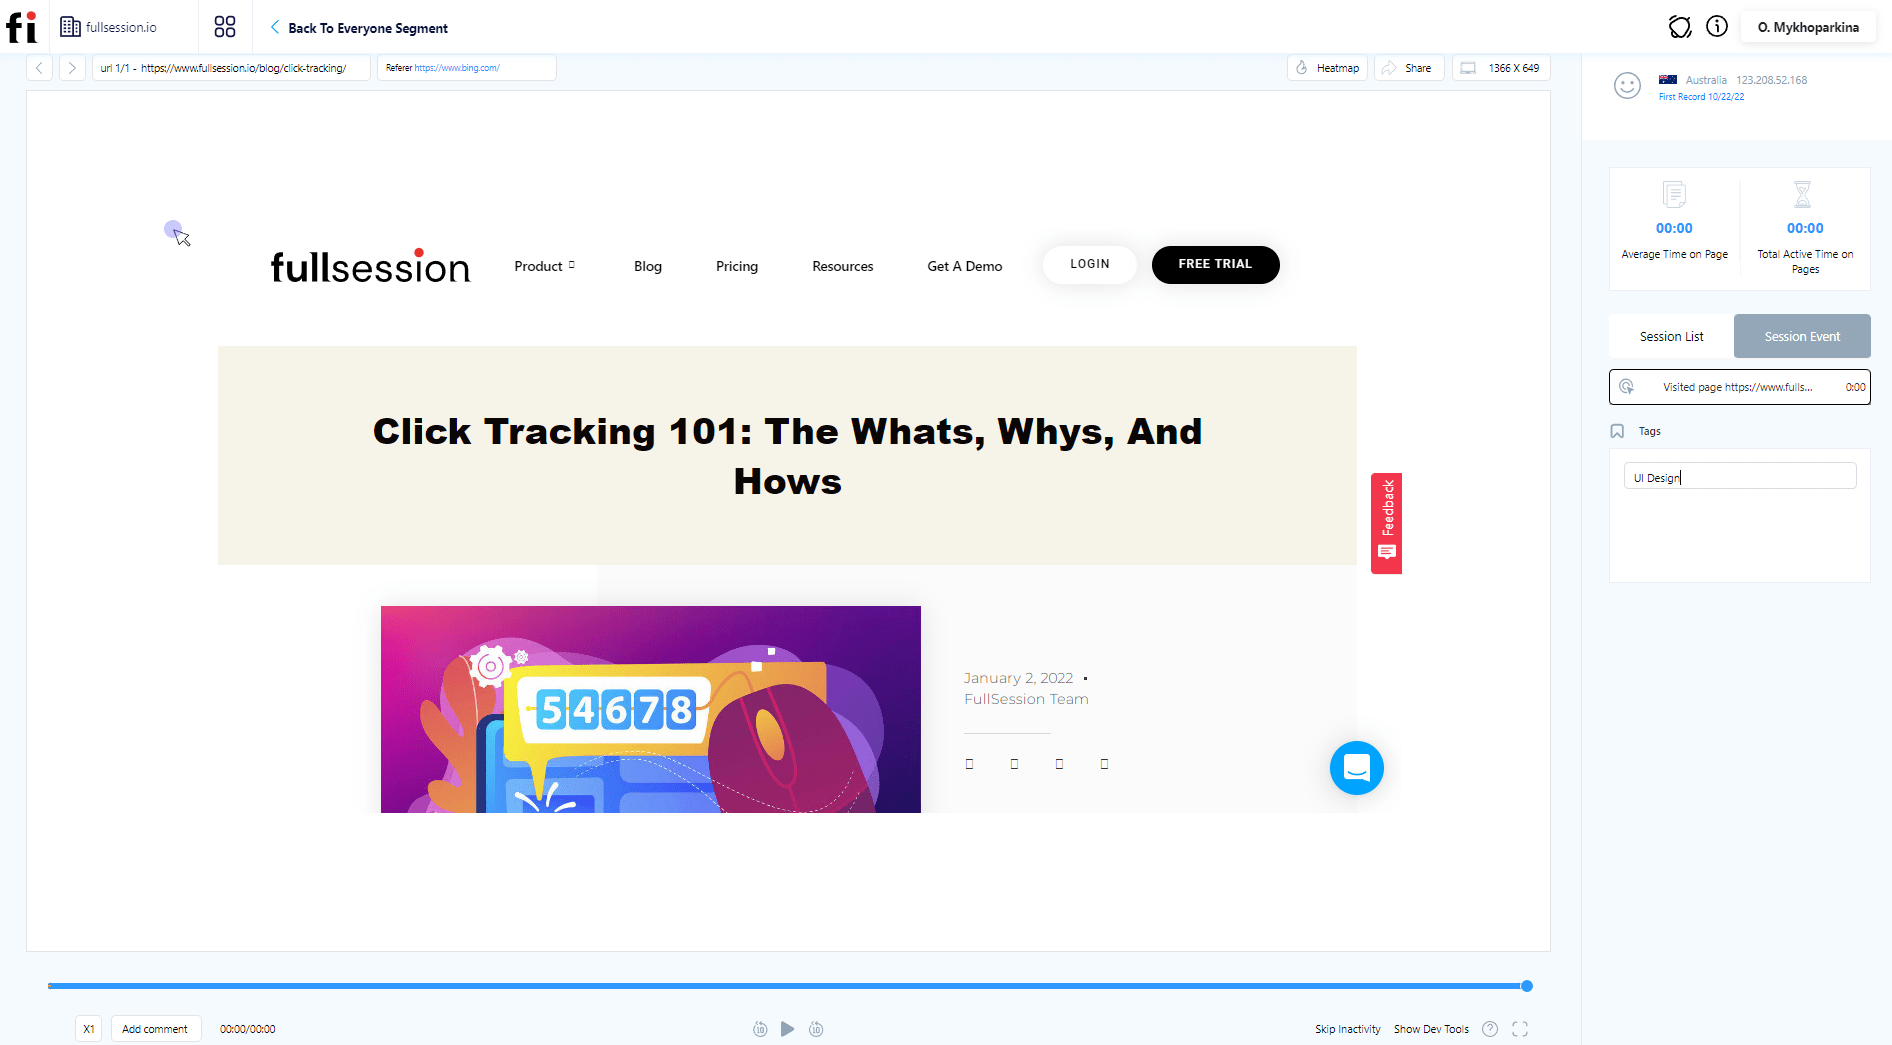
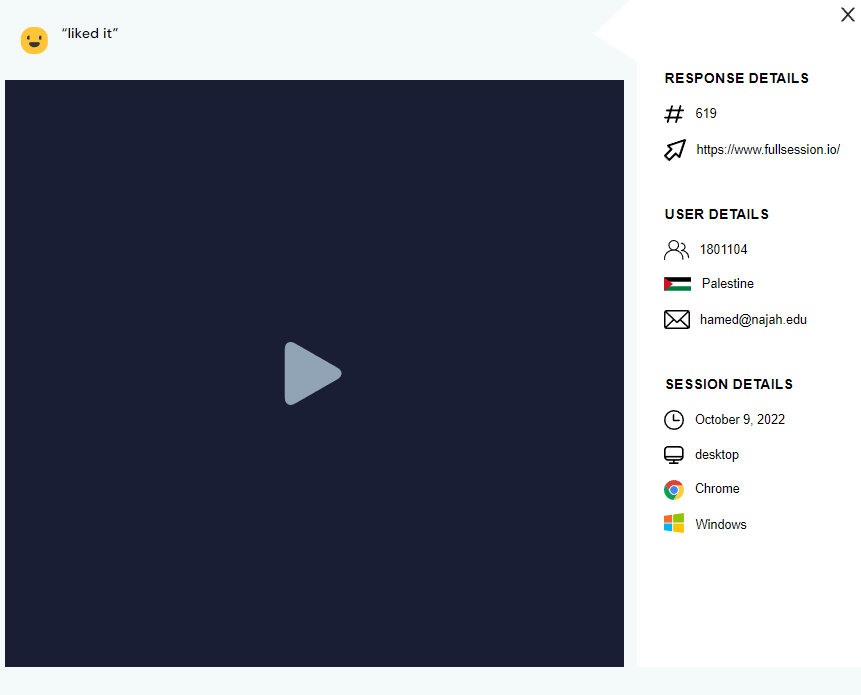
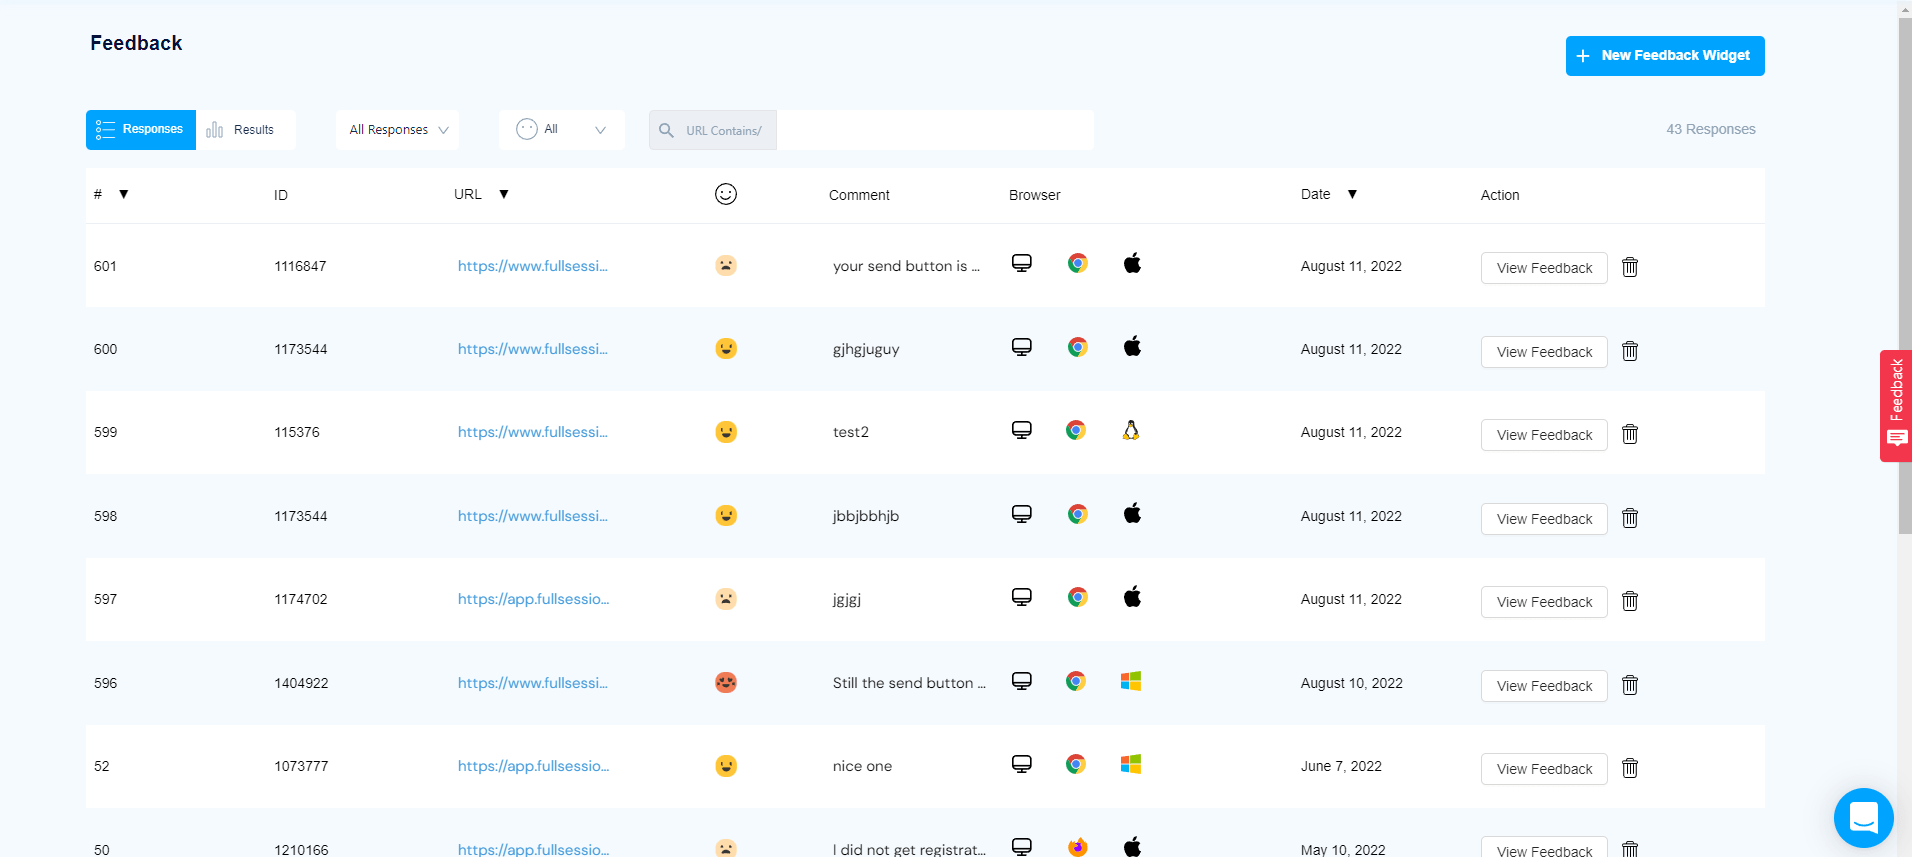
You can see the feedback ID, visited URL, user’s sentiment, comment, browser and date of the feedback.
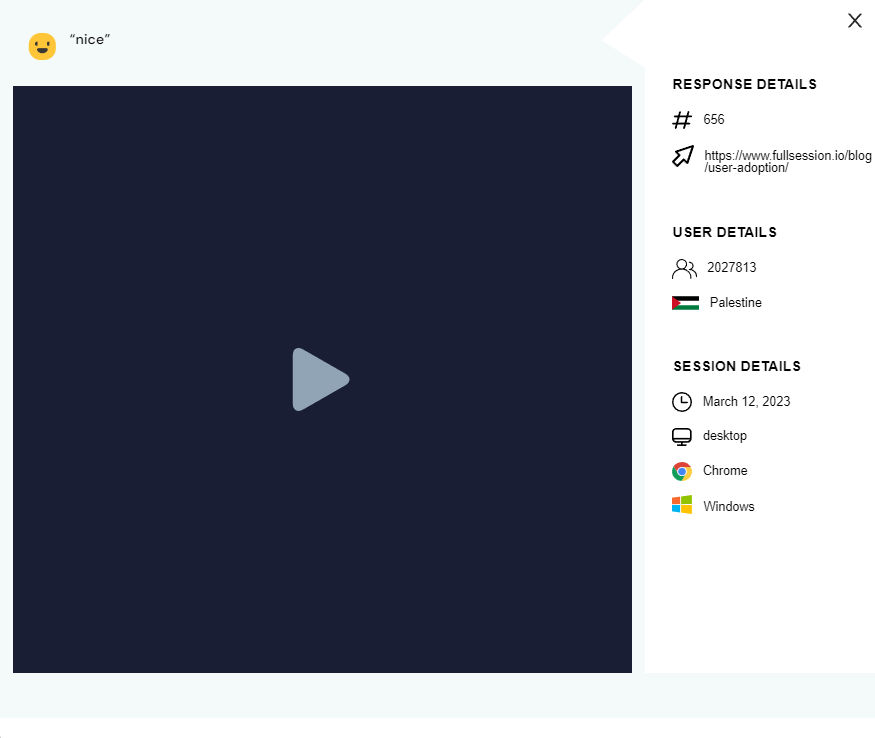
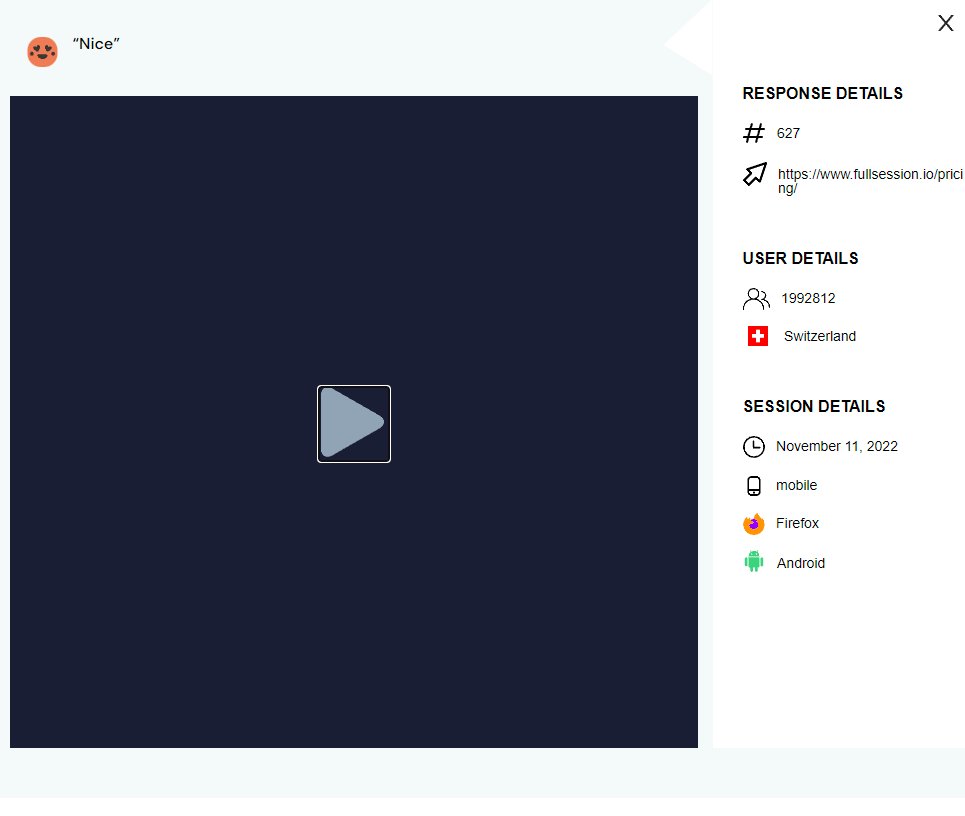
With our session recording and replay, you can watch what users did during their session and understand their negative feedback. You can see response, session and user details.
It helps you pinpoint and fix the issue quickly, improving customer experience.
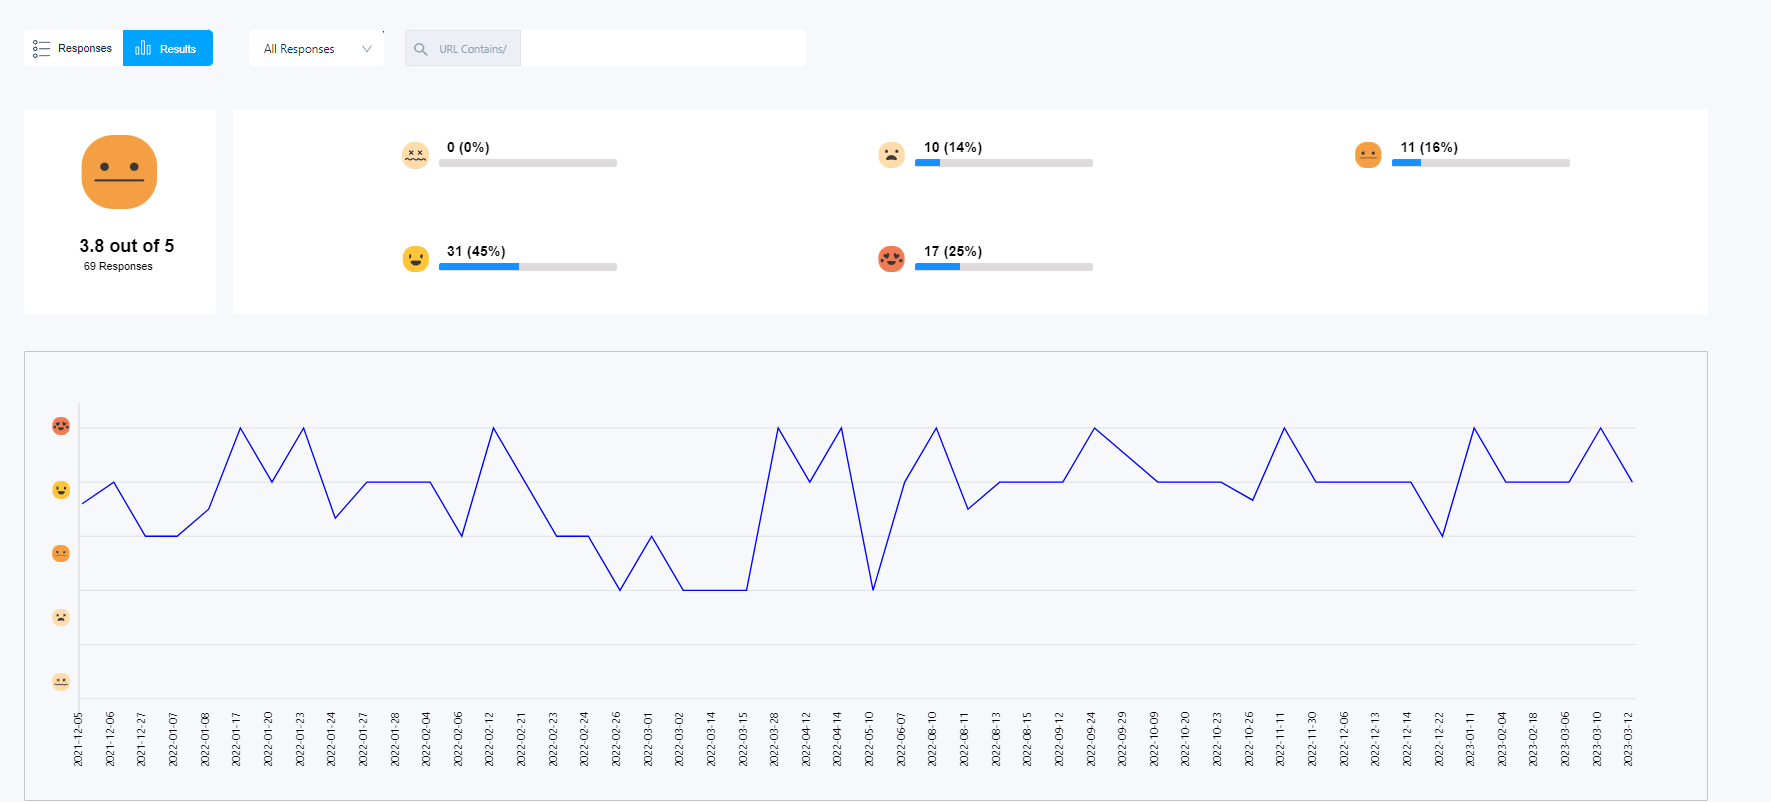
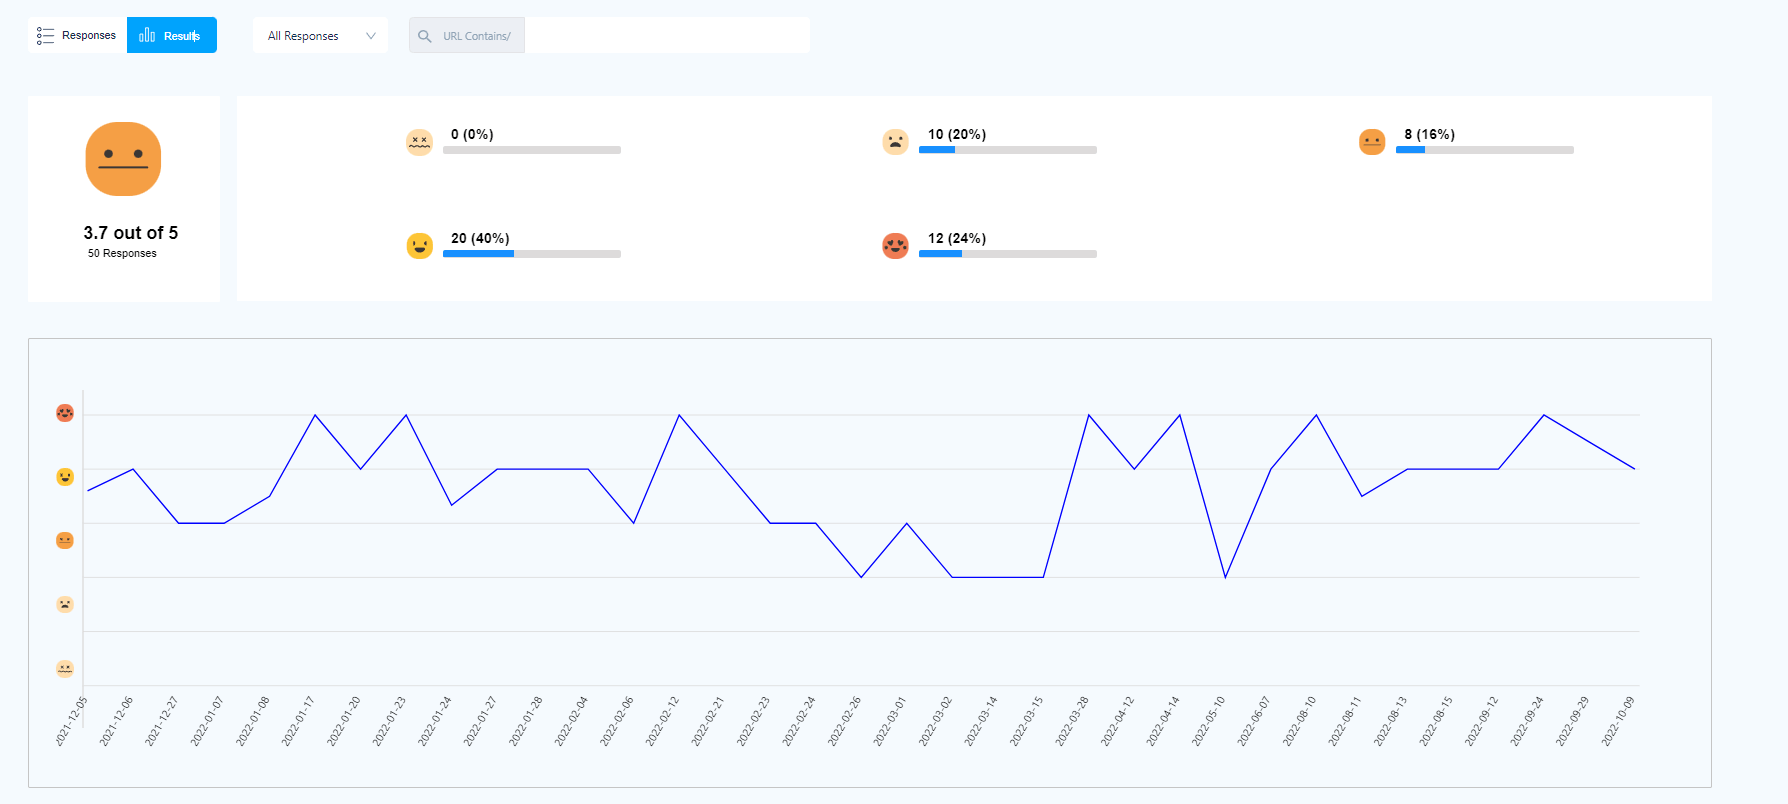
With FullSession, you can access customer feedback reports. You can see your overall score and customer sentiments and filter all data by the specific page or period you are interested in.
With FullSession, the guesswork is out of the picture. You can finally get customer feedback in minutes and understand what they really think about your product.
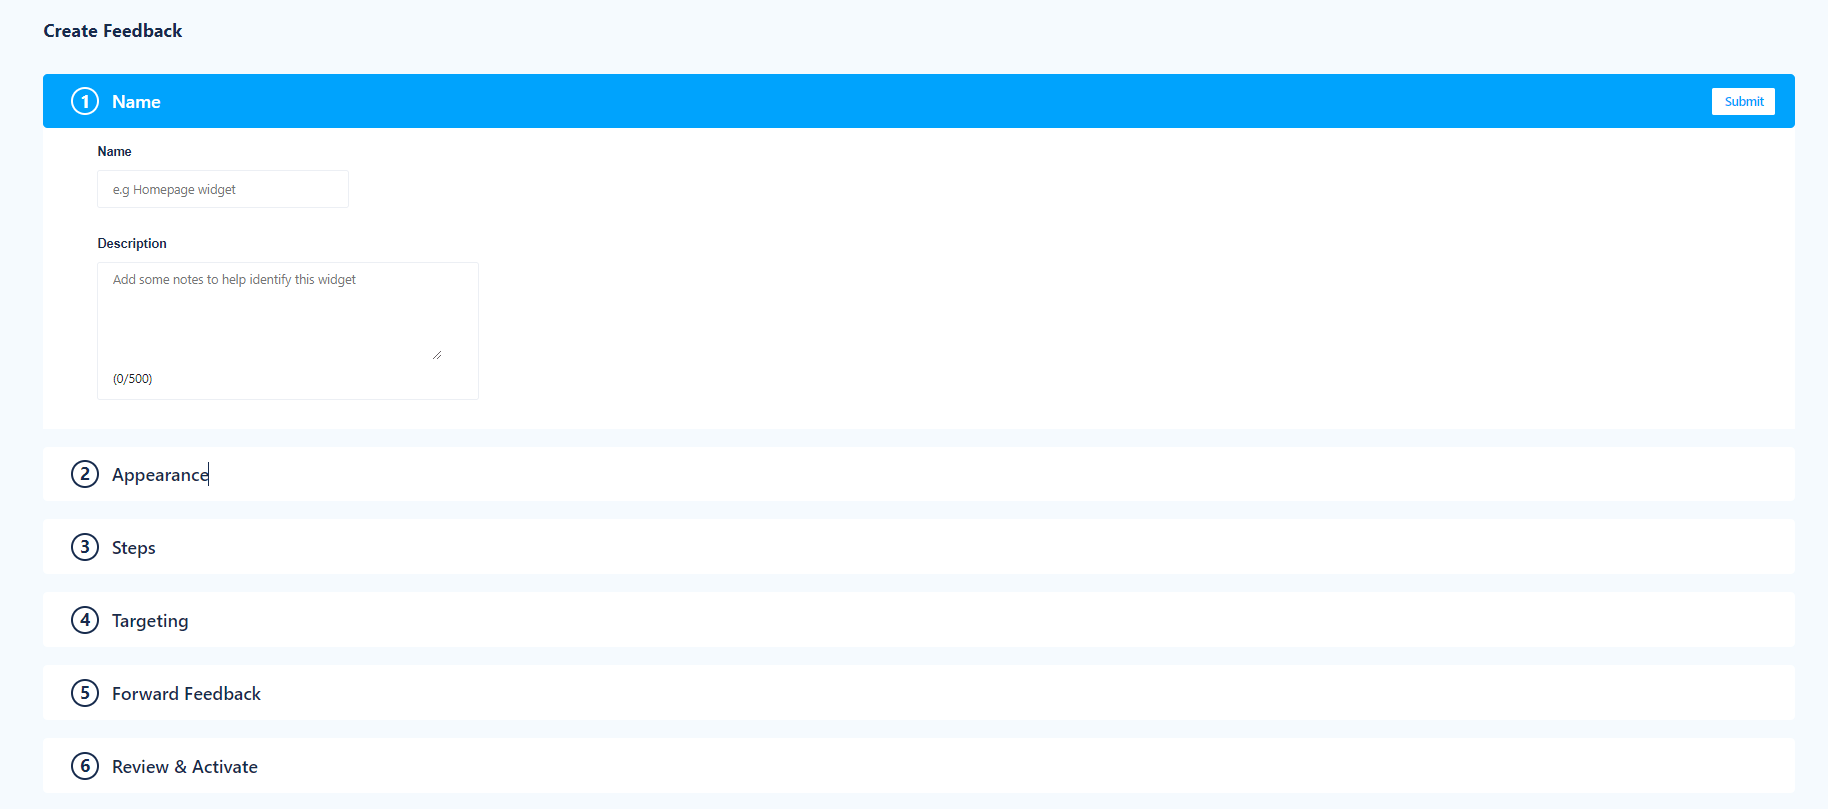
You can create your in-app survey with our no-code builder quickly and efficiently, target your feedback based on devices or specific pages, measure user sentiment and map feedback with session recordings.
Collecting customer feedback is the beginning of a journey to improve your development. Here are ten best practices to make the most out of your product feedback.
Listen and respond promptly to customer feedback
Prioritize feedback based on impact and feasibility
Involve key stakeholders in the feedback process
Use feedback to guide product roadmap and strategy
Test and iterate based on feedback until you find the best solution
Communicate changes and updates to users through release notes, in-app notifications, and email newsletters
Continuously monitor and evaluate feedback programs to ensure they meet your needs and produce valuable insights
Use feedback to build stronger relationships with customers
Prioritize feedback and make it a crucial part of your product development process
Leverage feedback to drive innovation and growth
By following these best practices, you can maximize customer feedback, deliver a product that meets your users’ needs and expectations and close the product feedback loop.
Product feedback: Final words
Collecting and using customer feedback is essential for improving your product and staying competitive in today’s market.
By listening to your customers and understanding their needs and pain points, you can turn feedback into a strategic advantage for your business.
With FullSession, you’re not just fixing problems or addressing complaints.
You also have an opportunity to discover new ideas, improve user experiences, and turn product feedback into a powerful tool for innovation and growth.
Funnel drop or funnel abandonment means users drop out of your conversion funnel at different points and fail to complete your desired action. To understand what prevents them from becoming paying customers, you can use user behavior tools like our FullSession.
We provide you with session recordings and replays to observe how users navigate your site, interactive heatmaps to assess which page elements are the least engaging, and website feedback forms to get additional context by asking customers about their experience. With FullSession, you can create a funnel and monitor results for each customer journey stage.
If you want to know how to prevent funnel drops with user behavior tools, read on! We’ll take you through every important detail you need to know to eliminate obstacles that lead to funnel abandonment.
What is the purpose of a funnel in the conversion process?
Funnels are essential to the conversion process. They help you visualize the customer journey from initial awareness to purchase, providing valuable insight into how customers interact with your website, products, or services.
Marketers typically use funnels to strategically nurture prospects and move them closer to making a purchase decision. Funnels also provide data-driven insights on which channels and tactics are most effective at driving conversions.
By tracking and analyzing this data, marketers can optimize their strategies for better results.
What is a funnel analysis?
Funnel analysis is a process of monitoring and analyzing users’ activity on a website or application to identify any potential problems or bottlenecks hindering their progress on the path to conversion.
It maps out user behavior at different stages of the customer journey. It helps you measure the effectiveness of email, search engine, and social media marketing campaigns, evaluate which strategies are working best and adjust your efforts accordingly to increase conversions.
Four types of funnels you should know about
There are four types of conversion funnels you should be aware of to maximize your website potential.
Goal funnel – the first type is the goal funnel. It includes a step-by-step process that leads to achieving a specific, usually non-transactional goal, like a newsletter sign-up.
Sales funnel – it’s similar to the goal funnel but focused on the sales process and sales-related activities, like ordering a product or subscribing to a service.
Strict funnel – this is the funnel you use to get people to follow a strict chain of actions you designed with a specific goal in mind – visitors can’t skip any of the steps. You can use these funnels to identify problems that lead people to drop off because you see which actions cause issues.
Flexible funnel – the fourth type of funnel is the opposite of a strict funnel. You don’t restrict or limit user interactions on your website and analyze different approaches they take.
Each of these funnels is important; you should analyze them to ensure you get the most out of your website. But how to conduct such an analysis?
Three crucial steps to conduct a funnel analysis
Funnel analysis is a great way to track user behavior and identify opportunities for improvement. Here are the three crucial steps you should keep in mind.
Define the funnel: The first step in conducting a funnel analysis is clearly defining the user journey and the critical steps along the way. It includes identifying the entry points, user actions within the funnel, and the outcome or goal.
Gather funnel metrics: Once you define the funnel, the next step is to measure the performance of each step users take on their journey. You can track metrics such as time spent on each page, conversions, and abandonment rates, to name a few.
Analyze and optimize the funnel: The final step is to analyze the data and identify improvement areas. It could include making changes to the design or content of the page, improving the user experience, or testing different strategies.
But why should you even analyze your funnels in the first place? Let’s look at the possible benefits of funnel analysis.
Seven critical benefits of funnel analysis
Funnel analysis is an invaluable tool for businesses that lets you
Identify the sources of website traffic
Identify the most effective marketing channels
Understand users’ behavior and preferences
Identify bottlenecks in the user journey
Optimize conversion rates at each stage of the funnel
Improve ROI through targeted campaigns
Measure the impact of changes
To reap the benefits of your funnel analysis, you must optimize your funnels to eliminate drop-off points.
What is a funnel drop?
A funnel drop is when a user abandons a conversion process. In essence, it means you lose a potential client resulting in lost profit. Funnel drop-off often happens due to a problem on your website, but there can also be other reasons. Let’s discuss them.
Three key reasons behind funnel drop and low conversion rate
A low conversion rate can be frustrating, especially if you’ve invested time and money into building your website, web app, or landing page.
Understanding why people are leaving your website without converting can help you figure out how to improve it, so let’s look at the critical reasons for a high funnel drop-off rate and low conversion rates.
1. Lack of clarity
If customers need help understanding your product or why they should buy it, they will likely leave your site resulting in huge drop-off rates. To overcome this challenge, use visuals and simple language, and ensure your website is easy to use and comprehend.
2. Attracting the wrong audience
Another reason for funnel drop-off is not targeting the right people. Identify the best audience for your products and plan your layout, content, and communication strategy accordingly.
3. Website issues
Finally, customers will likely leave if your website is slow or hard to navigate. Make sure load times are quick, and optimize your information architecture to ensure customers find necessary information quickly.
You can increase conversions and grow your business with the proper adjustments and planning. However, you won’t get far if you can’t track your progress.
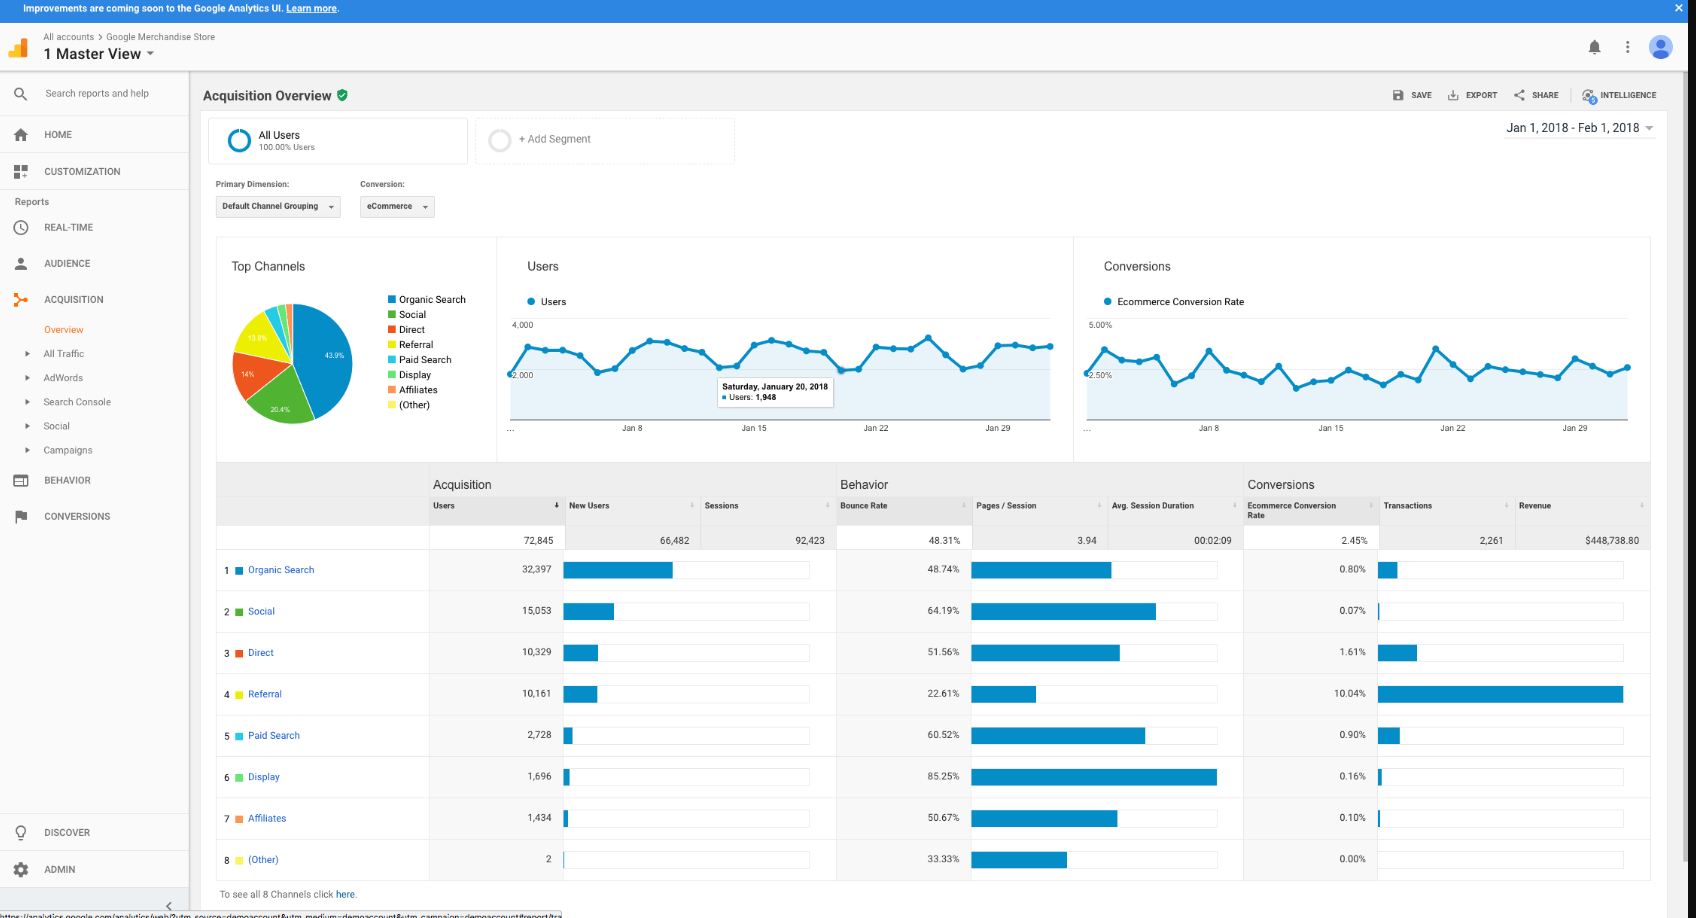
Funnel tracking and reporting with Google Analytics
Google Analytics allows you to track the funnel drop-off rates, the average time spent on each step, and more. It helps you understand your user journey and optimize sales and marketing funnels.
Tracking funnel metrics in Google Analytics is relatively easy – you must create a GA account and install the tracking code on your website. Then you can set up and customize various goals on your account and define funnel pages. You can start tracking and reporting the performance of your funnel pages right away.
With a few clicks, you’ll see which pages are working and which are not – you can check this and visualize the data in the GA conversion report. You can also adjust your funnel to ensure it’s leading customers down the right path.
To see how Google Analytics compares to other behavior analytics tools, read the following articles
Offers a comprehensive view of website data across different devices and platforms
Includes audience segmentation, funnel analysis, and event tracking
Integrates with other Google services, such as Google Ads, for campaign tracking
Google Analytics cons
Data offered by GA is broad, page-level, and statistical.
You can’t analyze actual user behavior as it lacks session recordings and interactive heatmaps, so you don’t get additional context for the data you collect.
You can’t use the platform to get customer feedback directly via customer feedback forms or other similar tools.
Of course, Google Analytics isn’t the only option – there are other behavior analytics tools you can use to find drop-offs and optimize your funnels. One such tool is FullSession, our comprehensive product analytics platform that provides in-depth product metrics.
Let’s explain how it works.
How to prevent funnel drop and boost conversion rate with FullSession
FullSession is a UX analytics tool that helps you prevent funnel drop-offs and optimize your conversion rate.
While it provides crucial page-level data, it primarily focuses on the experience and behavior of your website visitors.
Thanks to features such as funnel and conversion tracking, session recordings and replays, interactive heatmaps, or customer feedback forms, you can understand what motivates your customers and what drives them away from your website, leading to funnel drop-offs.
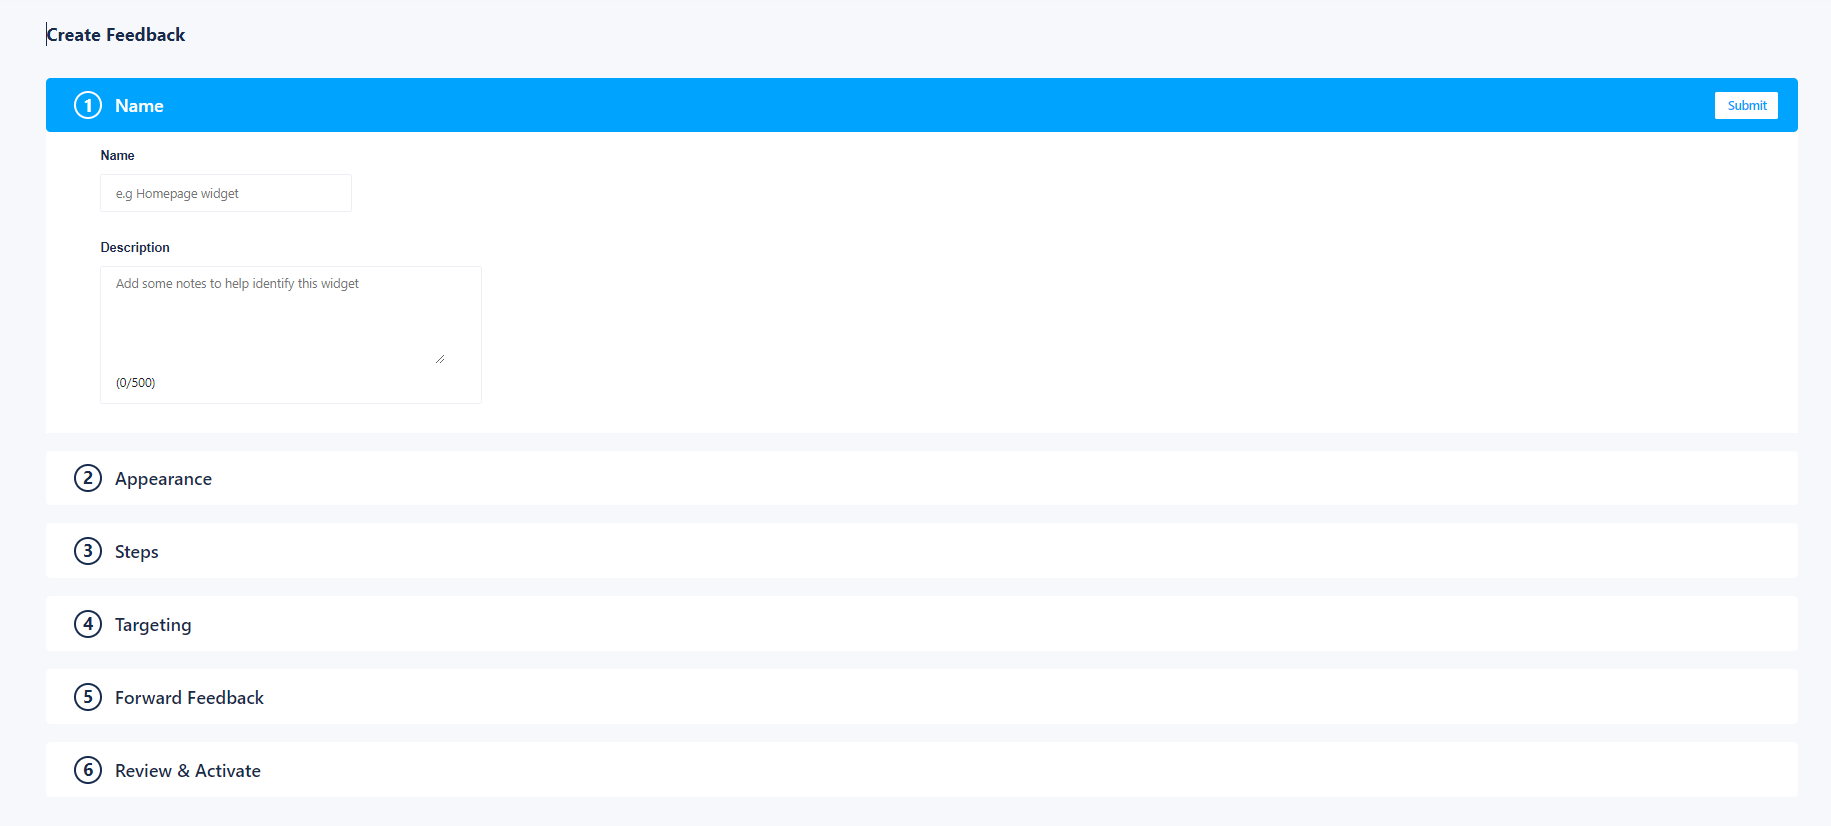
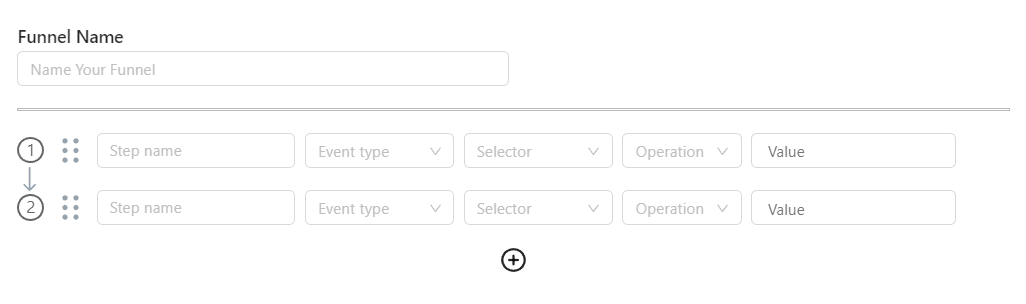
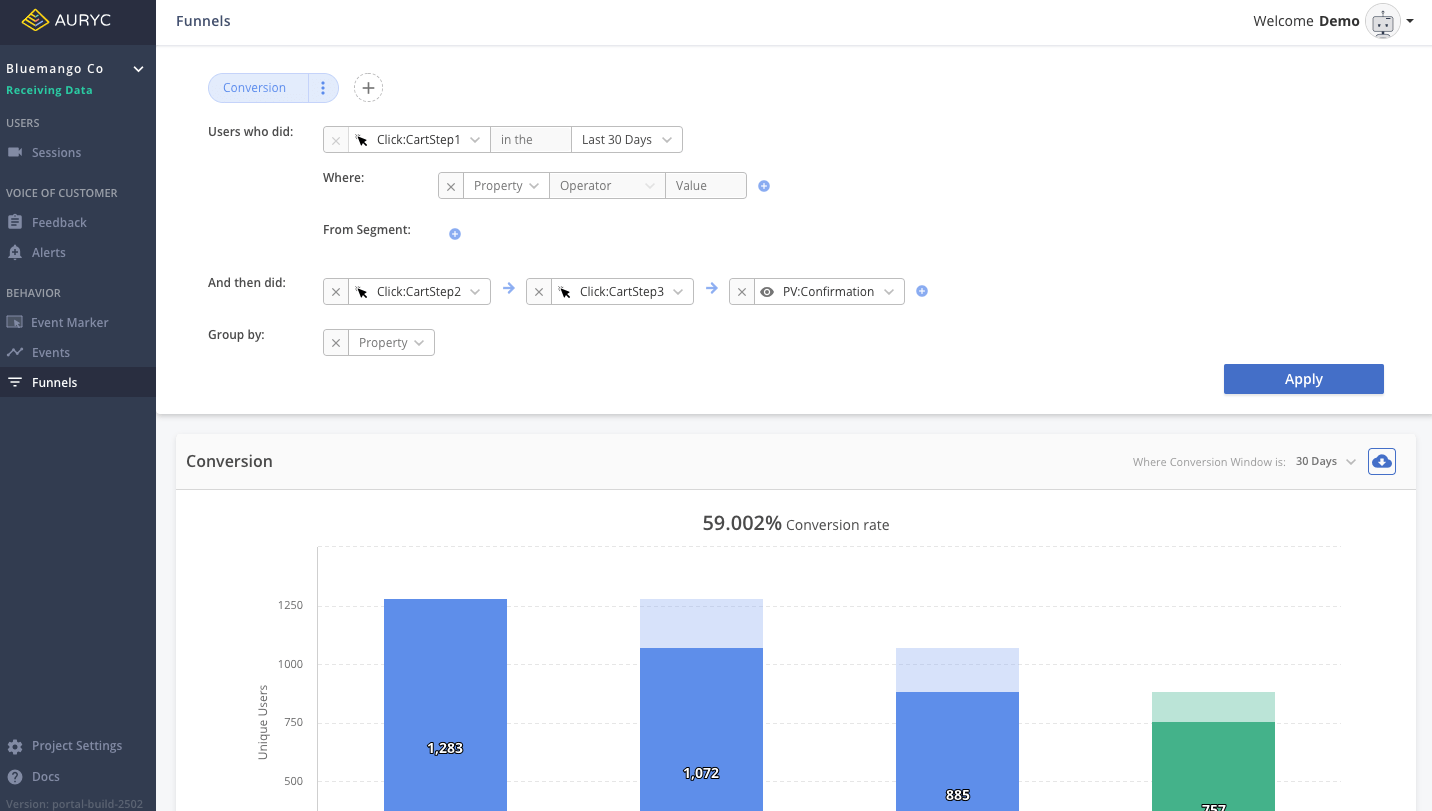
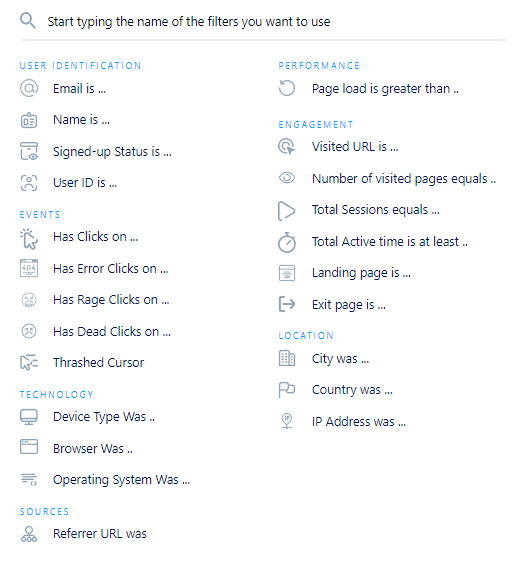
Create a funnel and start with conversion tracking
With FullSession, creating funnels takes minutes. You can easily:
Define the funnel name
Set up all steps in the process
Define event types (clicks, visited pages, or changed inputs)
Choose a selector or text
Define operation and value
Add filters
Create and save segments
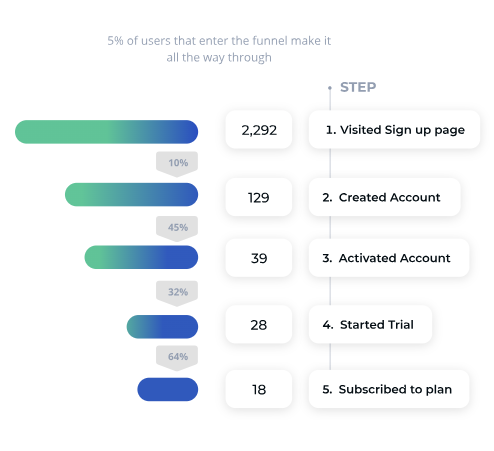
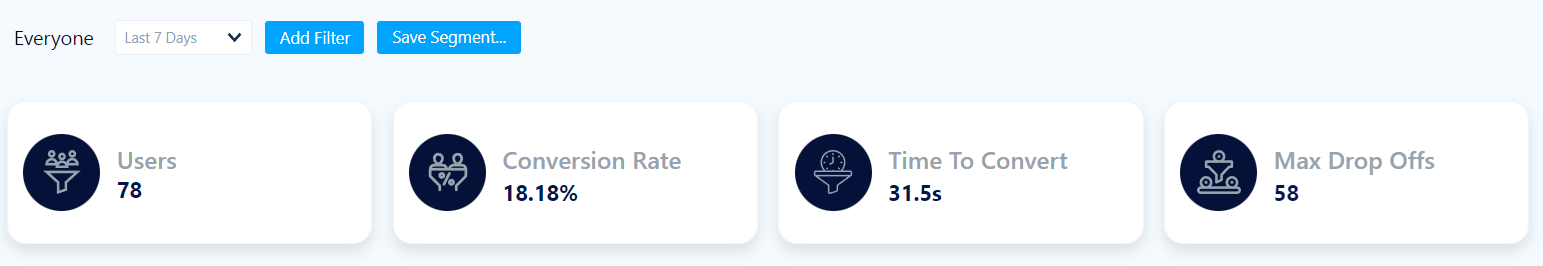
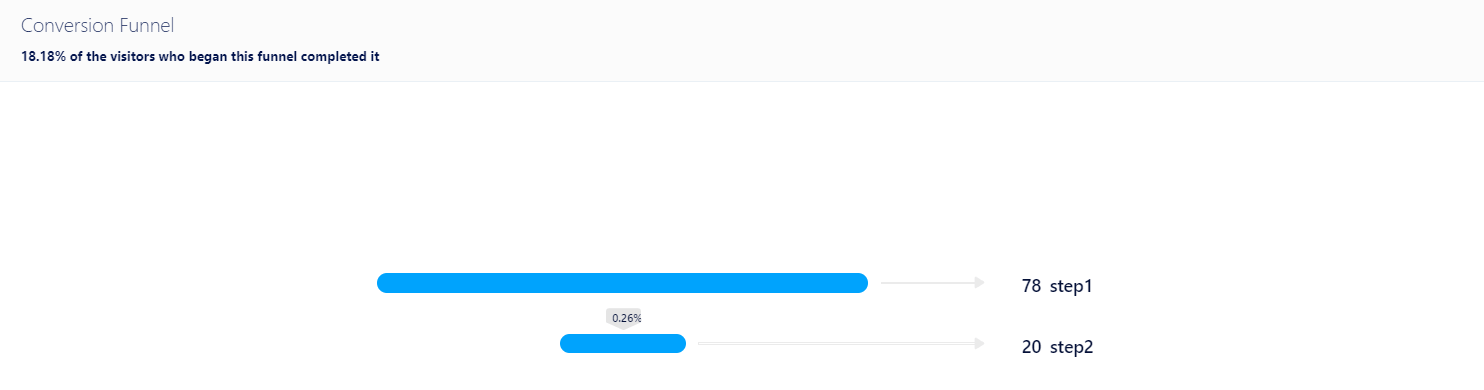
FullSession provides valuable metrics to help you decide on the next steps for improving your results. You can see the number of users, conversion rate, time to convert, and max drop-offs.
You can even track results for each step in the funnel and assess how many visitors achieved your desired action or bounced before completing it.
You can then reevaluate your funnel, assess your steps to adjust your strategy and watch how your conversions increase in real-time.
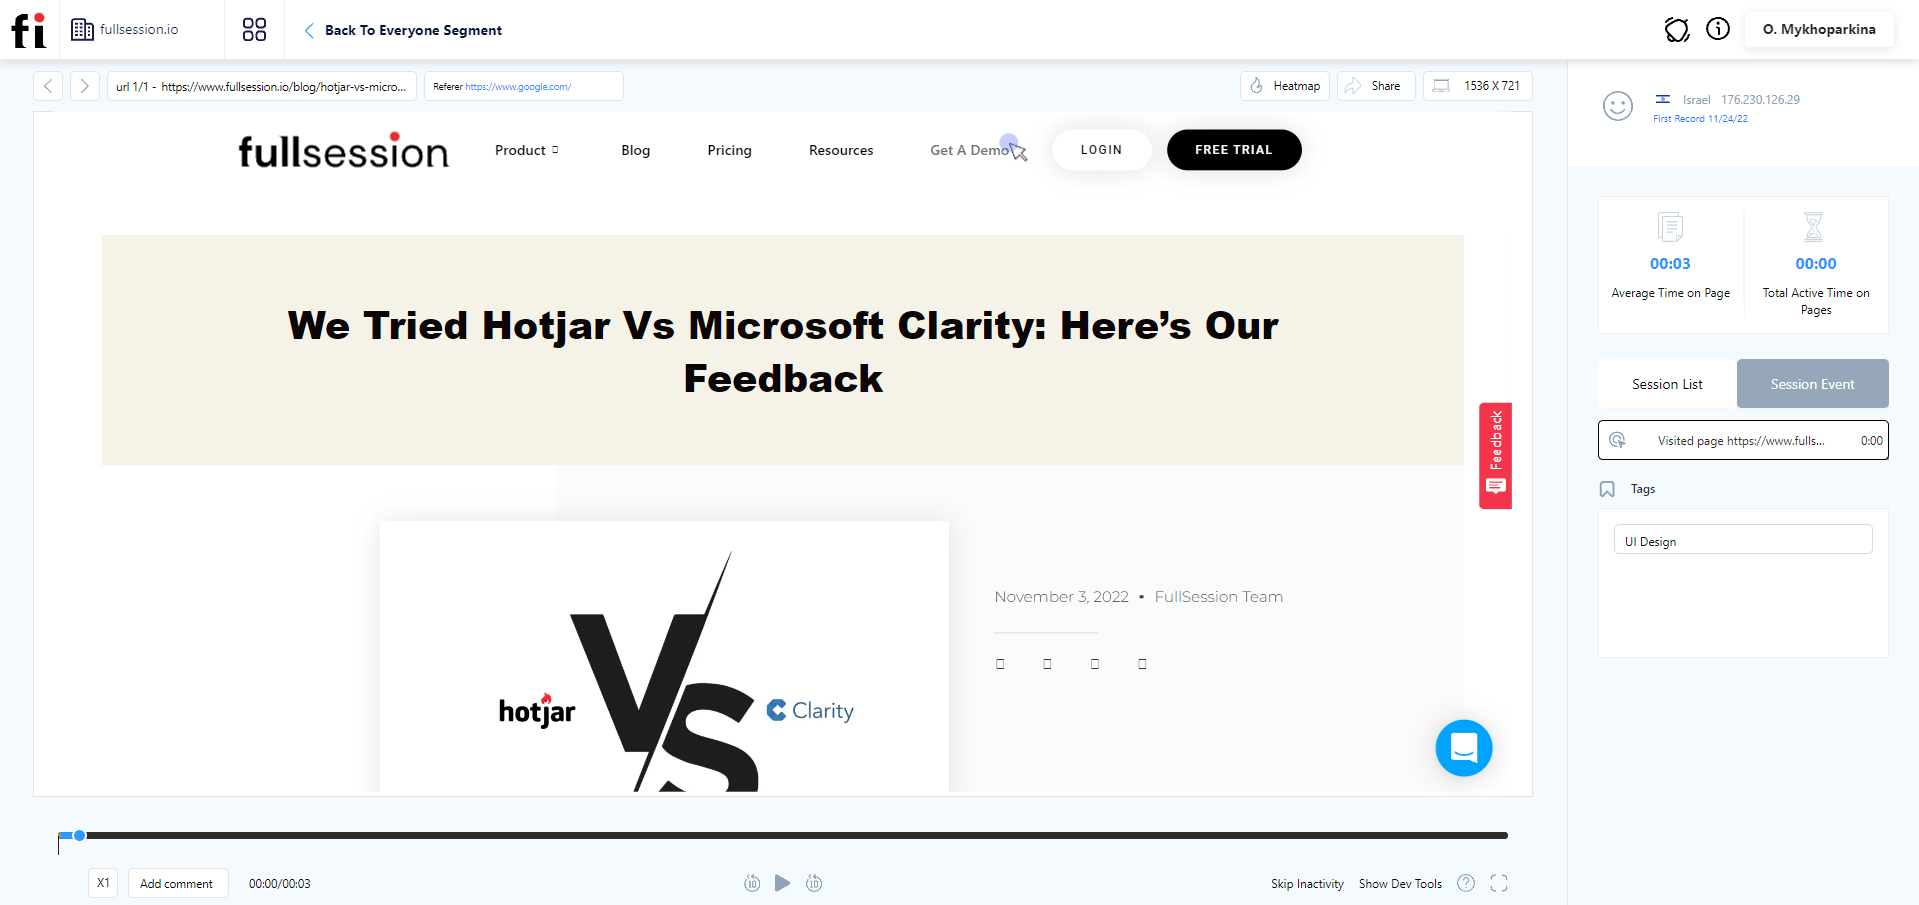
Understand why users leave your site with session recordings
The great thing about FullSession is that you don’t need to evaluate statistical data to understand what’s happening during user sessions. With our website tracking tools, you can get an accurate picture of your funnel issues.
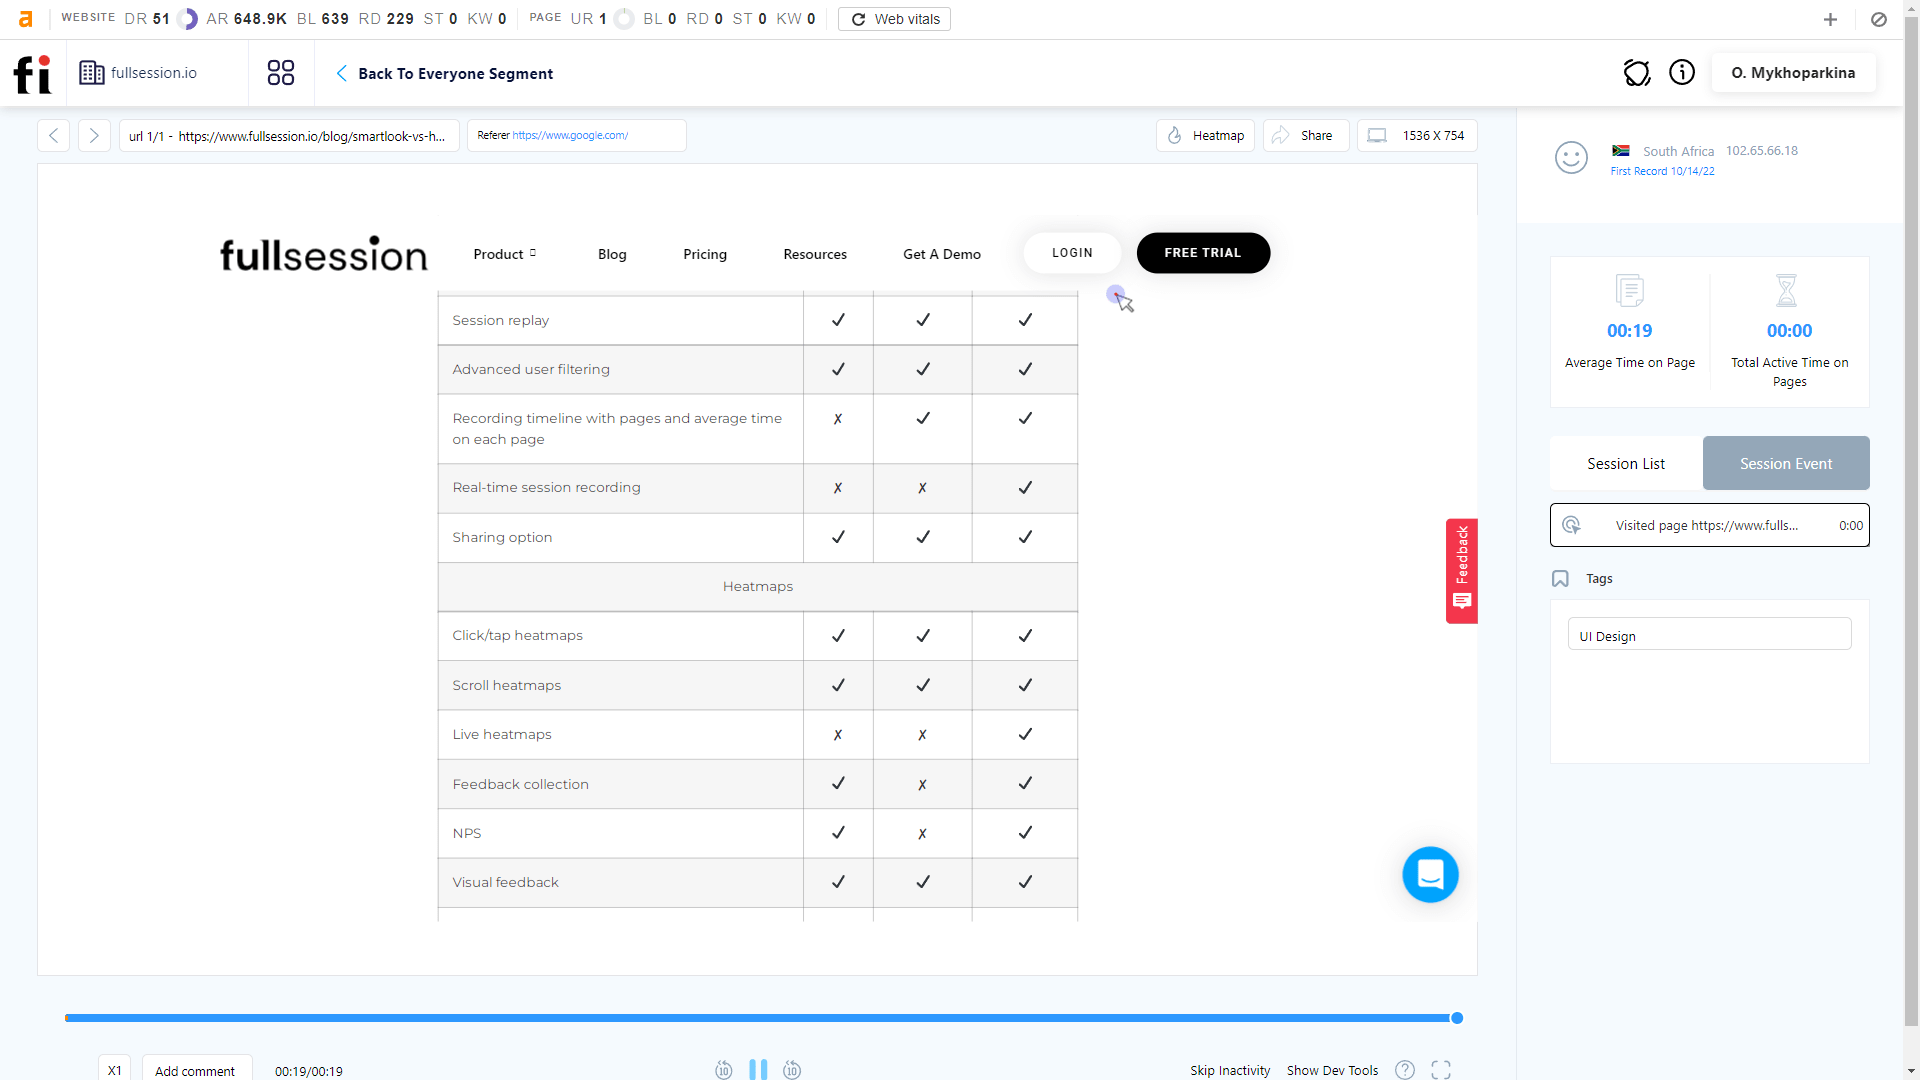
You can watch how people interact with your website via session recordings and replays, observe the problems they encounter and draw your conclusions to make necessary adjustments.
The tool allows you to watch the recordings however you like – pause, rewind, fast forward, and even skip periods of inactivity to save time.
FullSession also provides customer data: their IP address, country, device, operating system, a list of visited pages, average and total time spent on pages, and more.
Monitor how users engage with your site with interactive heatmaps
Session recordings aren’t the only feature you can use for tracking website visitors and collecting data regarding their behavior.
With FullSession, you also have access to website heatmap tools which help you identify issues people face on your website that lead to funnel drop-offs.
FullSession offers three interactive heat maps: click maps for click tracking, cursor maps, and scroll maps. Each of them provides access to slightly different information. Let’s share some details.
Click maps
Click maps let you understand what web page elements are not working as intended, so you can fix usability issues and increase customer satisfaction.
Movement maps
The second type of heatmaps allows you to track the precise movement of the mouse cursor during a given session. You can see what page elements users avoid – the potential cause for a funnel drop.
Scroll maps
The third and final heatmap type – scroll maps – lets you know how far a given user scrolls down the page they visited. Pages that are too long can cause people to leave the site. You can also use scroll maps to evaluate the effectiveness of your landing page.
Get insights into customer satisfaction with website feedback forms
Session recordings and interactive heatmaps are great, but users are sometimes the best information source.
FullSession provides customer feedback tools you can use to communicate with your users directly and collect valuable user feedback regarding the issues that cause funnel drops.
You can stay in touch with your customers and better understand their experience with your website as if you used a specialized NPS software platform. You can track all trends in customer feedback reports and watch session recordings connected to each feedback.
It helps you fix problems that negatively affect your conversion rates.
You can ask people to rate their experience and specific changes or features. It provides information that serves as context for what you see on session recordings and the conclusions you draw from our interactive heatmaps.
Our platform helps you understand the entire customer journey.
Five reasons to start using FullSession today
Here are some reasons to use FullSession for preventing funnel drops:
You can track real users – there is no need to spend your budget on hiring testers. You can observe real user interactions to understand what causes funnel drops.
FullSession doesn’t hinder your website speed– our tool doesn’t affect website performance in any way during data collection and analysis.
A wealth of tools in one platform – you can access plenty of powerful features: session recordings, heatmaps, customer feedback forms, UTM tracking, and more to optimize your funnels.
Intuitive interface – FullSession is very easy to set up and use and has a low learning curve.
Crucial data is easily accessible – thanks to powerful segmentation and filtering options, you can easily find specific sessions, events, and other kinds of data.
Thanks to a robust feature set and intuitive design, FullSession is a great help for businesses that want to understand their users better and improve their conversion rate.
Funnel drop: The bottom line about increasing conversions
Funnel analytics is essential for businesses looking to increase conversions. It helps you identify website areas where you lose customers.
To reap the benefits of your funnel analysis, however, you must optimize your funnels and reduce drop-offs. To do that effectively, you need to collect valuable user behavior data.
FullSession helps you get insights into user behavior via session recordings and replays. Our interactive heatmaps allow you to track user journeys easily.
The customer feedback forms let you collect valuable feedback directly from users, and funnels and conversions let you track customer journeys effortlessly. FullSession also helps you find the data you need in a given moment, thanks to powerful filtering and segmentation features.
Here are answers to some common questions regarding funnel drop-offs.
What is a funnel score?
Funnel score is a metric that measures how likely a customer is to convert at each stage of the sales funnel. A funnel drop occurs when a customer drops out of the funnel at a particular stage.
What is the purpose of a step-drop analysis?
A step-drop analysis is a type of funnel analysis used to identify how much effort – how many steps – it takes for a customer to complete the desired action. Tools like Hotjar provide this metric is important because it can help businesses identify areas where they may lose customers.
How do you measure a funnel drop-off?
There are a few different ways to measure a funnel drop-off. The most common is to track the number of leads or potential customers who enter the funnel – usually through a form on your website – and the number of leads or customers who exit the funnel at each stage.
Diving headfirst into a data-driven culture isn’t just a trend—it’s a transformational shift that’s defining the digital age. Today, businesses are swapping gut instincts for data-driven strategies, demanding a new arsenal of cutting-edge product analytics tools.
These tools don’t just crunch numbers. They unlock secrets to product improvement and smarter decision-making.
Enter the world of specialized product analytics tools. These powerhouses monitor customer interactions across platforms, uncover patterns, and refine product strategies, all while driving up customer engagement, increasing conversions, and solidifying customer loyalty.
Are you scouting for the best product analytics tools? Perfect timing! In this article, we’re about to unpack the top five tools on the market, exploring their features and benefits to help you make a savvy choice swiftly.
Ready to get started? Let’s dive into the essentials of product analytics tools and see how they can revolutionize your approach.
Product analytics tools are your secret weapon in understanding how users interact with your products.
Imagine being able to see every click, scroll, and purchase, turning what might seem like mundane actions into a treasure trove of insights–this is what makes product analytics tools important.
These tools help you get into the minds of your users and uncover what draws them in, what turns them away, and how they navigate through your offerings. By analyzing user data, you can pinpoint areas for improvement and create offerings that drive satisfaction and loyalty.
What Data Do Product Analytics Tools Collect?
What kind of data do product analytics tools collect, and why is it so valuable? Let’s dive into the rich pool of insights these tools provide, whether for your website, online shop, or app.
User Demographics
Think your product is one-size-fits-all? Think again. Digging into demographics like age and gender can reveal surprising insights into how different groups use your product – and how you can tailor your approach to win them over.
By understanding the needs and preferences of specific groups, you can craft marketing strategies and product features that truly resonate with them, elevating their overall experience.
Product Usage Patterns
Imagine being able to peer over your user’s shoulders as they navigate your site or app.
What do your users really care about? A peek at product usage patterns will tell you, detailing exactly which features capture their attention and how long they’re willing to linger. Reliable data is the game-changer you need to engineer features that genuinely impress.
User Engagement
This metric shows how well your product sticks with users. Users who are fully invested in your product send a clear message: you’re doing something right. On the flip side, lukewarm engagement can be a red flag, signaling areas that need a refresh.
In other words, user engagement metrics help you understand what keeps users coming back or what might be turning them away.
Session Analytics
Ever wonder what happens during a user’s visit? Session analytics break down user actions within a session, providing a storyboard of how users move through your site or app.
Friction and frustrations are exposed, and transitions are smoothed, resulting in a significantly improved user flow that directly correlates to increased user happiness.
By tapping into product analytics, you can unlock valuable insights that inform your strategy. It’s about more than just tracking sales or identifying leads. It’s about using data to optimize every aspect of your business.
Imagine having the competitive edge you need to surge ahead in your industry. It starts with using these tools to maximum effect – and that’s exactly what the most successful businesses do.
Measuring Product Performance
What if you had a dashboard that not only tracks every sale but slices and dices the data to show you who your buyers are, where they come from, and what exactly they’re buying?
Product analytics tools allow you to monitor these metrics in real time and let you see which products are flying off the shelves and which might need a marketing boost.
Identifying Potential Customers
With product analytics, you’re not just seeing who’s buying. You’re discovering who could be buying. Identify customer lukewarmth with tools that pinpoint interested users who are still on the fence about making a purchase.
Armed with this information, you can craft targeted offers or campaigns that convert these on-the-fencers into loyal customers.
Measuring Marketing Effectiveness
What’s the ROI of your latest marketing campaign? Product analytics tools take the guesswork out of this equation.
Your users are telling you something – are you listening? By analyzing their behavior and engagement, you’ll pinpoint what’s working and what needs a tune-up. In turn, you can make sure that every dollar you spend is an investment towards greater returns.
Tracking Internal Performance
Beyond external metrics, product analytics can turn the microscope inward to analyze your product’s internal health.
From feature usage to load times, these insights help you understand the user journey on a granular level, allowing you to make precise improvements that improve the overall user experience.
Finding Problems
Before small issues become big headaches, product analytics tools flag anomalies and trends that could indicate problems. Whether it’s a sudden drop in user engagement or a glitch in the checkout process, you’ll have the data you need to intervene swiftly and effectively.
Look at all the ways product analytics tools can be applied, and it’s no surprise they offer so many benefits. The most critical ones are up next.
Benefits of Product Analytics Tools
Here are six compelling benefits that underscore why integrating such a tool into your operations can lead to transformative outcomes:
Deep dive into customer insights: Product analytics tools peel back the layers of your customer interactions and provide a crystal-clear view of user needs and behaviors. With this data, you can make informed decisions about which features to roll out next or what updates to prioritize.
Measure impact and identify opportunities: Once you’ve implemented changes, how do you know they’re working? Take a closer look at your customer’s path, and you’ll start to notice recurring patterns – the points where they stumble, where they smile, and where they bail. Once you understand these chokepoints, you can revamp, renovate, and reboot to reignite customer love.
Proactive problem solving: Spotting problems before they escalate can save you not only resources but also your reputation. Product analytics tools help you identify gaps or glitches in your product early on.
Better cross-departmental communication: Keeping everyone on the same page isn’t always easy, especially in larger organizations. Real-time data provided by product analytics tools ensures that all departments—from product and marketing teams—have a unified understanding of what’s working and what needs improvement.
Reduce churn rates: Satisfied customers are loyal customers. To fix high turnover rates and exorbitant customer acquisition costs, take a tip from the usability experts: know thy users. Listening to their needs and straightening out kinks in their experience dramatically curbs fledgling buyer retention–and that bloated budget for replacement customers.
Features to Look For in Product Analytics Platforms
When you’re on the hunt for a top-notch product analytics tool, there are a few key features you definitely want to keep an eye out for:
User segmentation: This lets you break down data by specific groups, like age, location, or behavior. It’s super handy for tailoring your strategies to different audiences and seeing who loves your product the most (or least!).
Event tracking and interactive event analysis: You’ll want a tool that can track specific actions users take, like signing up, clicking a button, or making a purchase.
Funnel analysis: Check if the tool can analyze how users move through a set process, like making a purchase or signing up.
Real-time data: In the fast-moving world of tech, old news is no news. A tool that updates data in real-time helps you make quick decisions and stay ahead of the curve.
Heatmaps and session replays: Seeing exactly where users click, scroll, and spend their time on your page can be a goldmine.
Integration capabilities: Your product analytics tool should integrate seamlessly with other software you’re using. Seamless integration means less hassle and more powerful insights when data from different sources interact.
Customizable dashboards: Because one-size-fits-all rarely fits anyone! Being able to tweak your dashboard to show the metrics you care about most makes your life a lot easier.
Picture this: you have a product that users love, and you’re able to make data-driven decisions that propel growth. It all starts with picking the perfect analytics tool that translates user behavior into actionable insights.
Below, we’ve rounded up five stellar product analytics tools that are worth your attention.
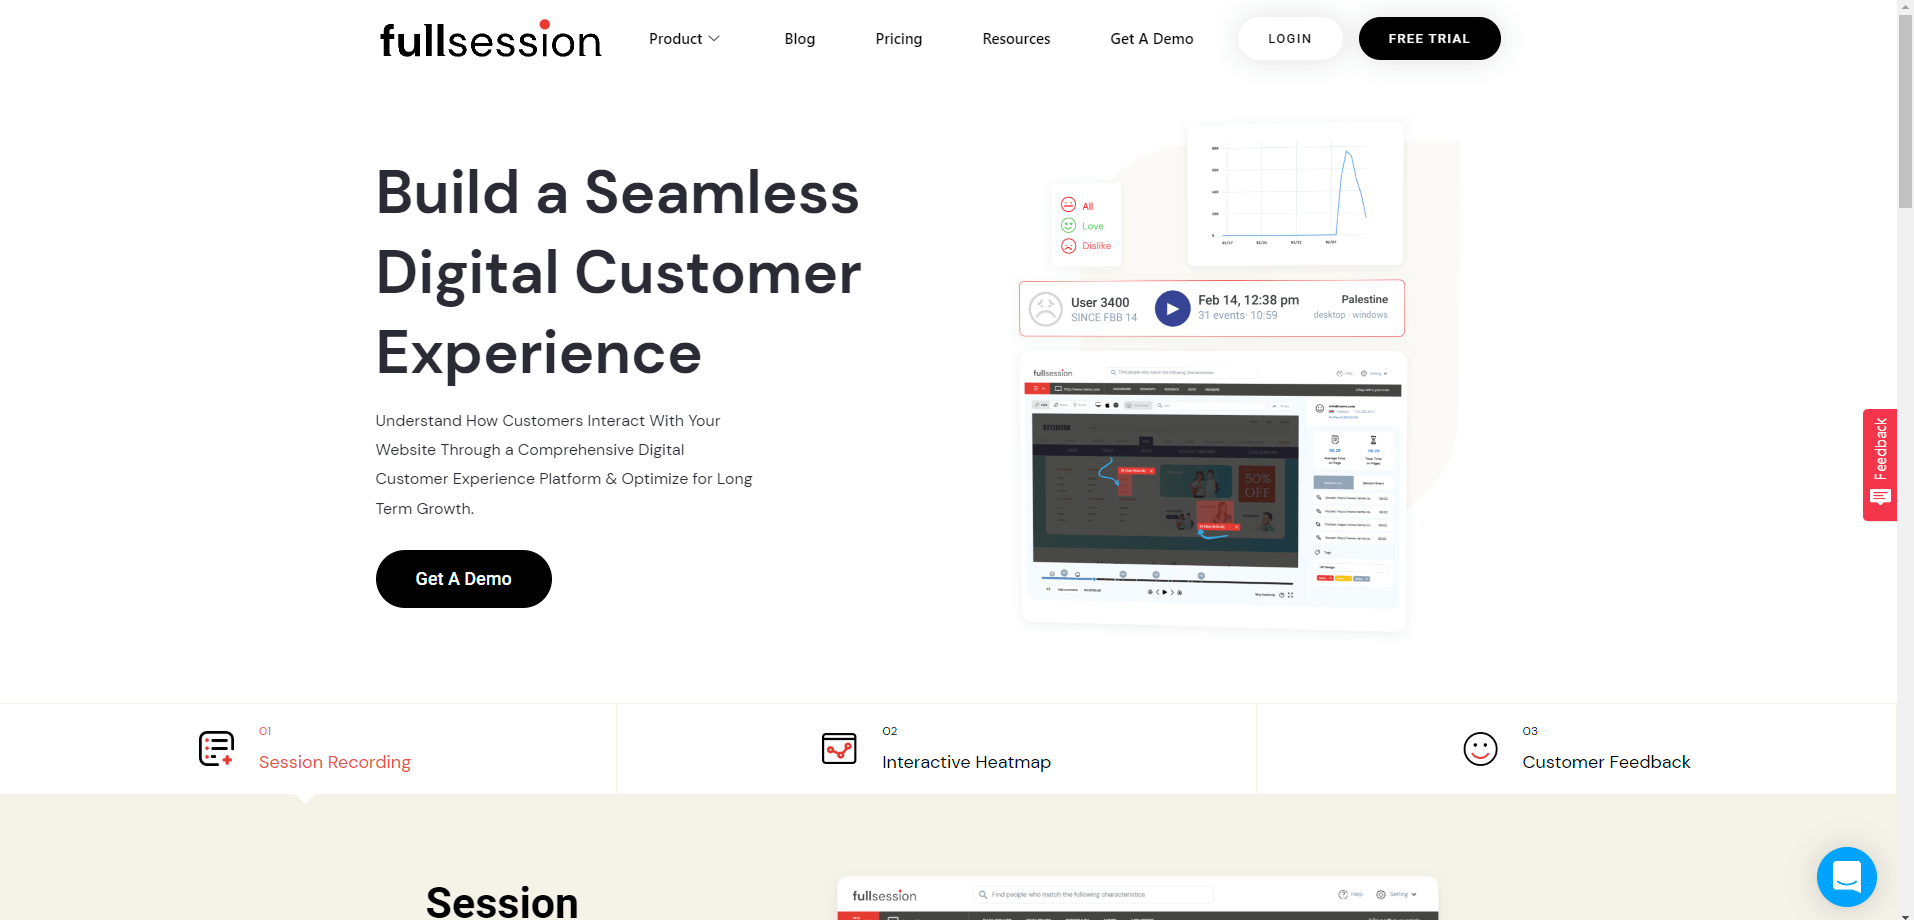
1. FullSession
FullSession is more than just a behavior analytics tool—it’s your gateway to really understanding what makes your users tick. With FullSession, you can dive deep into customer sessions and capture every click, scroll, and interaction.
Forget about simply gathering data; what you really need are specific, actionable clues that reveal exactly where users are hitting roadblocks or feeling the thrill of success.
By applying these insights, you’ll craft a product that genuinely resonates with users, fostering a deeper connection and fueling a loyal following. And the best part?
FullSession does all this heavy lifting in the background and makes sure that your website’s performance remains smooth and speedy.
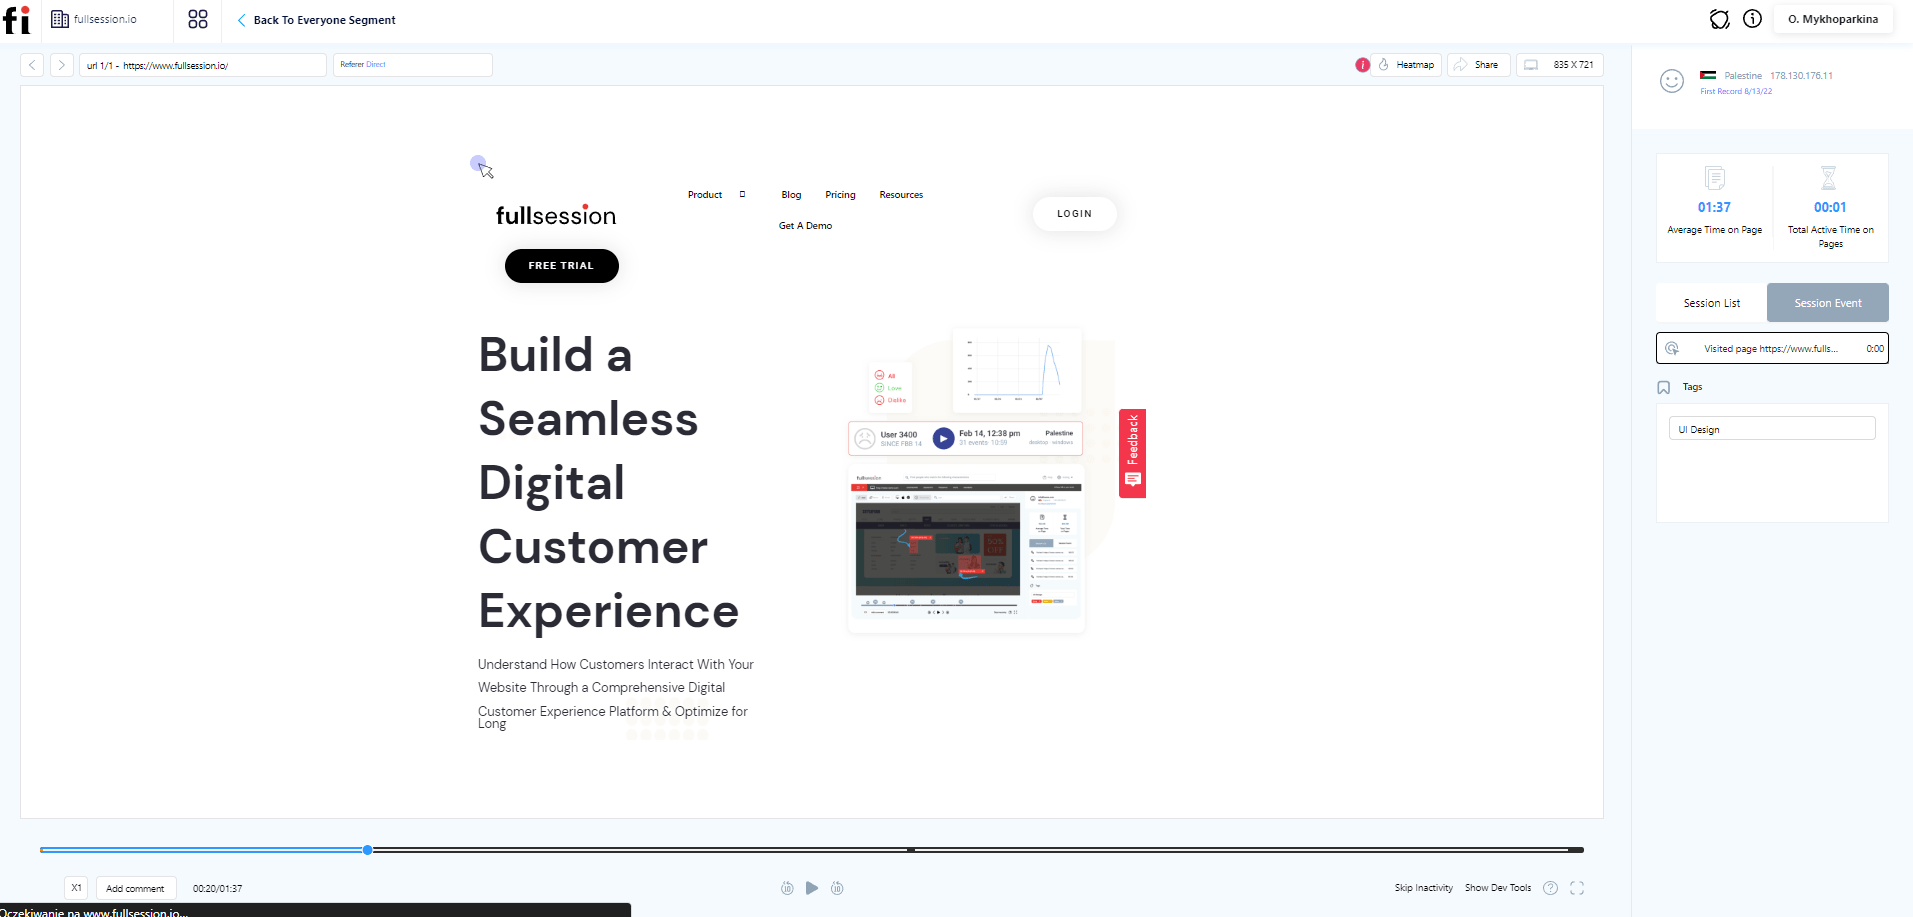
Session Replay
FullSession equips you with powerful session recording tools that let you observe how users engage with your website. Pull back the curtain on customer motivations: what captivates, what repels? Isolate the difficulties impeding your product’s progress, and devise a corrective course to reinvigorate its development.
Total clarity means saying goodbye to endless tweaks and hello to a webpage that truly represents you. Trim the fat, power up your message, and watch your audience respond.
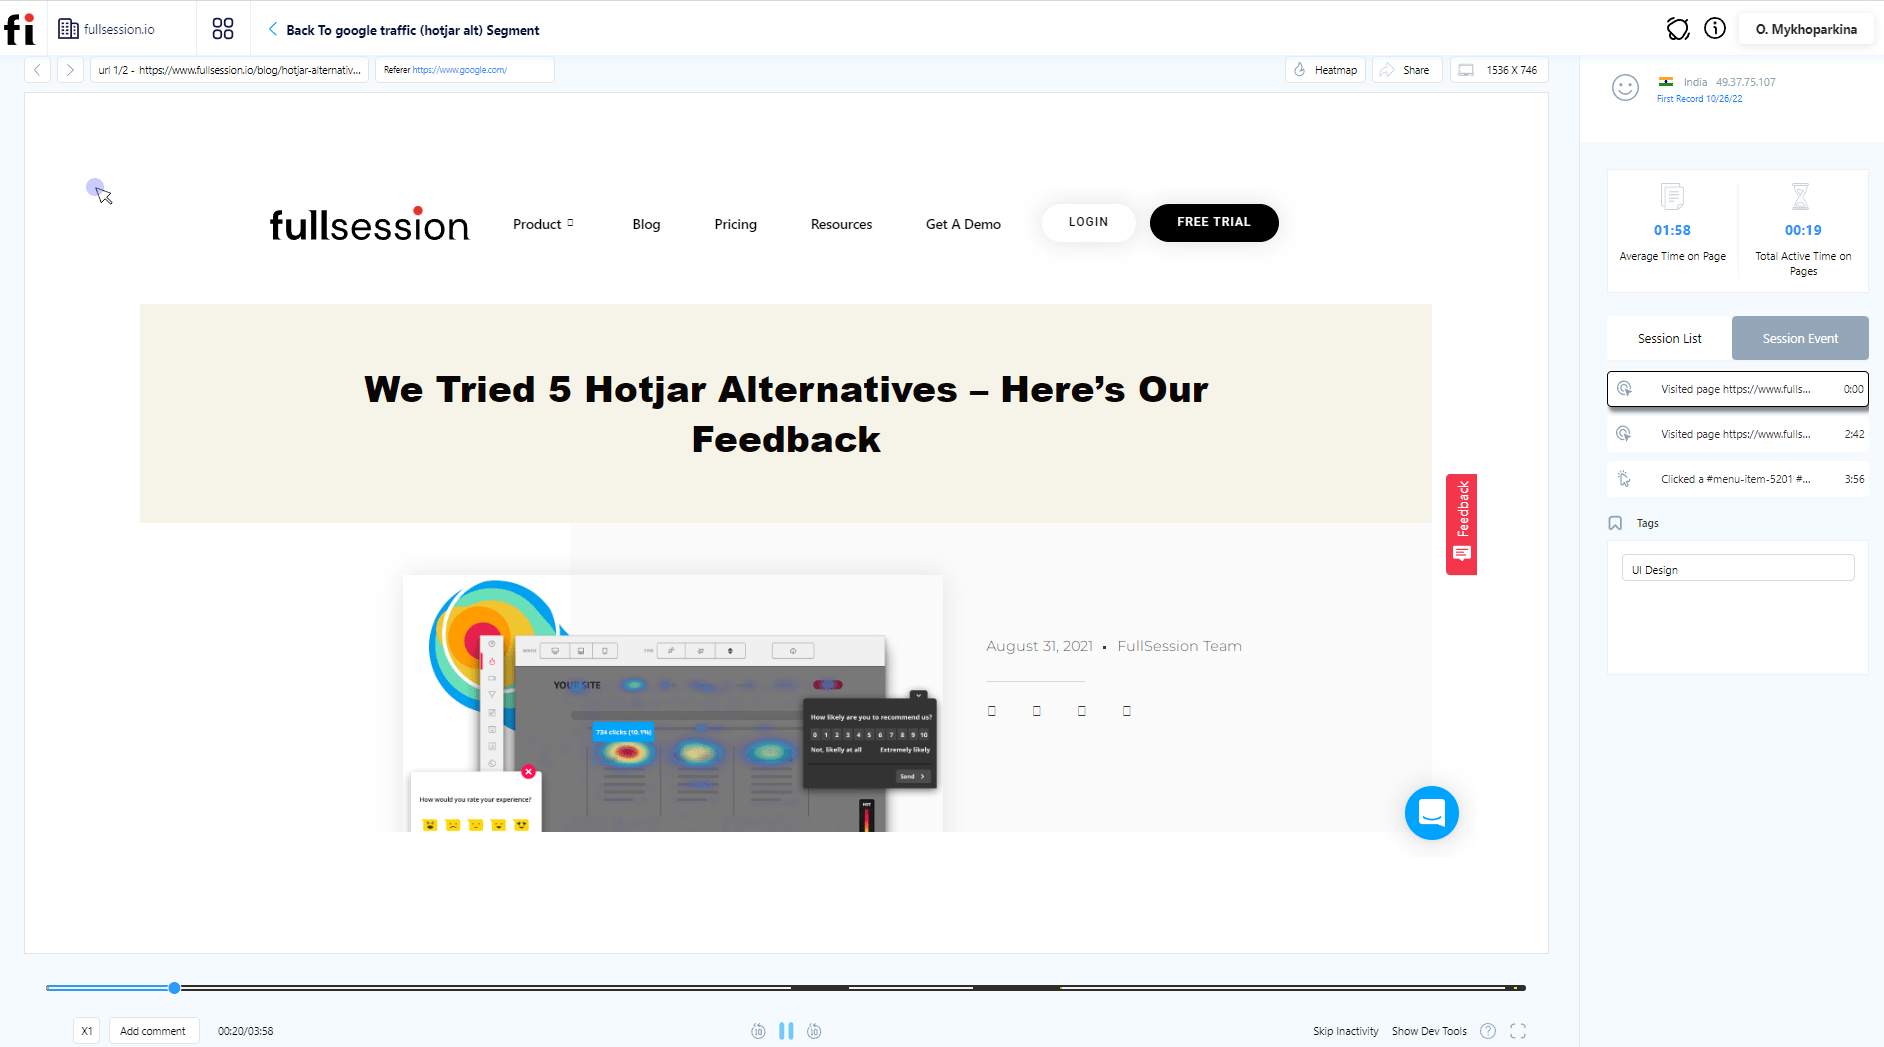
Pro tip: You can monitor user activity in days, weeks, months, or even years. You can watch entire sessions, skip periods of inactivity, pause, fast forward, and rewind each session recording.
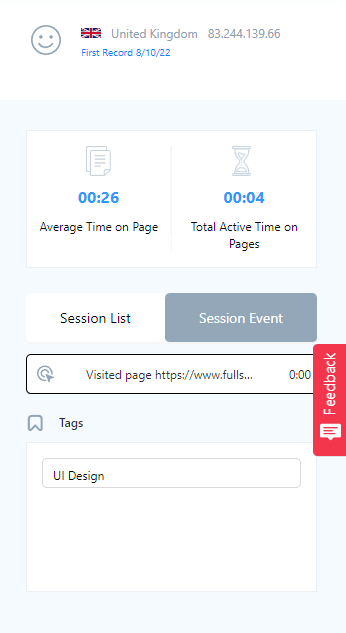
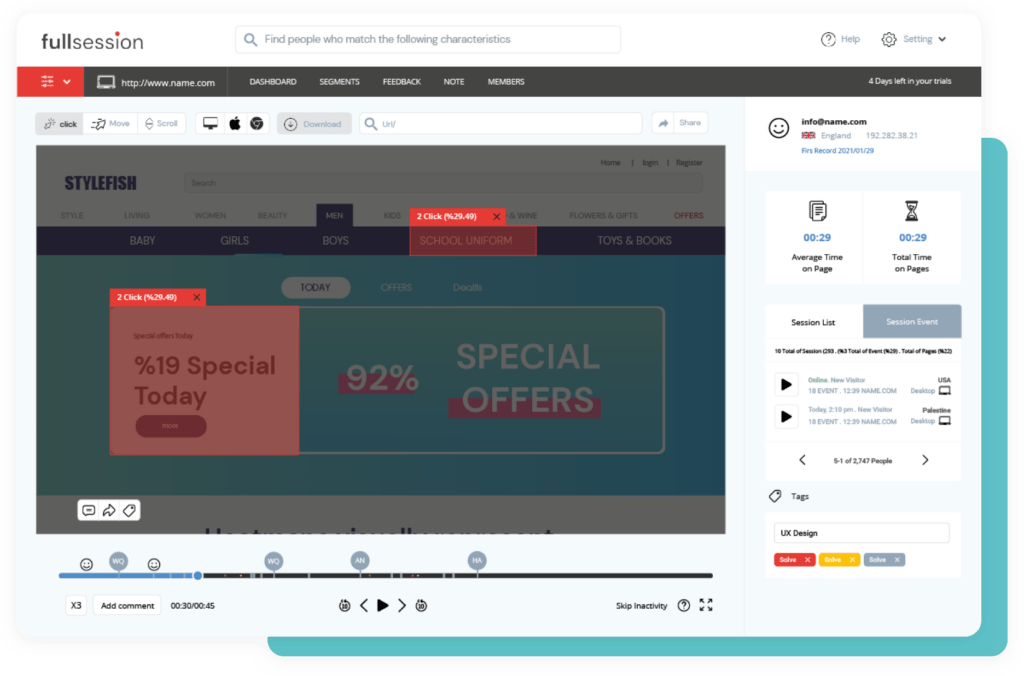
FullSession Session Recording and Replay Data
User locations and IP addresses
Visited URLs
Visit sources
Session list
The session event data
Screen resolutions
Average time on page
Total active time on pages
Interactive Heatmaps
If you’re keen on getting a deeper understanding of how users interact with your site, FullSession’s interactive heatmaps are just what you need. With tools that track cursor movements, clicks, and scrolling behavior, you can literally see the hotspots where users are most engaged and the cold spots where they’re not.
What’s crucial here is recognizing the exact spots where users struggle or get bored and making adjustments to get them back on track. Product interactions can make or break the user experience.
By digging into these interactions, you’ll uncover tangible ways to upgrade your product’s functionality and charm, essentially marrying form and function in a way that users will love.
Ready to see these tools in action? Explore these examples of FullSession’s interactive heatmaps in action, and see how they can help take your site to the next level.
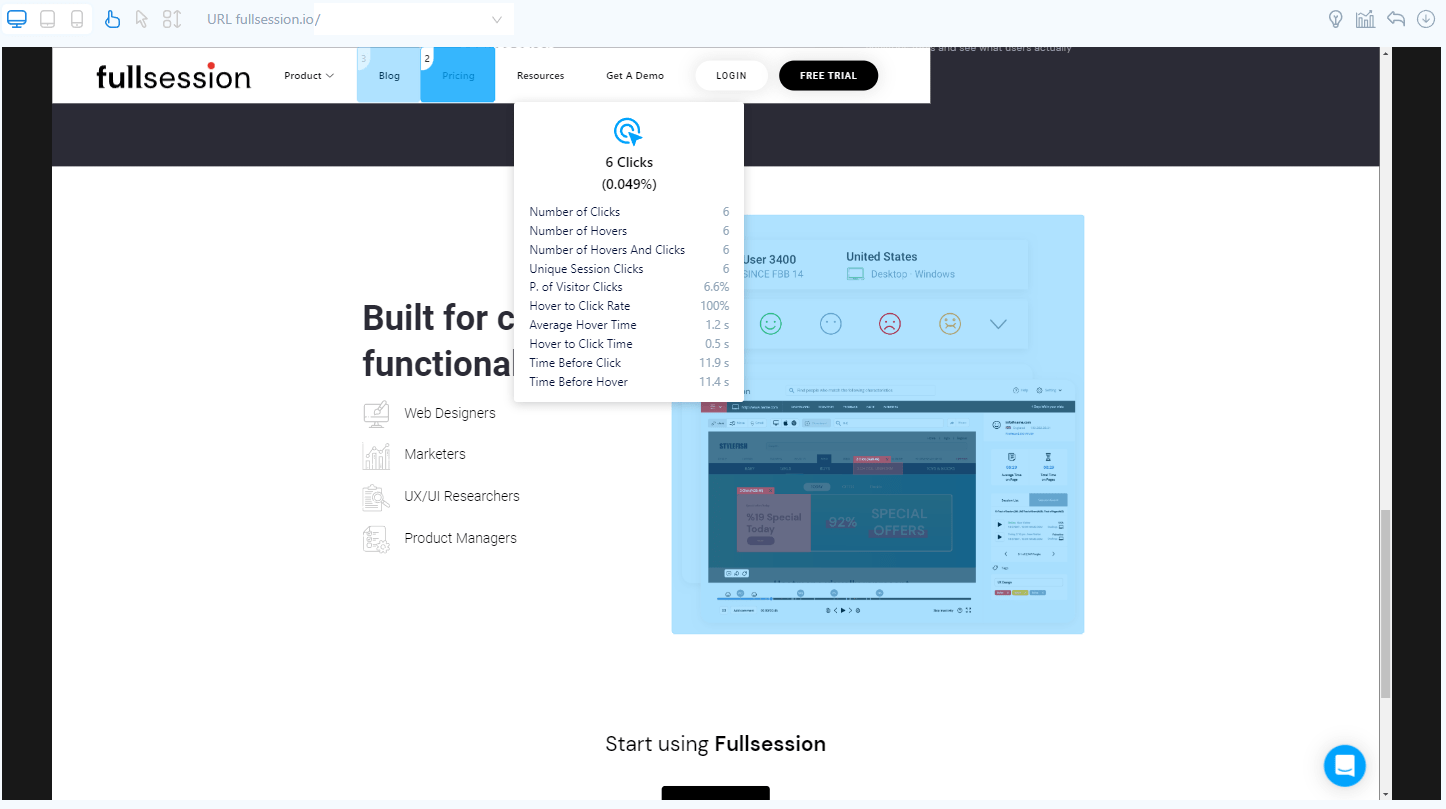
Click maps
As the name suggests, click maps let you see what elements people click on the most on your web pages. Click tracking allows you to see what draws their attention.
Mouse movement maps
By mapping out cursor movements, you can see where users spend the most time and identify areas that may be causing confusion or frustration. An easy-to-navigate and understand website builds loyalty and trust, and this information is the first step in making that happen.
If you notice that users spend much time figuring out how to use a particular feature, you can make changes to make it more intuitive. Or, if you see users getting frustrated with a specific process, you can streamline it to make it more efficient.
Scroll maps
A scroll map represents how far users scroll down a page. It allows you to see which areas of the page are most popular and where users are most likely to scroll to.
You can use this information to place essential messages (such as a Call to Action) in the perfect spot. Scroll maps are handy for long pages, such as articles or product listings.
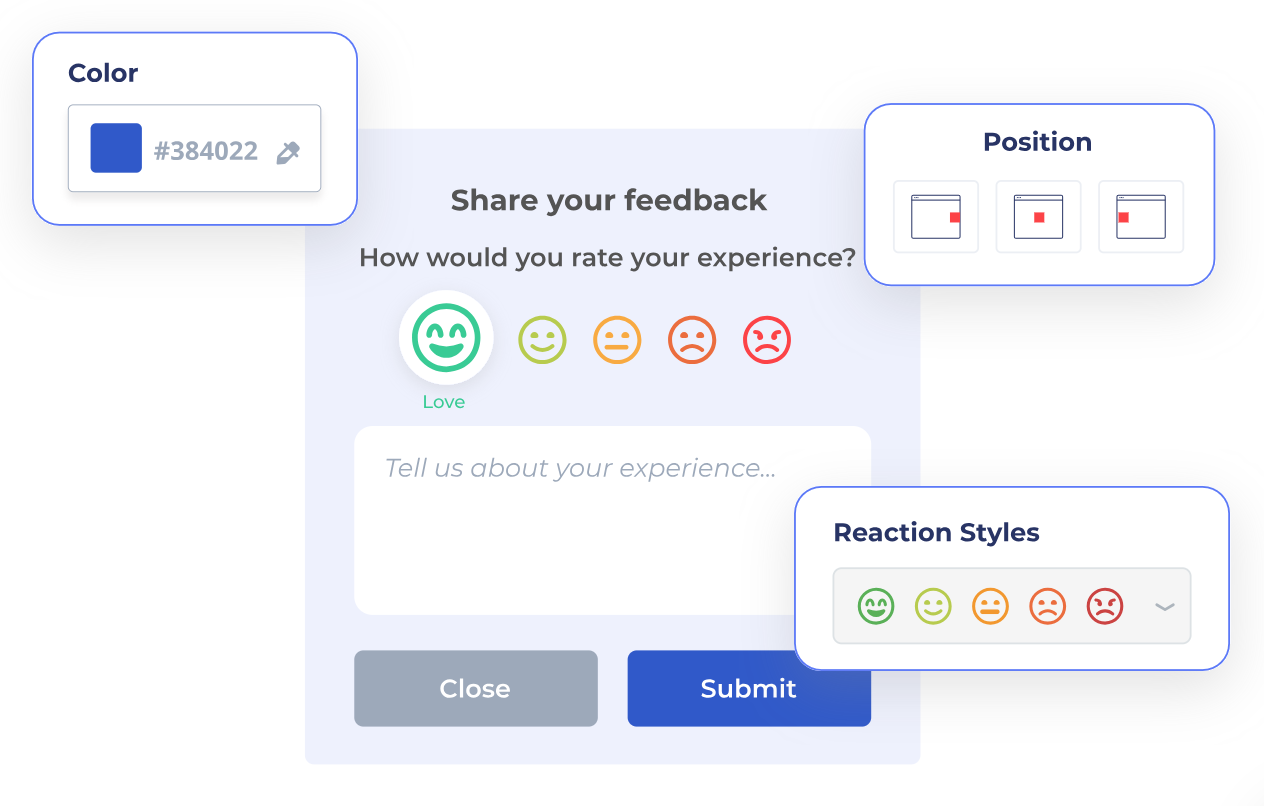
Customer Feedback Tools
Customer feedback tools are your secret weapon in the quest to truly understand what your customers think and feel about your product—no need to shell out for pricey specialized NPS software.
What if you could finally get straight answers from your customers? A simple feedback form can be your ticket to a deeper understanding of what makes them tick. But why stop at forms?
Pair these insights with session recordings to watch your users in action. This dynamic duo of feedback and visual playback lets you dive deep into the customer experience, seeing firsthand where they thrive and where they struggle.
You can see all customer feedback on our dashboard, which makes tracking trends over time easy. The page offers various details, such as:
Author’s identity
Form’s name
Creation date
The number of responses
Activity status
When monitoring your customer feedback forms, you’ll access even more details:
Form’s ID
URL
Date
User comments and individual feedback
User sentiment (rating)
Browser used
FullSession offers powerful segmentation and filtering features. You can find what you want to see during specific sessions with ease.
FullSession also offers a metrics page you can use to see website details, including
% of sessions on mobile devices
The number of dead clicks and error clicks
Average page load speeds
Median scroll depth
Console errors
FullSession also helps with in-team and cross-team cooperation. You can leave notes to share information with other people.
You can use our platform to track conversion rates and other conversion-related data: % of converted users, time to convert, and more.
From the moment users land on your site or launch your app, Auryc is there, capturing every click, swipe, and tap to help you build a richer, more intuitive experience. This powerful tool shows you exactly how users interact with your site.
With features like visual session replays, journey mapping, and super-clear heatmaps, you get the whole story of user experience.
What’s really great about Auryc is how it handles feedback. You can pop surveys and feedback forms right into the user flow, catching folks exactly when they’re most engaged. On the spot, you’ll receive informed feedback that enables data-driven refinements.
Who Uses It?
Various specialists can use Auryc: customer support teams, UX designers, marketers, product teams, finance, operations, and IT departments.
Features
Session replay: Watch user sessions to see how users navigate your site.
Voice of customer: Gather valuable feedback directly from customers using integrated feedback tools.
Event marker: Analyze data on specific events retroactively to understand user actions better.
Heatmaps: Track where users click, move, and scroll to see what captures their attention.
Insights: Access advanced analytics and dynamic reporting for deeper understanding.
Mobile app analytics: Utilize Auryc’s capabilities on mobile applications for consistent analysis across platforms.
Smart funnels: Analyze and optimize your funnel to improve conversion rates.
Smart path analysis: Track and understand user flows to enhance navigation paths.
Reports: Create detailed e-commerce and B2B reports to inform business decisions.
Pros
Provides various kinds of data
You can use it on mobile devices
Cons
Videos can be memory-intensive
Some users complain about the maturity of some of the features
With Indicative, the mystery of customer behavior dissolves, and you’re left with actionable ideas that show you care about the people behind the numbers.
This platform makes customer behavior analysis accessible to anyone, regardless of technical expertise – no SQL knowledge required.
Who Uses It?
Indicative is a tool for product managers, marketers, and data analysts.
Features
Customer journey analysis: Delve into the paths your customers take, uncovering insights that can lead to more effective marketing and product decisions.
Cohort analysis: Segment users based on behaviors and track how these groups evolve over time.
Behavioral targeting: Personalize experiences based on user actions to increase engagement and conversion rates.
Multi-path analysis: View and analyze the many different paths users might take within your app or site, helping to identify the most critical areas for improvement.
Integration simplicity: Easily connect with existing data sources for seamless data synchronization and analysis.
User segmentation: Create dynamic user segments based on real-time behavior to target with more personalized campaigns.
Event tracking: Capture and analyze specific user actions to see what drives user engagement and retention.
Pros
Users don’t need to know SQL to operate Indicative
Offers in-depth insights into the paths customers take
Features an intuitive dashboard that simplifies complex data analysis
Cons
Some users may find the customization options for reports and dashboards limited compared to other more flexible platforms
While providing significant value, the pricing can be a barrier for smaller companies or startups
The sheer volume of data available can be overwhelming for users who are not used to working with complex analytics tools
What if you could pinpoint exactly what makes your users happy (or frustrated)? Pendo’s digital experience intelligence tool is designed to listen in on their thoughts, behaviors, and habits, so you can refine your product to their exact needs.
There are, in fact, two tools–Pendo Engage and Pendo Adopt–but they form one comprehensive solution.
Who Uses It?
Pendo can be used by many specialists, such as marketers, product managers, UX researchers, web designers, and others.
Features
Analytics: Gain insights into feature adoption and user behavior to better understand engagement and improve user interaction.
In-app guides: Assist users directly within your application to enhance their experience and your communication.
Roadmapping: Strategically plan and visualize product development paths to align with business goals.
Mobile support: Extend functionality to mobile websites and apps, ensuring a consistent user experience across all platforms.
Voice of the Customer: Gather and analyze customer feedback to refine products and services in alignment with user needs.
Pros
Roadmaps help guide the product in the right direction
Supports mobile devices
Cons
Some users complain about limited data visualization
Some reviews mention bad web performance, which impacts user experience
Expensive for what it does
It could be more intuitive
5. GainInsight
Image source: TrustRadius
Ever wonder what your users are really doing when they use your product? GainInsight is here to fill in the blanks, giving you a clear picture of their interactions.
Think of the platform as a three-legged stool, and each leg plays a vital role. Success hinges on three things: championing customer causes, spinning inspiring experiences, and harboring authentic, nose-to-the-grindstone familiarity.
Who Uses It?
GainInsight is for product teams, customer experience specialists, sales operatives, IT departments, community teams, and executives.
Features
Advanced product analytics: Discover growth opportunities and delve into user paths and funnels to optimize user journeys.
Native omnichannel engagement: Set up and customize in-app engagements, including onboarding checklists, to enhance user interaction across platforms.
Closed-loop feedback: Deploy in-app surveys to collect extensive feedback, allowing for scalable and direct user insights.
Product communication: Maintain an open line of communication with users, keeping them updated and engaged with your product developments.
Horizon analytics: Monitor and analyze long-term trends with comprehensive data visualizations on dashboards.
Success planning: Utilize GainInsight to refine and improve your product’s effectiveness and market fit.
Pros
You can use it with SaaS services, desktop, and mobile devices
Comprehensive and robust tool that lets you collect various kinds of data
Cons
May have a complex setup process
The depth of product analytics data can be overwhelming, especially for users who are not data-savvy
Maintaining and making the most out of GainInsight can require substantial ongoing time and effort from your team
Table Comparison
Here’s a short comparison of all five tools mentioned in this article.
Features
FullSession
Auryc
Indicative
Pendo
GainInsight
Real-time Session recording
✔
✔
✘
✘
✘
Funnel analysis
✘
✔
✔
✔
✔
Conversion tracking
✔
✔
✔
✔
✔
Behavioral analytics
✔
✔
✘
✔
✘
Customer segmentation
✔
✔
✔
✔
✔
A/B testing
✘
✘
✘
✘
✘
Customer journey mapping
✘
✔
✔
✘
✔
Dynamic heatmaps
✔
✔
✘
✘
✘
Customer feedback
✔
✔
✘
✔
✔
Insights
✔
✔
✔
✘
✔
Free trial
✔
✘
✔
✔
✘
Free version
✘
✘
✔
✘
✘
Go With The Best Product Analytics Tool
Wrapping this up, picking the right tool for product analytics and customer engagement is key. While many tools have some great features, they can be a bit too complex and pricey for some businesses.
That’s where FullSession really shines. It’s straightforward and easy to use, giving you powerful tools like session recordings and heatmaps without the fuss. With FullSession, you can quickly spot and fix any issues that are messing with your user experience, which will ultimately lead to better customer satisfaction and retention.
Going with FullSession means you’re choosing a tool that delivers the insights you need without all the extra complexity or steep learning curves.
You get the best of both worlds: function and fashion, combined in a way that makes this a standout choice for any business wanting to supercharge its user interactions.
Ready to get started?
FullSession Pricing Plans
Here are more details on each plan.
The Starter plan costs $39/month or $32/year and allows you to monitor up to 5,000 monthly sessions with up to 6 months of data storage.
The Business plan costs $75/month or $60/year and helps you to track and analyze up to 100,000 monthly sessions with up to 12 months of data storage.
The Enterprise plan has custom pricing and offers customizable sessions plus full access to all features.
Install Your First Product Analytics Tools Right Now
It takes less than 5 minutes to set up your first product analytics tools, withFullSession, and it’s completely free!
FAQs About Product Analytics Tools
What features are must-haves in a product analytics tool?
First, you need to spot the trends, such as what sections of your site resonate with them and what sends them running. That means finding tools that offer event tracking, journey mapping, and up-to-the-minute updates that keep you in the loop.
Can I use these tools on mobile apps too?
Absolutely. Most product analytics tools like FullSession are built to handle data from both websites and mobile apps, so you can keep an eye on all the ways users interact with your product.
What’s the difference between product analytics and other types of analytics?
Product analytics specifically zeros in on how users engage with your product, while other analytics might focus more on broader business metrics or marketing performance. It’s like having a specialist for understanding user interaction.
Is there a free product analytics tool?
If you don’t want to invest in a premium product analytics tool yet, start with Google Analytics. While this free resource can provide a solid foundation, it’s not a silver bullet. Expect to supplementation with more in-depth data to really drive results.
Product adoption is critical for measuring the success of your product and business overall. Improving product adoption has become a challenge for most companies, so there is an increasing focus on user behavior tools that support adoption efforts.
User behavior tools can impact product adoption by giving your team insights into how users interact with your product. For example, a platform like our FullSession helps you improve various aspects of your site with session recording tools and website heatmap tools.
This blog post will explain the importance of product adoption, walk you through the benefits, discuss common barriers and explain how to overcome them with FullSession.
Let’s start by explaining what product adoption is.
What is product adoption?
Product adoption includes using a new product or service to achieve specific goals. The product adoption process generally consists of learning and experimentation, during which users try out the new product or service to see if it meets their needs.
If the product or service is helpful, users may use it more regularly, eventually incorporating it into their everyday routines.
By understanding the factors influencing product adoption, businesses can increase the chances of success for their new product or service and ultimately boost their revenue.
Why is product adoption important?
There are a few key reasons why product adoption is so important. First, when customers adopt your product, they use it because it brings morevalue than other solutions on the market.
Second, product adoption is a crucial metric for determining whether a product is successful. If customers adopt your product, it’s a good sign that it meets their needs. Conversely, if customers don’t embrace your product, it’s a sign of a problem you need to address.
Finally, product adoption is vital for generating revenue. If customers are using your product, they’re more likely to pay for it. Even if they’re not paying for it, they’re more likely to recommend it to others, leading to more customers and revenue.
In short, product adoption is essential because it’s a key indicator of success, generates revenue, and provides valuable customer feedback.
The product adoption curve shows your product growth over time in a visual way. It reveals the number of people using the product at each stage of the adoption cycle against the percentage increase in total usage. You can track the adoption curve to understand how well your product fits the market and predict future growth.
The adoption curve is also known as the S-curve. It begins with a small number of users at the start, grows to a maximum as people rapidly adopt the product, and then declines as users gradually stop using the product.
The adoption curve helps you understand how new products or ideas gain traction and eventually reach a point of saturation. Let’s discuss the user types you should pay attention to based on their place in the product adoption curve.
Innovators
Innovators are always looking for the newest and latest products. They want to be the first to experience the product. They are willing to take risks, even if it means paying a higher price, because they want to say they were the first to use the product.
Early adopters
Early adopters tend to be more risk-averse than innovators but still want to try out new products. They often try to find practical uses for new products and can be opinion leaders in their communities.
As an existing customer, an early adopter is essential for the success of a new product because their endorsement can help a product become mainstream and reach a wider audience.
Early majority
An early majority is a group of people only interested in products tested and validated by others. They base their purchasing decisions on the product’s value and often wait for a price decrease before they buy. This group is crucial because it helps validate a product and make it more attractive to the late majority and laggards.
Late majority
The late majority is a very risk-averse group that is only willing to adopt new products once most of the population finds them valuable. Reaching the late majority stage on the product adoption curve usually means that the product has been completely validated on the market.
Laggards
Laggards tend to be more conservative and risk-averse than other groups in the product adoption cycle. They place a high value on safety and security and are often skeptical of new technology. As a result, they can be challenging to reach with new products.
Despite their resistance to change, laggards can be an important target market for new products and technologies. They may be more likely to adopt a new product or technology if it is recommended by a trusted source, such as a family member or friend or if it is necessary for their work or lifestyle.
Since we discussed the most important groups of users, let’s mention some key factors that impact their decision to adopt the product.
Many factors can affect user adoption of a new technology or system. Some key factors include
The ease of use and whether the product requires training
The quality of the product and potential issues regarding usability, reliability, and performance
The value of the product, including its price and cost-effectiveness
The usefulness of the product in real-life situations
Customer experience and satisfaction with the product, including customer service, technical support, warranties, and other features
Now, let’s discuss the most critical challenges that can decrease the product adoption rate.
Seven common barriers to product adoption
Product adoption is a complex process requiring users to undergo different stages before fully engaging with the product. Even if there are no universal rules for adopting any particular product, some common barriers might hinder your results. Let’s give a short overview.
Lack of awareness
When starting a new product, getting the word out and building awareness among potential customers is essential. The best way to do this is through a comprehensive marketing campaign that includes advertising, social media, and other outreach efforts.
Building brand recognition can help more people learn about your product and consider adopting it.
Product complexity
Complexity can be a real problem for products. A product that is too difficult to use will drive people away. You can overcome this challenge by ensuring your instructions are straightforward.
By explaining the background and context of your product, you can help people comprehend it better and use it more effectively.
Multiple target audiences
Getting a new product off the ground can be challenging when it requires adoption by multiple groups of customers. You’ll need to persuade each group of the product’s usefulness to succeed.
It can be daunting, but if you can effectively communicate the product’s benefits, you’ll be well on your way to success.
High costs
A high price can prevent customers from adopting the product, while a low price can result in lost revenue.
Indirect costs, such as development, maintenance, or advertising, can significantly impact pricing. Therefore, it is essential to consider all aspects when setting the price for a new product.
Fear of failure
Some products are somewhat risky by their very nature. It is often the case with new products that are very innovative and cutting-edge. Customers may be hesitant to adopt them because they’re unsure if the product will take off or provide support in the long run.
Fear of change
When trying new products, some people may be hesitant out of fear of change. They worry that their daily routines will be disrupted and their quality of life will suffer. By taking small steps and gradually adapting to new products, people can ease into the new way of doing things without sacrificing too much or entirely overhauling their routines.
Lack of trust
It’s not uncommon for people to distrust new products, especially if they’re unfamiliar with the company behind them. After all, it’s easy to make false claims about a product’s efficacy.
That’s why it’s essential to be clear and upfront about a product’s background and results. Proper communication, testing, and documentation can help build trust and overcome initial skepticism.
Now you know what factors can slow the product adoption process, but how do you evaluate your results to ensure you’re on the right track? Start tracking product adoption metrics.
Ten most important product adoption metrics
Here are some metrics you can track to understand your product adoption better.
Adoption Rate – measures how many people use a product or a specific feature.
Conversion Rate – shows how many users perform a key action, i.e., sign up for your product. You can track conversion rates alongside daily active users to evaluate the effectiveness of your business strategy and marketing efforts.
Time to Value – shows how long it takes people to adopt your product.
Net Promoter Score (NPS) – shows how many existing customers would recommend your product.
Usage Frequency – shows how often people use your product or a new feature.
Activation Rate – measures how many of your consumers successfully activate, i.e., become long-term customers.
Customer Lifetime Value – shows how much you can earn from an average customer over time.
Churn Rate – shows the percentage of customers who leave your product. It helps you track your most valuable customer segments.
Time Spent with Product – shows how much time people spend using your products.
Retention Rate – lets you see how many customers stayed with your brand over time.
So now that you know what critical issues you might face and what metrics to track, let’s discuss how an optimized product adoption process should work.
The product adoption process might differ depending on the industry. Here are the most common steps that drive product adoption.
Credibility
During the first stage, potential customers learn of your product. You need to understand their needs and look for reasons that could persuade them to become regular users.
Brand recognition and credibility are essential at this point, as users will more likely try a product created by a company they already know and trust. The uniqueness and novelty of your product are also crucial.
2. Interest
When people are interested in your product, they will research to learn more about it. The more detailed and precise your product information is, the better. By providing accurate information, you can help people understand your product better and make a more informed decision about whether or not it fits their needs.
3. Evaluation
When customers consider whether or not to purchase your product, they evaluate it based on their specific needs. They will also compare your product to the competition.
At this point, providing a high-quality product at a reasonable price is essential. You also need to be aware of your product’s strengths and weaknesses, capitalize on customers’ positive feedback and persuade even more people to choose your product over others.
4. Trial
This step is crucial for software. The trial phase starts when potential customers want to test your solution and see whether it’s a good option for their needs. Free trials are a great way to show the features of your product.
Features aren’t everything, however. It’s also essential to provide an excellent user experience to motivate customers to sign up for paid plans.
5. Activation
Once a user knows your product and sees how it can benefit them, the next step is to activate it. It is usually done by signing up on the website or subscribing. Once customers complete this critical action, they are considered active users.
6. Adoption
Adoption is the final stage of introducing a new product or service when active users become regular users. It occurs when customers who have tried your product become convinced of its value and see it as a worthwhile investment.
For businesses, this is the ultimate goal. Getting customers to adopt your product or service is the key to long-term success.
Tracking customer experience is essential in each step of the process. Without the proper tools and metrics, you’ll be left in the dark, making wrong decisions that can ultimately lead to the failure of your product.
To boost your product adoption, you should utilize user behavior tools that provide valuable insights into website or web app issues hindering your product growth. Let’s discuss these tools in more detail.
What are user behavior tools?
User behavior tools help you understand how users engage with your product, let you monitor customer behavior, and enable you to improve product performance.
How user behavior tools help you improve product adoption
Designing products for your target audience becomes easier when you can identify user behavior patterns.
By monitoring usage data, you can clearly see which features are most popular and which issues you need to address with each new product iteration. This way, you can ensure that your products consistently meet your customers’ needs.
We designed FullSession, our UX analytics tool, with these goals in mind. Let’s make an overview of all features you can use to understand your users better and provide them with products aligned with their requirements.
With FullSession, you can conduct a customer experience analysis without affecting your website or web app performance, understand where to improve, and boost your product adoption.
Let’s discuss each of FullSession key features in more detail.
Session recordings help you track website visitors’ actions
FullSession session recording and replay tools show how users navigate and interact with your website in real time. You can spot negative experiences affecting your product adoption rate.
Session replays help you spot significant issues during user sessions
Aside from real-time monitoring, you can also look back and watch session replays. It’s an excellent way to notice worrying trends or problems that bother more than one user.
You can skip periods of inactivity, fast forward, rewind, and pause the recordings. You can spend as much time on the analysis as you want.
The session recording and replay provide the following data:
Visited pages/URLs
Visit source
The country and IP address of the users
Session list
The session event data
Screen resolutions
Average time on page
Total time spent on pages
Interactive heatmaps let you uncover UX and UI challenges
Website heatmap tools help you track user engagement with your website or web app. You can identify what page elements need a redesign, how to reposition critical sections of a page, or where you need to improve the content. FullSession offers three types of heat maps.
Click maps
Click map is the first interactive heatmap that lets you see where people click on a page. Click tracking helps you understand which page elements or areas interest users the most.
Movement maps
A mouse movement heat map is essential for tracking customer journeys on the website. You can identify what people avoid, where they encounter broken links that stop them from navigating your site, evaluate their ability to find what they need, and if they reach pages intended for conversion.
Scroll maps
Scroll maps let you see how far users scroll down the page. This feature is essential to evaluate where to position crucial page elements such as CTAs, banners, links, or important messages.
Customer feedback forms let you track customer satisfaction levels
With FullSession, you can design customer feedback forms and align them with your branding. You can choose devices to collect the feedback, set up your questions, and decide if you want to receive answers via email. You don’t have to invest in NPS software.
Customer feedback forms provide additional context for session recordings, as users can comment on issues they experience. You can watch what happened during a session replay. Users can also rate specific features and elements of your solution.
Customer feedback reports help you learn what to improve
With customer feedback reports, you can track customer feedback trends and monitor if their sentiment improves. Our dashboard provides access to all of your website feedback forms and their various details:
Name of the form
Creation date
Author’s identity
Activity status
The number of responses
There’s also an Actions tab in the Feedback section of our Dashboard. You can see it on the rightmost side. It contains links to individual responses. You can click for more details:
Form’s ID
Date
URL
User sentiment (rating)
User comments
The browser used by the person
Advanced filtering options let you find issues faster
Our filtering options help you find whatever data you need with ease. You can identify specific events during sessions and focus on information that matters. Using the Notes feature, you can also share your findings with other team members.
Advanced analytics provides a wealth of user data
Finally, FullSession also has a metrics dashboard that gives access to details about your website and users. Here are some of the metrics you can analyze:
Average page load speed
% of sessions on mobile devices
Median scroll depth
Console errors
The number of dead clicks and error clicks
Trashed cursor
As you can see, with proper tools and advanced analytics, FullSession helps you build a seamless digital customer experience that will speed up your product adoption. Start your 14-day free trial to eliminate the guesswork and boost customer satisfaction.
If you’re interested in how FullSession compares to other user behavior tools, you will find the following section particularly useful.
Eight examples of user behavior tools
While developing FullSession, we researched other popular tools on the market.
Below you can find our articles on alternatives, competitors, and comparisons that will give you enough information to decide which product analytics tool gives you the most in-depth product metrics to boost your product adoption.
We covered FullSession in each to help you see how our web analytics platform compares to other solutions.
What to do next to boost your product adoption
Product adoption is essential for any business that wants to succeed. By understanding how customers think about your product, you can create a solution that meets their needs and expectations.
Additionally, making your product easy to use will help encourage customers to adopt it. Ultimately, by launching your product and helping it reach customers, you can ensure it is successful.
You can take advantage of user behavior analytics and user experience analysis to improve this process by gaining insights into how customers interact with your product and seeing what actions lead to higher levels of adoption.
A platform like FullSession lets you observe how people use your website via session recordings and replays. You can also use interactive heatmaps to gain additional insights about the user journey and get feedback directly from users via customer feedback forms. FullSession also makes data easy to find thanks to powerful segmentation and filtering features.
Here are answers to some common product adoption questions.
What is product adoption in SaaS?
Product adoption is the process by which a new product or service – such as SaaS – is adopted by its target user. The key to successful product adoption is making the technology easy to understand and use by the target users while providing high value for an affordable price.
How do you measure product adoption?
You can use various tools to monitor product adoption metrics. For example, you can look at signups, monthly active users (MAU), website traffic, and more.
How do you promote product adoption?
There is no one-size-fits-all strategy for promoting product adoption. It depends on the types of challenges your product faces. Some companies focus on educating users about the benefits of their solutions, while others concentrate on incentivizing users to use their products by offering rewards, discounts, and similar.
How can you improve adoption in customer success?
Customer success teams can significantly improve adoption rates by providing thorough and complete training, working closely with IT teams, and providing ongoing support and guidance. By focusing on these three areas, customer success managers can increase the likelihood that their customers will become successful adopters of their products and services.
Keeping customers happy and engaged is essential to the success of any business. However, keeping them as loyal customers requires much effort.
For this reason, companies must conduct a customer churn analysis and keep a finger on their churn rate – a statistic that shows the percentage of customers who stopped making purchases from a company.
It’s a crucial indicator of how well your business is performing. It gives you a clue on what’s not working with your customer retention strategy and can indicate other business model issues.
To conduct customer churn analysis, you need specialized tools that help you collect user behavior data. FullSession, our UX analytics tool, gives you access to session recordings and replays, website heatmap tools, and website feedback forms to help you understand where your customers experience issues while using your product and how these issues reflect on your churn rate.
In this article, we will discuss customer churn analysis, share its benefits and warning signs, explain how to conduct your analysis, and discuss how FullSession helps you in the process.
Let’s start by defining the customer churn analysis.
What is customer churn?
Customer churn, also known as customer attrition, is the term used to describe a customer’s decision to leave your business. Churn occurs when customers stop using your product or service – for example, they stop paying subscriptions or using your service altogether.
Many factors can cause customer churn – changes in customer needs, business environment changes, lack of value, product features, poor customer service, and more.
Let’s explain how customer churn affects your business.
Customer churn is one of the most immediate ways to measure the health of a company.
The loss of any customer represents a loss of revenue and opportunity and can be challenging to manage. Additionally, acquiring a new customer is usually more expensive than retaining one you currently have.
When a customer leaves, it can disrupt the flow of orders and sales, resulting in lost profits and damaged brand integrity. At the same time, there are costs associated with managing churn: account managers must spend time on follow-up calls, process refunds or cancellations, or take other measures to minimize attrition.
To understand what your churn rate means for the company, you must thoroughly analyze all the essential data.
What is customer churn analysis?
You can use customer churn analysis to evaluate user behavior and determine patterns to predict future churn.
The goal is to identify any possible causes for an increase in the customer churn rate and then take appropriate measures to prevent it.
It is important to remember that the analysis will never be 100% accurate. Still, it provides a good baseline for determining your business performance when predicting and preventing churn.
There are many benefits to conducting customer churn analysis. Here are some of them:
Measuring company performance against key business objectives – churn analysis provides data that lets you see how your company is doing.
Identifying areas for improvement – you can see what doesn’t work to implement necessary changes.
Improving customer retention rate – analyzing churn helps you understand what you need to do to improve your customer retention rate.
Identifying problems in the funnel – you can also find and remove problems with your sales funnel.
Reduce costs associated with attrition – analyzing churn lets you understand what causes customer attrition and reduce its costs.
What patterns should you pay attention to during the customer churn analysis? Let’s discuss this.
Four warning signs in customer churn analysis
When analyzing customer churn, it is essential to look for changes in customer behavior that suggest problems. These include the following:
Customers are complaining more frequently
Customers are canceling their service more often
The number of customers using the service is decreasing
The number of new customers signing up for the service is decreasing
By analyzing data carefully, you can identify which customers are most likely to leave your business and figure out how to keep them coming back.
Customer churn vs customer retention: How they relate
Churn and retention are often mistaken because they deal with the same situation: people leaving your business. However, churn differs from retention because it measures the percentage of customers who have abandoned your service within a specific period.
Retention, however, measures how many existing customers renew their subscriptions over time. So, these metrics are two sides of the same coin. They’re closely tied. You need to understand what drives your retention to optimize your churn and vice versa.
Two types of customer churn
There are two main types of customer churn: voluntary and involuntary.
Voluntary customer churn refers to customers who decide to leave on their terms. Involuntary customer churn occurs when customers have to cancel their subscriptions due to a non-payment issue or other reasons, such as an expired credit card.
Given the importance of keeping customers happy, it’s essential to understand what causes them to leave. Understanding which customer churn you’re dealing with can help you prioritize your efforts and improve your overall retention rates.
What stats show us about customer churn
Here’s what statistics tell us about customer churn, its analysis, optimization, and importance for healthy business operations:
Customer churn costs companies in the USA around $136 billion a year. (CallMiner)
Managing customer expectations and solving customer issues during first-time interactions can reduce churn by 67%. (Kolsky)
69% of respondents are more likely to shop more frequently at retailers with consistent customer service. (Forrester)
For 32% of people, just one bad experience is enough to turn away from a brand, despite previously exemplary customer service. (PWC)
92% of SaaS companies that grew less than 20% per year fail. Churn reduction and customer retention optimization strategies are crucial. (McKinsey)
Since you now understand the importance of customer churn, let’s discuss the optimal process to conduct your analysis.
You must take several steps to conduct a successful customer churn analysis and get the best quality data. Let’s discuss each step in more detail.
Step 1: Define what constitutes churn
The first step is to define what constitutes churn in your particular scenario. Is it just customers who cancel their subscriptions because of their decision, or do you want to measure and analyze involuntary churn too?
What about users who pause their accounts for financial reasons? Answering these questions will give you a clear picture of your current situation.
Step 2: Determine a timeframe for your churn calculation
You also need to specify what timeframe you want to evaluate for your churn calculation. As we’ve mentioned, 5% annual churn is very different from 5% monthly churn.
Step 3: Collect the data you need to perform the analysis
Now, it’s time to collect the data you’ll need for your analysis. You should be able to get the basic numbers from your day-to-day operations and financial reports depending on the timeframe.
Don’t stop there. Invest in a tool that lets you track different engagement metrics and provides behavioral analytics, such as our FullSession. Schedule a demo to evaluate all features.
Step 4: Calculate customer churn rate
The next logical step is calculating your churn rate. The basic formula looks like this:
Lost Customers ÷ Total Customers at the Start of the Period) x 100.
Calculate your rate as a percentage and compare it against the industry average.
Step 5: Calculate the financial impact of churn
The exact financial impact of customer churn will depend on your particular business situation and other metrics and key performance indicators, such as customer lifetime value.
Consider the lost subscriptions, what you paid to keep the client, and the money you will pay for acquiring a new user to recuperate the losses.
If you want to look at the broader perspective, you can calculate your revenue churn for the period you’re analyzing. To do that, start with the following:
Determine your recurring revenue at the beginning of a month, quarter or year.
Subtract the revenue you had at the end of the period from the revenue you had at the beginning of the same period.
Subtract revenue that comes from new customers and bonus revenue that doesn’t come from standard operations. You only want to look at revenue lost due to churn.
Divide the result by the total revenue you had at the beginning of the period.
Calculate the percentage value.
For example, if you lost $50,000, and your total revenue at the beginning of the period was $500,000, you have a 10% revenue churn. Negative revenue churn means you gained, not lost, revenue.
By tracking churn rates over time, you can identify areas you need to improve to keep your customers happy and reduce churn rates in the long term.
Step 6: Identify the reasons customers are churning
Now, it’s time to analyze the data and the reasons behind customers churning. It’ll help you identify at-risk customers, and a behavior analysis tool such as FullSession can be beneficial here to give you all the necessary details about customer dissatisfaction.
Step 7: Summarize your findings and takeaways
When you have all the data you need and understand what’s going on with your customer base, summarize your findings, draw conclusions and create an action plan for solving all product issues.
Step 8: Create a plan to retain existing customers
The last step is to formulate a plan to help minimize your customer churn, so your company can stop losing users and revenue. It will ensure your business grows over time.
Since we explained the crucial steps in conducting a customer churn analysis, let’s briefly discuss customer behavior tracking and its importance in the analysis.
Why is customer behavior essential for customer churn analysis?
Understanding customer behavior helps you identify early warning signs that a customer may be at risk of churning.
For example, if a customer starts reducing their use of a product or service or begins engaging in less positive behaviors (e.g., complaining more frequently), this may indicate they are not as satisfied as they once were and are at risk of leaving.
Many factors can influence customer behavior, so tracking as much data as possible is essential. This data can come from surveys, customer feedback, heat maps, session recordings, and more.
By understanding what factors are causing customers to leave, you can take steps to address these issues and keep customers loyal.
To conduct such an analysis, you need to start using an advanced user behavior tool like FullSession. Let’s discuss what FullSession can do for your business.
It’s available as a SaaS and doesn’t affect your website performance while collecting product metrics for analysis. It gives you access to many useful features.
All data is easy to find thanks to advanced filtering and segmentation features.
Understand the reasons why users abandon your site
FullSession provides product analytics and helps you understand what motivates users to look for a different solution and leave your brand. You can watch session recordings and track issues that push your users to leave your website, web app, or landing page.
There is no need to watch the entire session replay. You can skip periods of inactivity, fast-forward and rewind session recordings to save time.
Identify usability issues and troubleshoot technical issues
With FullSession, you identify various usability issues which stop people from performing desired actions on your website and evaluate the following data:
Total time spent on pages
Average time on page
Segment health
Error clicks
Dead clicks
Rage clicks
Trashed cursor
Page load time
Exit page
Device and browser breakdown
Screen resolution breakdown
Segment health
Identify user experience issues and frustration points
FullSession interactive heatmaps provide user behavior data in a graphic form. They are easy to understand and analyze. We provide you with three types of heat maps: click maps, movement maps, and scroll maps.
The first two heatmaps – click maps and movement maps – help identify user experience issues and track what makes customers churn. You can see what users tend to click on the page and which areas of the page they avoid or have problems with.
Clicks map example
Mouse movement heat map example
FullSession gives you access to information that lets you assess how attractive your website is to potential customers. You can view the following:
Number of users who visited the page
The average time on page
The average load time on page
User engagement on different devices
The number of total clicks
The number of total views
Improve your page layout and design
Scroll maps let you see how far users scroll down the page. It helps you avoid making the pages too long and place essential content elements like high-priority information, buttons, and CTAs in perfect spots to increase conversions.
Scroll map example
Optimize user journey
Heat maps and session recordings help you identify potential issues down the road. If you notice many people going toward a particular area of the page but then stopping before they complete their journey, that might indicate something needs to be fixed or clarified on the page because it hinders your conversion rate.
Identify low-performing content and track customer engagement
With FullSession, you can identify low-performing content driving low engagement and negative user experience. You can also track whether people stay on your site and look at what topics they search for to create more content that resonates with your customers.
Understand customer needs and expectations
Understanding the needs of your users is crucial for optimizing the user experience and reducing the churn rate. FullSession is very useful because it relies on data from real users instead of hired testers. Every piece of data you collect comes from your actual users, so you can evaluate their authentic experience with your website.
Gather customer feedback
FullSession helps you get feedback directly from your users. You can customize each form and select the pages and devices to display the widget. Your customers can leave their feedback using emojis and answer your predefined questions.
To track each feedback, you can navigate to the Feedback section of the FullSession dashboard and see details such as:
The user ID
URL
User sentiment
User comment
Browser
Date of creation
Feedback details
You will get the response, user, and session details for each feedback. What’s best, each feedback is connected to a session recording, so you can watch the replay and evaluate what happened to understand the user’s comment.
Improve your customer support
Statistics show that customer support is one of the most critical factors behind customer churn. With FullSession, you can provide data-driven customer support that offers personalized, tailored guidance and improves the overall user experience of each customer.
Keep users’ private information secure
FullSession doesn’t track or record users’ private details, such as typed passwords, credit card information, or other sensitive data. Our platform shows only the reconstructions of events during a session. You also can’t use FullSession for behavioral advertising purposes.
It means you can collect data essential for your business while caring for the privacy and security of your customers.
Visualize data in a way that is easy to understand
FullSession makes data more accessible with visual reporting. It communicates complex concepts clearly and efficiently to help you track changes over time. By looking at data visually, you can make better decisions based on what you see instead of just relying on percentages or numbers alone.
Identify trends and patterns in customer behavior
Trends and patterns help you identify what customers are doing on your website. If they’re using your site more often, you know they like it. If they’re visiting but not buying, you know you need to make your site more appealing.
By looking at trends, you can learn how often customers visit your site or what kind of content attracts them most. By looking at patterns, you can see how visitors engage with different parts of your site, such as product pages or checkout processes. These insights can help you create a strategy for improving customer engagement and retention.
As you can see, FullSession provides you with a wealth of data to learn more about your customers and their needs and presents this data in easy-to-digest reports.
It provides all the crucial user behavior tools you need to boost your customer churn analysis and make informed decisions about your strategy for reducing the churn rate.
How to start with customer churn analysis
Customer churn is a significant business issue that can seriously impact your company. It can lead to a loss of revenue and profits and reduced brand loyalty.
To solve this problem, you have to take a proactive approach. You need up-to-date, in-depth data, regular customer churn analysis, and a proper tool to collect all information on user behavior.
We are sure that FullSession is your best option to analyze churn effectively. It gives you access to session recordings and replays, along with three distinct types of interactive heatmaps. These are essential if you want to identify problems with user experience or usability and boost user engagement.
You can also use customer feedback forms to get additional feedback from your users. Our platform visualizes the data in a clear, graphic way and makes it easy to search through and organize, thanks to advanced segmentation and filtering options.
Here are answers to some of the most popular questions about customer churn.
Why is customer churn analysis important?
Customer churn is a significant issue for any business. A high churn rate can lead to lost revenue, lower customer satisfaction, and increased costs. Furthermore, it can indicate poor customer service or a poorly designed product.
What does 5% churn mean?
It depends on what period you are looking at. An annual churn rate of 5-7% is considered good – it’s what most businesses strive to achieve. However, a monthly churn rate of 5% is terrible news, and you need to act quickly to stop losing your customers.
What is a good churn rate for consumer?
Churn doesn’t affect customers directly, but companies with a low churn rate tend to have a better quality of services and customer support.
User adoption in enterprise software can be challenging to track and measure, especially for SaaS products. It is critical for your success, so what can you do to gather all relevant information about your product performance?
You can employ user behavior tools to assess the current situation and improve your products or services to increase user adoption.
A behavior analytics platform helps you understand why users adopt your solution and how they interact with it by tracking their actions individually.
These tools make it easier for you to discover problem areas that need fixing, monitor which features users tend to ignore or identify usage patterns that could lead to future issues. They also provide valuable insights into what existing users prefer and what they find frustrating.
UX researchers, designers, marketers, customer success teams, and product teams use it to track the customer journey and increase user adoption. Create an account, start your 14-day free trial, or schedule a demo to see how FullSession works.
In this article, we will explain what makes user adoption important for your company, how to create a user adoption strategy, what metrics to track, and how to use FullSession to drive user adoption.
User adoption is the process by which users come to understand and use a new piece of technology within a given time frame. This process typically begins with awareness of the technology, followed by interest, evaluation, trial, and adoption.
Effective user adoption can be critical to the success of a new product or service, so businesses often invest significant resources in user adoption strategies.
Why does user adoption matter?
If no one uses the application, your company can’t generate revenue.
Additionally, low user adoption rates can indicate the overall health of your product – if users are not adopting your application, it may be due to poor design, lack of features, or other issues you need to address.
With a user adoption strategy, you can define the target audience for your product, understand their needs, and then build a solution that meets their preferences.
The user adoption process can take several forms, depending on the specifics of your situation.
For example, it could involve creating a detailed plan for onboarding new users and planning specific actions you need to take to achieve your product goals.
On the other hand, it could simply be about identifying the areas where you need to improve the overall user experience.
No matter how you approach this process, remember that it must always be part of a more considerable effort to improve user adoption rates overall.
Five key elements of successful user adoption strategies
There are several vital elements of a successful user adoption strategy:
Unquestionable commitment – demonstrates to users that your team is fully invested in the product and confident in its ability to meet their needs. This type of commitment instills trust in users and encourages them to give the product or service a try.
Understanding community – you need to have the community on your side, or at least key opinion leaders such as influencers, popular Internauts, and similar. Talk to people, learn about their needs, and gather feedback through specialized tools. Everything that lets you understand your users better will increase the adoption rate.
Good communication – establish communication channels, define where and who you talk to and why, and create a consistent image and communication strategy for your brand.
Proper guidance – without appropriate guidance, users may not be able to understand how to use the product or service, which can lead to frustration and even abandonment. Provide tutorials and training to overcome this challenge.
Ongoing support – helps you address any issues that users may have to help them feel confident using the product or service. Ongoing support can help build trust between the user and the company, which is essential for long-term success.
As you can see, user adoption strategies need to be detailed and intentional to be effective.
There are several benefits of formulating a strategy and improving user adoption. Here are the most important ones.
Happier users
Improved engagement
Better product feedback
Reduced support costs
More viral growth
Improved customer retention
Increased customer satisfaction
Improved product development
Improved customer service
Increased sales
Increased market share
Enhanced brand reputation
Improved competitive advantage
Businesses with many users are likely to be more open and welcoming to new ideas and perspectives since they recognize users are essential to their success. It can create a more innovative and creative environment within the company, leading to even more success in the future.
Ten essential metrics to track and improve user adoption
You need accurate data to understand your product’s position on the market. Here are some metrics you can follow to improve where necessary and increase the user adoption rate.
Net Promoter Score (NPS) – a metric that shows how many of your customers are willing to recommend your product to their friends.
Product/Feature Adoption Rate – a statistic that shows how many people decide to use a given feature or product. Tracking this data is very important after product launches and substantial updates.
Active Users – you can track this data daily, weekly, or monthly. It shows how many existing customers use your service in a given period.
Usage Frequency – a very helpful statistic that tells how often people use your solution. Low rates suggest you must find ways to encourage existing customers to log in more often.
Customer Lifetime Value – CLV is a metric that lets you see how much your business can earn from an average customer over time. You can track this in various ways. The more straightforward approach is to look at revenue and profits only, but you can also do more advanced calculations that account for operational expenses.
Customer Acquisition Cost – your company’s average cost to get a new customer.
Time Spent with Product – this metric allows you to see how much time customers spend with your product or service.
Retention Rate – shows how many people decided to stay with your product after some time has passed.
Time to First Key Action – a metric that measures how long it takes customers to perform the first key action when using your application.
Percentage of Users Who Performed Key Action – a percentage value that shows how many of your users decided to perform a key action.
You can’t track all this data manually. You need proper data collection and analysis software to make the right business decisions. For optimal results, start with user behavior tools. Let’s explain these tools in detail.
What are user behavior tools?
User behavior tools help organizations build better products by providing insights into customer behavior and experience.
They allow you to track and understand how users interact with your website or app. They can provide insights into what users are doing on your site, how they find it, what they are interested in, and what repels them.
Customer experience analysis helps you increase user adoption rates, improve retention, and decrease churn rates.
How do user behavior tools work?
User behavior tools gather data in various ways. Some may use web logs or analytics to track user behavior on a website or application, while others may use surveys or interviews to get customer feedback directly.
Still, most advanced user behavior tools may combine these methods or provide unique features to collect the necessary data.
One such tool is our FullSession which you can use to improve the customer experience, design better products, and make more informed business decisions. Let’s explain how it works.
You can start a 14-day free trial to evaluate all features while reading the following sections.
How to drive user adoption with FullSession
FullSession is a cloud-based SaaS platform you can use to analyze websites, web apps, or landing pages via website visitor tracking. It allows you to watch session recordings and replays and gives access to interactive heatmaps you can use to track the customer journey.
Our solution also provides customer feedback tools to collect feedback directly from your users. FullSession offers advanced filtering and segmentation features to help you find necessary data faster.
It’s important to note our platform doesn’t affect your website performance during data collection and analysis.
Find the best onboarding flow
You can watch session recordings to see what hinders your users and define the best customer onboarding flow to provide them with the information and guidance they need to get the most out of your product or service.
You can monitor user activity during different periods. Also, you don’t need to watch the entire sessions – you can rewind, fast-forward and skip periods of inactivity.
Make it easy for users to find what they’re looking for
Session recordings are also helpful when you want to analyze the architecture of your website. You can see how people who visit your website navigate the pages, how long they stay on the site, what they click, what they avoid, and if they can find the information they need.
You can also access various data connected to session recordings, which allows you to learn more about your users and their behavior. For example
How they came to your website
Where they live and what’s their IP address
What pages they visit
Total time spent on pages
Average time on page
Session list
Session events
Identify emerging usage patterns
FullSession provides advanced analytics to help you identify the usage patterns of your customers. Our main analytics dashboard shows data in the following segments
Session Playlist
Top users
Segment health
Key pages
User trends
Feedback trends and overall feedback
Device breakdown
Browser breakdown
Top referrers
Screen resolution breakdown
You can also apply our advanced filters to spot faster the issues that decrease the adoption of your product.
Improve your customer support efforts and troubleshoot technical issues
You can also use session recordings and replays to identify problems your customers face and provide top-quality support to improve product adoption. For example, you can monitor
Error clicks
Rage clicks
Dead clicks
Trashed cursor
Page load time
The overall customer sentiment
Implement quality UX design
The data collected by FullSession comes from real users, not hired testers. Our UX analytics tool is an excellent source of information when you want to evaluate your user experience and implement changes to improve your UX design. You can be 100% sure you have accurate, actionable data, not information generated artificially.
Track user behavior and activity
Our interactive heatmaps allow you to analyze graphic reports that visually present user behavior. FullSession gives access to three types of heatmaps: click maps, mouse movement maps, and scroll maps. We have a helpful guide on our website if you’re unsure how to read a heatmap.
Identify user needs and requirements
The first type of heatmaps allows click tracking. They let you see what draws your users’ attention and what they click on the visited pages.
Clicks maps
FullSession provides you with a wealth of data regarding user engagement. Heatmaps allow you to understand better what users want and need and how to make your products better.
You can get the following information:
User engagement on different devices
Number of users who visited the page
The number of total views
The number of total clicks
Top clicks on the page
The average time on the page
Identify areas where users are struggling
The mouse movement heatmaps are helpful when you want to see how users navigate the website and which areas cause issues.
Movement heatmap example
You can see what paused them when they stopped exploring.
This feature compliments session recordings very nicely. For example, if you take a minute to analyze the recording of that specific user’s session, you should be able to understand what caused the problem you noticed on the heatmap.
Scroll map example
Scroll maps can also be helpful. They focus on scroll depth and show you the point at which users start losing interest in your website. With this issue in mind, you can optimize your pages accordingly.
Reduce frustration and increase satisfaction
You can use the data from heatmaps and the analytics dashboard to identify and remove pain points and improve the entire user experience.
Some valuable statistics include the following
The average load time on the page
Data regarding console errors
Total counts of rage clicks and dead clicks
Gather user feedback during the adoption process
Customer feedback forms help you get information directly from your users. You can specify each form’s name and description and customize the form in various ways. You can also select which pages you want to display it on. Users can evaluate elements of your website using a simple scoring scale.
You can access any form by clicking the Feedback tab on the FullSession dashboard. You can see several details there:
Name of the form
Date of creation
Author
Status of activity
The number of responses
On the rightmost side, there’s an Actions tab with links you can click to view the responses. If you follow the link, a screen with the following data will open
Form’s ID
Date
User comments
User sentiment
Location
The URL of the evaluated page
User’s browser
Each customer feedback is connected to a single session recording you can watch to understand what happened if the user left a negative comment. You can evaluate our customer feedback report to assess your customer feedback score.
Don’t forget the basics: security and privacy
In pursuit of the best possible user adoption rates, it can sometimes be easy to forget the basics – the security and privacy of your customers.
If you use FullSession, you don’t have to worry about that. Our platform doesn’t give anyone access to actual recordings of users’ screens and audio. You can watch reconstructions of events that don’t contain private data, like typed passwords, credit card details, etc. You’ll receive every detail critical for your business – nothing less.
You also can’t use FullSession for behavioral advertising. We don’t spy on users. We don’t track their activity on the Internet.
Track and measure what actually influences user adoption
FullSession provides a data-rich dashboard you can use to access any essential piece of information quickly. Thanks to our advanced segmentation and filtering systems, you can organize this data however you like. You can also mark significant events during sessions, which is helpful for comparisons and analysis.
Our dashboard will be convenient if you want to check what impacts your user adoption the most. You can also use the data to track and improve conversion rates, reduce funnel dropouts, and evaluate the effectiveness of your ad or marketing campaigns, among other things.
Collaborate with your team efficiently
Collaboration is critical for most businesses – we know that very well. FullSession allows leaving notes during session replays to make cooperation with other team members easier. You can write whatever you like, share important observations, leave remarks, add tasks, and more.
The final words about user adoption
Customer adoption is a complicated process, essential for any company that wants to remain relevant in the digital era.
It’s critical to understand the needs and preferences of your users if you want to increase the user adoption rate. You must establish strategies for getting your audience on board. It involves a multi-layered approach incorporating internal, cross-functional, and external communication to achieve a beneficial outcome.
Of course, you need to track various metrics to get a hold of user adoption. To do that effectively, you have to invest in the right tools. A platform like our FullSession will provide you with all the necessary features.
You can watch session recordings to see how people use your website and check out interactive heatmaps to get more information regarding their engagement and user experience. If that’s not enough, you can get feedback directly from your users through customer feedback forms.
FullSession offers great-quality data and gives you plenty of options to visualize, analyze and organize all important metrics. Our powerful segmentation and filtering options will help you find whatever you need in seconds.
Here are answers to some of the most popular user adoption queries on the Internet.
What does adoption mean in software?
Adoption is a process by which a product or service becomes used in an organization or environment. You can apply the term to software and products such as building materials and supplies, computer hardware, and services from outside organizations.
You can measure adoption in various ways, including the number of users, the percentage of users that use the product regularly, and the number of organizations using the product.
What is end-user adoption?
End-user adoption is the act of a consumer or customer using a product or service introduced by the company. An end user is someone who uses a product and has an impact on the company’s revenue.
The number one goal of any startup business is to increase its end-user adoption, which leads to increased sales and profitability.
How can end-user adoption be improved?
There are several ways to improve end-user adoption:
You can educate end-users about the benefits of the solution. They should know how the solution solves their problem, what success looks like, how the solution works, and how it fits into their overall business strategy.
End-users can be motivated to adopt the solution. They need to feel that the benefits outweigh the costs.
You can coach end-users on how to use the solution successfully. They need to understand what they need to do and when they need to do it. They also need to know what results they should expect from using the solution.
Let’s say you created an excellent product with a user-friendly interface. You’ve tested it with your regular users and got great feedback.
The app is fantastic, and people love it! But what exactly are their habits? Where do they get stuck? What kind of content do they love the most? How can you optimize your app to give users an even better experience? How can you create a more engaging UI to boost conversion rates?
These are just some questions that might pop up when you start optimizing your product. You should use software that gives you insights into user behavior to learn what works or doesn’t.
A web analytics platform like our FullSession helps you optimize your website to increase conversion rates and improve the user experience. It provides session recordings and replays, interactive heatmaps, customer feedback forms, advanced data segmentation, and analytics.
If you want to check alternatives, you’ll likely start with two popular solutions: Google Analytics and Mixpanel. What do they have in common? How do they differ?
Our Mixpanel vs Google Analytics comparison will take you through every important detail and explain why FullSession should be your first choice.
Mixpanel is a behavioral analytics platform and one of the better-known Google Analytics alternatives. It allows you to gather real-time data regarding user actions on the website.
You can use this information to improve customer engagement and general user experience. You can mostly do this by analyzing data, identifying potential problems, and evaluating which parts of your product work and which don’t.
Mixpanel employs an event-centric approach. You define users’ actions on your platform. It then allows you to check whether users perform these actions and how they accomplish them.
You can get statistical data regarding user behavior, which you can filter and segment in various ways – considering demographics, location, and more.
Additionally, the platform goes beyond behavior analytics and offers some additional features. You can send in-app messages, SMS, notifications, or e-mails to your users.
Google Analytics is one of the best-known web analytics platforms in the world. Various companies and organizations all around the globe use it to track website performance.
Google Analytics data shows page-level information. For example, you can track the number of visitors or page views, the location of users, bounce rates, and more.
It’s a helpful tool to verify whether your marketing efforts work as intended or whether your website shows increased interest in your brand.
One of Google Analytics’ advantages is that the company behind it made a well-known and widely used search engine. It means the data collected via GA is very relevant and helpful.
What is GA4?
Google announced that the Universal Analytics service, which currently finds use in many businesses, will be deprecated on October 1, 2023.
The new GA version – Google Analytics 4 – will be its replacement and is already available. It’s a similar service, but there are some significant changes – for example, GA4 measures slightly different metrics, like active users instead of total users, and more.
What is FullSession?
Our FullSession is a powerful web analytics platform you can use to learn more about user interactions to optimize your website according to their needs.
It helps remove obstacles and problems your customers face to boost conversion rates. We offer the tool in the SaaS model. It works in the cloud.
Our service allows you to watch session recordings and replays. It’s a great way to learn how users behave on the website because it relies on real experiences – you don’t have to hire testers and base your decisions on artificially generated data.
The platform also offers three types of interactive heatmaps, which will help you understand how people interact with your website pages, how they navigate the site, where they click, and how far they scroll.
That’s not all. FullSession has a well-designed dashboard and great segmentation and filtering features. Accessing the data you need in a given moment and making connections between important details is very easy.
FullSession won’t affect your website’s performance and respects your users’ privacy. Deployment is also effortless and doesn’t require technical know-how.
Mixpanel vs Google Analytics: How they compare and contrast
You should now have a basic knowledge of all the platforms we discuss in this article. Let’s get into more detail and compare them to each other. We’ll look at features, deployment, integrations, and use cases. We’ll also consider language, customer support, reviews, and pricing options.
Mixpanel vs Google Analytics: Basic differences
Google Analytics and Mixpanel might seem similar, but they’re substantially different software. The main difference between them is that they focus on different data types. Google Analytics helps you collect page-level information, whereas Mixpanel allows you to learn more about your user behavior.
FullSession similarities with Mixpanel and Google Analytics
FullSession is similar to Mixpanel, focusing on user behavior instead of broader, page-level data reporting. It still tracks many statistics regarding your website, such as visit source, time on page, or the number of clicks. It makes our platform comparable to Google Analytics, though it isn’t its main strength.
How FullSession differs from Mixpanel and Google Analytics
FullSession doesn’t focus on raw statistical data. Instead, it provides session recordings and replays, and interactive heatmaps. It also allows you to get feedback directly from your users through customer feedback forms.
Mixpanel vs Google Analytics: User rating
Both Google Analytics and Mixpanel have a 4.5 rating on G2.
Mixpanel vs Google Analytics: Use cases
Google Analytics and Mixpanel have similar use cases. Various specialists – like marketers, product managers, UX designers, and product teams – can benefit from the data collected by these platforms. Both tools find use in many different industries, including retail, entertainment, and tech.
Nine ways you can use FullSession
You can use FullSession for
Product optimization
Gathering user interaction data
Gathering web analytics data
Customer journey tracking
Improving marketing and sales funnels
Improving customer experience
Reducing churn
Finding and removing bugs
Increasing retention rates
Increasing conversion rates
Mixpanel vs Google Analytics: Deployment
Mixpanel and Google Analytics are SaaS tools. You must create an account and configure your project to use them.
When you create your Google Analytics account, you should copy and paste the tracking code into your source code or install a plugin to achieve the same result.
In the case of Mixpanel, deployment is more complex, and you probably won’t be able to complete it without help from a tech expert such as a software developer.
How to deploy FullSession
Our FullSession is easy to install on your website.
The first step is creating an account. Click the Free Trial button on our main page. Enter your e-mail and set up a password.
Verify this information by clicking the Activate your account button in the activation e-mail we’ll send you.
You’ll need to fill in the required information and install a code snippet on the page you want to track. The process is relatively straightforward.
You’ll need to choose between the Recording code or the User ID code and copy and paste a script below theof the website. If you run into any problems, we offer several guides showing you what you need to do step-by-step.
It’s worth noting that you can install a tracking code from an NPM or use Google Tag Manager.
You can also send the code to other people, so inviting team members to your project and sharing your dashboard is pretty straightforward.
Mixpanel vs Google Analytics: Features
Google Analytics offers the ability to collect essential, page-level data. For example, general information about website traffic, user demographics, acquisition, etc.
It’s a great tool when you want to monitor a particular website metric to evaluate your business strategy or track the progress of your campaign. However, it’s not a product analysis tool. It won’t help you with event tracking or measuring engagement, and you can only set up limited funnels.
Mixpanel is very different in this regard, as user behavior is what it focuses on. It doesn’t allow you to watch session recordings or observe interactive heatmaps, so you don’t have access to accurate, in-depth tracking our FullSession provides.
Instead, it allows you to analyze event streams and user journeys. It’s a good tool when you want to learn more about the habits of people who use your product or service and identify problems they encounter.
Session recordings and replays to track user journeys
FullSession provides a session recording tool to watch user interactions with your product. You can monitor whatever period you want – days, weeks, months, and even years.
This feature is excellent for identifying users’ problems so you can improve the UX and UI of your product. You don’t have to watch entire recordings – FullSession lets you skip periods of inactivity, fast forward, rewind, and pause session replays to save time.
FullSession session recording feature provides the following data:
The country and IP address of the users
Visit source
Session list
The session event data
Visited pages/URLs
Average time on page
Total time spent on pages
Screen resolutions
FullSession website heatmap tools show how users interact with your website. You can track cursor movement, clicks, and scrolling behavior to improve the user experience on your site. Our reports are easy to understand, but if you need any help, check out our guide on how to read a heatmap to speed up your analysis.
FullSession gives you access to three types of interactive heatmaps: click maps, movement maps, and scroll maps. Let’s share some examples.
Clicks maps
Click tracking measures, records, and analyzes clicks on a particular web page or set of web pages. It helps you understand how users interact with the site and what content they are interested in.
Mouse movement heatmaps
With mouse movement heatmaps, you can track and analyze user behavior and understand how users interact with your website, what content elements they prefer, and where they may be experiencing difficulty. It is an excellent feature for customer journey tracking.
Scroll maps
Scroll maps allow you to see how far your visitors scroll down a page. It helps you comprehend what content is most popular and what content your users ignore. Scroll maps also help you identify page areas you need to improve to keep visitors engaged.
With FullSession interactive heatmaps, you can get the following data:
The visited URL
The number of visitors
Total views count
Data regarding errors
User engagement data
The total number of clicks
The number of rage clicks
The number of dead clicks
The average time spent on page
The average page load time
3. Advanced data analysis
Our advanced analytics is vital for website optimization because it provides critical information to help you resolve all issues regarding website layout, features, or content.
With FullSession, you get the following data in one centralized location:
Session playlist
Top users
Segment health
Key pages
User trends
Feedback trends
Overall feedback score
Error and rage clicks
Device breakdown
Browser breakdown
Top referrers
Screen resolution breakdown
All of these factors can contribute to making your website more successful. You can increase conversions, traffic and sales by using our advanced analytics to improve your website.
You can create a website feedback form easily thanks to our built-in form creator and align the design with your branding.
Each customer feedback is connected to a session recording, providing additional context to what you see on the screen when you watch session replays. It gives you a more in-depth picture of the user experience.
You can see detailed information regarding each feedback on our dashboard. You can check the author’s identity, the visited page, overall sentiment, comment, browser, date and time, and user action.
We also provide you with an in-depth customer feedback report, so you can assess the overall sentiment of your website visitors and adjust your site to improve their satisfaction.
5. Advanced segmentation and filtering options
Finding the right piece of information at the right moment is now more accessible through FullSession advanced filtering and segmentation.
You can look for specific events during sessions without watching the entire recording, which saves you a lot of time. During your analysis, you can leave notes. It improves collaboration with your team members.
6. Privacy features
FullSession doesn’t give access to actual recordings of users’ screens and audio. You can watch reconstructions of events, which provide every necessary detail but don’t compromise users’ privacy.
You don’t have to fear that our software will record what people type on their keyboards or give someone access to a user’s login or credit card data.
What’s more, FullSession isn’t a tool you can use for behavioral advertising. You also can’t track users’ activity on the Internet with our solution. Our platform is for gathering data useful for your business, not for spying on users.
Mixpanel vs Google Analytics: Languages
Mixpanel supports English, Deutsch, French, Spanish, Japanese, Korean, and Chinese languages. While the list is quite impressive, Google Analytics still has the upper hand because it’s available in 30 different languages, including all Mixpanel supports..
What languages does FullSession support?
FullSession supports English, French, and Arabic languages.
Mixpanel vs Google Analytics: Integrations
Google Analytics integrates with all popular Content Management Systems. You can even download a plugin that makes deployment a bit easier.
Mixpanel also offers a decent list of integrations, with over 50 apps, including Amazon Web Services, Microsoft Azure, Google Cloud, Hubspot, Slack, Snowflake, and Zendesk.
Mixpanel offers a help center on its website. You can also access comprehensive developer documentation. In case of problems, you can contact the company via e-mail.
Google Analytics has a detailed documentation page that serves as a help center. You can contact Google 24/7 via e-mail and phone.
How FullSession supports customers
FullSession offers a help center with answers to often-asked questions. You can also contact us via chat if you need any help.
Mixpanel vs Google Analytics: Pricing
Mixpanel and Google Analytics have free plans suitable for smaller companies. Bigger businesses will probably want to invest in a paid plan. Mixpanel has two paid plans:
Growth – you can customize the event volume and access advanced behavioral analytics and collaboration tools. The Growth plan also offers custom onboarding and ongoing customer support.
Enterprise – you get everything known from previous plans, casual insights and monitoring, advanced user permissions, and improved data governance. Premium customer support is another benefit of this plan.
Growth plan starts at $25/month. The website doesn’t provide pricing details for the Enterprise subscription – you’ll have to contact the company directly to get that information.
Google Analytics has a paid plan called Google Analytics 360, which enriches the basic service with several new features: unsampled reports, data-driven attribution, and the option to export to bigQuery. The pricing starts at $150,000 per year.
FullSession affordable pricing packages
Here are more details on each plan.
The Starter plan costs $39/month or $32/year and allows you to monitor up to 5,000 monthly sessions with up to 6 months of data storage.
The Business plan costs $75/month or $60/year and helps you to track and analyze up to 100,000 monthly sessions with up to 12 months of data storage.
The Enterprise plan has custom pricing and offers customizable sessions plus full access to all features.
Mixpanel vs Google Analytics vs FullSession: Analytics tools overview
Here’s a handy table that should help you visualize the differences between each solution mentioned in this article.
Features
FullSession
Mixpanel
Google Analytics
Real-time Session recording
✔
✘
✘
Funnel analysis
✔
✔
✔
Conversion tracking
✔
✔
✔
Behavioral analytics
✔
✔
✘
Customer segmentation
✔
✔
✔
A/B testing
✘
✔
✘
Customer journey mapping
✘
✔
✔
Dynamic heatmaps
✔
✘
✘
Free trial
✔
✘
✘
Free version
✘
✔
✔
Surveys and customer feedback
✔
✘
✘
Insights
✔
✘
✔
Five reasons to start using FullSession today
There are at least five important reasons to consider using our FullSession platform:
Data from real people – instead of hiring testers, you track real users, which means you get the best possible data quality.
No effect on website performance – FullSession won’t slow down your website while gathering data.
Various data – you can watch session recordings, analyze interactive heatmaps, and ask your customers questions through feedback forms.
Ease of use – our platform is easy to learn and offers an intuitive interface.
Segmentation and filtering – you can filter data easily and segment your audience however you like. You can also single out essential events during sessions.
Mixpanel vs Google Analytics: Final words
Both Mixpanel and Google Analytics have their strengths and weaknesses. The important thing is to consider your business needs before you invest in a tool.
For example, if you only need basic, page-level data, there’s no need to go beyond Google Analytics, and often, even the free plan will give you everything you need.
However, if you need more advanced product analytics and the option to analyze behavioral data, consider FullSession. It’ll give you the best features, data quality, and data visualization you can get.
Our session recordings will show how people interact with your website, and interactive heatmaps will provide additional data to identify users’ behavior.
You can also use customer feedback forms to get information directly from your customers. FullSession lets you find the data you need quickly, thanks to powerful filtering and segmentation features. What’s best, it doesn’t affect your site performance while collecting data.
Here are answers to some of the most popular Mixpanel vs Google Analytics questions you can find on the Internet.
Does Mixpanel use Google Analytics?
Mixpanel is an entirely separate tool, but you can integrate it with Google Analytics and sync the data to use both platforms.
Is there anything better than Google Analytics?
Yes, many platforms offer more features and possibilities than Google Analytics. FullSession is one example here – start a 14-day free trial to evaluate all features.