Crafting top-notch marketing campaigns is just half of the work. At the end of the day, you still have to find out if those marketing activities worked as well as they should.
Marketing analytics is the key to optimizing your campaigns through data-driven decisions.
In this guide, we’ll do a deep dive into marketing analytics, why it’s important, and how to apply it to your own business.
What is Marketing Analytics?
You’ve launched a handful of marketing campaigns, made tweaks to your conversion strategies, and tapped into a new target cluster. How do you know if these marketing efforts met the goals you set at the beginning?
When businesses want to measure the effectiveness of just about any strategy, they turn to data. In the case of marketing strategies, you need marketing analytics.
Marketing analytics is the process of using data to assess the success of your marketing efforts. It goes beyond traditional metrics like sales or lead generation as it delves into finer details, such as customer behavior, engagement levels, campaign performance across different channels, and the overall customer journey.
There’s no one perfect way to analyze your marketing data. Popular marketing analytics models and methods include:
- Descriptive Analytics: Focuses on what has happened in the past to guide future marketing strategies.
- Predictive Analytics: Uses data from past marketing campaigns to predict customer behavior.
- Prescriptive Analytics: Uses all collected data to identify specific marketing strategies that could lead to higher engagement, conversion rates, or other objectives.
Savvy businesses will use more than one or a mixture of all methods.
What Are the 5 Main Types of Marketing Analytics Tools?
Marketing analytics tools help businesses optimize marketing efforts and demonstrate their value. Since there are multiple avenues of marketing, you might need to use more than one marketing analytics software.
Here are the five main categories of marketing analytics software:
1. Web Analytics
Web analytics involves the measurement, collection, and analysis of web data to understand and optimize website usage.
It gives you a better understanding of how users interact with your website, which parts of the site are most engaging, and where improvements can be made to improve the user experience.
2. SEO Analytics
SEO (Search Engine Optimization) analytics focuses on analyzing and understanding website performance in search engine results pages (SERPs) to improve visibility and rank higher for relevant queries.
Analyzing these metrics can help you improve your SEO strategies, find high-performing keywords, optimize website content, and maximize overall search engine visibility to drive more organic traffic.
3. Social Media Analytics
Social media marketing is one of the most powerful forms of marketing, but it can sometimes be a hit or miss. Analyzing data from your platforms can help you understand social interactions and the performance of social media campaigns.
Plus, you can craft more targeted marketing initiatives and tailor content to increase engagement and conversions.
4. Lead Generation and Attribution Analytics
Lead generation analytics focuses on tracking and analyzing the generation of potential customer interest in products or services. On the other hand, attribution analytics further examines which marketing channels and touchpoints contribute to conversions or sales.
Both types of analytics can help you identify which lead generation strategies are most effective and how various marketing channels play a part in customer acquisition.
5. Email Marketing Analytics
Email marketing analytics allows marketers to upgrade their email campaigns, segment their audiences, and customize content to increase engagement and conversions.
An effective email marketing analytics tool lets you gather important data, such as click rates, read-through rates, link engagement, and more. For example, using DMARC aggregate reports can help you get a better understanding of your email deliverability.
Why is Marketing Analytics Important?
A well-implemented marketing strategy can produce amazing results for your business. However, you want to know exactly how effective it was and how many of your goals you actually met. And this is where marketing analytics tools come in.
With these tools, you’ll be better at:
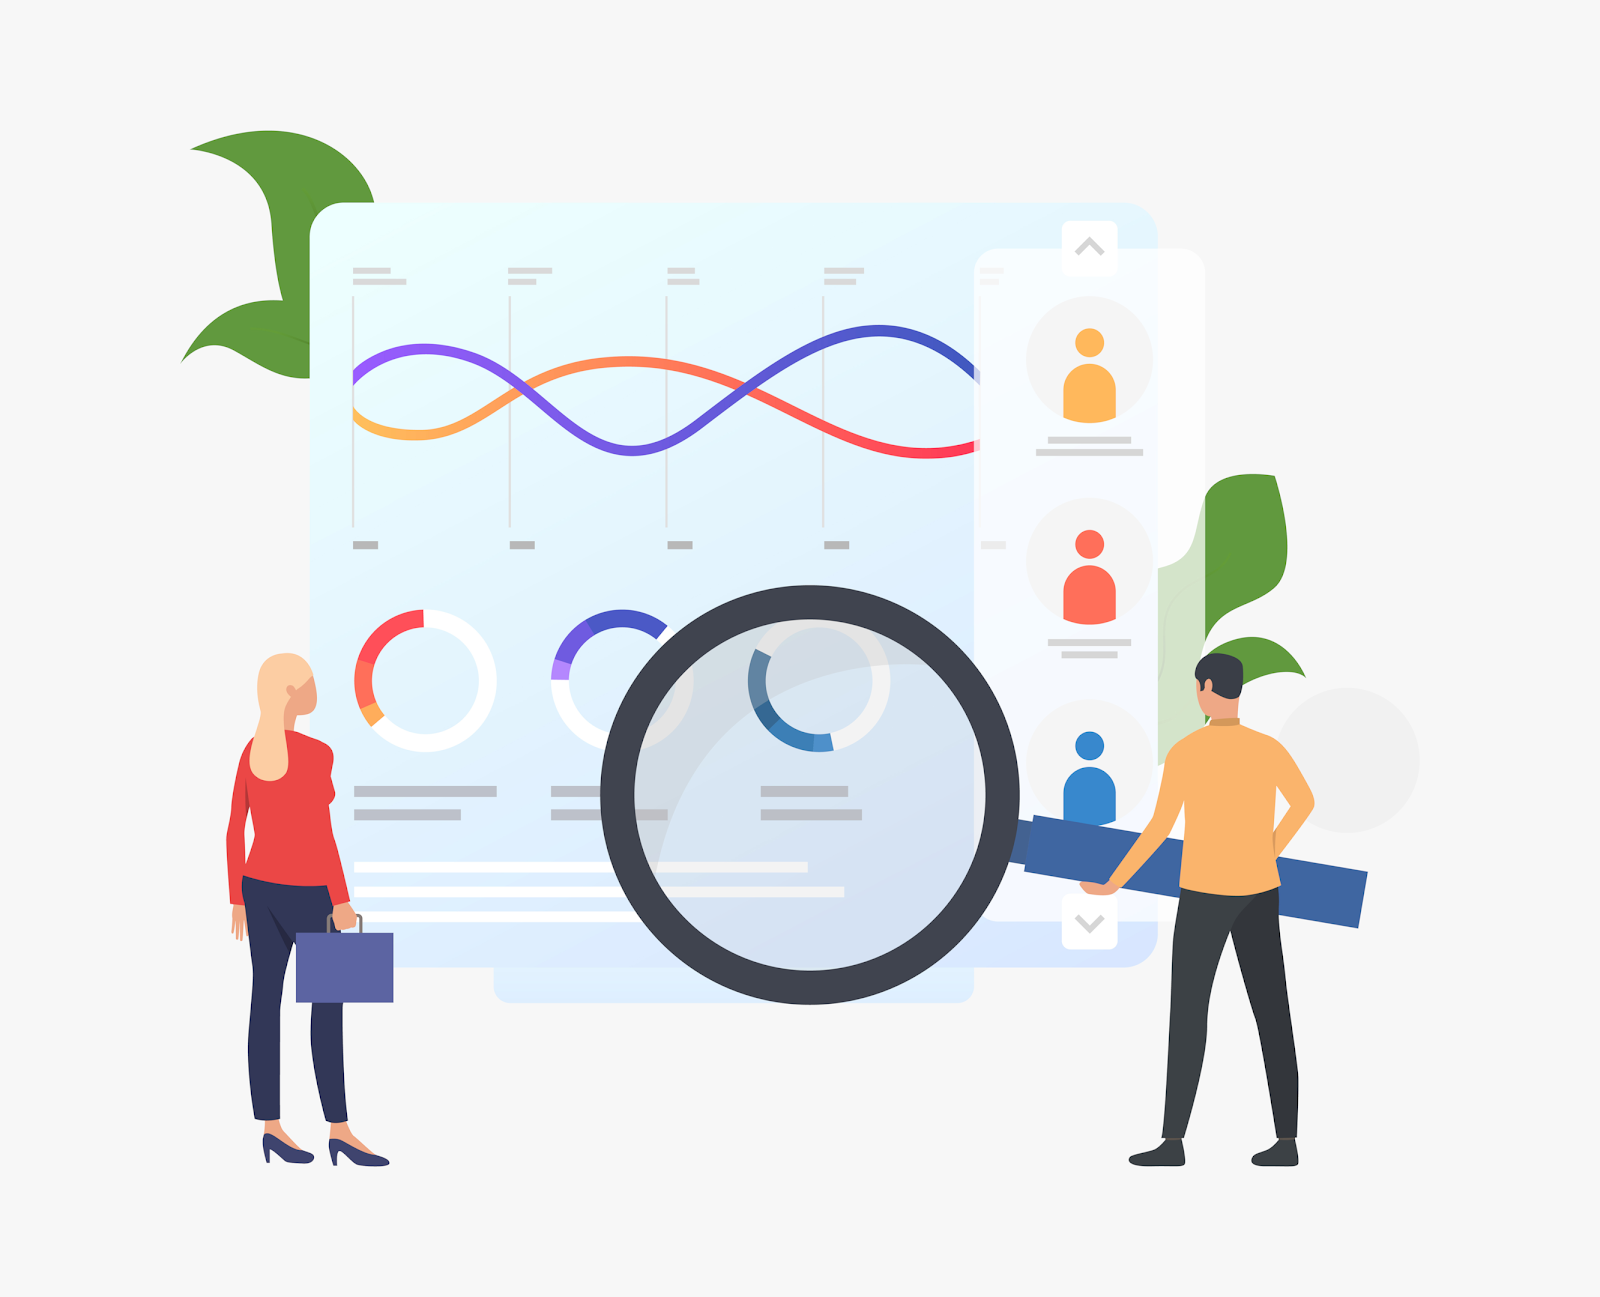
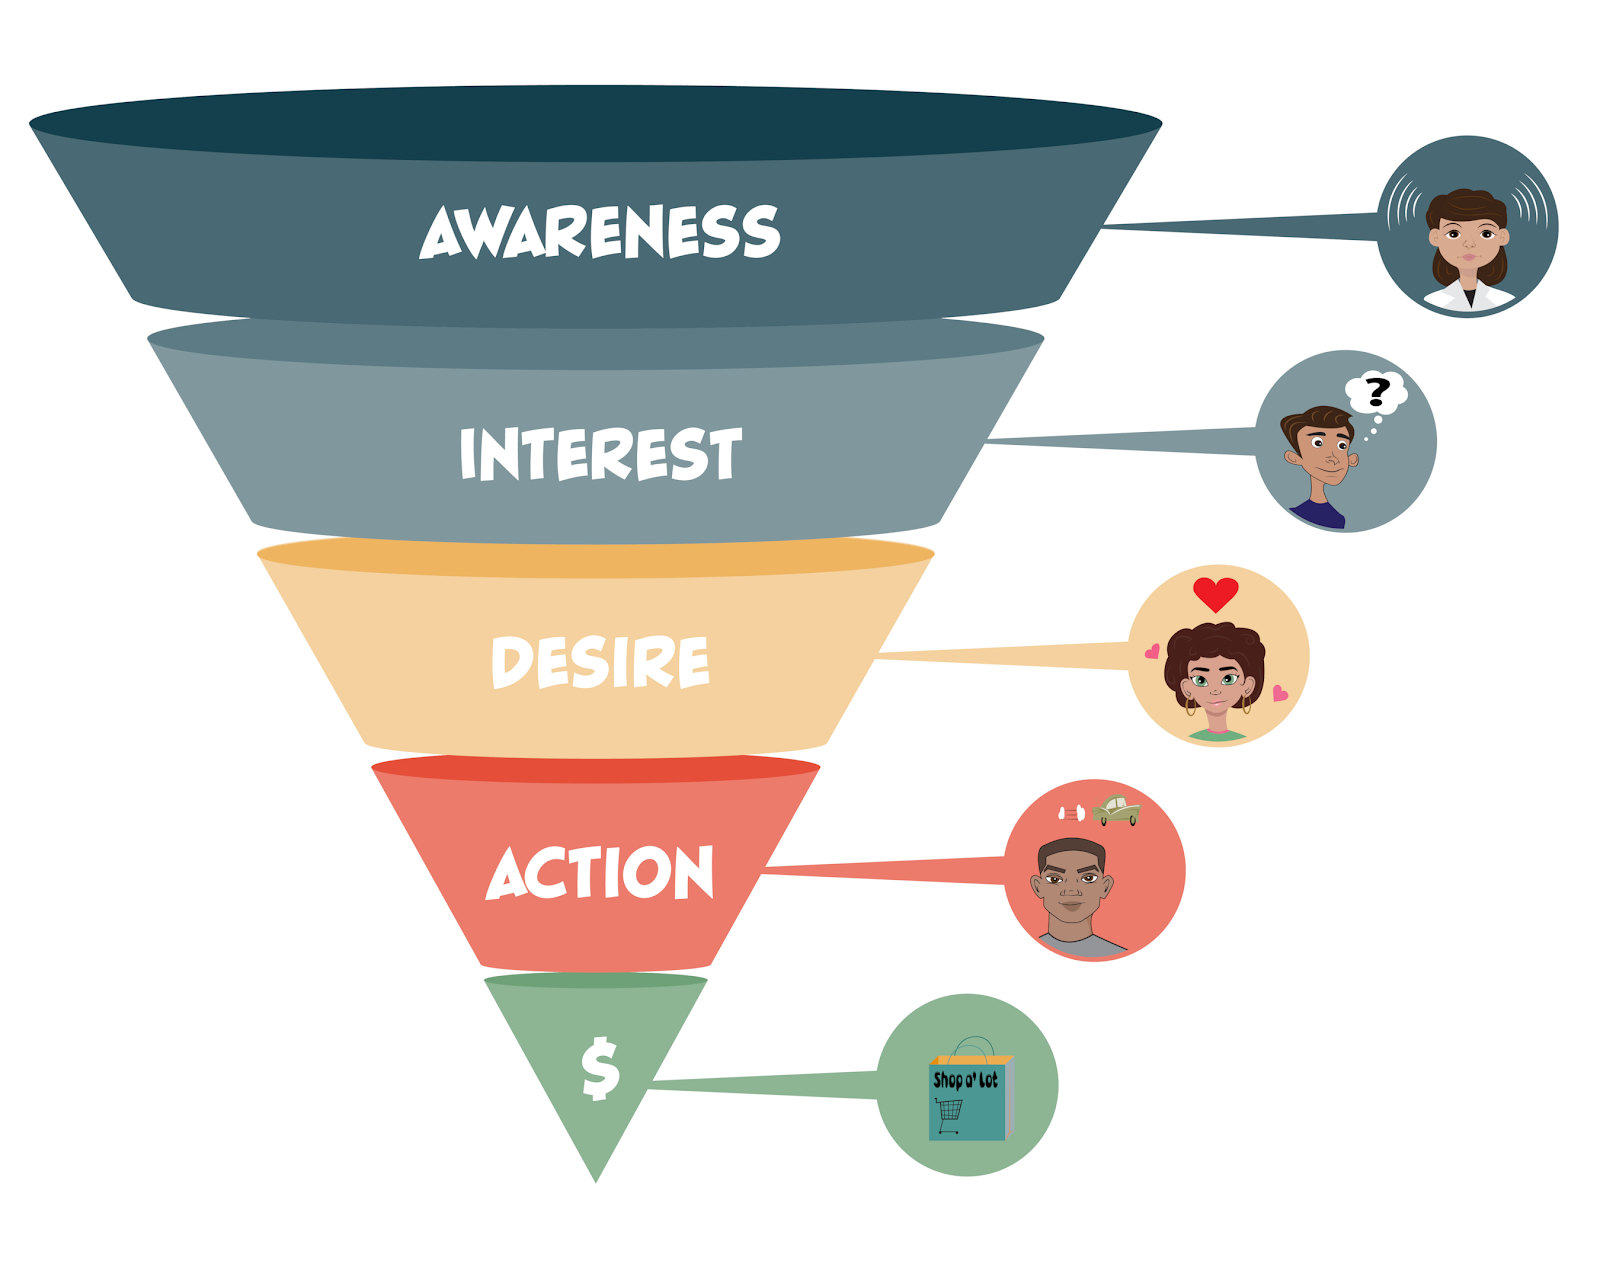
Understanding the Customer Journey and Conversion Funnel
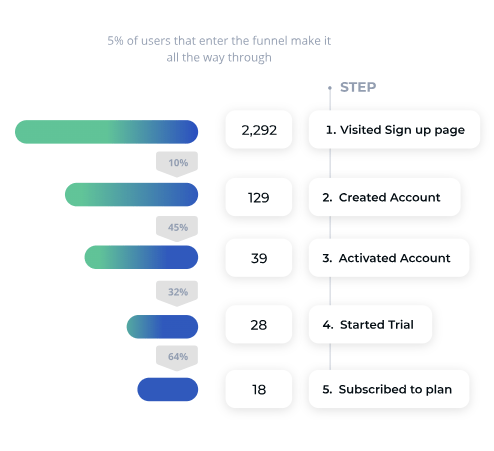
Your customers are on an adventure of their own from the moment they hear about you until they decide to make a purchase (and beyond). Marketing analytics helps you map out their journey, showing you the paths they take, the stops they enjoy, and where they might get lost.
Analyzing how your customers move through the conversion funnel lets you identify where you lose potential customers and where you get the most conversions. In turn, you can better optimize your strategies to improve conversion rates.
Refining Your Marketing Strategies
The main goal of marketing analytics is to show you what you need to improve and which strategies are working the best. So, marketing analytics allows you to refine your strategies and make sure that your resources are invested in the most effective paths.
For instance, marketing analytics can pinpoint which marketing channels (social media, email, search engines, etc.) are driving the most engagement, leads, or sales.
Quantifying Your Claims
In the world of marketing, claims are your bold flags planted in the ground. But to ensure they’re seen and respected, you need to back them up with solid, quantifiable proof.
Marketing analytics provides the evidence to support your claims, turning “We believe we’re the best” into “Here’s the data that shows we’re the best.”
For example, let’s say a clothing brand launches a summer ad campaign on social media, claiming it was a huge hit. Without marketing analytics, that statement is just words. However, the brand can back up its claim with solid numbers:
“Our summer ad campaign generated a 30% increase in social media engagement and boosted online sales by 25% compared to the previous month.”

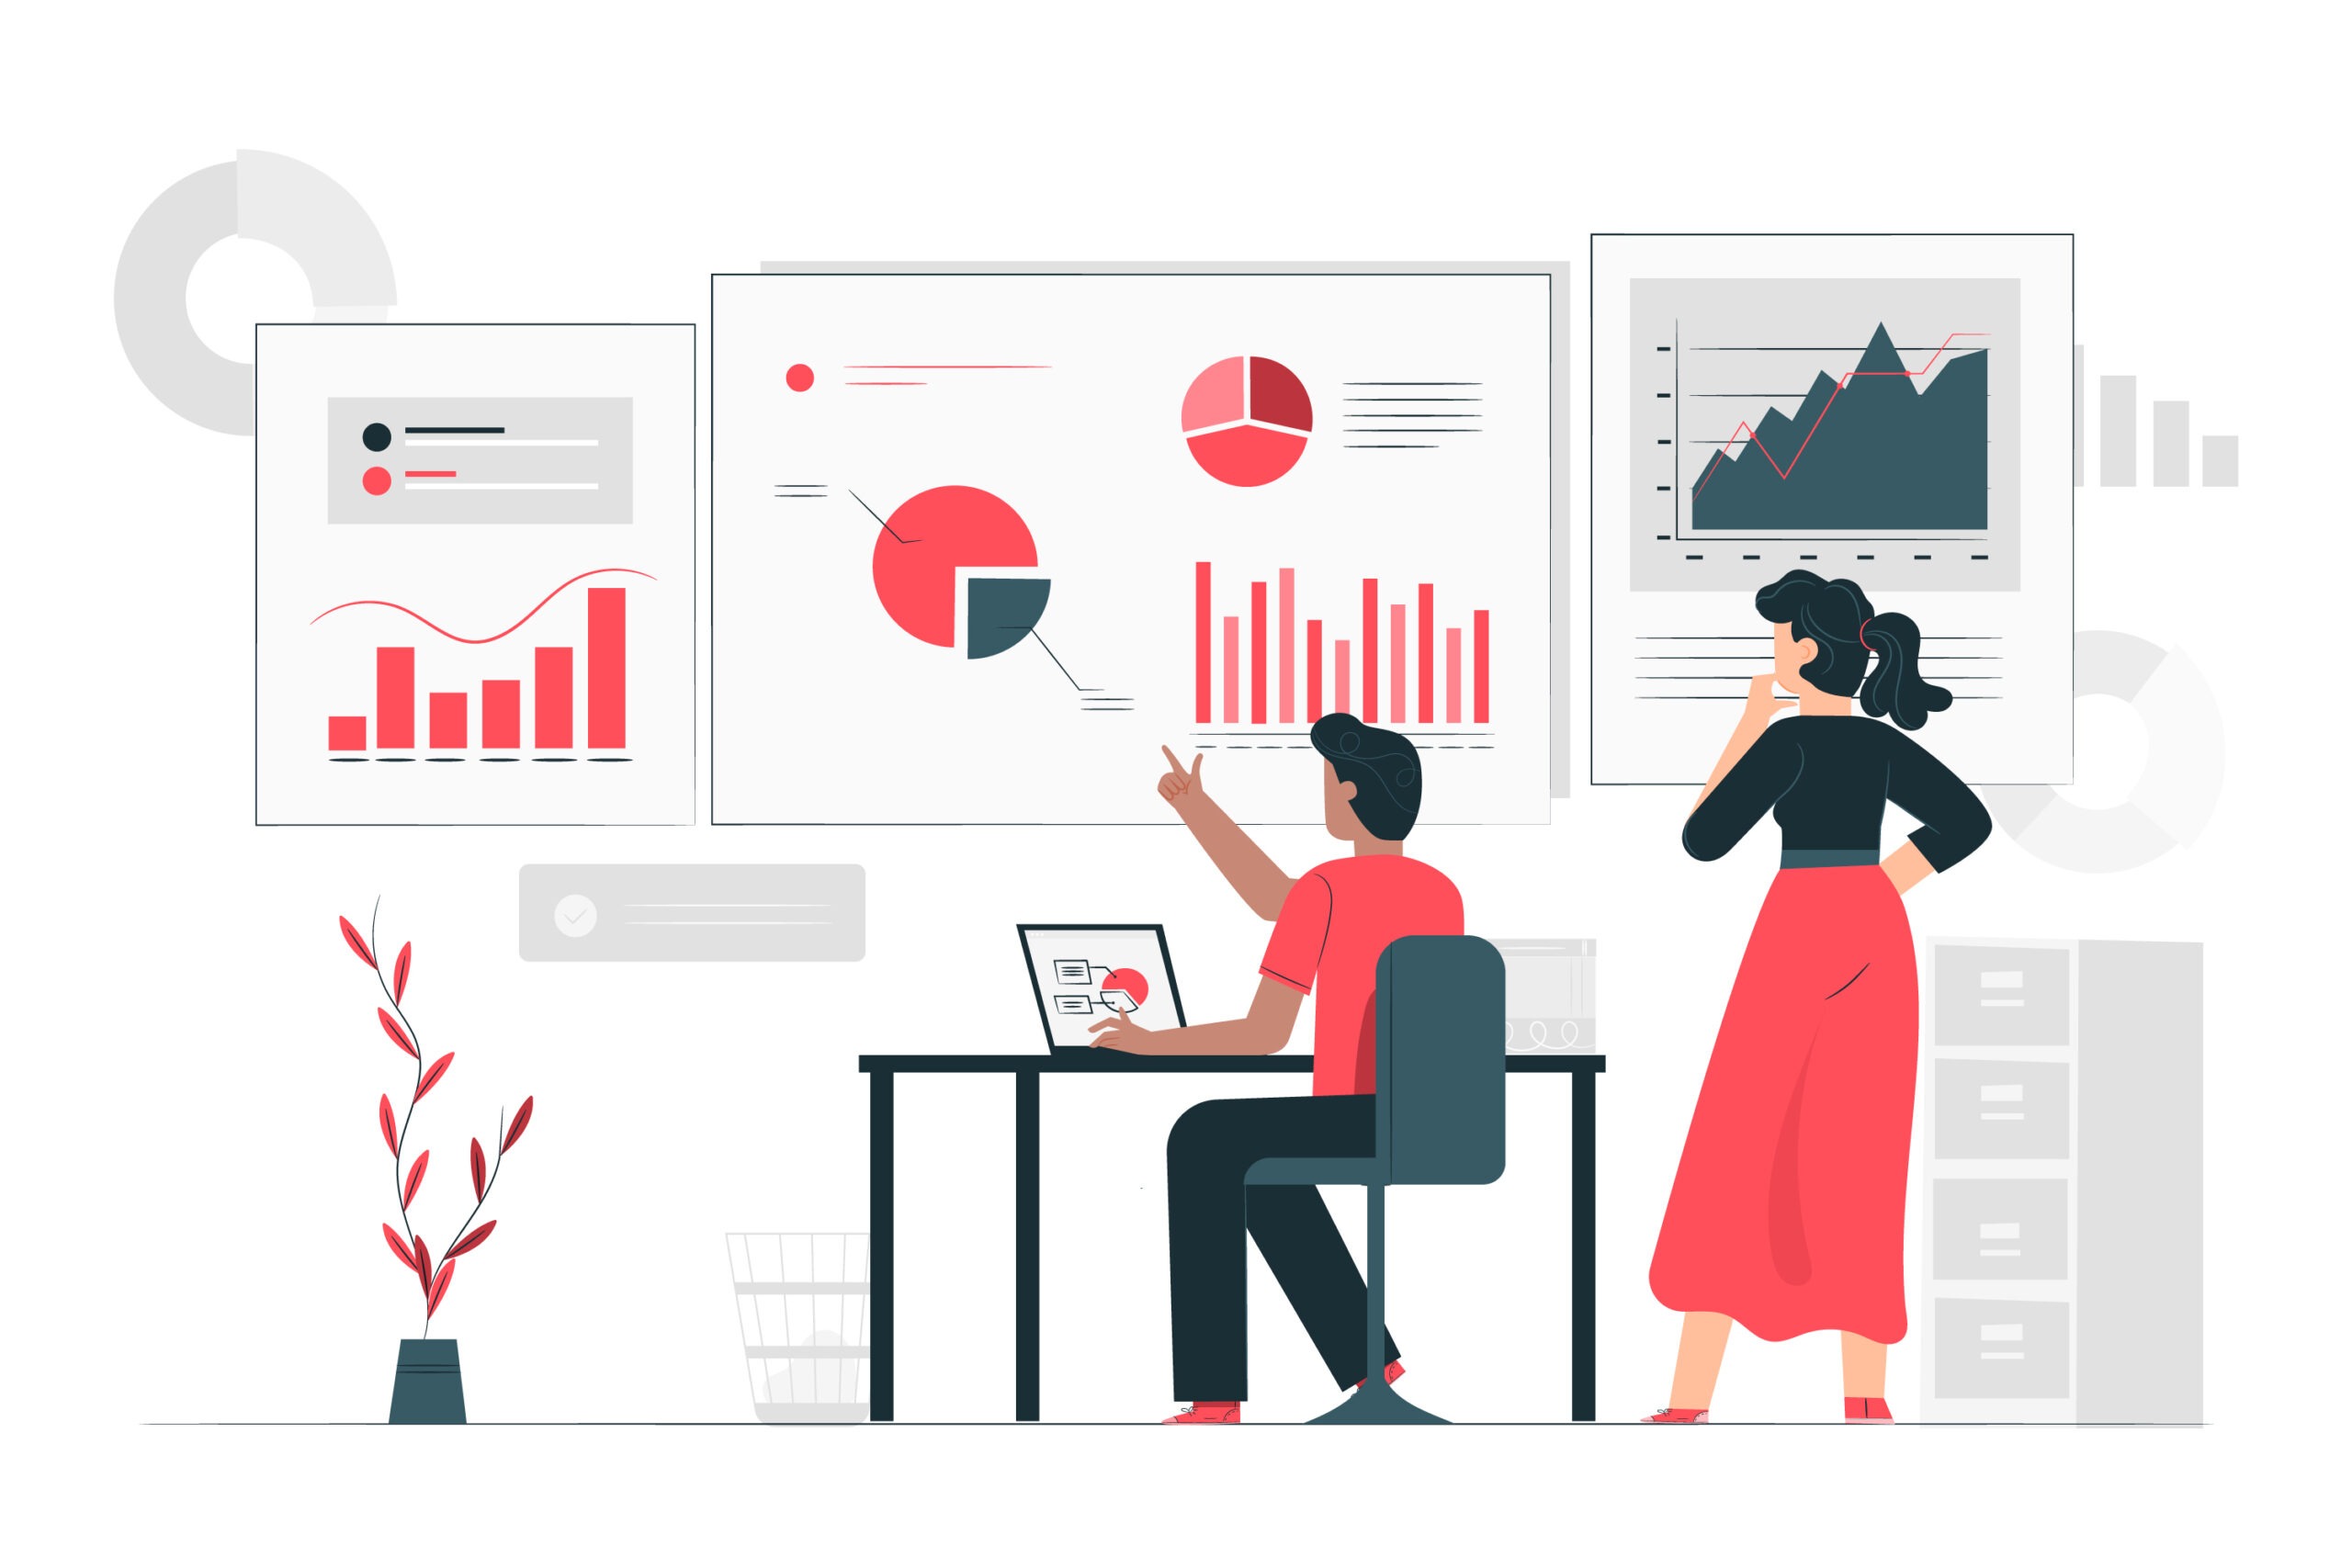
Transforming Marketing Data Into Valuable Insights
Marketing teams can use data analytics to make strategic decisions based on facts. In other words, marketing analytics take out most of the guesswork when strategizing new marketing efforts.
Marketing teams can also visualize these insights through dashboards, charts, and reports. Visual representations help marketers and decision-makers understand complex data and identify the next best steps.
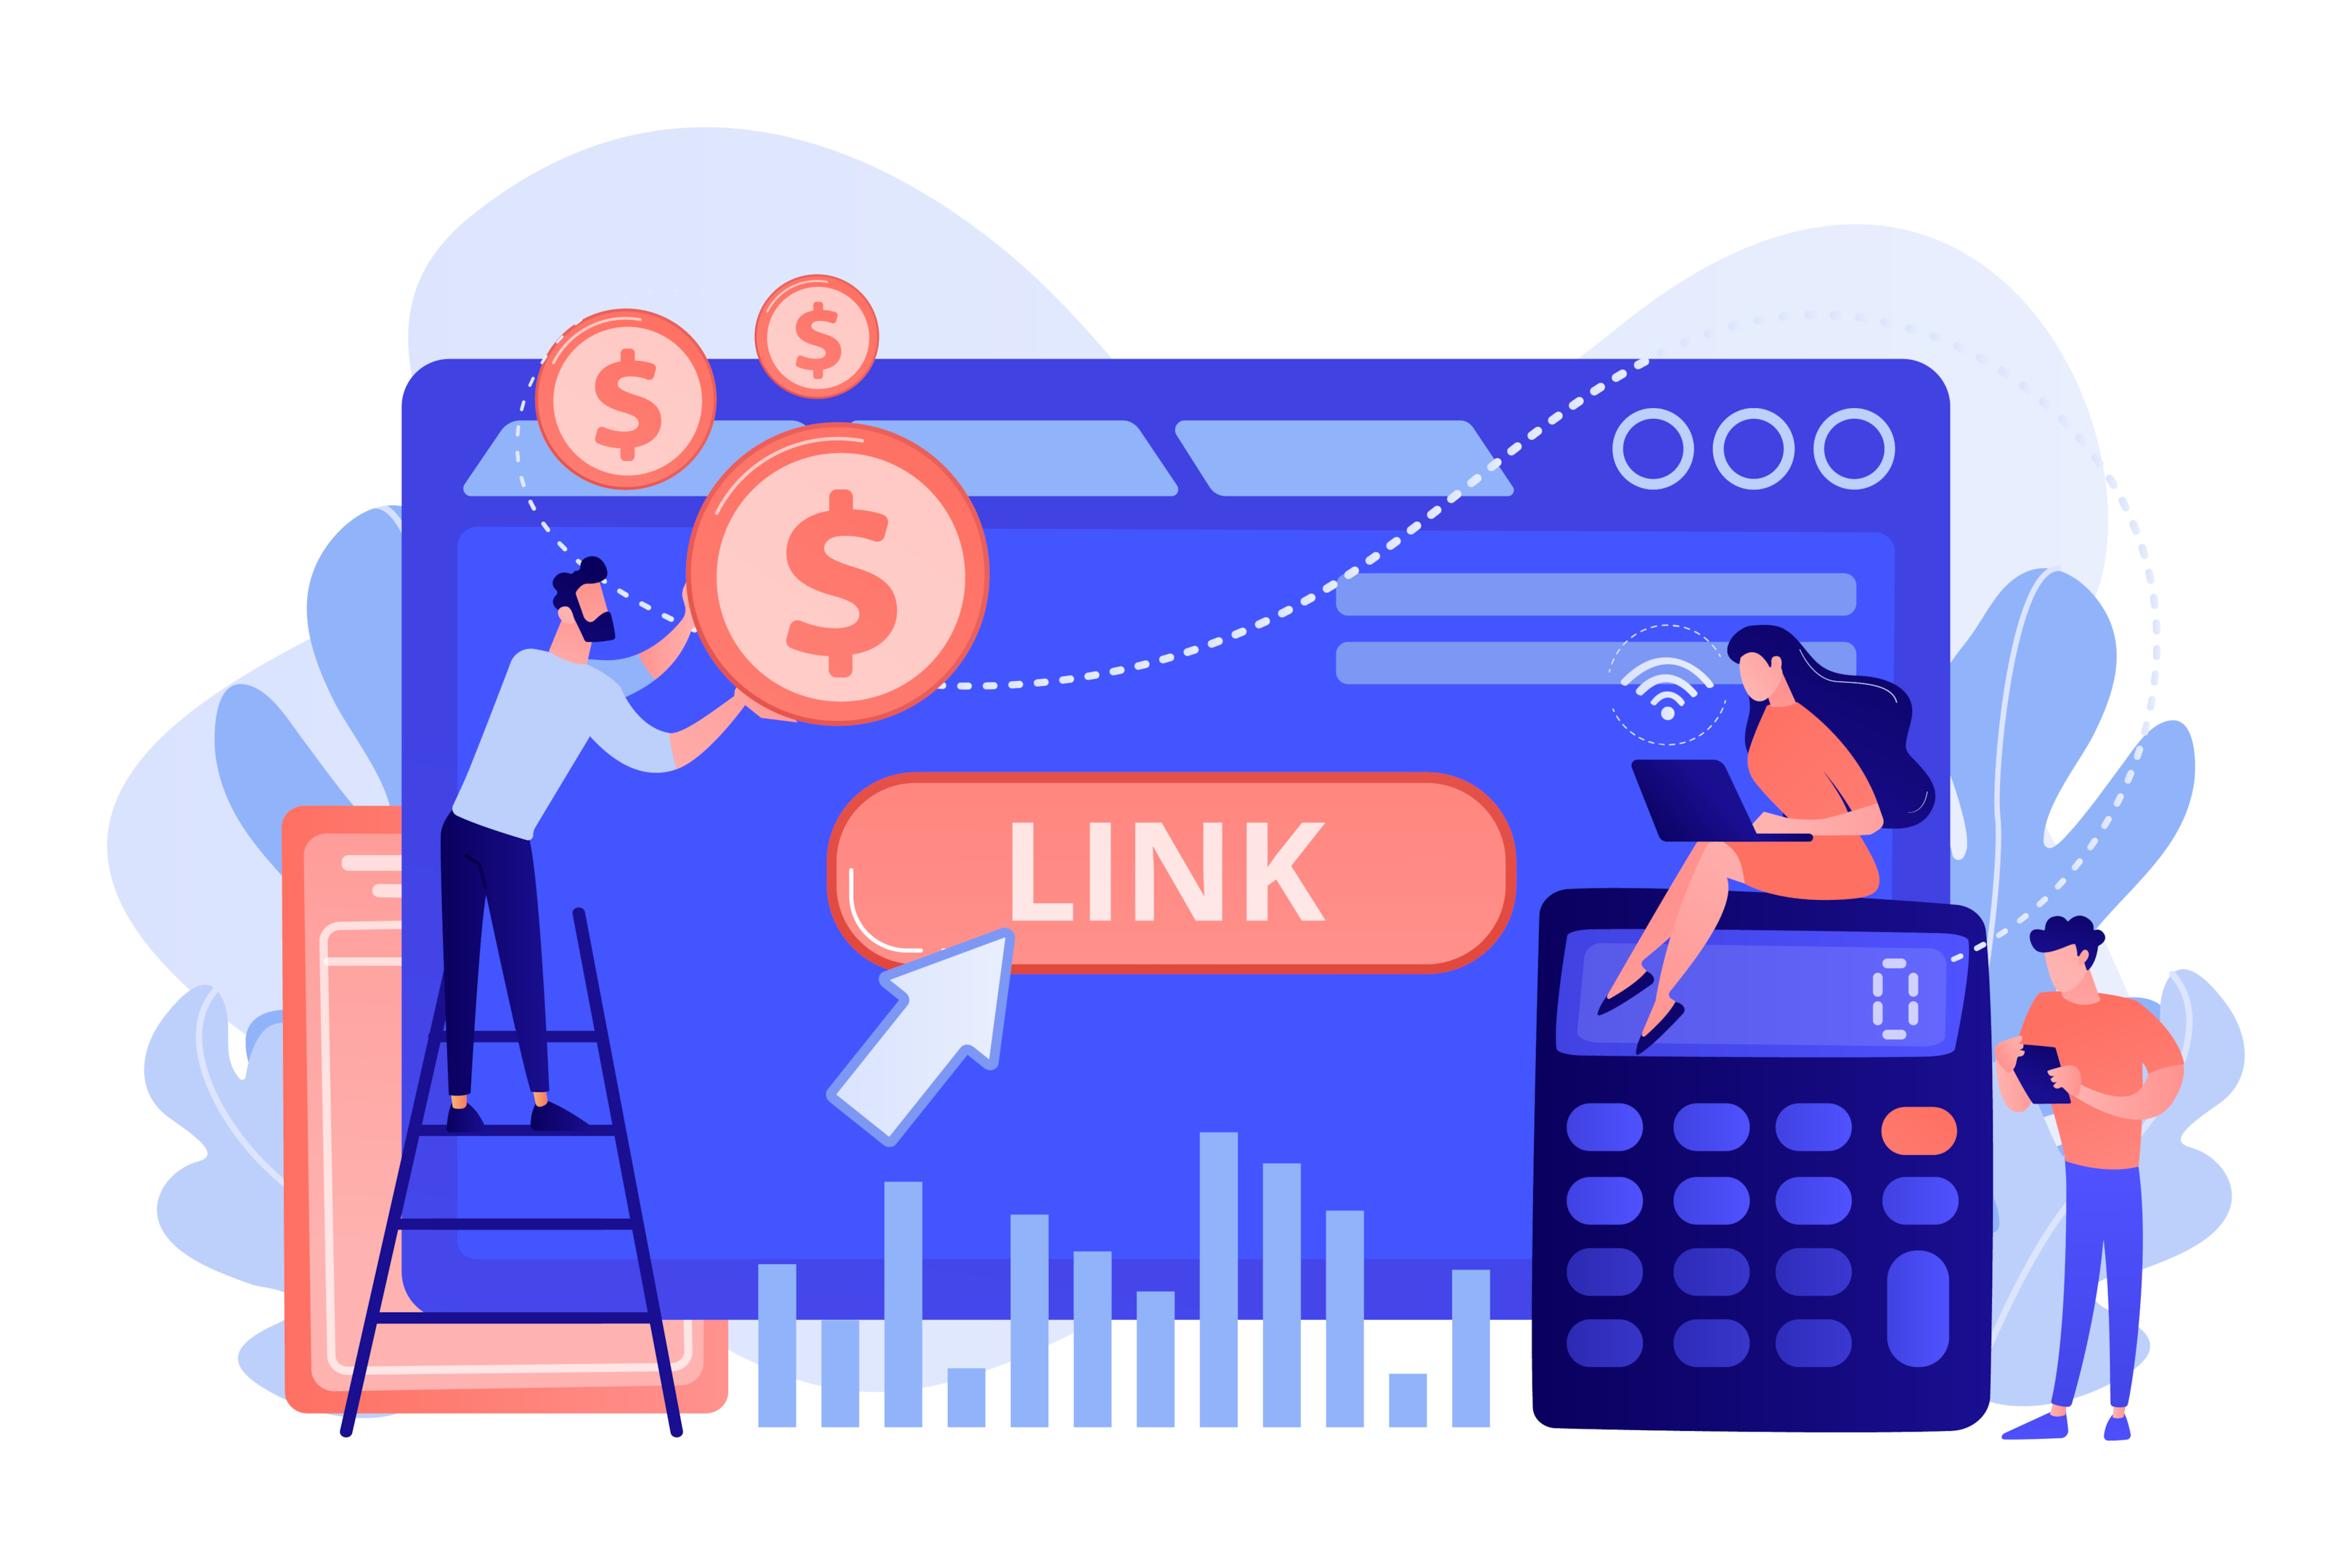
Measuring Your ROI
We’ve already mentioned that marketing analytics can help you evaluate the effectiveness of your marketing performance. From a business owner’s point of view, analytics gives you a clearer view of your return on investment (ROI).
Marketing analytics aggregates all cost data, including ad spend, marketing tool subscriptions, salaries of marketing personnel, and any other associated costs.
At the same time, it offers detailed insights into key performance indicators (KPIs) such as click-through rates, conversion rates, customer acquisition cost (CAC), customer lifetime value (CLTV), and more.
Adding these two segments (plus other variables) helps you clearly see how well your marketing dollars have paid off.
How to Use Marketing Analytics to Maximize Your Growth
Using data analytics to evaluate your marketing performance is one of the best ways to determine if your investments are working as well as they should.
Here’s a marketing analytics game plan you can start with:
1. Set Clear Goals
First up, decide what you’re aiming for. More website visitors? Bigger sales numbers? Keeping your customers coming back?
Make your goals clear and keep them realistic. Think about what success looks like for you, but keep it simple—no need for overly complicated targets (save that for later!)
2. Establish Your Benchmarks
Take a good look at where you’re at now. How’s your website doing? How do your social media accounts look compared to the competition? Are you reaching your target audience as well as you should?
It’s always better to go for a more direct approach. Here are some essential KPIs that should be on your radar:
- Website Traffic: Total number of visits to your website. It’s the big-picture view of your online presence.
- Conversion Rate: The percentage of visitors who take a desired action (e.g., buying a product or signing up for your membership). It’s all about how effectively you’re turning visitors into customers or leads.
- Pageviews and Time on Page: Shows how engaging your content is. If people stick around to read, watch, or interact, you’re probably doing something right.
- Bounce Rate: The percentage of visitors who leave after viewing only one page. A high bounce rate might mean your landing pages aren’t as compelling as they could be.
- CAC: The total cost of acquiring a new customer. It includes everything from marketing and sales expenses to software costs. Keeping CAC in check while growing is key to a healthy business.
- CLTV: The total revenue a business can expect from a single customer over the course of their relationship. It’s a big-picture metric that helps you understand the value each customer brings.
Keep in mind that KPIs can look different from business to business. Make sure you know what metrics you should be tracking before you analyze and measure your marketing performance.
3. Collect Marketing Data
Now, it’s time for the most challenging part: collecting your marketing analytics data. Luckily, there are plenty of ways you can do this:
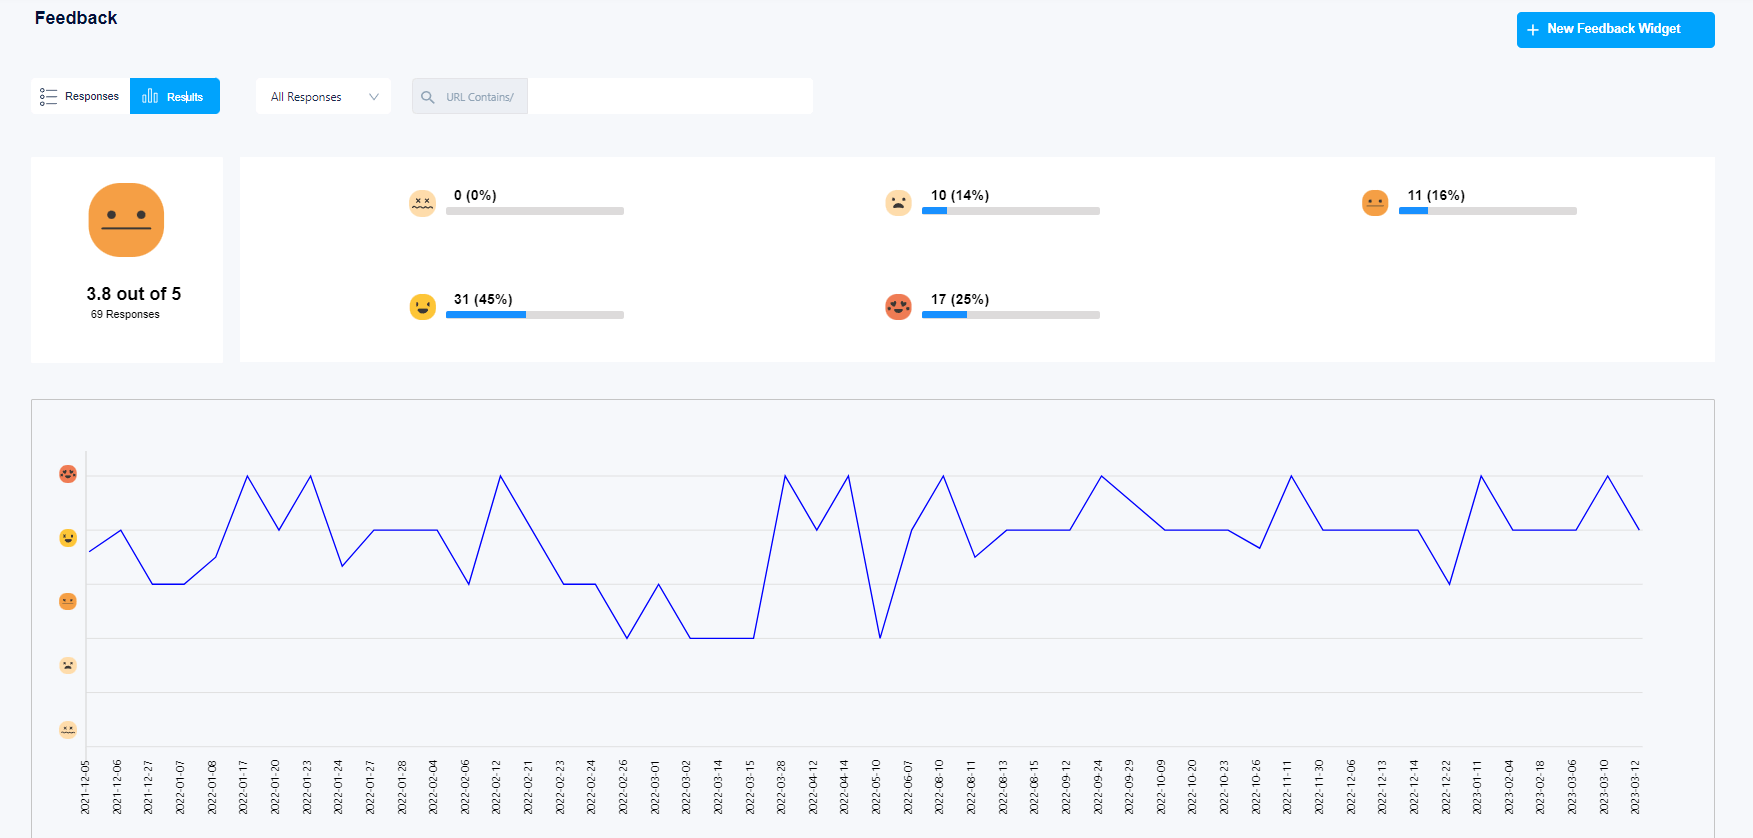
- Surveys and Questionnaires: Gathering direct feedback from customers about their preferences, satisfaction levels, and product/service expectations.
- A/B Testing: Comparing two versions of a webpage, ad, or email campaign to see which performs better in terms of engagement, conversions, or other predetermined metrics.
- Organic Content Engagement: Analyzing how users interact with content that isn’t promoted through paid advertising, such as blog posts, social media posts, and videos. Metrics include likes, shares, comments, and time spent on the page.
- Paid Ad Engagement: Measuring the effectiveness of paid advertising campaigns on platforms like Google Ads or social media. Key metrics include click-through rate (CTR), conversion rate, cost per click (CPC), and return on ad spend (ROAS).
- Social Media Analytics: Tracking engagement rates, follower growth, mentions, and hashtag performance to understand how audiences interact with your brand on social platforms.
- Website Analytics: Using tools to measure website traffic, user behavior, bounce rate, page views per session, and conversions to optimize the user experience and content strategy.

4. Apply Marketing Analytics Tools
The next step is to find the right tools for the job. There are tons of analytics tools out there, so pick the ones that fit what you’re trying to do. Here are some of the most popular ones:
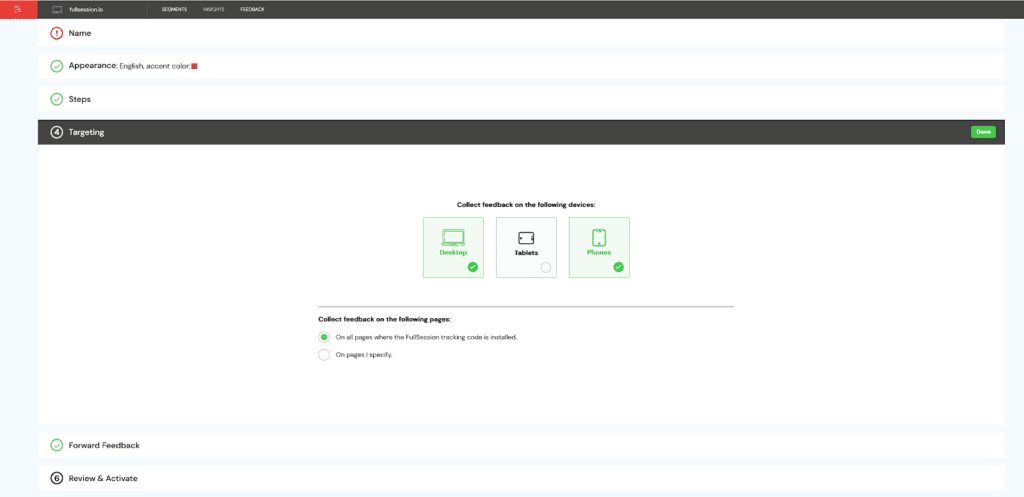
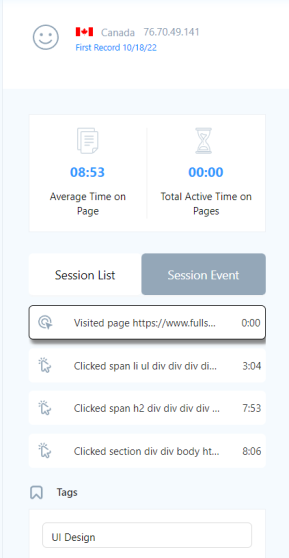
- FullSession: A comprehensive toolbelt for web analytics, including interactive heat maps, session recordings and replays, market segmentation capabilities, and more.
- Google Analytics: The must-have tool for tracking web traffic, user behavior, and customer acquisition channels. It’s versatile, widely used, and offers both free and paid versions (Google Analytics 4).
- Sprout Social: Provides top-notch social media management and analytics, including engagement tracking, audience growth analysis, and competitor comparison.
- SEMrush: A powerful tool for SEO, content marketing, competitor research, PPC, and social media marketing. It’s great for tracking keyword rankings, backlinks, and SEO health.
- Salesforce Sales Cloud: Offers comprehensive CRM solutions with powerful analytics to track sales performance, customer interactions, and more.
- Shopify Analytics: If you’re running an e-commerce site on Shopify, its built-in analytics provide insights into sales, customer behavior, and site performance.
5. Re-Strategize Your Marketing Strategy
You now have your marketing data and have done deep data analysis.
Next, go back to the list of objectives you set before all this. Based on the insights you’ve gathered, how can you improve your marketing efforts so that you meet those goals?
At this point, it’s time for human talent to take over. Marketers, product developers, customer relationship management teams, and other departments can now work together to improve marketing results and, in turn, the business’s bottom line.
Use Marketing Data Analytics to Maximize Your ROI
Marketing efforts without data analysis are pretty much shots in the dark. You won’t know if your campaigns are working, and even if they seem to be successful, you still need to measure by how much.
Whether you’re new to marketing analytics or want to improve, you need the right digital marketing tools to analyze marketing analytics data effectively. Start with the best web analytics tool on the market: FullSession.
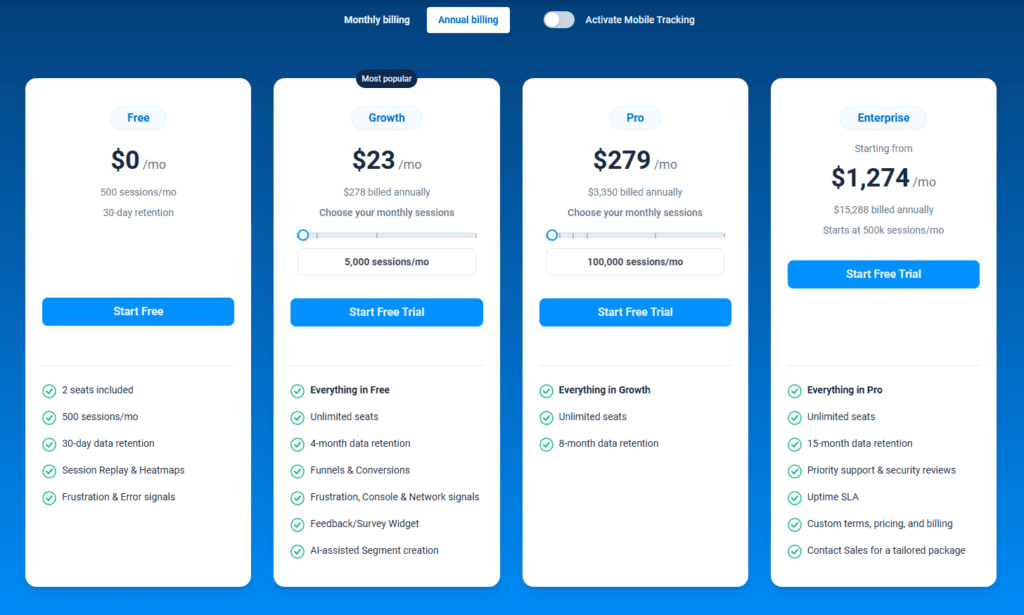
FullSession Pricing Plans
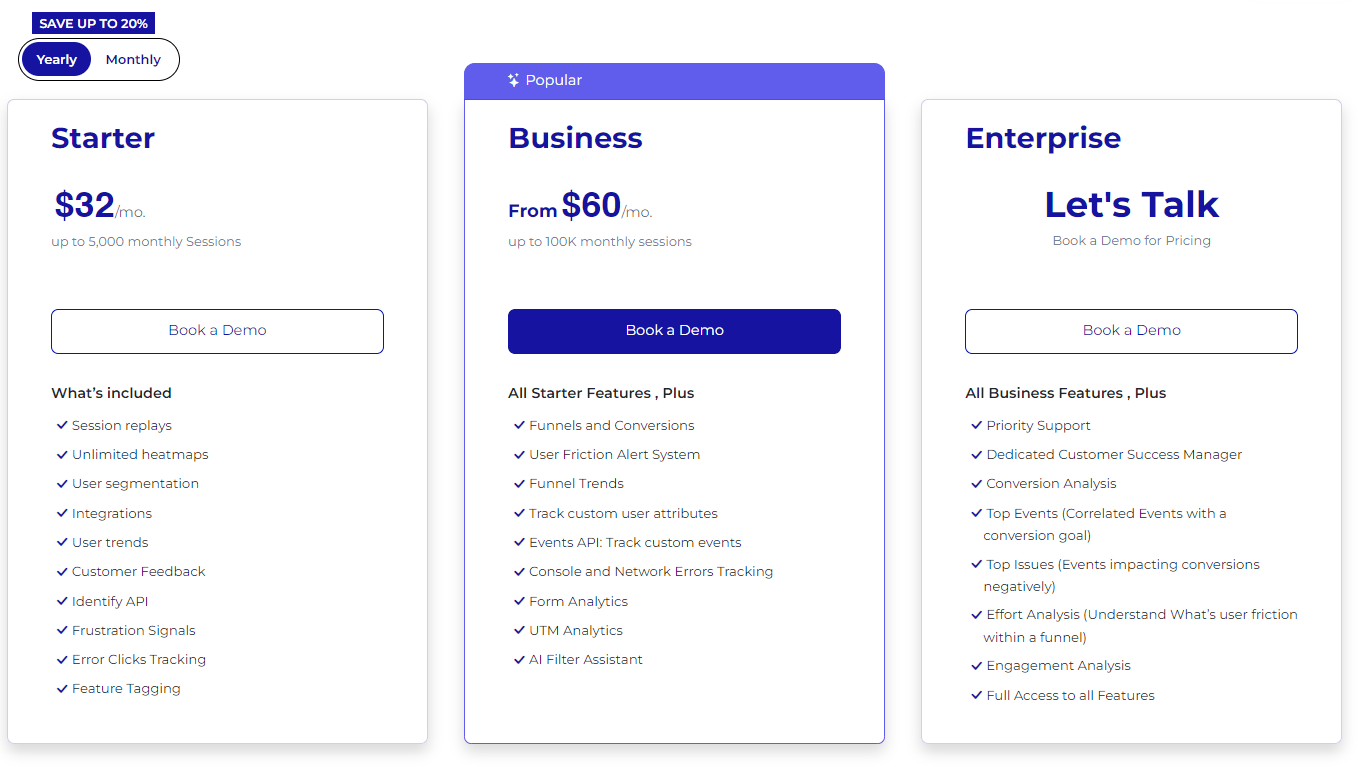
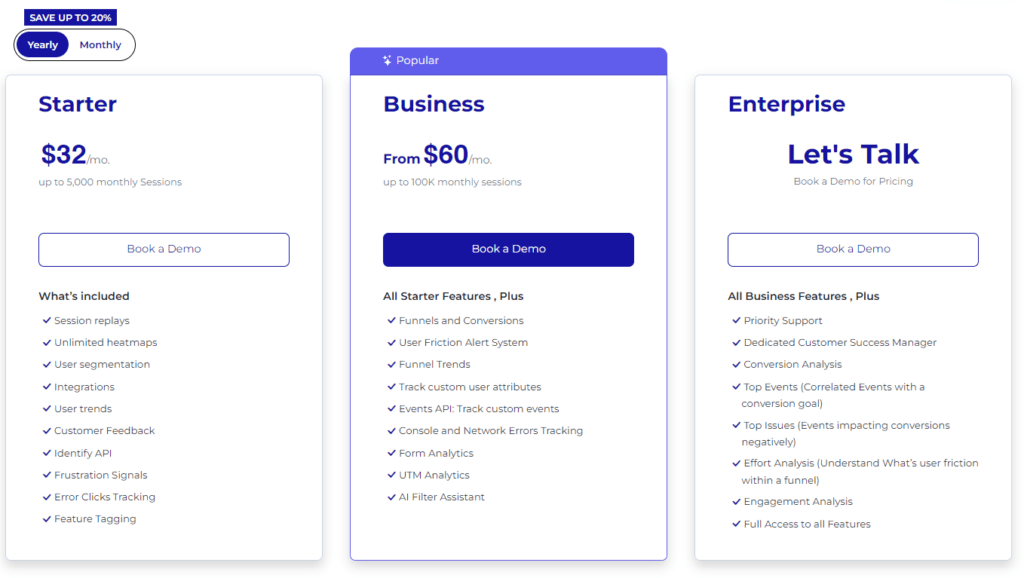
The FullSession platform offers a 14-day free trial. It provides two paid plans—Basic and Business. Here are more details on each plan.
- The Starter plan costs $39/month or $32/year and allows you to monitor up to 5,000 monthly sessions with up to 6 months of data storage.
- The Business plan costs $75/month or $60/year and helps you to track and analyze up to 100,000 monthly sessions with up to 12 months of data storage.
- The Enterprise plan has custom pricing and offers customizable sessions plus full access to all features.
Install Your First Marketing Analytics Tools Right Now
It takes less than 5 minutes to analyze your marketing campaigns withFullSession, and it’s completely free!
FAQs About Marketing Analytics
Is marketing analytics only for big businesses?
No. Businesses of all sizes can (and should) leverage marketing analytics to improve their strategies.
How technical do I need to be to use marketing analytics?
While some technical know-how is helpful, many tools make analytics accessible to non-technical users. Plus, a willingness to learn goes a long way.
Can marketing analytics predict future trends?
While not a crystal ball, marketing analytics can help forecast trends based on past and current data, giving you a competitive edge.