Website heatmaps visually represent user behavior and actions. They help you discover actionable insights, improve site performance and optimize the user experience. Understanding how users interact also helps you improve the design and functionality of your website.
In this blog post, we will cover everything you need to know about heat maps, including what they are, how they work, and why they’re essential.
We’ll also focus on FullSession heat maps and explain how to use them to make data-driven decisions and grow your business. To evaluate our heat map feature while reading, start a free trial.
Let’s start with some basic information.
The basics of heat maps for monitoring user behavior
The website heat map shows where users click, scroll, and move their mouse while navigating your web page.
Unlike Google Analytics which shows raw data points and numeric data, website heatmap presents all data in a visually appealing way.
Heat map data analysis shows a series of colored dots, with different colors representing various types of user action. For example, red might indicate a high concentration of clicks, while blue might illustrate low user engagement.
Why are heat maps important?

Image source: Pexels
Heat maps allow you to understand the areas of your website where users encounter problems.
They offer a comprehensive view of user behavior beyond simple metrics such as page views or clicks. You can find website issues such as broken links or slow load times and fix all causes of user frustration.
It leads to increased engagement, longer session duration, and higher conversion rates.
What are the benefits of using heat maps on your site?
There are many benefits of using heat maps on your site, including the following.
- Increased user engagement: Heat maps help you understand what content resonates with your audience or doesn’t, allowing you to improve your site accordingly.
- Better optimization efforts: With heat maps, you can identify which pages are performing well or underperforming, helping you focus your efforts in the right direction.
- Cost-effectiveness: Heat maps provide a cost-effective way to gather data about user actions compared to expensive user testing or surveys.
- Improved customer satisfaction: Using heat maps to understand user behavior and frustration, you can make design changes that will enhance the overall user experience, leading to increased customer satisfaction.
- Easy to analyze data: Heat maps visually represent user behavior, making them easy to understand and interpret, even if you have limited data analysis experience.
- Data-driven decisions: With heat maps, you can make data-driven decisions about website design and optimization instead of relying on assumptions or gut instincts.
- Actionable insights: Heat maps provide actionable insights that can inform design decisions and drive business success, such as improving the user experience, increasing conversions, and fixing technical issues.
As you can see, you can improve the overall quality of your website, leading to a better reputation for your business.
How do heat maps work?
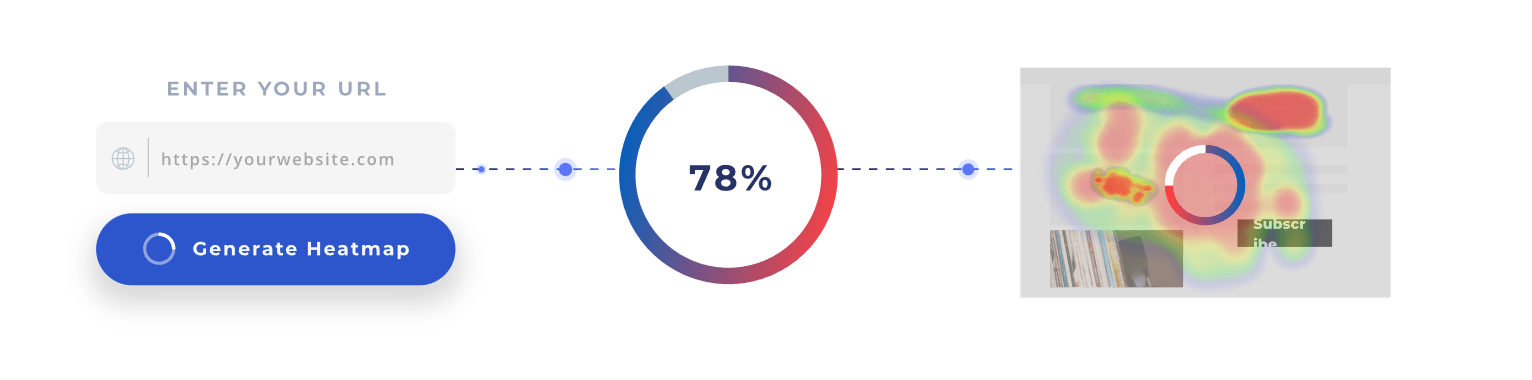
To use heat maps for your website optimization, you need to employ behavior analytics tools such as FullSession.
Our software collects information about user interaction and presents it in a visual format that is easy to understand.
You can configure the software to focus on specific user actions, allowing you to zero in on particular aspects of the user experience you want to analyze and optimize.
You might focus on clicks on specific page elements, such as buttons, links, or images, or track user engagement with certain page parts, such as video, to understand the level of interest and engagement with your website content.
You can understand your strengths and weaknesses and identify improvement opportunities by combining the insights from our website heatmap tools with session recording tools, conversion funnel tracking, and website feedback forms.
Start your free trial or get a demo to evaluate all features.
When should you use website heat maps?

Image source: Pexels
Here are a few situations when you should use website heat maps. For online stores, ecommerce heatmap tools can help teams evaluate product-page engagement, landing page scroll depth, CTA clicks, and checkout-path friction.
- To improve website navigation: You can use mouse tracking to identify the most popular pages or pages hidden from users’ reach. This information helps you improve your site navigation and reduce the bounce rate.
- To optimize your landing pages: You can use scroll maps to see how far down users scroll, where they lose interest and exit your landing page. It is helpful when considering where to place CTAs and other conversion elements.
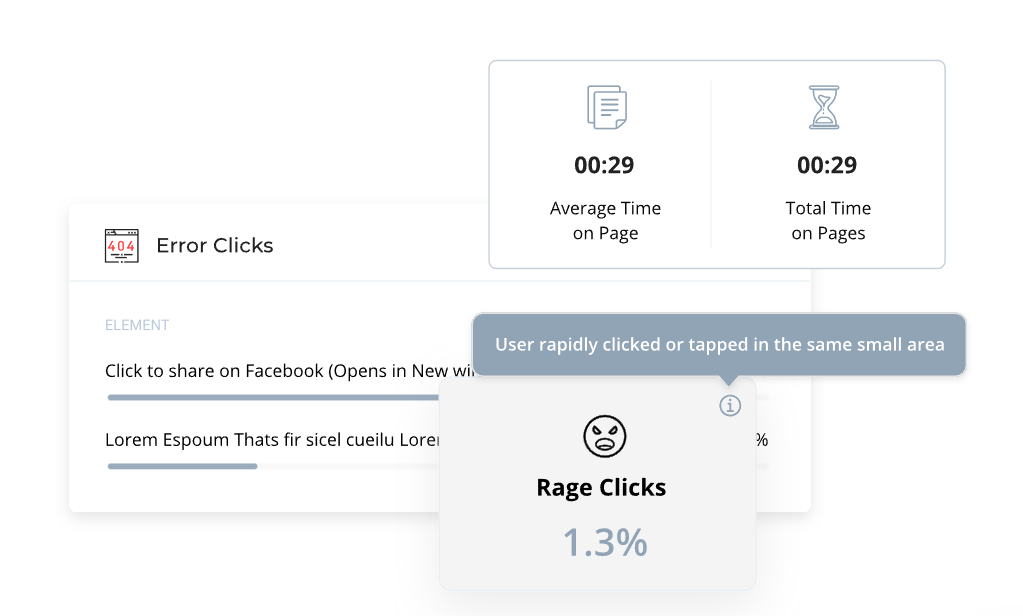
- To understand user feedback: You can track the time spent on specific pages, the number of clicks on particular links, and understand where users had problems during their sessions since you can track error, rage or dead clicks.
By analyzing individual data points correctly, you can gain valuable insights and improve the overall user experience of your website.
How to start with heat maps using FullSession
FullSession is our all-in-one CRO tool that allows you to track user behavior on your site. Here’s how to create heat maps with FullSession.
Sign up and start your free trial
The first step is to sign up for a FullSession account. It is a quick and straightforward process; you can start using our platform immediately.
Install the FullSession tracking code
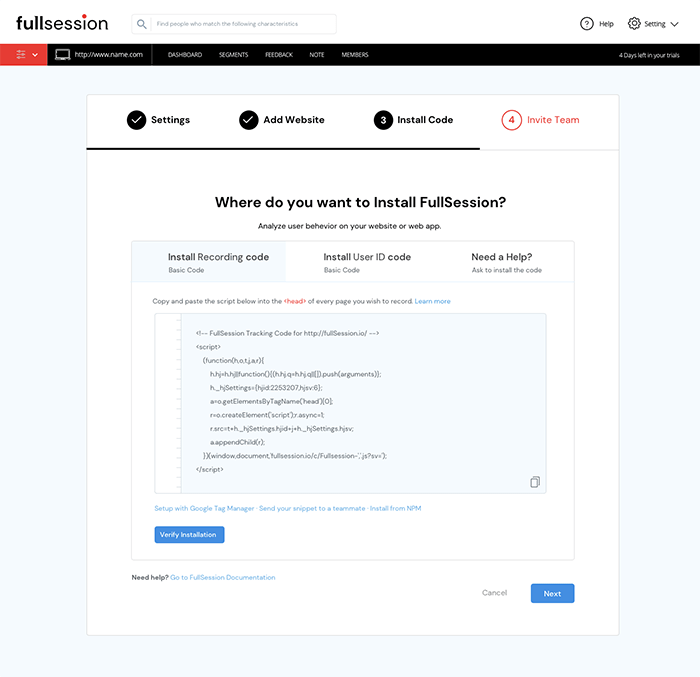
Once you have signed up, you’ll need to install the FullSession tracking code on your website. This code will allow FullSession to track and monitor user behavior and collect heatmap data.
Start collecting heat map data
You can start collecting data on user actions with the tracking code installed. FullSession will start tracking clicks, scrolls, and mouse movements in real-time, allowing you to see how users interact with your site.
Choose the type of heat map and a web page you want to analyze
FullSession provides several interactive heat maps, including click map, scroll map, and mouse tracking heatmaps. Choose the type of heat map best for your needs and select the website pages you want to evaluate.
Explore complex data in an easy way
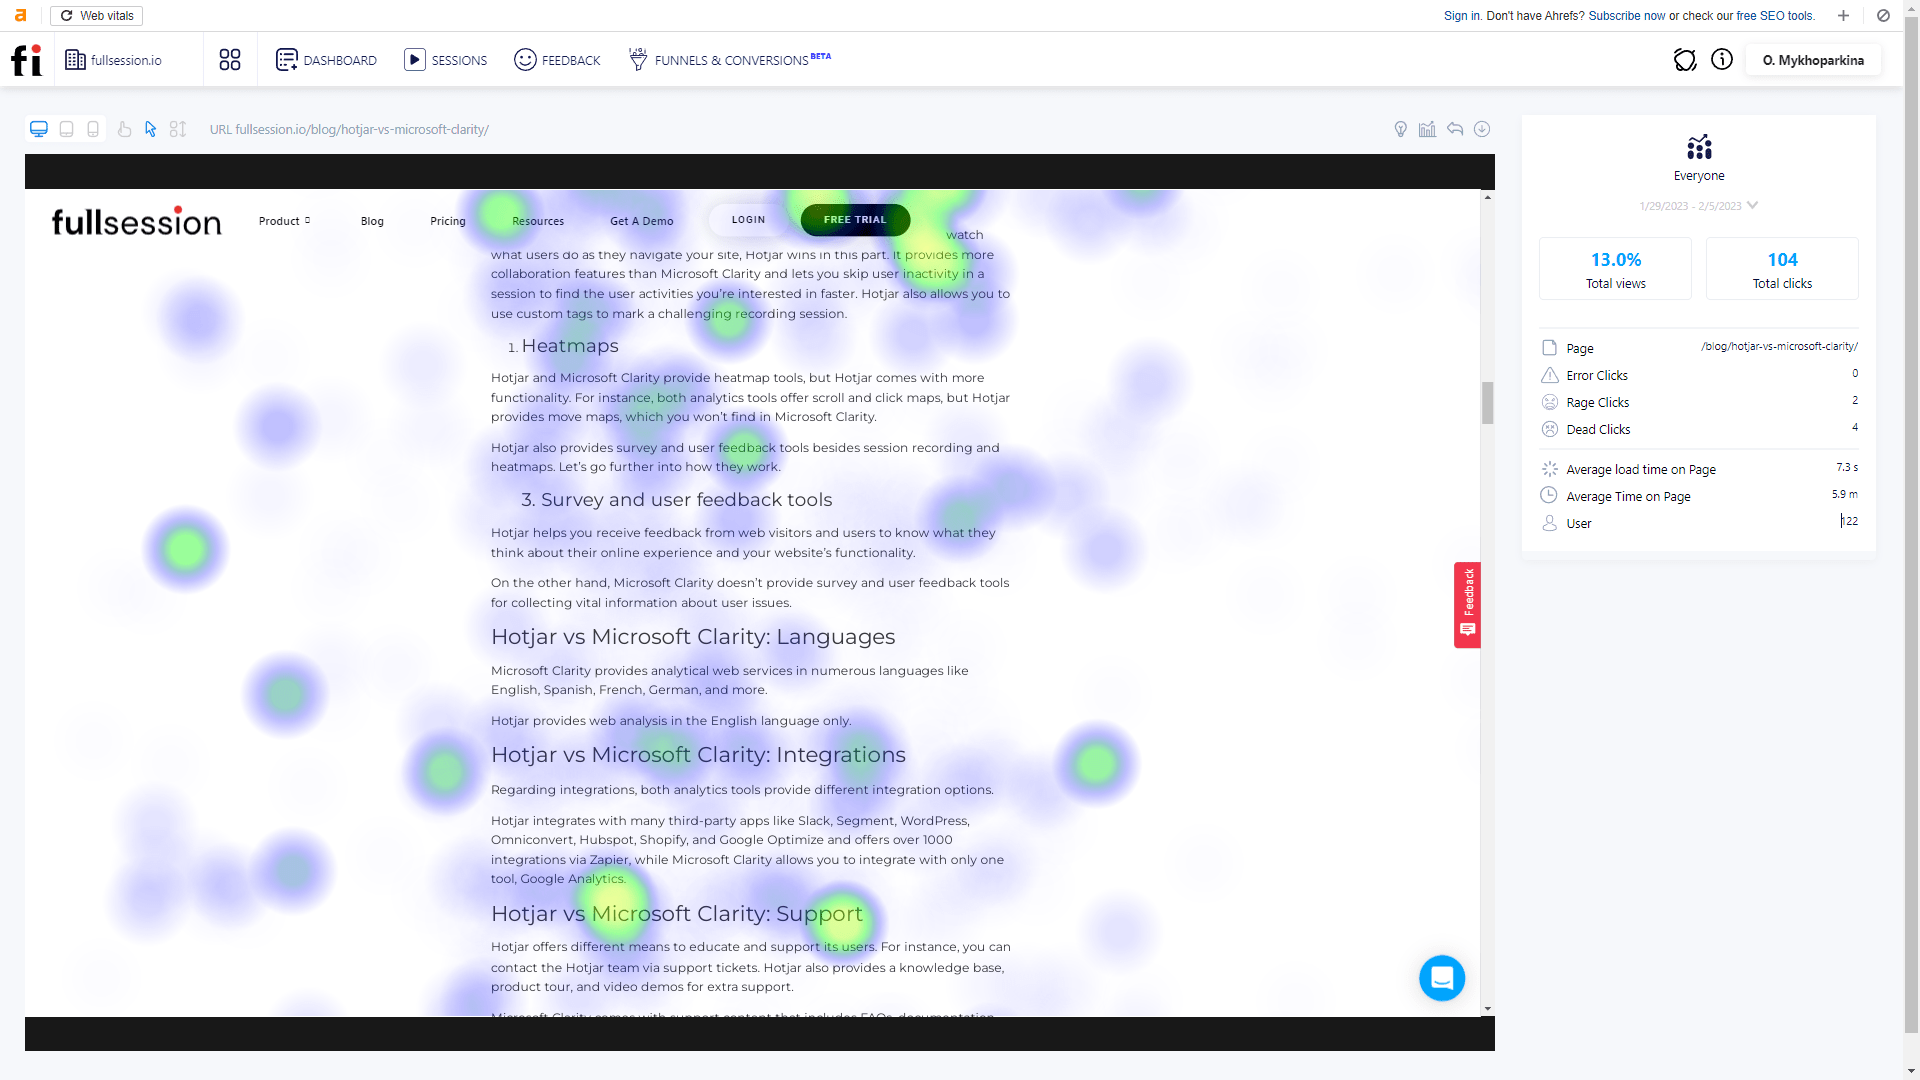
FullSession allows you to monitor key metrics such as the number of total views, clicks, average page load time, and average time spent on a page.
Additionally, FullSession can detect and alert you to negative user behaviors, such as errors, rage clicks, or dead clicks, which can indicate dissatisfaction with your website or application.
FullSession heat map examples
FullSession provides several heat maps, each designed to give you a unique perspective on user behavior. Let’s briefly discuss each one.
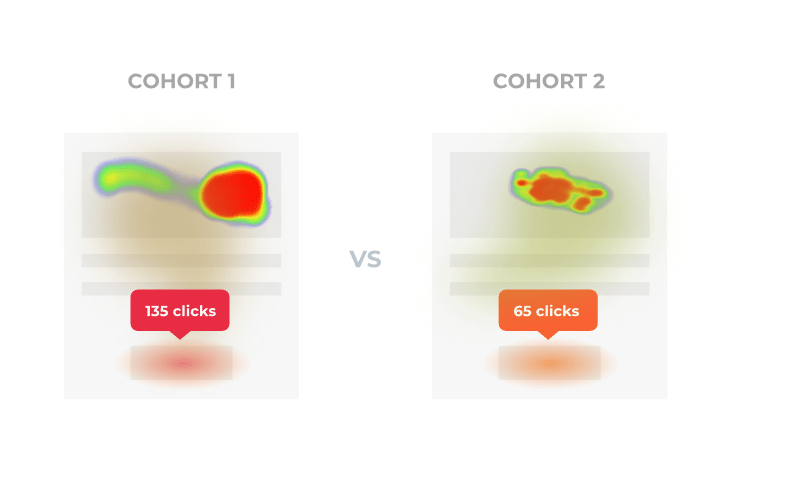
Click maps
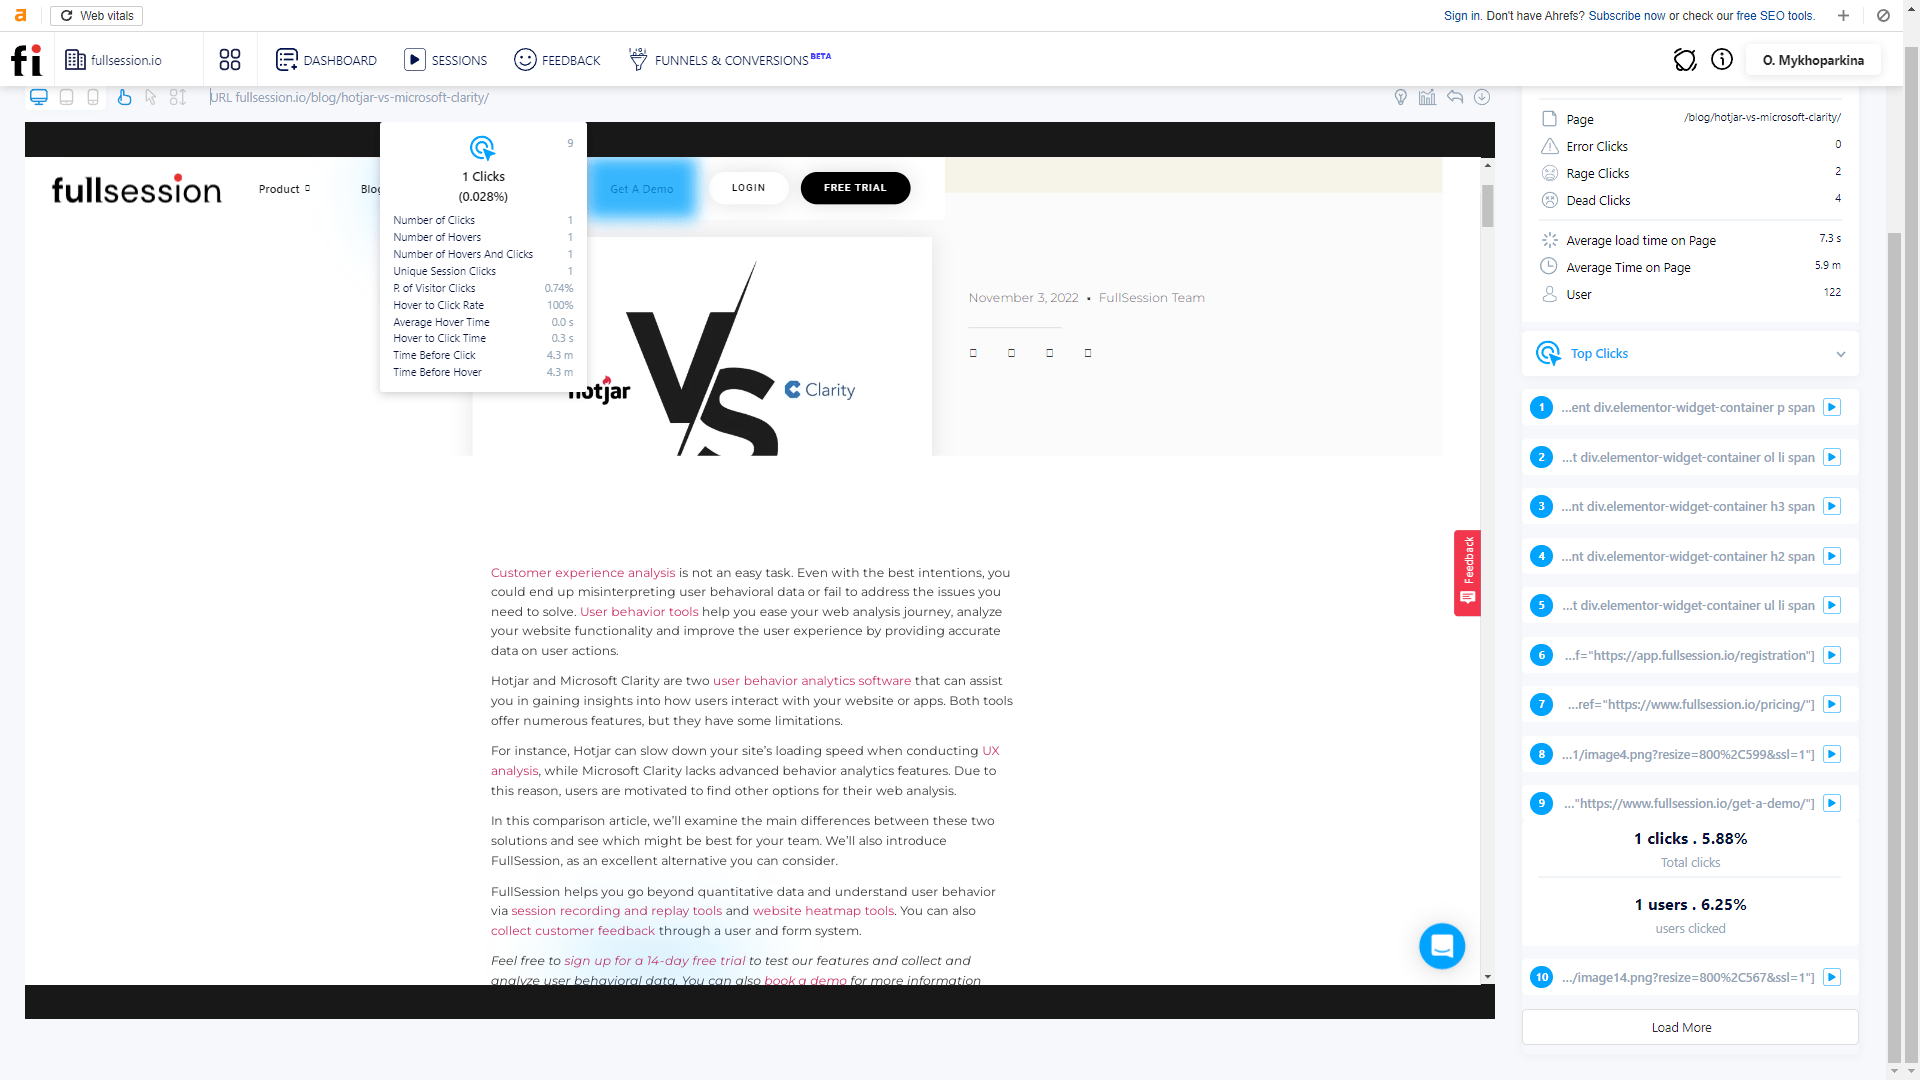
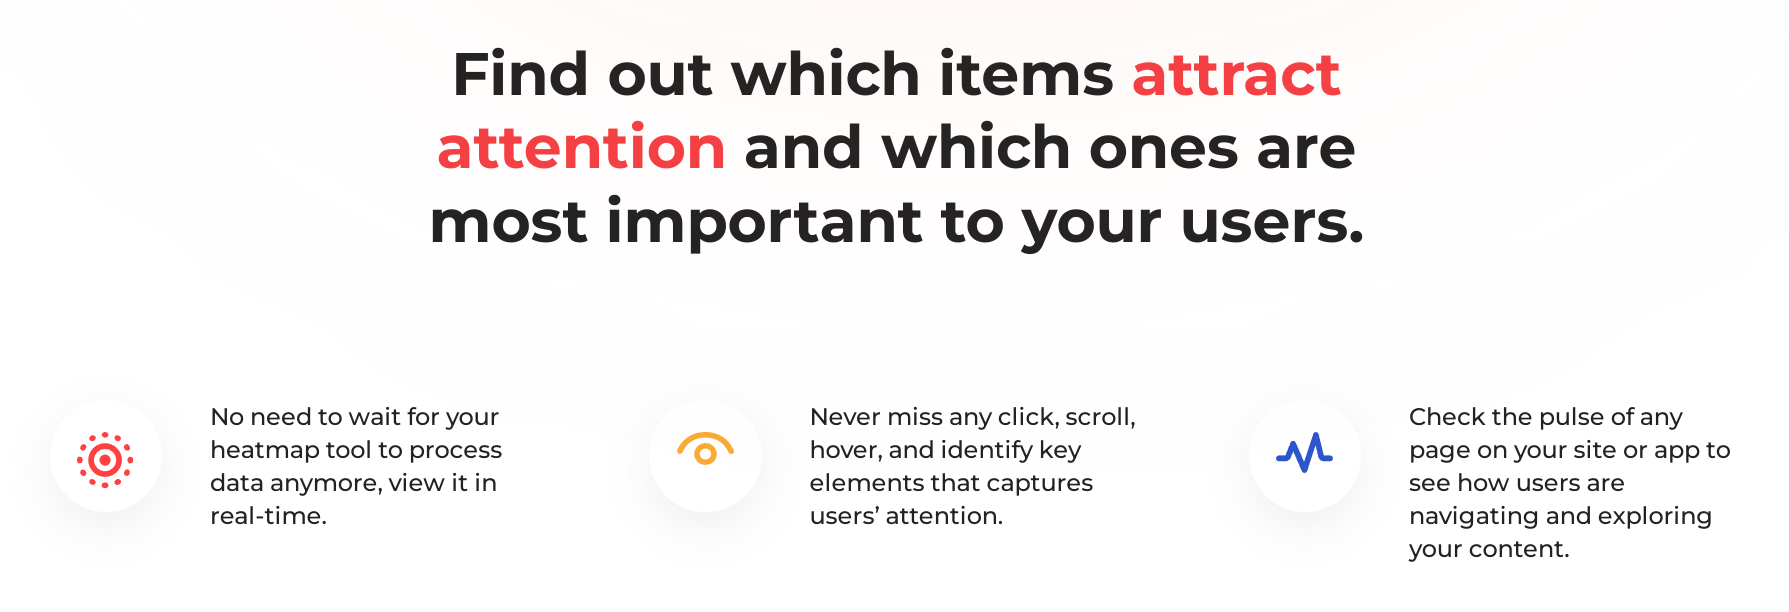
Click maps visually represent where users click on your site. Click tracking shows which elements of your site get the most clicks and which parts users ignore. You can learn about popular content, navigation patterns, and call-to-action effectiveness.
Scroll map
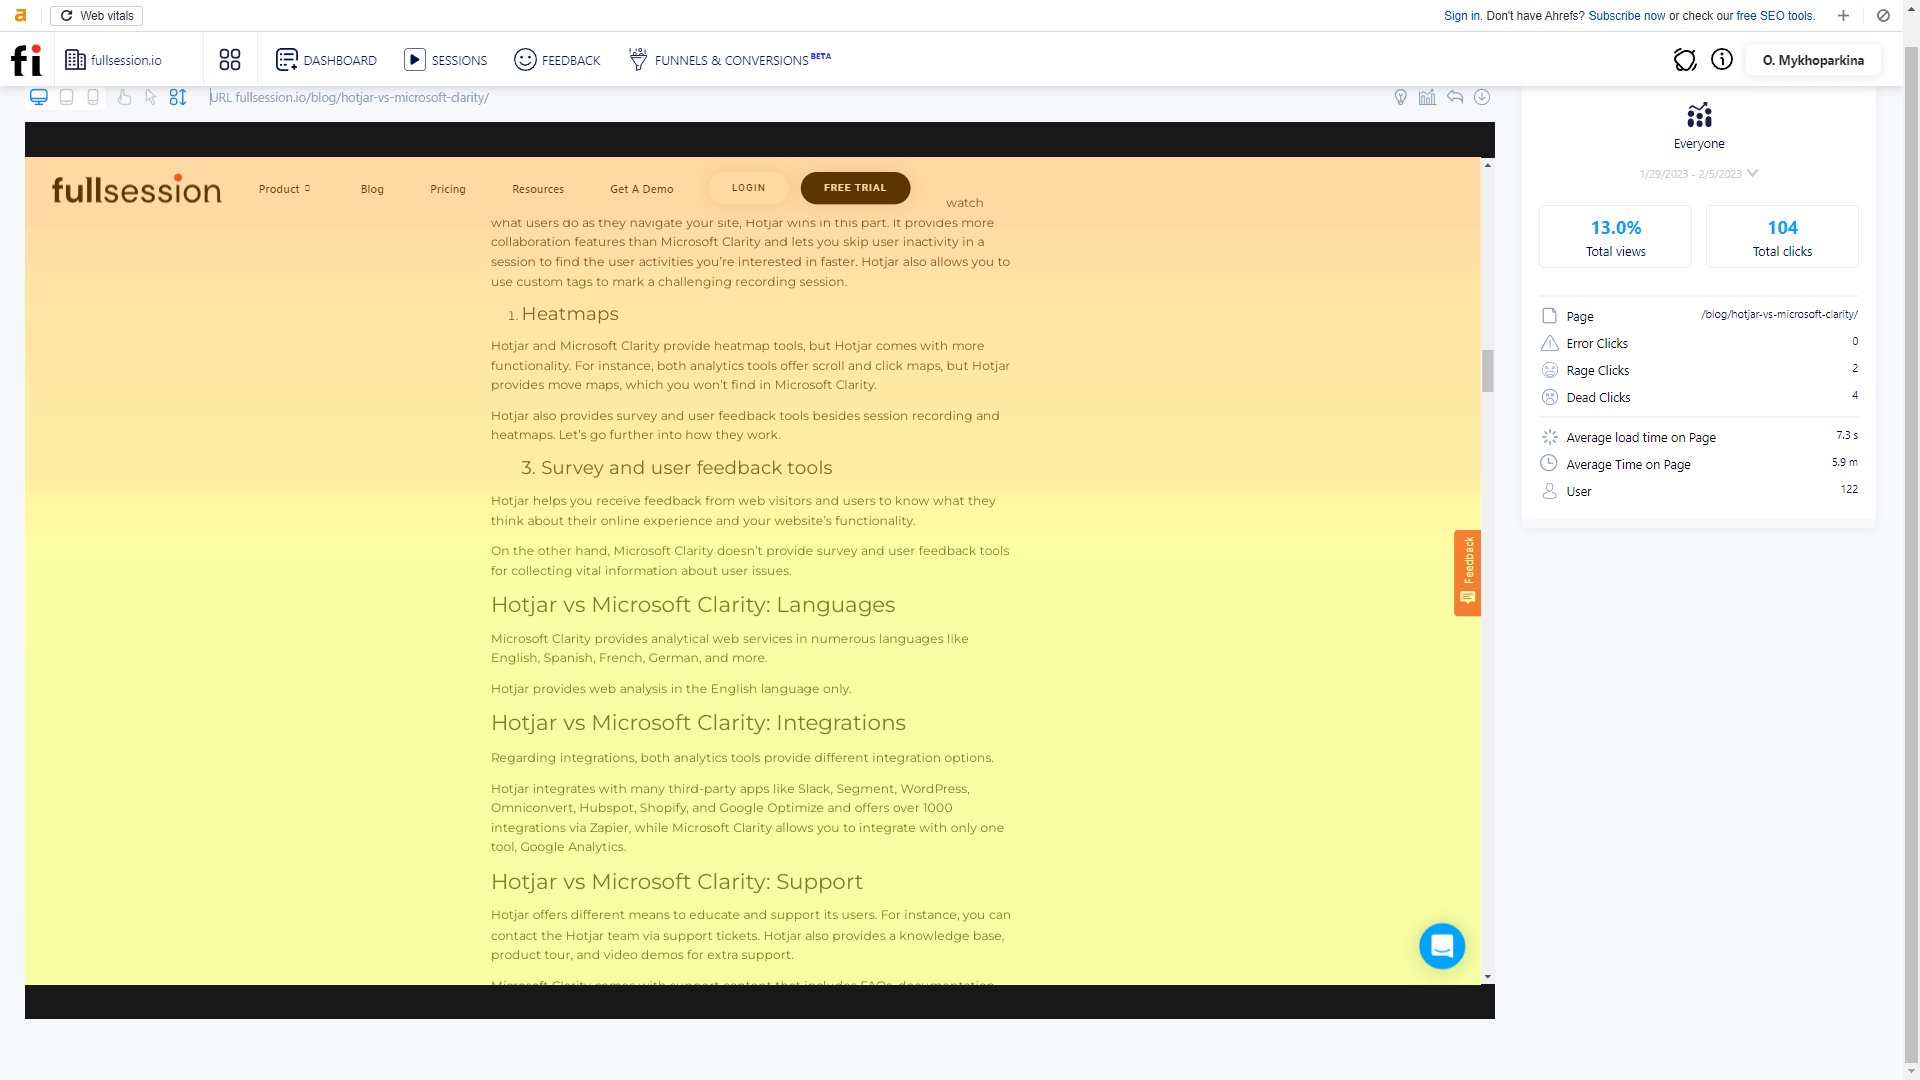
A scroll heat map shows how far down the page users scroll. This heat map provides insights into whether users are finding the information they need or abandoning the page early.
You can assess content engagement, optimize page length and monitor how different devices and screen sizes affect the user’s ability to view content on the page.
Mouse tracking heatmaps
A mouse movement heat map is a graphical representation of how users navigate your site. You can watch where users move their mouse and where they pause. You can identify patterns and areas of your site that are confusing or not user-friendly and make changes to improve the user experience.
How to use FullSession heat maps to make data-driven decisions
Heat maps are only useful if you know how to use them. Here are some tips for using data vizualization.
Identify key metrics to track
Before using heat maps, it’s essential to identify which metrics are most important to track. It will help you focus on the most relevant data to your website goals.
Set goals and targets
Once you have identified your key metrics, you should set goals and targets for your website. It will give you a clear idea of what you want to achieve with your heat map analysis.
Interpret the data
Once you have set your goals, you can start interpreting the data from your heat maps. Look for patterns and trends in user behavior, and pay close attention to areas of your site where user engagement is low.
Analyze user behavior
Analyze user behavior by examining the heat maps and other data you have collected. Identify areas of your site where users are struggling, and look for ways to improve the user experience.
Understand the context
It’s critical to understand the context in which user behavior occurs. For example, if a particular page on your site has a high bounce rate, consider what might be causing users to leave.
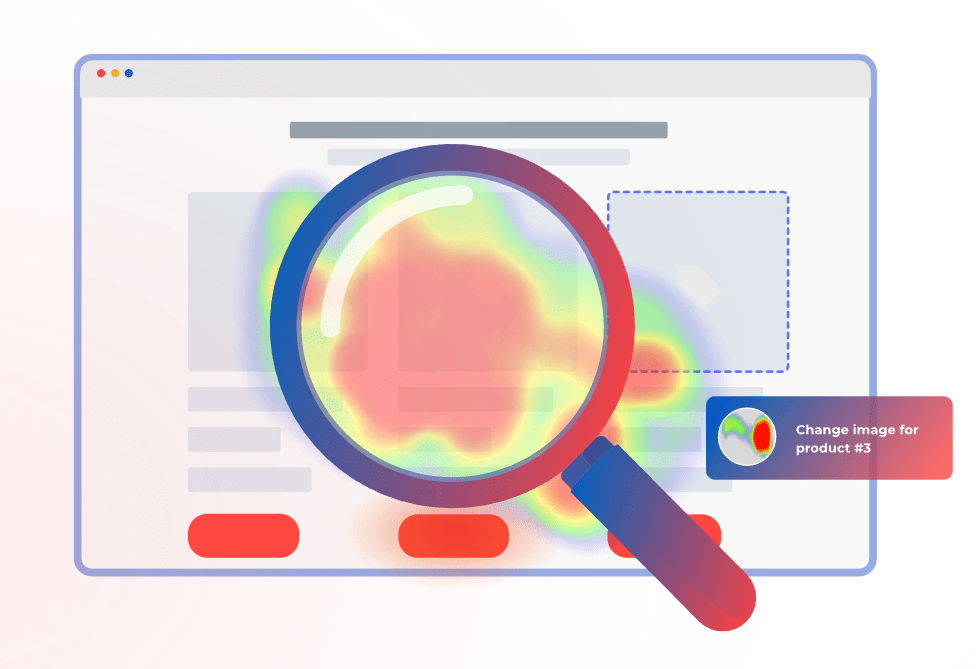
Identify problem areas
Once you have studied how users interact with your site and grasped the context in which they are using it, you can pinpoint the areas that cause problems or confusion. These could be sections that are challenging to navigate, difficult to use, or users cannot find what they are searching for.
Inform design changes
Using the insights from your heat maps, you can inform design changes to your site. Make changes that will improve the user experience and help achieve your goals.
Integrate heat maps with other web analytics tools
Heat maps are just one tool in your optimization toolkit. Integrating heat maps with other analytics tools, such as session recording and replays, conversion funnel tracking, website forms and customer feedback reports, will give you a complete picture of user behavior to make informed decisions.
Test solutions and track the results
Once you have made changes to your site, it’s essential to test your solutions and track the results. It will help you see the impact of your modifications and determine whether further optimization is necessary.
Repeat the process
Heat map analysis is an ongoing process. As you adjust your site and gather more data, you should repeat the process to ensure optimal customer satisfaction.
Will FullSession heat maps slow down your website?

Image source: Pexels
One of the common concerns among website owners is that using heat maps might slow down their website. However, with FullSession, you can rest assured that this will not be the case.
Our interactive heatmaps are lightweight and fast, ensuring they will not impact the performance of your website.
FullSession uses advanced technology to collect and process data in real time, allowing you to make data-driven decisions quickly and effectively.
The heat maps are rendered on demand, so they do not slow down your website while you are viewing them. Furthermore, FullSession only collects data from a sample of your website visitors, which helps to reduce the impact on your website performance.
You can be confident that FullSession heat maps will give you peace of mind while you use the tool to optimize your site.
Start optimizing your website with FullSession
Now that you understand the importance of heat maps and how to use FullSession to create them, it’s time to start optimizing your website.
From identifying critical metrics to tracking and setting goals and targets, FullSession makes it easy to analyze your data and make changes that will drive results.
Whether you’re looking to improve your conversion rate or increase user engagement, FullSession has all features you need to make your website successful.
So why wait? Start your free trial today, and see the results for yourself!
Mohamed oversees operations and finance at FullSession and has contributed to the company’s UX analytics knowledge base.