Category: E-commerce

  • Ecommerce CRO Audit: A Step-by-Step Guide (2026)

    Ecommerce CRO Audit: A Step-by-Step Guide (2026)

    Most ecommerce stores convert under 3% of visitors, yet traffic budgets keep growing. Your site gets thousands of sessions monthly, but sales aren’t keeping pace. The gap between traffic investment and revenue return keeps widening.

    A structured ecommerce CRO audit is the diagnostic process that separates guessing from fixing. It combines qualitative and quantitative data to pinpoint exactly where conversion leaks occur and how much revenue each one costs you. Think of it as user testing at scale: instead of assuming what breaks the experience, you watch real behavior and let the evidence direct your fixes.

    Instead of random hero image changes or checkout copy tweaks, you get a systematic review of every conversion step, from analytics setup to checkout completion, with clear prioritization for what to fix first.

    This guide covers data collection, quantitative analysis, qualitative research methods, and strategic prioritization. You’ll learn to combine funnel tracking with session replay evidence, audit critical pages systematically, and transform findings into revenue-generating improvements.

    Key Takeaway

    • Set up accurate funnel tracking before analyzing any conversion data
    • Combine quantitative drop-off analysis with qualitative session replay evidence
    • Audit product pages, checkout flow, and mobile performance systematically
    • Prioritize fixes using impact, effort, and confidence scoring
    • Build a quarterly audit cadence with weekly monitoring

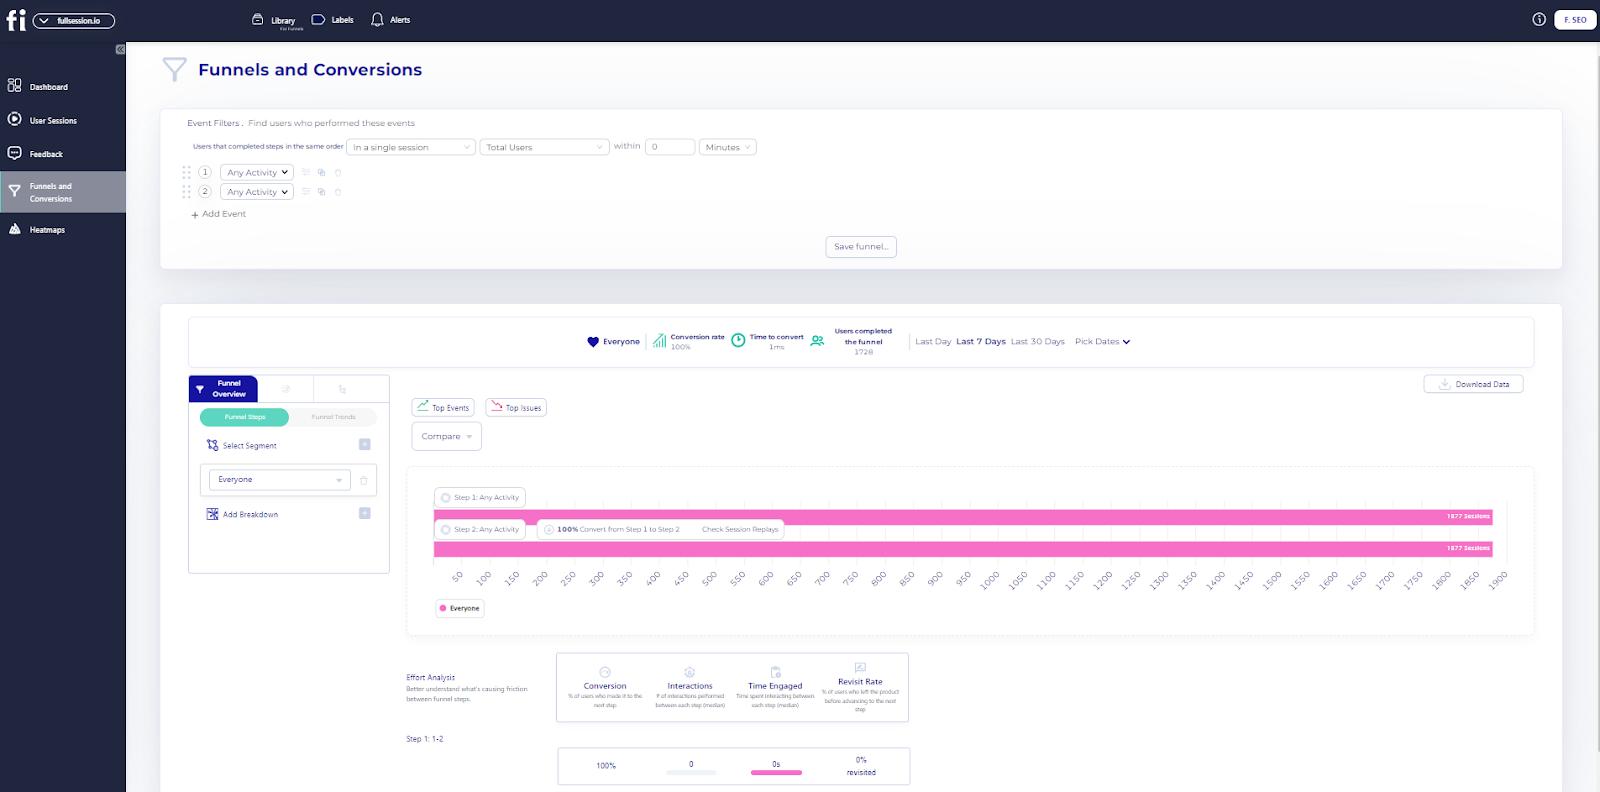
    FullSession provides the complete audit toolkit: funnel tracking shows where visitors drop off, session replay reveals why they abandon, and heatmaps uncover which elements drive or kill conversions.

    Teams using this integrated approach find and fix the specific friction points that random optimization misses.

    What Is an Ecommerce CRO Audit?
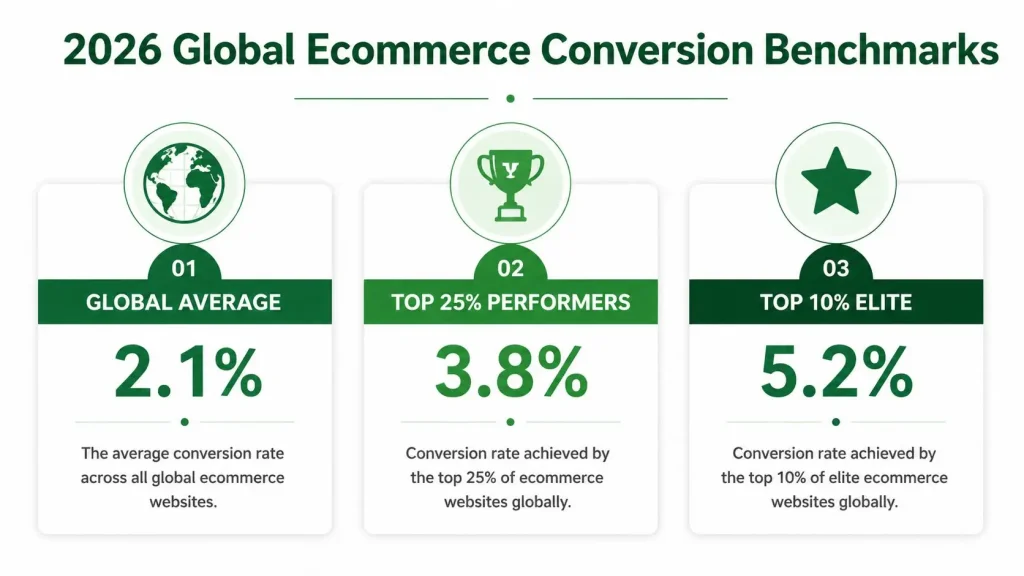
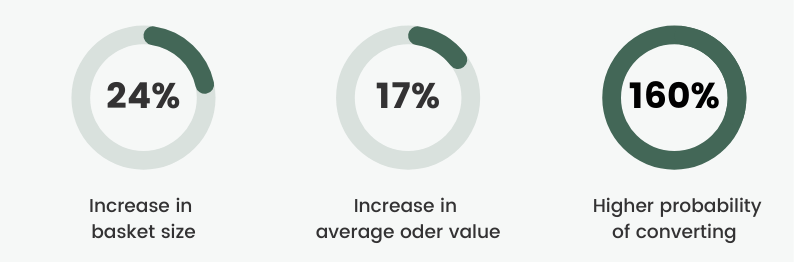
    Infographic showing 2026 global ecommerce conversion rate benchmarks and top performer statistics

    Image source: App Store Research

    An ecommerce CRO audit is a structured review of every stage of the customer journey, combining quantitative funnel analysis with qualitative user behavior research to identify exactly where visitors drop off and why they abandon purchases.

    The audit covers analytics setup verification, page-level conversion analysis, technical performance evaluation, and user behavior diagnosis. Unlike random optimization attempts, it provides a systematic methodology for finding and prioritizing the specific friction points that suppress revenue.

    Run an ecommerce CRO audit quarterly, before major redesigns, after significant traffic changes, or when conversion rates decline month-over-month. Checkout conversion benchmarks help contextualize your audit findings against industry performance.

    Why audits fail

    Most conversion audits produce generic recommendations because teams skip the foundation work. Broken analytics tracking leads to decisions based on incomplete data.

    Weak segmentation treats mobile checkout friction the same as desktop usability issues. Teams overreact to sitewide averages instead of isolating high-impact friction points.

    Without a systematic prioritization framework, audit findings become scattered to-do lists that never get implemented.

    Audit Metrics Defined

    Sitewide conversion rate: Total orders divided by total sessions across all traffic sources and pages.

    Cart-to-checkout rate: Sessions that reach checkout divided by sessions that add items to cart.

    Checkout completion rate: Completed orders divided by sessions that begin the checkout process.

    Step 1: Data Collection and Analytics Setup

    Before you deep dive into funnel reports or session replays, confirm that all your tracking fires correctly. “Garbage in, garbage out” applies directly here. Broken GA4 events create false funnel analysis and lead to fixing the wrong things.

    Many ecommerce brands make optimization decisions on broken GA4 data where events misfire, funnels are misconfigured, or key micro-conversions aren’t tracked. This leads to fixing the wrong friction points while missing actual revenue leaks.

    Analytics audit checklist

    1. Verify GA4 ecommerce events fire correctly: view_item, add_to_cart, begin_checkout, and purchase
    2. Check for duplicate sessions, missing page views, or unexplained traffic gaps in your funnel reports
    3. Confirm funnel step definitions match your actual customer journey stages
    4. Test ecommerce tracking on mobile devices and different browsers
    5. Validate that revenue attribution matches your actual order totals

    Look for missing micro-conversion events, bounce rate anomalies above 70%, and sessions without corresponding page view events. These signal tracking problems skew conversion analysis.

    Conversion funnel analysis in FullSession maps every step from the landing page to checkout completion, making it easy to confirm where actual drop-offs occur versus where tracking breaks result in false abandonment signals. The platform validates that funnel data matches real user behavior patterns.

    Transform Your Conversion Audit Process With FullSession

    Get the complete diagnostic toolkit to implement this audit framework effectively.

    Step 2: Quantitative Analysis and Conversion Rates

    Pull the hard numbers and compare them against industry standards for your product category. Without that benchmark context, your average conversion rates can look acceptable when they’re actually underperforming.

    Remember: not everyone who visits converts, and that’s expected. But the gap between how many website visitors you attract and how many buy tells you exactly how much room you have to grow.

    Segmented analysis reveals whether the problem is mobile performance, specific traffic sources, or particular product categories.

    Quantitative audit process

    1. Review the sitewide conversion rate vs industry benchmarks for your product category
    2. Segment conversion rates by device (mobile vs. desktop), traffic source, and top landing pages
    3. Calculate average order value impact: identify sessions that convert but with lower AOV than expected
    4. Map the customer journey from landing page to purchase completion
    5. Identify pages with high exit rates, especially in the checkout process

    Look for large mobile-to-desktop conversion rate gaps (mobile should not be less than 60% of desktop performance), specific pages with exit rates above 85%, and sessions that reach checkout but abandon before completion.

    DeviceBenchmark RangeTop 20% Performance
    Desktop2.2% – 3.1%Above 3.5%
    Mobile1.1% – 1.8%Above 2.3%
    Tablet1.8% – 2.4%Above 2.8%

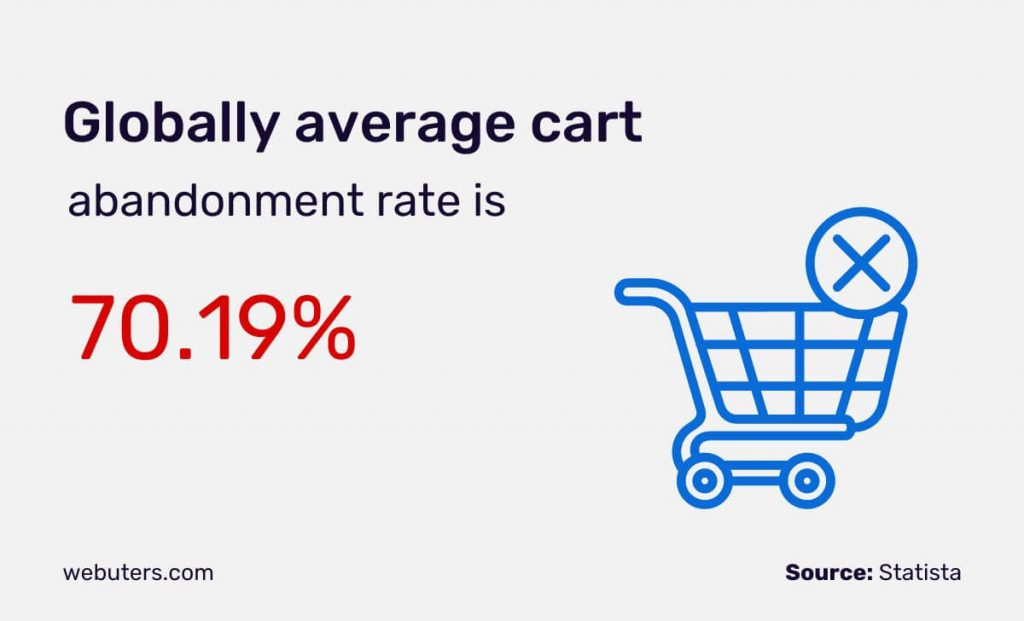
    According to Baymard Institute research, the global average cart abandonment rate is around 70%, but segmented analysis often reveals specific friction points affecting particular user groups disproportionately.

    Conversion funnel analysis provides drop-off data per step with direct click-through to watch affected sessions, connecting quantitative loss points to qualitative behavior evidence for faster diagnosis.

    Step 3: Qualitative Insights – Session Replay, Heatmaps, and Surveys

    Qualitative data closes the “why” gap that numbers alone can’t answer. A single browsing session recording can reveal a mobile validation error, a confusing layout, or a CTA that blends into the background. Things that no analytics report shows on its own.

    This is where UX analysis becomes essential: you’re not just counting drop-offs, you’re diagnosing the exact moment a user decides to leave.

    Session replay analysis
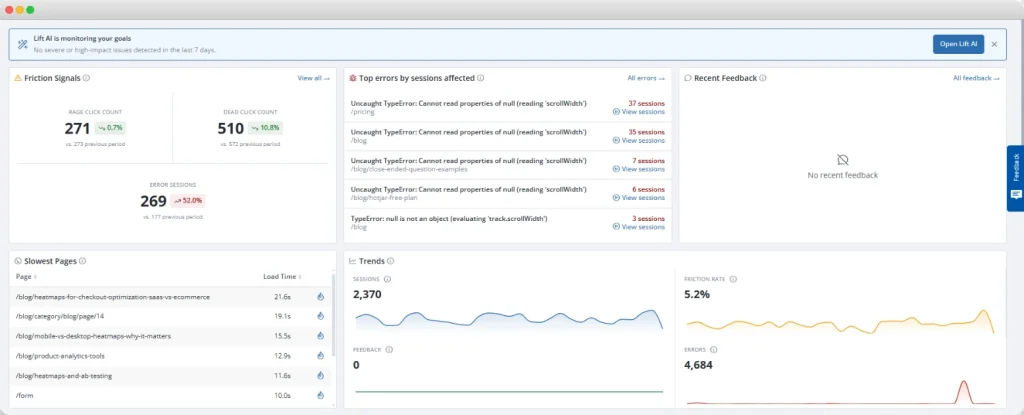
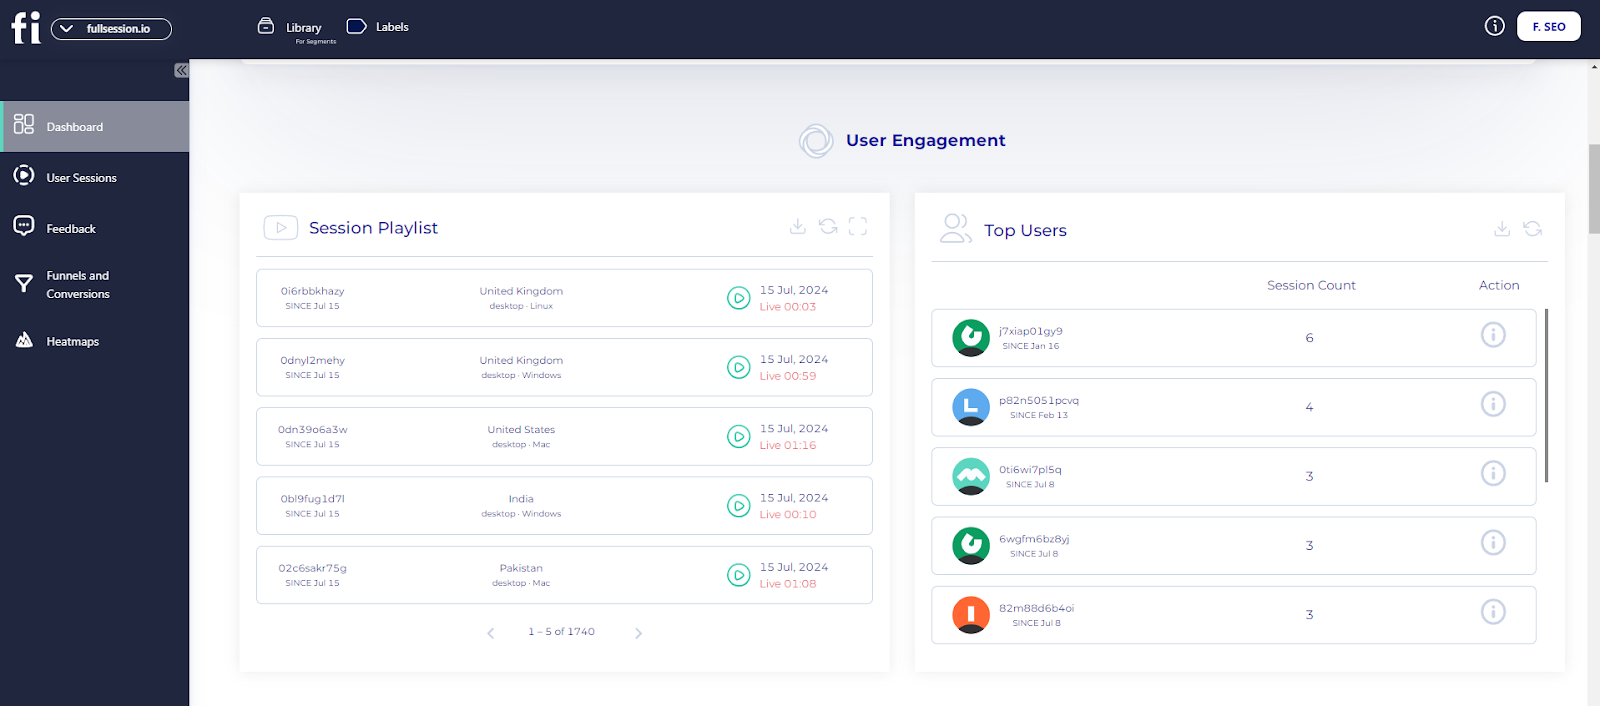
    Lift AI analytics dashboard displaying friction signals, error sessions, and website performance trends

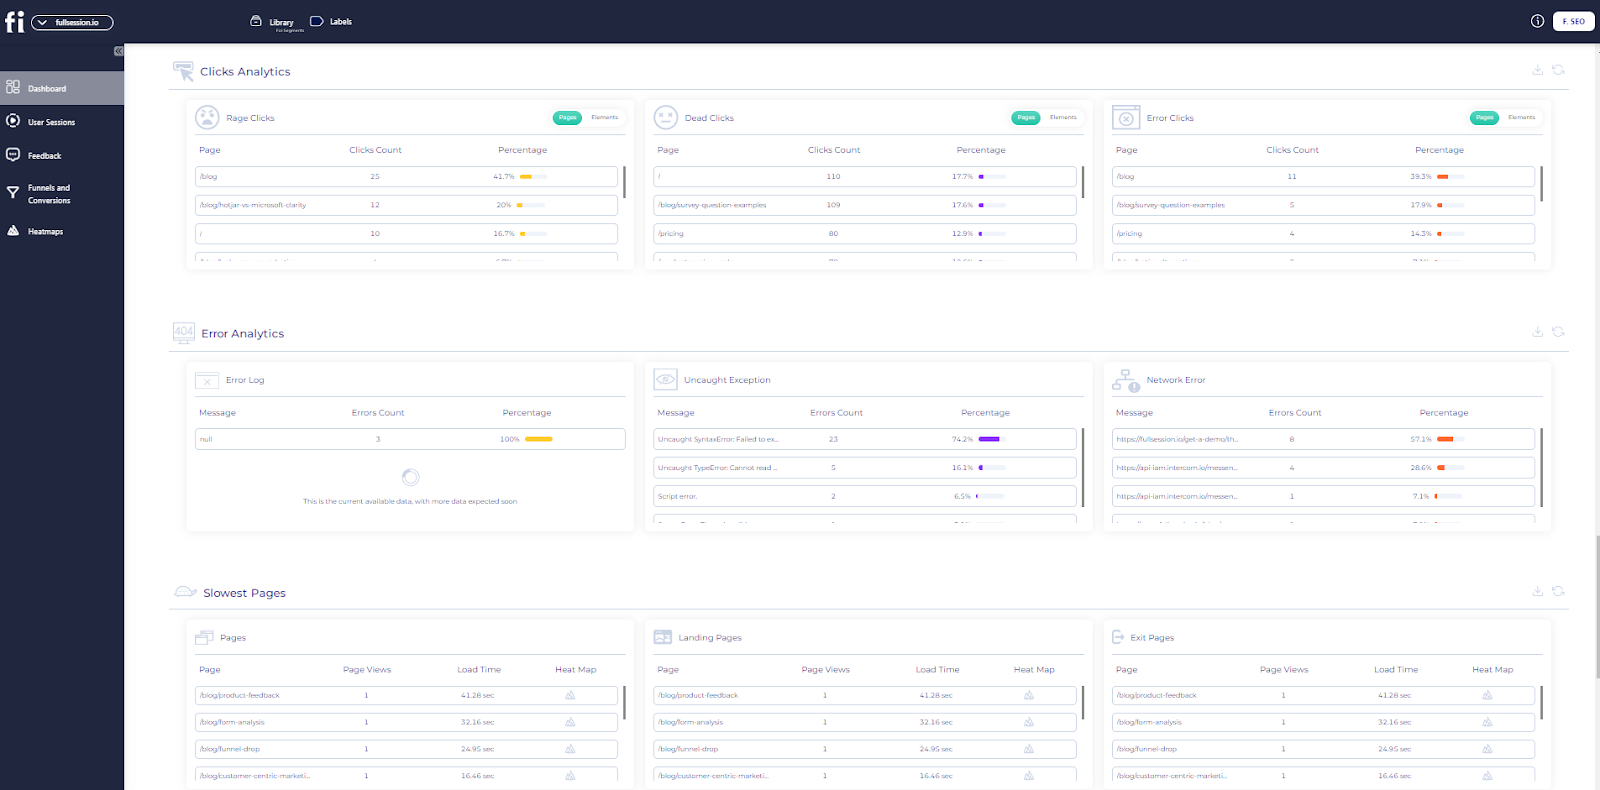
    Session replay captures pixel-perfect recordings of real users navigating your store. Watch actual shopping sessions to identify friction patterns that analytics cannot detect: hesitation before CTAs, rage clicks on non-functional elements, or scroll behavior indicating confusion.

    Focus on rage clicks (rapid repeated clicks indicating frustration), hesitation patterns before key CTAs, abandonment sequences on specific pages, and scroll depth on product pages. These signals reveal where many users encounter unexpected friction.

    Session replay in FullSession captures replays with automatic frustration signal detection including rage clicks and dead clicks, then links sessions directly to funnel drop-off points for immediate context.

    Heatmap analysis
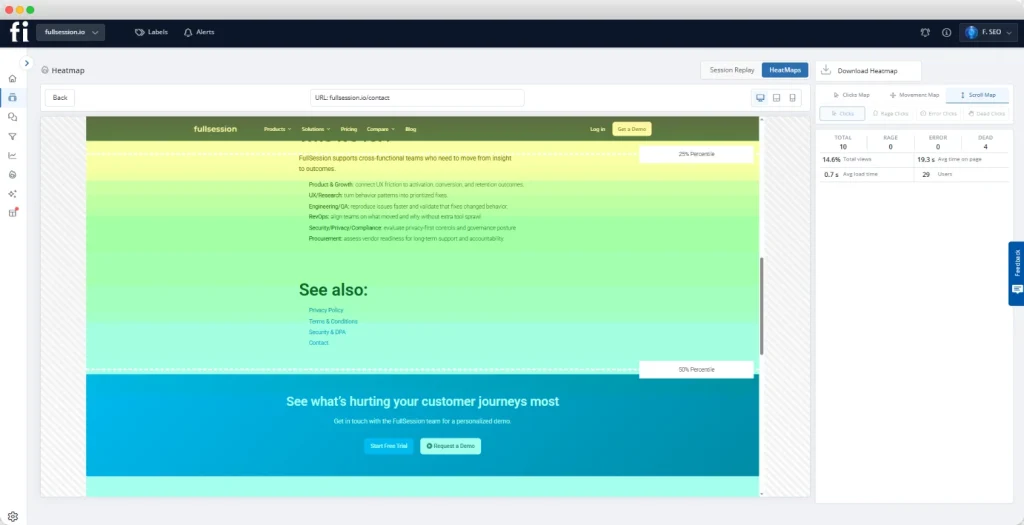
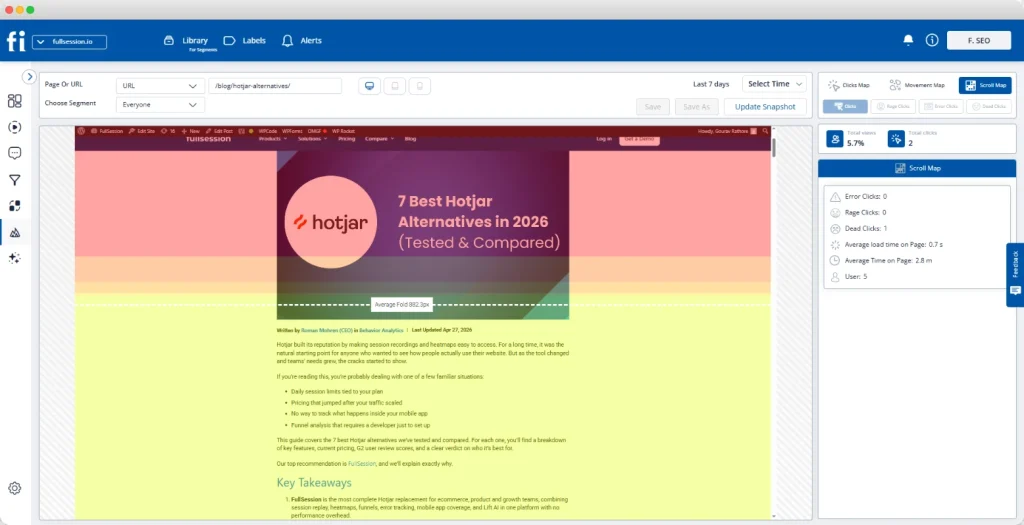
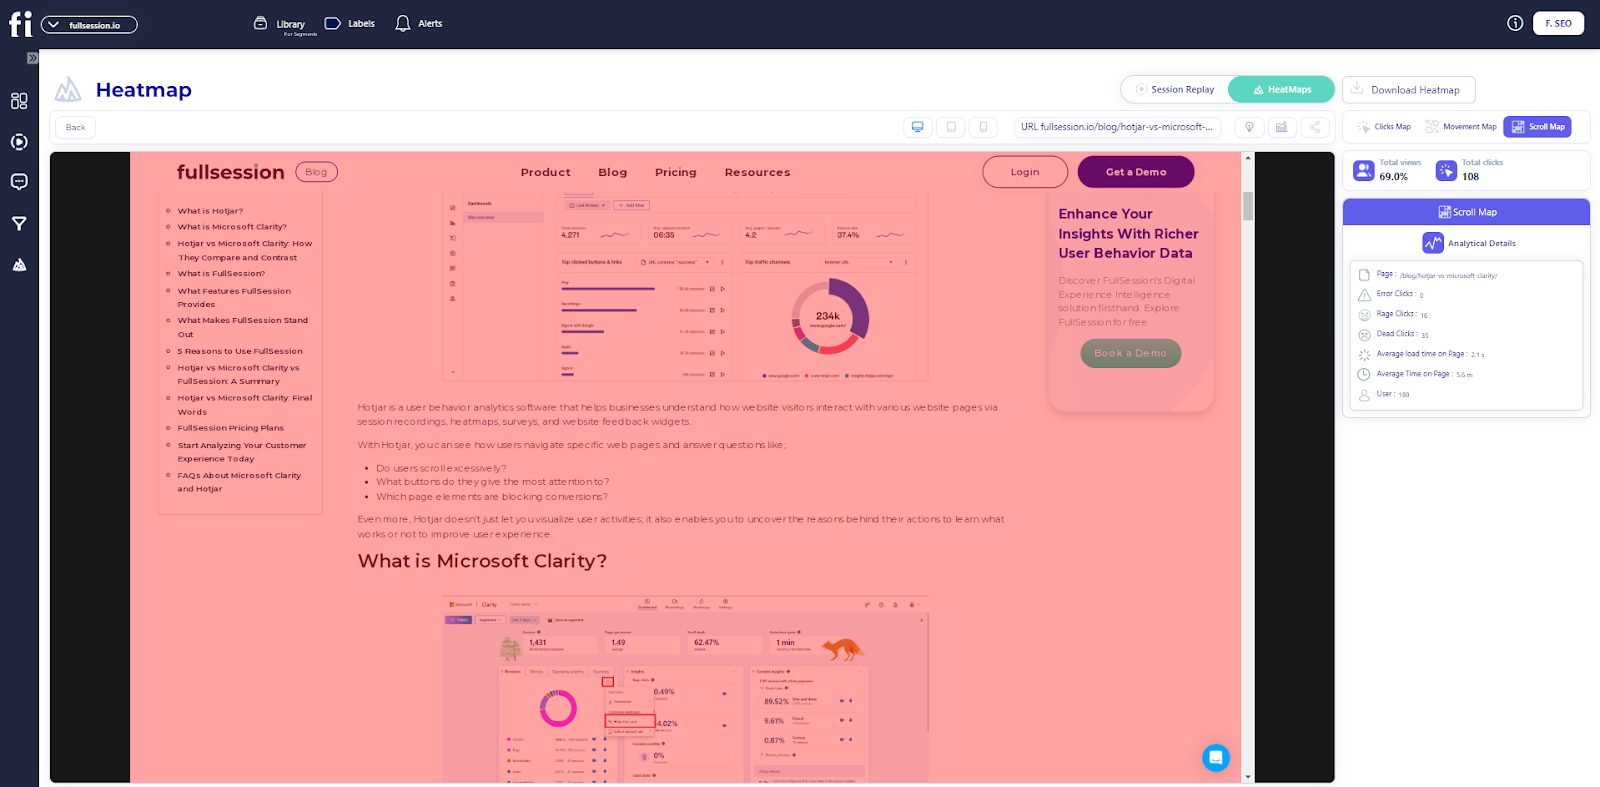
    FullSession heatmap dashboard showing user scroll behavior and engagement tracking on a website

    Click maps, scroll maps, and attention maps provide aggregate visual representations of visitor behavior across thousands of sessions. Heatmaps reveal patterns that individual session replay cannot: which elements consistently get ignored, where users scroll before abandoning, and whether CTAs are visible above the fold.

    Analyze clicks on non-clickable elements (indicating user expectations), CTA visibility below scroll fold, elements users consistently ignore versus engage with, and attention patterns around key conversion elements like product images and add-to-cart buttons.

    Interactive heatmaps in FullSession display click density, scroll depth, and attention across desktop and mobile devices without requiring separate tools or complex setup.

    Feedback and survey insights
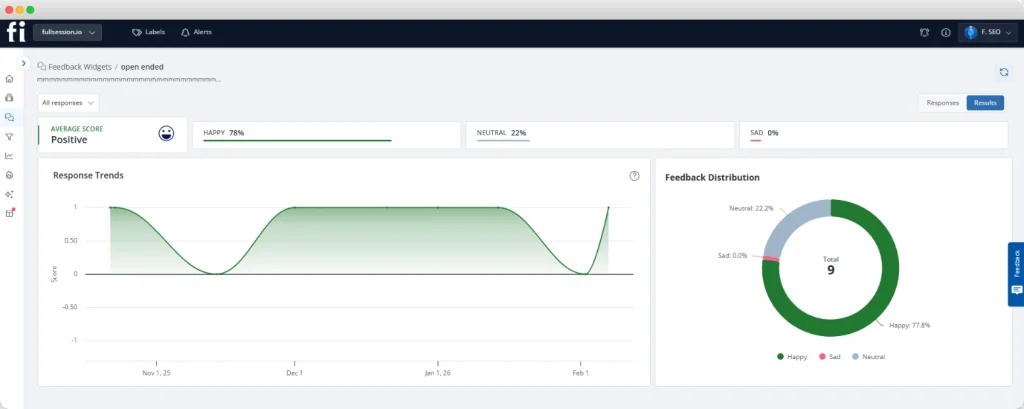
    Customer interviews, on-site surveys, and in-page feedback widgets provide intent context that session replay cannot capture. Users may hesitate before purchasing due to unclear return policies, shipping cost concerns, or product information gaps that behavior analysis alone will not reveal.

    Collect reasons for not purchasing, confusion about product information, unexpected shipping cost reactions, payment method preferences, and trust concerns about security or return policies.

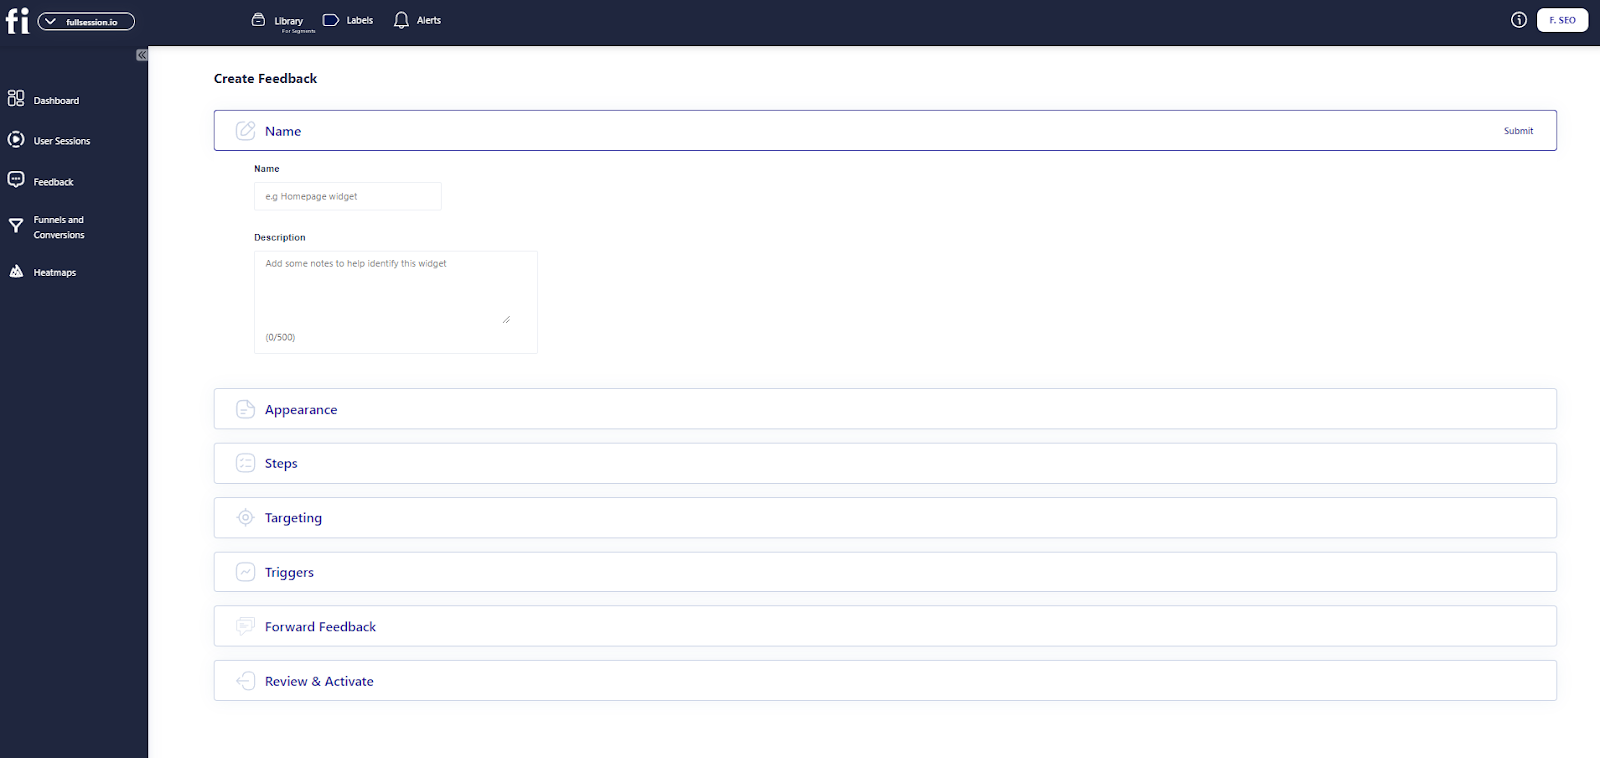
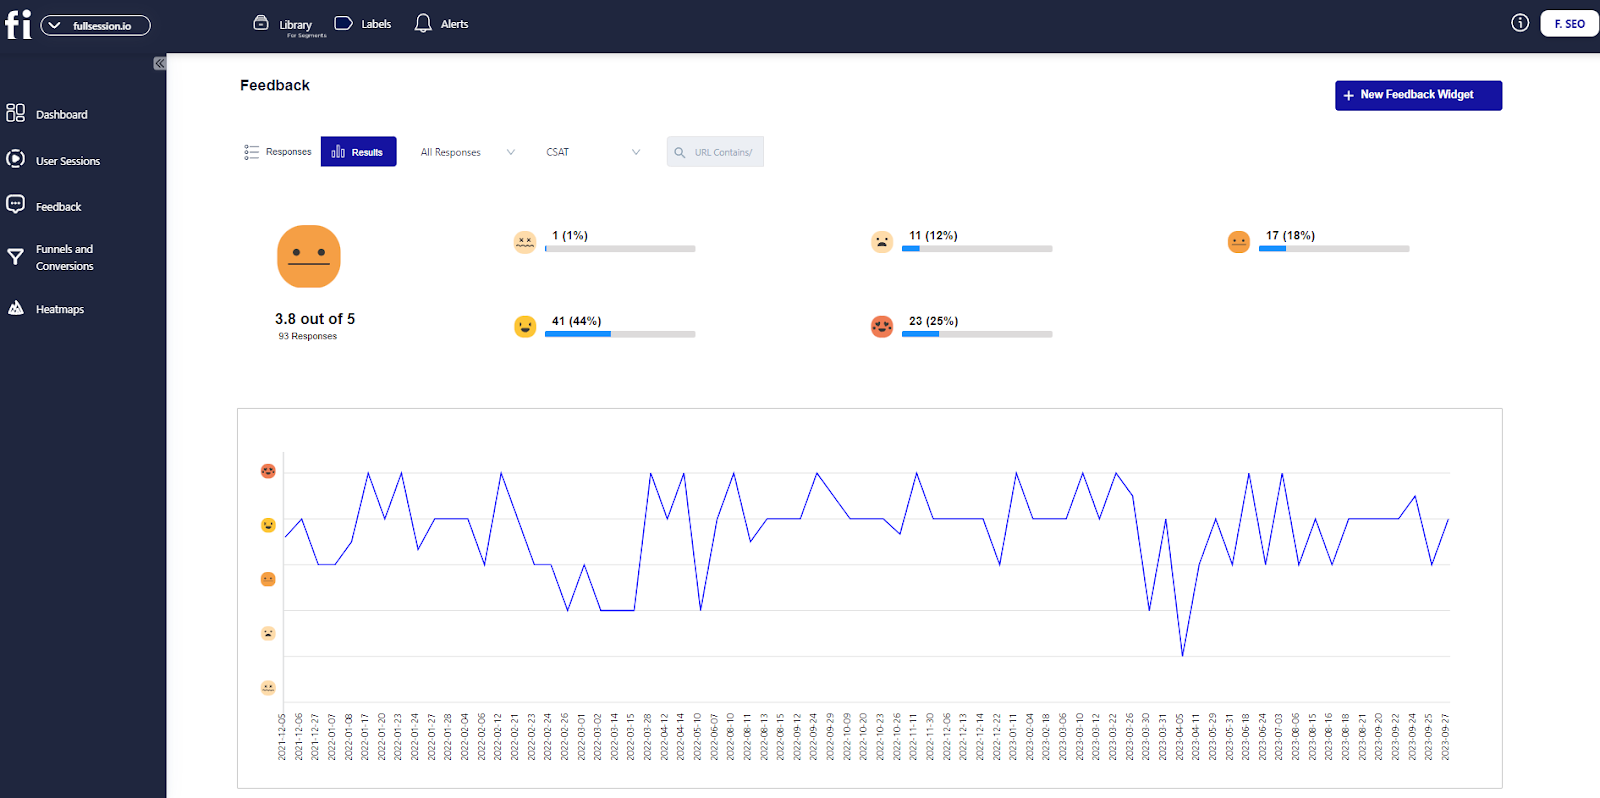
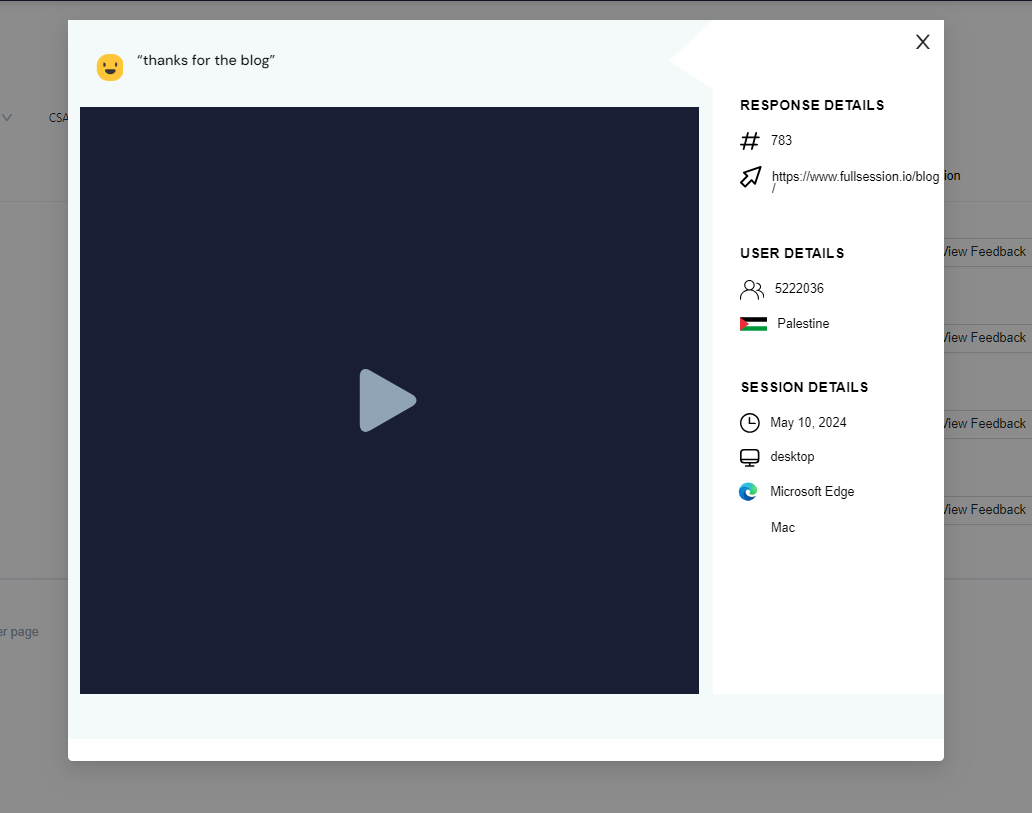
    Feedback tools in FullSession link in-page responses directly to session replays, so every piece of feedback includes behavioral context showing exactly what the user experienced before providing their response.

    Start Your Free Trial With FullSession

    See exactly where your visitors drop off and why with FullSession’s complete audit toolkit.

    Step 4: Product Pages Audit

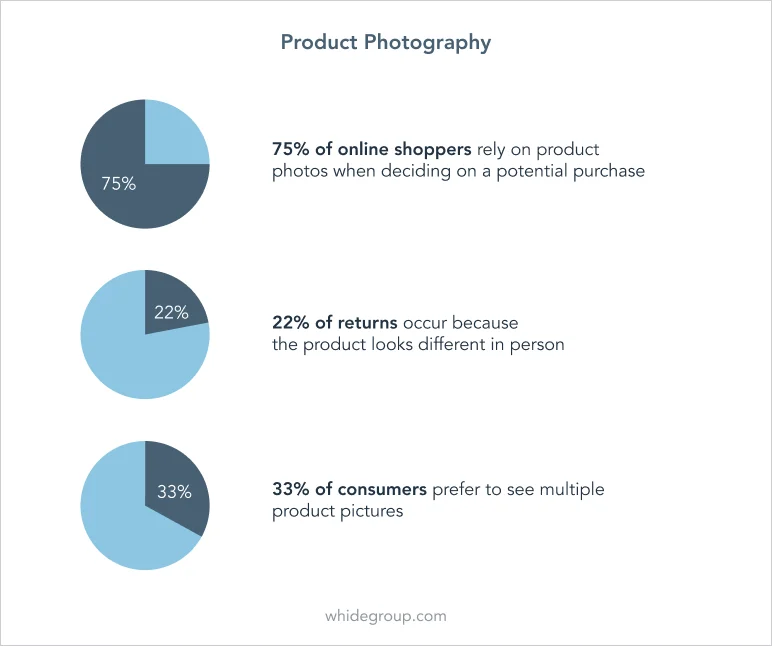
    Product pages are where most ecommerce conversions are won or lost. High-quality images directly affect perceived value. A blurry or low-resolution photo signals a low-quality product, regardless of what the description says.

    Fixing image presentation is one of the fastest ways to improve conversions without touching a single line of checkout code.

    A product page converting at 1.2% versus 2.8% for similar products indicates specific friction: missing product information, unclear pricing, or weak social proof. These gaps compound throughout the entire funnel.

    Product page audit checklist

    • Assess image quality, quantity, and zoom functionality. Product images should load quickly and show key product details
    • Check product descriptions for specificity and benefit clarity rather than generic feature lists
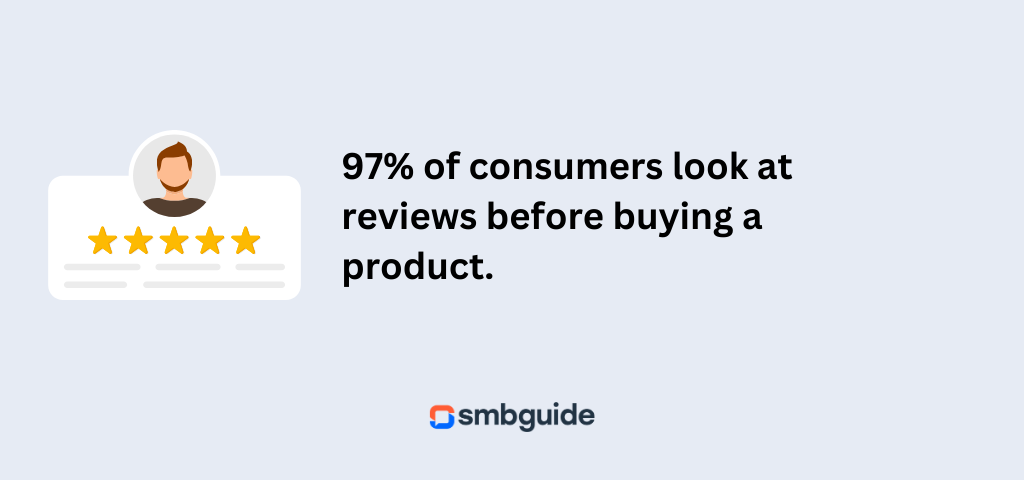
    • Evaluate social proof elements: reviews, ratings, user-generated content, and trust badges
    • Identify missing trust signals: return policy, shipping information, security badges
    • Verify clear call-to-action visibility above the fold on both desktop and mobile
    • Test add-to-cart functionality across different browsers and devices

    Look for product images that are low-resolution or lack zoom capability, descriptions that list features without explaining benefits or use cases, missing or minimal reviews sections, and unclear add-to-cart CTAs that blend into page design.

    Heatmaps show whether users reach and engage with the add-to-cart button, while session replay reveals hesitation patterns before purchase decisions, indicating specific elements that create doubt or confusion.

    Step 5: Category Pages and Product Discovery

    Most users arrive at particular pages within your category structure rather than landing directly on a product, and must self-sort to find their target item. Poor discovery leads to high bounce rates before products are even viewed.

    Category page performance directly affects product page traffic. If users cannot filter effectively or product cards lack key information, they bounce before reaching product detail pages where conversions occur.

    Category page optimization audit

    • Test filter and sort functionality on both desktop and mobile devices
    • Check category-to-product click-through rates to identify underperforming product cards
    • Assess whether faceted navigation reduces friction or creates confusion
    • Verify product cards include essential information: price, ratings, availability, and key features
    • Test loading speed when filters are applied, or sort order changes

    Look for patterns where users land on category pages and leave without clicking any products, filters that break or load slowly on mobile devices, and product cards missing critical information like price, ratings, or availability status.

    Session replay on category pages shows scrolling patterns, filter interactions, and product selection behavior, while interactive heatmaps reveal which products consistently attract clicks and which are ignored despite prominent placement.

    Step 6: Homepage and Landing Pages

    Online ShoppinPerson holding a credit card while shopping online on an ecommerce websiteg Experience on Ecommerce Website

    Image source: Pexels

    Your homepage and top landing pages are the front door of your ecommerce site. Hero images and above-the-fold content determine whether visitors stay or bounce immediately. Poor value proposition or slow loading elements waste traffic spend and suppress overall conversion rates.

    Landing page performance affects all downstream conversion metrics. A homepage with 65% bounce rate forces the remaining 35% of traffic to convert at higher rates to maintain overall conversion targets, creating unnecessary pressure on product pages and checkout.

    Landing page audit priorities

    • Evaluate hero image relevance to search intent and loading speed across devices
    • Check headline clarity versus value proposition. Does it immediately communicate what you sell and why it matters?
    • Verify primary CTA prominence and positioning above the fold
    • Assess whether social proof, trust badges, or customer testimonials are visible above the fold
    • Test page load speed, especially for hero images and critical above-the-fold elements

    Look for hero images that load slowly or appear irrelevant to the search intent that brought users to the page, missing or weak CTAs that do not stand out visually, and the absence of trust signals above the fold that would encourage continued engagement.

    Interactive heatmaps reveal whether visitors scroll past the hero section and which CTAs generate clicks, while session replay shows drop-off patterns on landing pages segmented by specific traffic sources, revealing whether different campaigns require different landing page approaches.

    Step 7: Cart Abandonment and Checkout Audit

    This step diagnoses friction in the cart and checkout flow, where most recoverable revenue is lost. Not every visitor who adds to cart intends to complete checkout, but many who abandon do so because of friction you can remove.

    Usability testing on your checkout flow, especially across mobile devices, often shows form field issues, unclear error states, and unexpected costs that kill conversions at the final step.

    Cart page audit

    Cart abandonment often occurs before users even reach checkout. The cart page must communicate the total cost clearly and remove final hesitations about purchase completion.

    • Audit shipping cost transparency. Unexpected costs are the primary abandonment trigger, according to Baymard research on reducing cart abandonment
    • Check for trust badges and security signals prominently displayed on the cart page
    • Evaluate guest checkout availability. Forced account creation causes significant abandonment
    • Test cart functionality: quantity changes, item removal, and coupon code application

    Checkout flow audit

    The checkout process requires balancing information collection with friction minimization. Every additional field or step increases abandonment risk, but insufficient information creates completion errors.

    • Count form elements and eliminate unnecessary fields. Prioritize essential information only
    • Audit payment options to ensure preferred payment methods are available
    • Test error states: address validation failures, credit card errors, and promo code problems
    • Verify mobile checkout functionality, especially form field usability and button accessibility
    • Check checkout progress indicators and exit intent prevention

    Error tracking and alerts catch JavaScript errors and failed interactions in the checkout flow automatically, while session replay of checkout sessions shows exactly where users stall, rage-click, or abandon, providing specific evidence for checkout recovery optimization.

    Transform Your Checkout Process With FullSession

    Identify and fix the specific checkout friction points that cost you revenue.

    Step 8: Performance – Load Time and Technical Stability
    Core Web Vitals metrics infographic showing LCP, INP, and CLS performance thresholds

    Image source: Webskitters

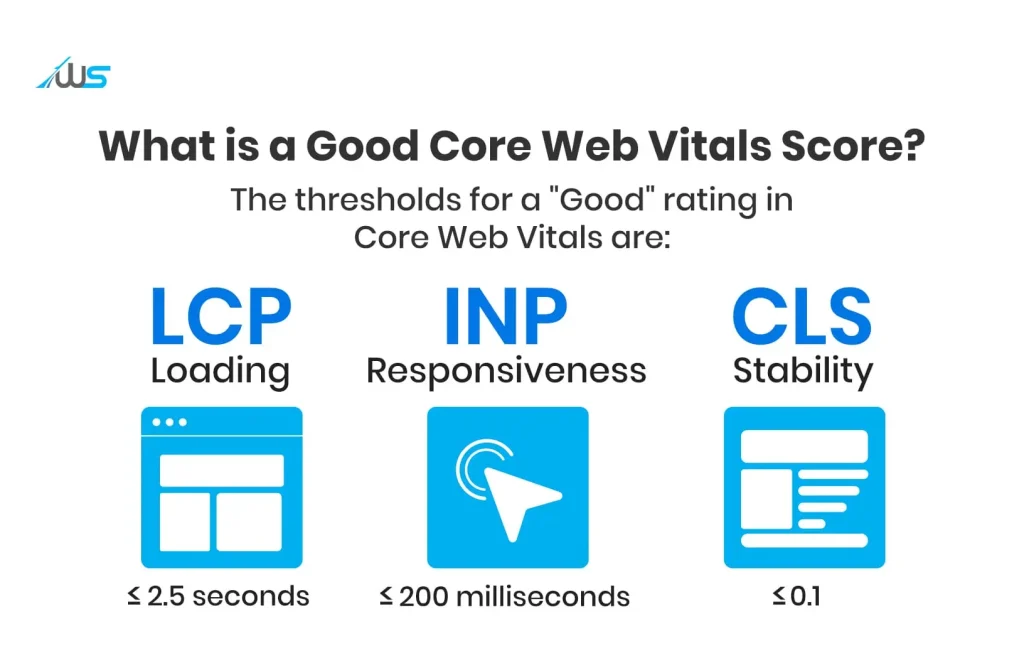
    Technical performance directly affects whether users stay long enough to convert. Run Google PageSpeed Insights on every key page and pay close attention to your Core Web Vitals scores.

    Cumulative layout shift, where page elements jump around as content loads, is a common culprit on product pages with heavy image assets. A quick win: compress images across your catalog before tackling more complex rendering or script issues.

    Technical performance affects both user experience and search engine rankings, influencing both traffic quality and conversion potential. Mobile performance issues are particularly critical since mobile traffic often represents 50-70% of ecommerce sessions.

    Technical audit priorities

    • Run Google PageSpeed Insights on key pages: homepage, product pages, category pages, cart, and checkout
    • Test mobile performance separately. Mobile connections and processing power create different optimization needs
    • Identify uncompressed images, render-blocking scripts, and layout shift issues
    • Check for broken forms, non-functional buttons, and JavaScript errors during checkout
    • Test site functionality across different browsers and devices

    Focus on pages with loading times above 3 seconds on mobile, layout shifts during page load where elements jump as images load, uncompressed product images, and render-blocking scripts that delay checkout page functionality.

    Quick performance wins include compressing product images, implementing lazy loading for below-the-fold content, and eliminating render-blocking resources on critical conversion pages.

    Error tracking and alerts show performance-related frustration signals automatically, while session replay shows sessions where slow loading correlates with abandonment, helping prioritize which performance optimizations provide the highest conversion impact.

    Mobile-specific performance checkpoints

    Mobile ecommerce friction patterns differ from desktop issues and require dedicated attention. Mobile checkout completion rates typically lag desktop performance due to form usability, touch interface problems, and connection variability.

    • Test tap targets for adequate size and spacing, especially on checkout forms
    • Check mobile form field behavior: auto-fill, validation messages, and input type optimization
    • Audit mobile checkout flow for unnecessary horizontal scrolling or zoom requirements
    • Test mobile-specific payment methods and ensure smooth integration

    FullSession’s mobile session replay captures device-specific behavior patterns and interaction issues that desktop testing cannot identify, showing exactly how mobile users navigate checkout forms and where touch interface problems occur.

    Step 9: Tests, Failed Tests, and Learnings

    Review your A/B testing history to understand what worked, what failed, and why. Most ecommerce brands run tests but fail to build a learning repository. Failed tests provide valuable insights if interpreted correctly, while undocumented wins cannot be replicated or built upon.

    Testing without systematic documentation leads to repeated mistakes and missed optimization opportunities. Teams often retest variations that previously failed or cannot explain why successful tests worked, limiting their ability to develop effective optimization strategies.

    Testing audit methodology

    1. List all tests run in the past 12 months with clear hypothesis documentation
    2. Document the result, confidence level, and statistical significance for each test
    3. Identify patterns in failed tests: common threads like wrong audience segments, insufficient traffic, or inconclusive results misinterpreted as positive
    4. Review winning tests for replication opportunities across other pages or elements
    5. Assess testing methodology: sample sizes, duration, and external factor contamination

    Look for tests launched without clear hypotheses, tests declared winners below statistical significance thresholds, no post-test documentation or follow-up validation, and repeated testing of similar variations without learning from previous results.

    Conversion funnel analysis shows whether conversion rates actually changed after test implementations, while session replay lets you verify how test variants actually rendered for real users, catching implementation problems that skew test results.

    Step 10: CRO Strategy, Prioritization, and Roadmap

    Lift AI analytics dashboard displaying friction signals, error sessions, and website performance trends

    Translate audit findings into a prioritized action plan rather than a scattered to-do list. Not all conversion blockers are equal. Teams with limited resources need a systematic scoring model to focus optimization efforts on fixes that deliver the highest revenue impact first.

    Without clear prioritization, teams often optimize low-impact elements while high-revenue friction points remain unaddressed. The result is busy optimization work that fails to move overall conversion metrics meaningfully.

    Impact scoring framework

    Score each identified issue using three criteria: impact (revenue at stake), effort (development cost and time), and confidence (evidence strength). Build a 90-day roadmap prioritizing high-impact, low-effort opportunities first, followed by high-impact, high-effort projects with strong evidence.

    PriorityImpactEffortConfidenceAction
    P0HighLowHighFix immediately
    P1HighMediumHighSchedule next sprint
    P2MediumLowHighQuick wins batch
    P3HighHighMediumRequires validation
    P4LowAnyAnyDefer or test

    Focus first on issues affecting high-traffic pages with clear evidence of friction: checkout errors causing abandonment, mobile form problems preventing completion, or product page elements that consistently get ignored despite prominent placement.

    FullSession’s Lift AI analyzes user behavior patterns to predict conversion impact and surface which issues to address first, reducing manual prioritization effort while improving accuracy of impact estimates. The platform connects behavior data to revenue potential, helping teams focus optimization resources on changes most likely to drive meaningful conversion improvements.

    Check out these ecommerce conversion optimization strategies for broader context on systematic optimization approaches that complement audit findings.

    Step 11: Measure, Report, and Iterate

    Implementing the post-audit governance layer ensures optimization becomes continuous rather than a one-time event. Without a systematic reporting and review cadence, audit findings decay quickly, and teams drift back to random optimization guessing.

    Establishing measurement protocols before implementing changes allows teams to validate impact and build on successful optimizations. Weekly monitoring catches new issues before they compound, while quarterly full audits ensure systematic review as traffic patterns and user behavior evolve.

    Ongoing audit cadence

    1. Set weekly conversion metrics review: key funnel step completion rates, top abandonment pages, and conversion rate trends
    2. Schedule quarterly full audits using this same methodology to catch new friction points and validate previous fixes
    3. Report changes in average order value, checkout completion rate, and sitewide conversion rate against pre-audit baselines
    4. Monitor for new error patterns, changing mobile behavior, and seasonal conversion variations

    Conversion funnel analysis dashboards provide always-on visibility into conversion rates per step, while error tracking and alerts notify teams automatically when new technical issues emerge between scheduled audits, maintaining conversion performance without constant manual monitoring.

    Repeatable Audit Checklist with FullSession

    Use our comprehensive checklist covering all 11 audit steps, designed for quarterly implementation and systematic optimization. Each item connects to specific FullSession features that provide the evidence needed for accurate diagnosis and prioritization.

    1. Analytics setup: Verify Google Analytics (GA4) ecommerce events and use conversion funnel analysis to validate tracking accuracy
    2. Quantitative analysis: Review conversion rate benchmarks and segment performance by device, traffic source, and landing page
    3. Qualitative research: Watch session replay of high-exit pages and analyze interactive heatmaps for engagement patterns
    4. Product page audit: Check image quality, description clarity, social proof, and add-to-cart button visibility
    5. Category page review: Test filter functionality and product card completeness across devices
    6. Landing page evaluation: Assess hero image relevance, value proposition clarity, and CTA prominence
    7. Checkout audit: Use error tracking and alerts to identify form problems and abandonment patterns
    8. Performance check: Test page speed and test mobile session replay for device-specific issues
    9. Testing review: Document all tests with results and replicate successful patterns
    10. Prioritization: Use Lift AI to score issues by impact and build 90-day roadmap
    11. Monitoring setup: Establish weekly metrics review and quarterly audit schedule

    This systematic approach ensures comprehensive coverage while connecting each audit step to specific diagnostic tools. Teams can implement the full framework quarterly or focus on specific sections when addressing targeted conversion problems.

    Conclusion About Ecommerce CRO Audit

    This 11-step ecommerce CRO audit framework provides a systematic approach to identifying and prioritizing conversion optimization opportunities. By combining quantitative funnel analysis with qualitative user behavior research, teams can diagnose specific friction points rather than guessing what might improve performance.

    Ecommerce brands that implement structured audit processes consistently outperform those making random optimization attempts. The framework connects data setup, behavior analysis, performance evaluation, and systematic prioritization into a repeatable process that scales with business growth and evolving user expectations.

    FullSession’s integrated platform supports every step of this audit methodology, from funnel tracking and session replay to heatmap analysis and error detection, providing the comprehensive diagnostic toolkit needed to transform audit findings into measurable conversion improvements.

    Ready to Audit Your Ecommerce Conversion Rate With FullSession?

    Start implementing this audit framework with FullSession’s complete diagnostic toolkit.

    Frequently Asked Questions

    Can a CRO be audited?

    Yes. A CRO audit reviews the performance of your conversion rate optimization program itself, checking whether your testing methodology, data tracking, and prioritization process are sound. Beyond auditing individual pages, it validates whether your CRO strategy is producing consistent, measurable results over time.

    What is a CRO in ecommerce?

    CRO in ecommerce refers to conversion rate optimization, the practice of increasing the percentage of visitors to your online store who complete a desired action, usually a purchase. It combines quantitative analysis of funnel data with qualitative research including session replay, heatmaps, and surveys to identify and remove friction from the customer journey.

    What is the ecommerce CRO checklist?

    An ecommerce CRO checklist is a structured set of audit items covering analytics setup, product pages, category pages, homepage, checkout flow, site performance, and testing methodology. The goal is to systematically review every stage of the conversion funnel and identify specific conversion blockers to fix.

    What does CRO audit mean?

    A CRO audit (Conversion Rate Optimization audit) is a comprehensive review of your ecommerce website to identify why visitors are not converting into customers. It examines your data setup, user behavior, page design, checkout flow, and performance to produce a prioritized list of improvements that can boost conversions.

  • How to Increase Revenue Per Visitor in Ecommerce Business

    How to Increase Revenue Per Visitor in Ecommerce Business

    More traffic does not automatically mean more revenue. If you’re running marketing campaigns, investing in SEO, and spending on paid ads, yet revenue stays flat, the problem probably isn’t your traffic volume. It’s what happens after visitors land on your site.

    Revenue per visitor (RPV) is the metric that exposes this gap. It tells you exactly how much your site earns every time a unique visitor arrives, and it’s a cleaner measure of site effectiveness than traffic counts or raw sales figures alone.

    This article explains how to increase revenue per visitor across all four key levers: traffic quality, conversion rate, average order value, and customer retention.

    You’ll get specific strategies for each stage of the buyer journey, a diagnostic workflow for prioritizing what to fix first, and a look at how FullSession’s Lift AI turns behavioral data into revenue-focused action.

    • Revenue per visitor (RPV) is the clearest measure of ecommerce efficiency because it combines conversion rate and average order value into one number that reflects real revenue impact.
    • Traffic alone does not solve revenue problems. Low-quality or mismatched traffic increases costs while keeping RPV flat or declining.
    • The biggest RPV gains come from fixing friction in the funnel, especially in discovery, product pages, and checkout, where intent is either lost or converted.
    • Raising average order value through bundles, cross-sells, and upsells is often faster and cheaper than acquiring new traffic.
    • Sustainable growth comes from improving multiple levers together: conversion rate, order value, retention, and traffic quality, not in isolation.

    FullSession helps ecommerce teams increase revenue per visitor by identifying which sessions, devices, campaigns, and checkout steps are pulling RPV down.

    Instead of guessing what to fix, your team gets a ranked list of opportunities backed by real user sessions and revenue-impact estimates.

    Book a demo to see how it works.

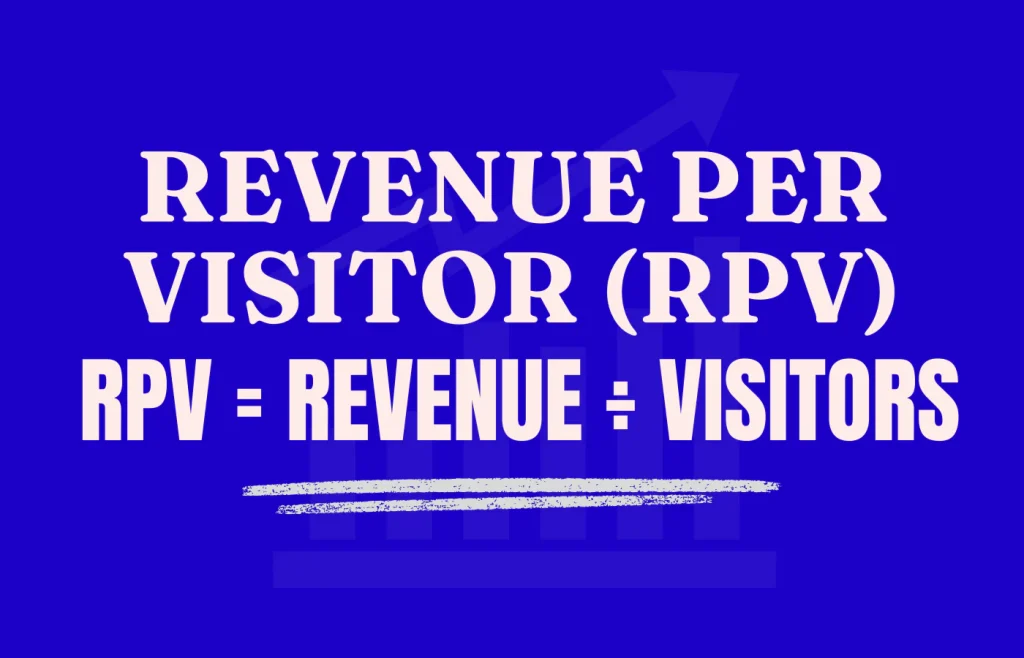
    Graphic explaining Revenue Per Visitor (RPV) with the formula Revenue divided by Visitors and an upward growth chart background.

    Image source: The Revenue Systems Lab

    Revenue per visitor is the average revenue your store generates each time a unique visitor arrives. Use only unique visitors, not sessions or page views, so each individual person is counted once.

    RPV = Total Revenue / Total Unique Visitors

    A store that earns $50,000 from 10,000 unique visitors has an RPV of $5.00. That single number tells you more about site effectiveness than either traffic counts or raw sales figures alone.

    The reason RPV matters more than most metrics is that it captures two things at once: how many visitors convert, and how much they spend when they do.

    A boost to either one lifts RPV. A drop in either shows up immediately.

    Revenue per visitor formula: Two ways to calculate it

    RPV can be calculated in two useful ways.

    The first is the raw formula:

    RPV = Total Revenue / Total Unique Visitors

    This tells you how much revenue each unique visitor generates on average.

    The second makes the strategy clearer:

    RPV = Conversion Rate × Average Order Value

    This version shows the two direct levers that move RPV. Your revenue per visitor rises when more visitors buy, when each buyer spends more, or when both improve together.

    Here’s what that looks like in practice, using a simple example:

    ScenarioVisitorsConversion RateAOVRPV
    Baseline10,0002.0%$75$1.50
    Checkout fix10,0002.4%$75$1.80
    Checkout fix + bundles10,0002.4%$85$2.04

    The table makes one thing obvious: small, targeted fixes compound quickly. A checkout improvement and a bundling strategy together raise RPV by 36% without adding a single new visitor.

    Most companies track conversion rate and average order value as separate metrics, which is useful. But watching them in isolation means you can miss the bigger picture.

    A promotion might lift conversion rate while dropping average spend per transaction. RPV catches that trade-off in one number, making it a cleaner signal of overall site health. This is the gap many businesses miss when they optimize conversion rate and AOV separately.

    RPV also matters because acquisition is expensive.

    If your RPV is $2.00 and you spend $3.00 per visitor on ads, you’re losing money on every click. The faster path to profit is increasing what your existing traffic is worth, not scaling new visitor acquisition efforts that compound a leaky funnel.

    RPV is not a replacement for other metrics. It’s the number that connects them.

    Here’s how it compares to the metrics ecommerce teams track most often:

    • Conversion rate tells you the percentage of visitors who buy. RPV tells you how much money those conversions actually generate.
    • Average order value (AOV) tells you what each buyer spends. RPV shows what each visitor is worth, including those who don’t buy.
    • Revenue per session counts all sessions, including return visits from the same person. RPV uses unique visitors, making it a purer measure of individual visitor value.
    • Customer lifetime value (CLV) measures total revenue across all purchases. RPV measures a single visit’s revenue contribution.
    • Customer acquisition cost (CAC) measures what you spend to get a visitor. Comparing CAC to RPV tells you immediately whether a channel is profitable.

    Tracking RPV alongside conversion rate and AOV gives you the full picture. RPV is the outcome; the other two are the inputs.

    Before you can fix RPV, you need to know why it dropped. The symptoms are often obvious. The cause usually isn’t.

    SymptomLikely CauseWhat to Check
    Traffic up, revenue flatLow-intent acquisitionRPV by traffic channel and campaign
    Add-to-cart strong, checkout weakCheckout frictionFunnel drop-off and session replay
    Mobile RPV below desktopMobile UX issueMobile heatmaps, form errors, and rage clicks
    AOV fallingDiscounting or weak merchandisingBundles, upsells, and product mix
    Paid traffic unprofitableCAC exceeds visitor valueRPV vs. CPC or CPA by campaign
    Drop-off without visible causeSilent technical errorsJavaScript errors and broken payment flows

    Run this diagnostic before touching any tactics. The fix for low-intent traffic is completely different from the fix for a broken payment method.

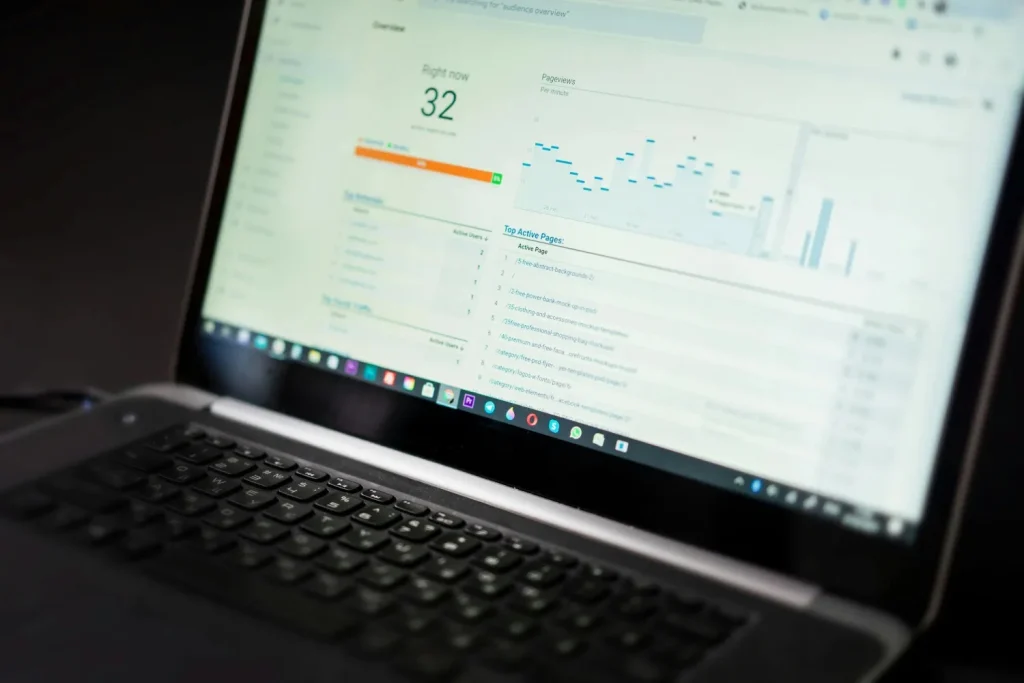
    Laptop displaying ecommerce analytics and website traffic performance dashboard.

    Image source: Pexels

    There are four levers that move RPV. Improving anyone raises it. The real gains come from improving more than one at the same time.

    Traffic quality

    Are the visitors arriving at your site actually interested in buying? Poorly targeted traffic drags RPV down even as traffic numbers go up.

    Evaluate your visitor acquisition efforts by the RPV they produce, not the volume of clicks. A paid social campaign sending 5,000 visitors at $0.50 RPV is worth less than an email campaign sending 500 visitors at $8.00 RPV.

    Identify which sources generate the highest RPV today and invest there before scaling the others.

    Conversion rate

    What percentage of visitors complete a purchase? Even small improvements compound across every visitor who arrives.

    Conversion rate is one side of the RPV equation. The fixes are often straightforward: remove checkout friction, align landing pages with visitor intent, and fix the technical errors silently suppressing purchases for entire device or browser segments.

    Average order value

    How much does each buyer spend? Raising AOV doesn’t require additional visitors.

    Bundles, cross-sells, upsells, and add-ons all lift basket size without changing traffic volume. This is often the fastest lever to move because it targets visitors already in buying mode.

    Retention and repeat purchases

    How much total revenue does each customer generate over time? A customer who buys once and never returns has low lifetime value. One who buys regularly compounds your RPV growth without additional acquisition spend.

    Loyalty programs, post-purchase email sequences, and personalized re-engagement campaigns turn single transactions into ongoing revenue. They also convert new customers into repeat buyers, compounding RPV growth without additional acquisition spend.

    Customer using a credit card to complete an online ecommerce purchase on a laptop.

    Image source: Pexels

    Every interaction a visitor has with your site either moves them closer to buying or nudges them toward leaving. There are three key touchpoints that matter most.

    Product discovery

    Product discovery is where the buyer journey begins. If shoppers can’t find what they’re looking for quickly through search or browsing, they leave.

    Show high-value items prominently using best-seller labels, trending badges, and recently viewed products. A well-structured discovery experience increases both the likelihood of purchase and the average value of what gets added to the cart.

    Product pages

    Your product pages are where the average order gets set. High-quality images, benefit-focused descriptions, and authentic reviews reduce hesitation.

    Social proof, star ratings, review counts, and customer photos help a shopper feel certain they’re making the right choice.

    A strong customer experience on the product page reduces the mental cost of the decision. Place upsell options here: a next-tier version, a natural add-on, or a bundle at a modest discount.

    Cart and checkout

    According to Baymard Institute, 70.19% of all shopping carts are abandoned globally. Most of that abandonment happens because something at checkout made the shopper pause: an unexpected shipping cost, required account creation, or a form that asked for too many details.

    Every friction point at checkout is a direct tax on RPV. Learn more about checkout recovery and how to recapture lost revenue.

    Post-purchase

    Post-purchase is where single transactions become repeat customers. A confirmation email with a relevant recommendation, a loyalty program invite, or a timed re-engagement sequence can convert a one-time buyer into a long-term revenue source.

    Customer browsing an ecommerce website and making a purchase on a smartphone using a credit card.

    Image source: Pexels

    The strategies below work. The challenge is knowing which one to tackle first. Here’s the diagnostic workflow that identifies where in the sales funnel revenue is leaking, so you can act with precision instead of guessing.

    Segment RPV by traffic source, device, campaign, and product category

    Don’t analyze RPV as a single blended number. Segmentation is essential because a low overall RPV often masks a deeper problem. Mobile shoppers may be converting at half the rate of desktop shoppers, or one paid channel may be dragging performance for the entire account.

    Find the weakest high-value segment

    Look for the combination of high traffic volume and low RPV. That’s where the biggest revenue opportunity lives.

    Locate the drop-off step in the funnel

    Use conversion funnel analysis to find exactly where visitors are leaving. The funnel shows you where revenue drops. It doesn’t show you why.

    Watch the sessions behind the drop-off

    This is where ecommerce session replay earns its place. Pull the sessions from the segment with the drop-off and watch what shoppers actually do: where they hesitate, what they click, where they give up.

    Check heatmaps and error logs

    Ecommerce heatmaps reveal click and scroll patterns on product pages and checkout screens by device. Error tracking catches JavaScript errors and broken payment flows that look like abandonment in standard analytics but are actually technical failures.

    A single broken payment method can collapse RPV for everyone on a specific device or browser. Error tracking surfaces these failures before they drain revenue at scale.

    Prioritize fixes by expected revenue impact

    Not every fix is equal. Prioritize by the size of the segment affected, the severity of the friction, and the effort required to fix it.

    Ship the fix and validate with before/after RPV

    Measure RPV before and after every change. If a fix doesn’t move revenue per visitor, it didn’t improve business performance, regardless of what other metrics changed.

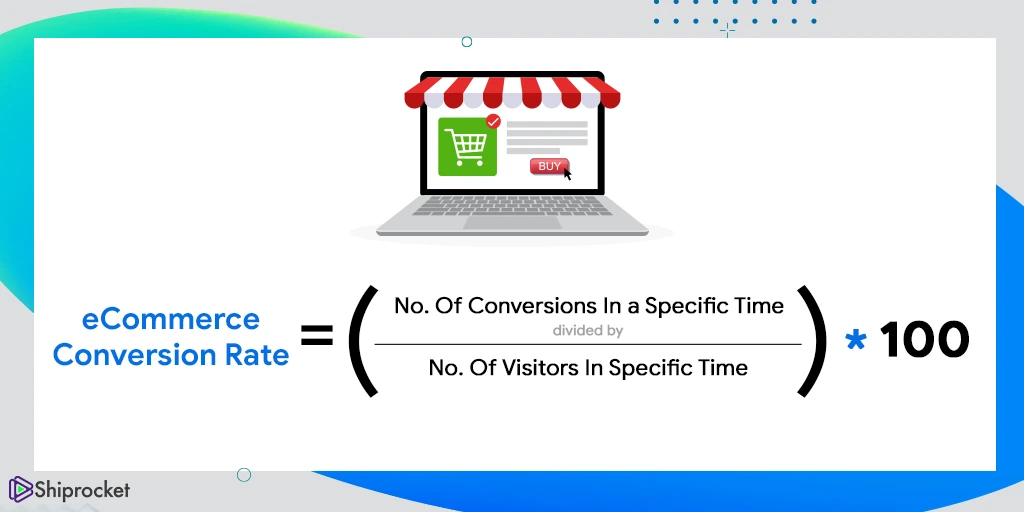
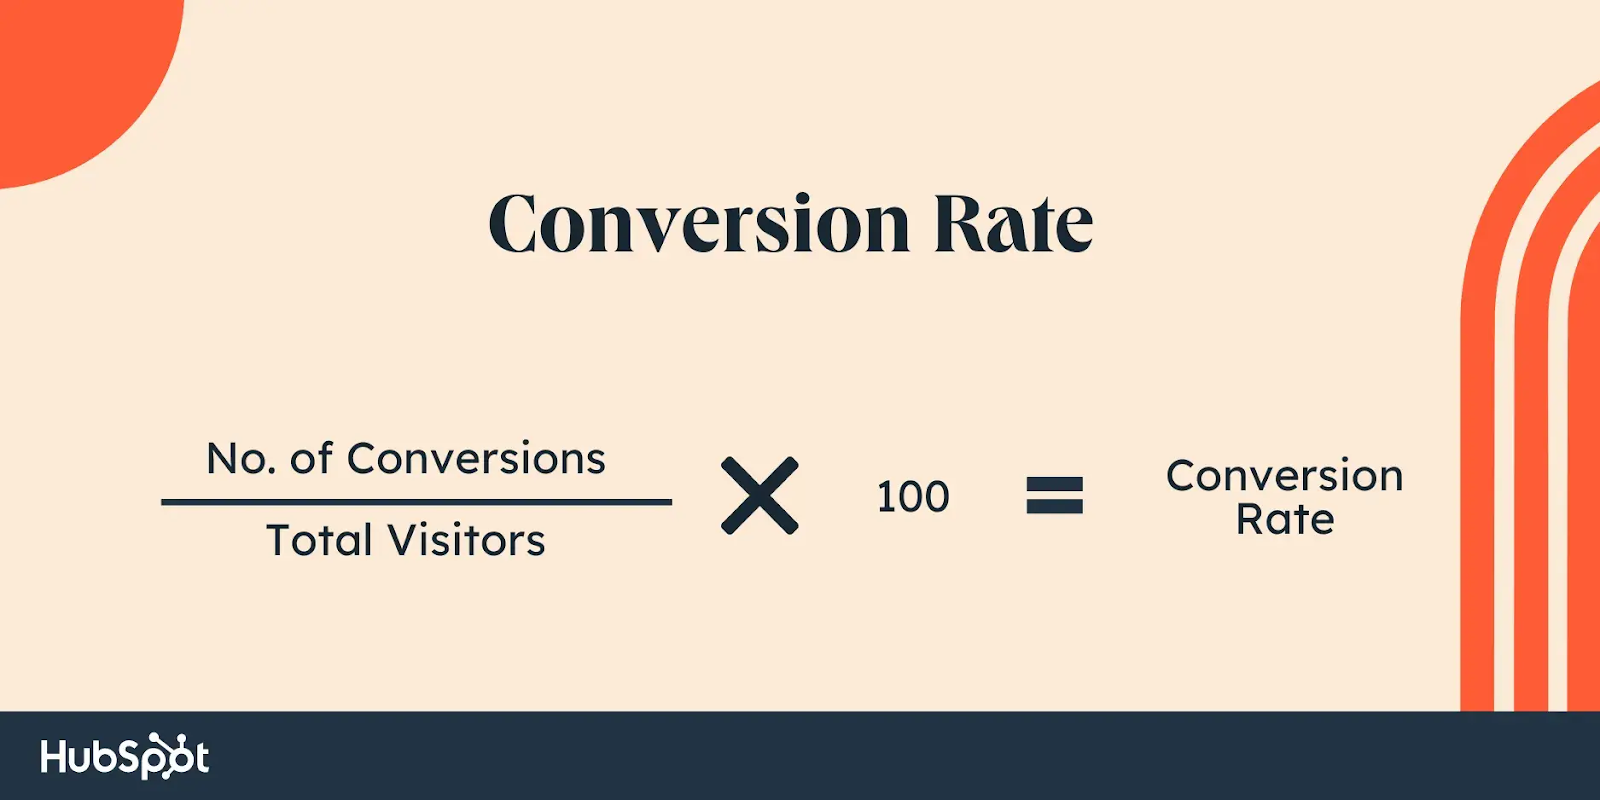
    Illustration showing the ecommerce conversion rate formula using conversions divided by visitors multiplied by 100.

    Image source: Alphawhale

    Start by auditing your checkout against what actually drives abandonment. The fixes are usually straightforward: show shipping costs early, offer guest checkout, reduce required form fields, and add express payment options.

    Baymard’s research shows that the average large ecommerce business can increase checkout conversion by 35.26% through better checkout design alone. That’s recovered revenue without spending more on traffic.

    Fix the errors that silently suppress RPV

    JavaScript errors, broken form validation, and failed payment processing are invisible in standard analytics. They show up as drop-off without revealing their cause. The visitors affected don’t report the issue. They abandon and don’t return.

    Error tracking surfaces these failures so your team can fix them before they compound.

    Align your landing page with the intent of each traffic source

    Traffic from a branded email campaign converts very differently from cold paid social traffic. If visitors arrive expecting a specific offer and land on a generic homepage, you’ve already lost the visit.

    Align each landing page to the promise that brought visitors in. Every disconnect between ad and landing page costs you conversion rate and, therefore, revenue per visitor.

    Product bundles encourage customers to buy more in a single order by packaging related products at a combined price. A slight discount relative to buying those products individually removes the friction from purchasing decisions.

    If many customers buy Product A and Product B within 30 days, turn that pair into a bundle priced below what the same products cost individually. This approach works especially well for small businesses because it increases revenue per transaction without requiring new products or more traffic.

    Place cross-sells where shoppers are ready to add more items

    Cross-sells surface complementary products at the moment purchase intent is highest. The cart page works best. A shopper who has already added something is in buying mode, and “often bought with” suggestions shown there are far more effective than pop-ups triggered after they’ve decided.

    Recently viewed products nudge shoppers back to items they showed interest in without discounting or selling them anything they weren’t already considering.

    Offer upsells that feel like value, not pressure

    An upsell suggests a better version of what the shopper is already considering: a warranty, a premium tier or a personalization option. Keep framing benefit-led: “Protect your purchase with a two-year warranty” converts better than “Add warranty for $15.”

    Match add-ons to the specific item in the cart. Personalization here lifts AOV without making the customer feel pressured or sold to.

    A campaign can increase conversion rate while lowering RPV or profit if it relies too heavily on discounts. A discount-driven traffic spike that trains shoppers to wait for sales is a net negative for RPV over time.

    Compare RPV against cost per click, cost per visitor, and customer acquisition cost. If a channel’s CAC exceeds its RPV, it’s destroying value, not creating it.

    Build retention into your revenue model

    Loyalty programs, post-purchase email sequences, and personalized re-engagement campaigns are not nice-to-haves. They’re the highest-return growth lever available to most ecommerce businesses because they compound without requiring new acquisition spend.

    One customer who buys four times in a year is worth four times what a one-time buyer is worth. Track repeat purchase rate alongside RPV to see whether your retention efforts are working.

    Person browsing products on an ecommerce website using a laptop at a desk.

    Image source: Pexels

    These are the patterns that most commonly stall ecommerce revenue growth.

    • Optimizing conversion rate with discounts while destroying AOV. A sitewide 20% off promotion may lift conversion, but drops RPV if it cuts more from order value than it adds through volume.
    • Raising AOV with upsells that lower conversion. Aggressive upsell prompts at checkout can push hesitant shoppers to abandon entirely. Test upsell placement and messaging before scaling.
    • Blending all traffic together. Overall, RPV can look healthy while a specific channel or device segment is deeply unprofitable. Always segment before drawing conclusions.
    • Measuring sessions instead of unique visitors. Sessions count every visit, including return visits from the same person. Unique visitors count each person once. Make sure your team uses the same denominator when comparing RPV across periods.
    • Declaring test winners based on clicks or add-to-cart instead of RPV. If a change doesn’t increase revenue per visitor, it didn’t meaningfully improve business performance, regardless of what other metrics moved.
    • Ignoring margin and profitability. RPV measures revenue, not profit. A high-RPV traffic segment can still be unprofitable if CAC or discount depth is too high. Factor in gross margin when evaluating optimization priorities.

    Not every gain requires a development sprint. These improvements can often be implemented quickly, though some may require testing, development support, or QA depending on your ecommerce platform and checkout setup.

    • Add a free shipping threshold message to the cart page. “Add $15 more for free shipping” is one of the most effective incentives for lifting basket size without discounting.
    • Enable guest checkout if your site requires account creation before purchase.
    • Add three product recommendations to your cart page using your best-performing product pairs.
    • Add one cross-sell to your highest-traffic product pages based on existing purchase data.
    • Set up an abandoned cart email sequence if you don’t have one. A single follow-up email recovers additional revenue from visitors who were already close to buying.
    • Check checkout on mobile for broken form validation or error messages. Many ecommerce sites have silent failures that only appear under real mobile traffic.
    • Audit your highest-traffic landing page for message alignment with the source that sends the most visitors.

    Each of these is a direct improvement that can produce measurable RPV gains for any specific business without additional acquisition spend.

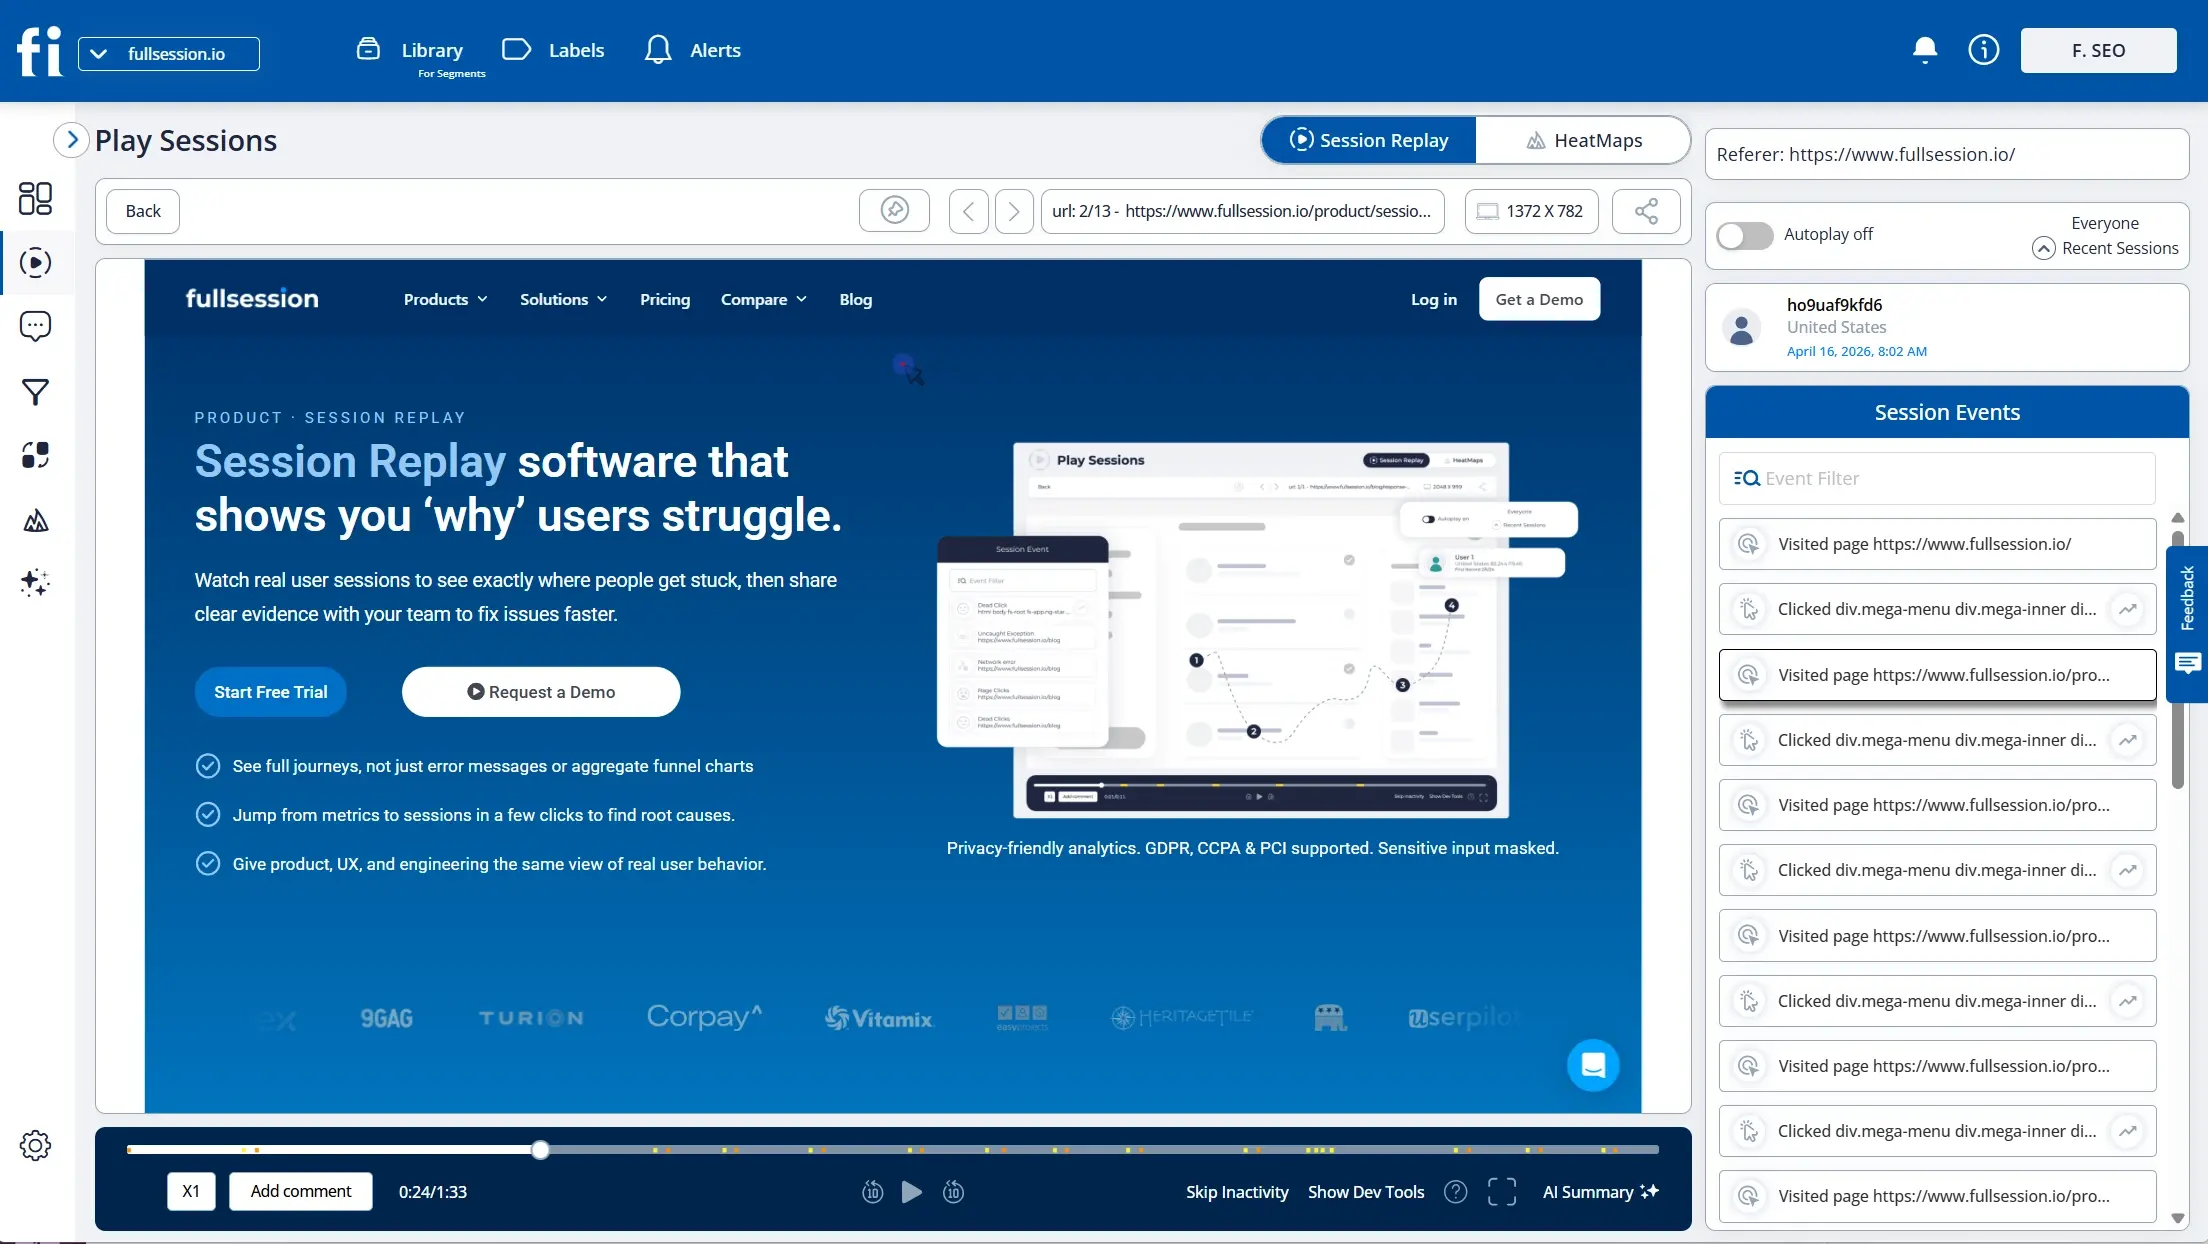
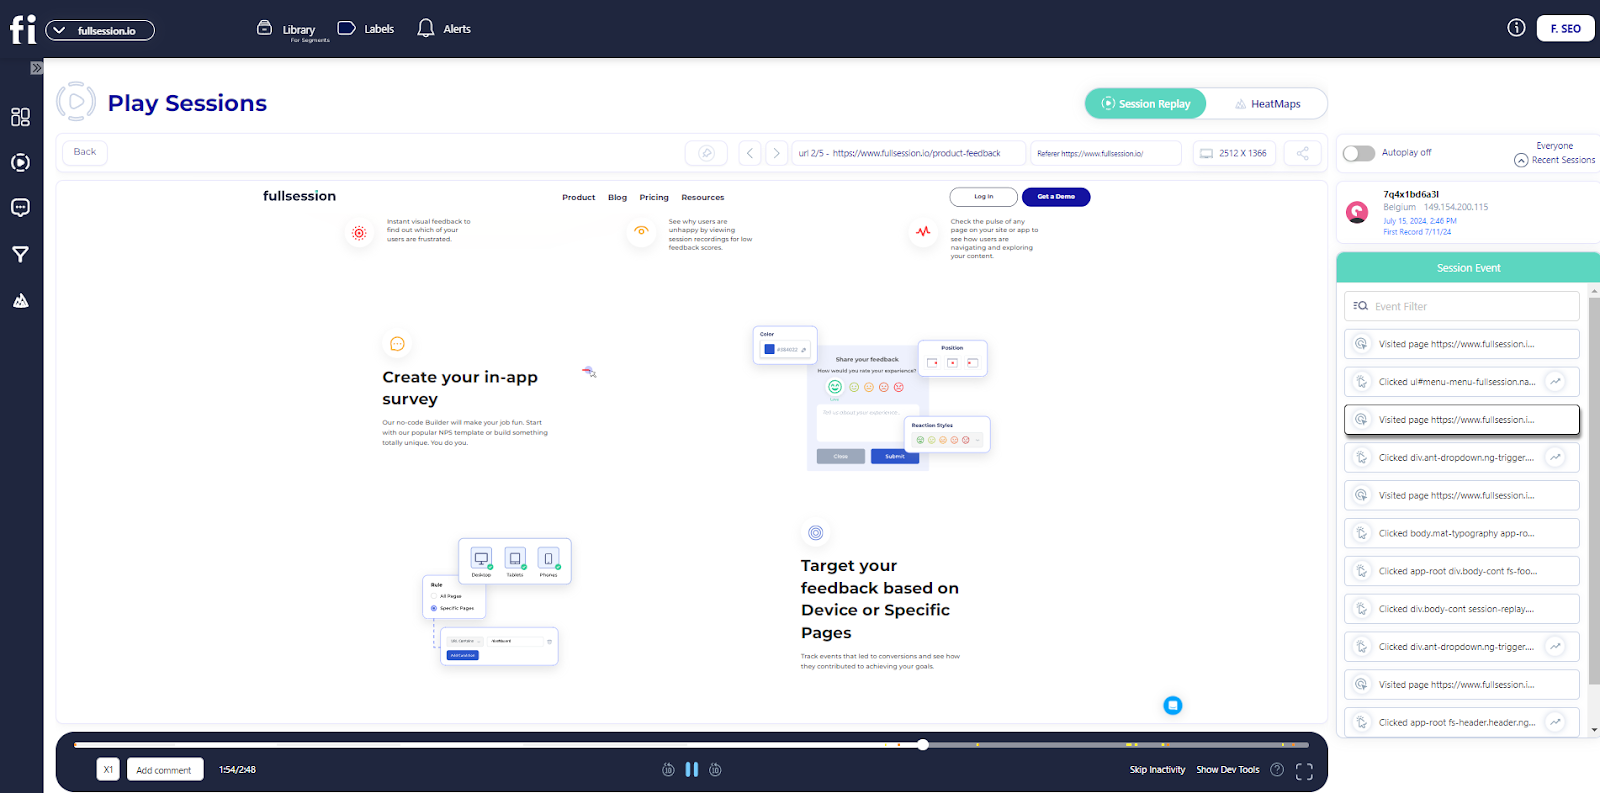
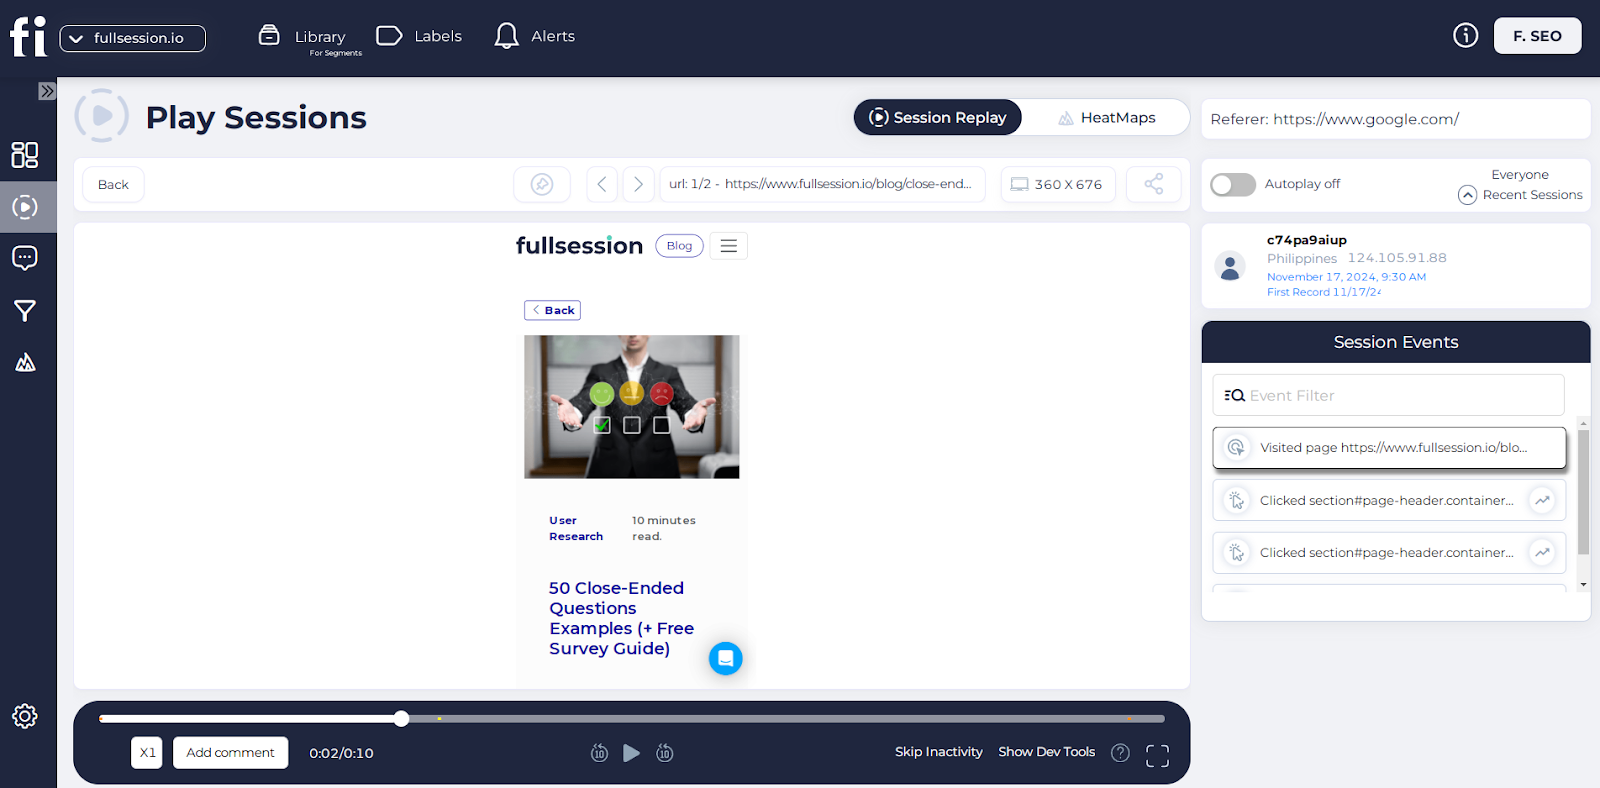
    FullSession session replay dashboard showing website session playback, session events, heatmap tab, referrer field, and replay timeline controls.

    The strategies above are proven. The challenge for most teams is knowing where to start and whether the fix worked. That’s exactly what FullSession is built for.

    FullSession is a web behavior analytics platform for ecommerce teams who need to connect behavioral data to revenue outcomes. Here’s how it fits into the RPV diagnostic workflow:

    1. You see that RPV is down.
    2. You segment by device, source, campaign, landing page, or product category using funnel tracking.
    3. Funnel analysis shows where revenue drops.
    4. Session replay shows exactly what shoppers do at that step: where they hesitate, what they click and where they give up.
    5. Interactive heatmaps reveal engagement patterns on product pages and checkout screens by device.
    6. Error tracking catches JavaScript errors and broken payment flows before they compound.
    7. In-app feedback collects in-page responses linked to the session where they were submitted.
    8. Mobile session replay shows checkout issues that only appear under real mobile traffic.
    FullSession-lift-ai

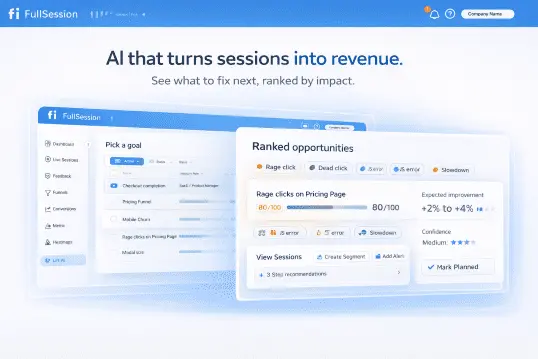
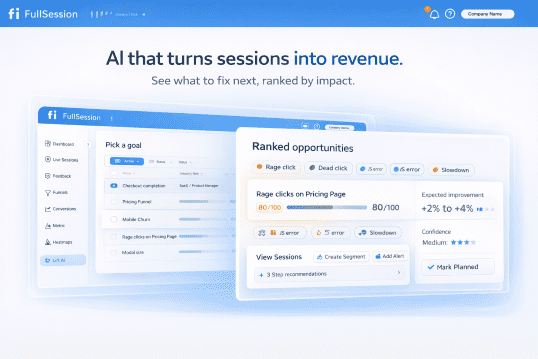
    FullSession Lift AI sits on top of all of this. It is a great tool for teams that have data but lack a clear next action. You set a goal: checkout completion, revenue per visitor, or visitor-to-signup. It scans real user sessions to identify friction, failures, and slowdowns, then outputs a ranked list of opportunities.

    Each opportunity includes a confidence score, an expected improvement estimate, the specific funnel step affected, and direct links to the sessions behind it.

    The recommended workflow: review the opportunity and its linked sessions, ship the fix, then measure impact with a before/after RPV comparison. Lift AI provides estimates. Your data confirms the outcome.

    Start a free trial to see where your revenue is leaking, or book a demo to walk through the checkout recovery workflow in detail.

    Increasing revenue per visitor comes down to improving efficiency, not just scale. More traffic only helps when each visitor has a clear path to conversion and meaningful spend.

    The biggest gains usually come from removing friction, improving intent matching, and increasing value per transaction. Small fixes in checkout flow, product discovery, and page relevance often outperform large acquisition investments.

    Take a look at checkout conversion benchmarks for more information.

    Over time, the real advantage comes from compounding improvements across conversion rate, order value, and retention. Teams that consistently measure RPV and act on it treat growth as a system, not a channel.

    That shift turns existing traffic into a stronger revenue engine.

    FullSession helps ecommerce teams do this by connecting behavioral signals to revenue outcomes and giving Growth, Product, UX, and Engineering teams a shared starting point.

    Start a free trial to identify friction points, fix revenue leaks, and increase RPV across your funnel.

    What are the four ways to increase revenue?

    The four core ways to maximize revenue are growing the number of customers, increasing purchase frequency, raising average order value, and reducing churn. In ecommerce, these map directly to the four RPV levers: traffic quality, conversion rate, basket size, and customer retention. Improving anyone raises revenue. Improving all four compounds growth.

    What is the average revenue per visitor?

    Average revenue per visitor is total revenue in a given time period divided by the total number of unique visitors during that period. RPV varies widely by category, price point, margin, and traffic mix, so your own trend is usually more useful than a generic benchmark. Focus on whether RPV is rising, flat, or falling over time.

    What is the average revenue per guest?

    Average revenue per guest measures how much revenue each individual visitor generates over a defined period. In ecommerce, it’s calculated as total revenue divided by the total number of unique visitors. The formula and interpretation are identical to revenue per visitor.

    How do you calculate revenue per visitor?

    Revenue per visitor is calculated as RPV = Total Revenue / Total Unique Visitors. If your store generated $25,000 from 5,000 unique visitors in April, your RPV is $5.00. You can also express this as RPV = Conversion Rate × Average Order Value, which makes the two levers explicit. Track RPV alongside conversion rate and AOV for a complete view of performance.

    What is a good revenue per visitor for ecommerce?

    A good revenue per visitor depends on your category, price point, and traffic quality. Rather than chasing a benchmark, measure your own baseline and track the direction it moves. Rising RPV over time is the signal that your optimization efforts are compounding into real growth.

  • How to Reduce Bounce Rate in Ecommerce [2026 Guide]

    How to Reduce Bounce Rate in Ecommerce [2026 Guide]

    You open Google Analytics and stare at a 62% bounce rate. Traffic is up, ad spend is up, and yet most visitors leave without clicking a single thing. That’s money walking out the door before it gets near the checkout.

    Ecommerce bounce rate is the percentage of visitors who land on your store, view only one page, and leave without taking any action.

    Most guides on how to reduce bounce rate ecommerce teams deal with skip straight to tactics. This one starts with the first step that actually matters: knowing what’s driving people away. You’ll get a repeatable framework to detect the problem, diagnose the cause, and fix it with data.

    • Benchmark before you fix: a good ecommerce bounce rate has a specific range, but what matters is comparing your individual page types against their own benchmarks, not a single site-wide number.
    • Speed is the fastest win: even a small page load delay significantly raises bounce probability, and image compression alone can close most of that gap.
    • Analytics tells you what, not why: GA4 shows you which pages have a high bounce rate, but session recordings and heatmaps show you the exact moment visitors give up and why.
    • Intent mismatch is invisible in most dashboards: if your paid traffic lands on the wrong page, it will always bounce, and no amount of UX tweaking will fix an audience alignment problem.
    • Prioritize by impact, not by ease: guest checkout, trust signals, and mobile tap targets move the needle faster than redesigns; fix those first before touching anything cosmetic.

    FullSession gives you session replay, heatmaps, funnel analysis, rage-click detection, and error alerts in one place, so you can see exactly what’s driving bounces on each page instead of guessing from aggregate numbers.

    With Lift AI, it connects the behavior behind your bounce rate to the solution, cutting the time between spotting a problem, solving it and validating the fix.

    Book a demo to see it in action.

    Illustration banner about reducing bounce rate in ecommerce websites featuring analytics charts, shopping cart icons, and user behavior optimization concepts.

    Image source: CXL

    Bounce rate measures the share of single-page sessions out of all sessions on your site. Divide your bounced sessions by the total number of sessions and multiply by 100. Tracking your website’s bounce rate by page type, traffic source, and device tells you far more than a single site-wide number ever can.

    Google Analytics 4 changed the definition. In GA4, bounce rate counts sessions where users weren’t engaged: spent less than 10 seconds on a page, didn’t convert, or didn’t have a second pageview. GA4 also reports an engagement rate, the inverse of bounce rate. Both are worth tracking.

    The bounce rate for ecommerce differs from other industries because your visitors came with purchase intent. A visitor who bounces from a news article may have gotten their answer. A visitor who bounces from a product page left money on the table.

    What the benchmarks actually say

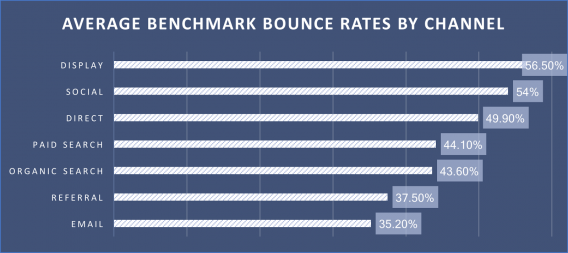
    According to SaleHoo’s 2026 ecommerce data, the average ecommerce bounce rate sits at 47%, consistent across device types and industries. 

    According to IRP Commerce’s ecommerce market data, the average bounce rate across the ecommerce market reached 48.27% in March 2026, a 25.58% year-over-year increase, partly attributed to Google’s updated GA4 definition.

    Your goal isn’t to match the average. It’s to beat it on the pages that drive revenue.

    A high bounce rate costs you in three concrete ways.

    1. Revenue: Every bounce is a visitor who didn’t make a purchase. If your store gets 50,000 monthly sessions and the bounce rate drops from 60% to 45%, that’s 7,500 more sessions where someone actually explores your products.
    2. Ad spend: Paid traffic that bounces immediately is wasted budget. At $2 per click with a 55% bounce rate, you’re paying for attention you aren’t keeping.
    3. Search rankings: Google uses engagement signals to evaluate page quality. High bounce rates on key landing pages can suppress your position in search engines, reducing organic website traffic. For any online business that depends on organic discovery, fewer rankings mean fewer visitors and fewer chances to show visitors relevant content that earns their trust.

    These three effects compound. Losing traffic because of weak rankings means fewer visitors, fewer conversions, and slower growth. Fixing bounce rate isn’t just a UX task. It’s a revenue priority.

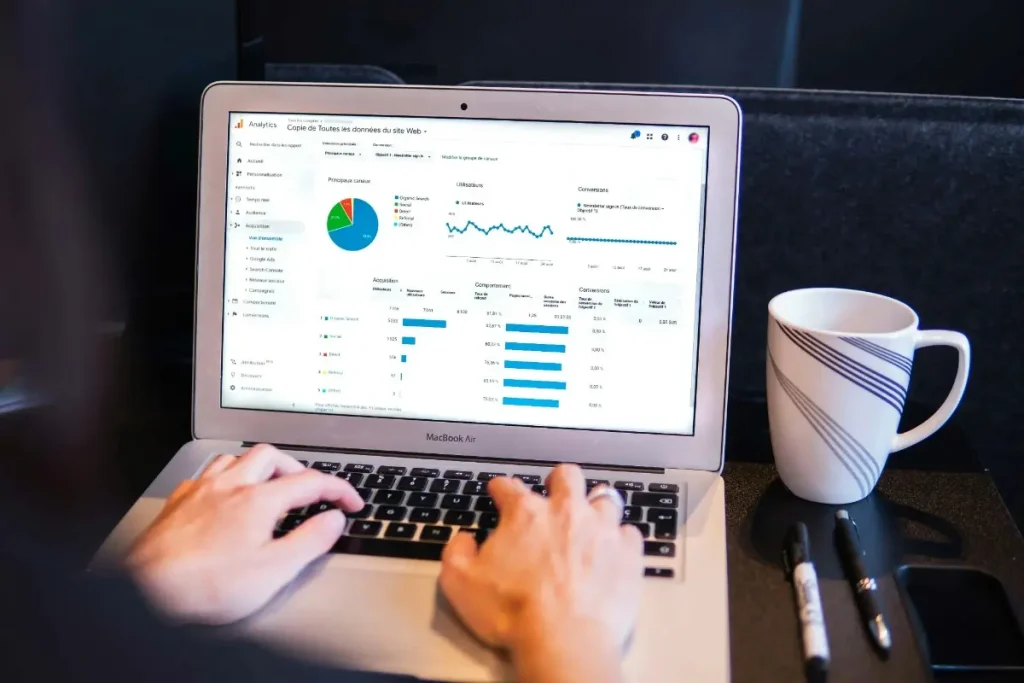
    Laptop displaying ecommerce analytics dashboard illustrating key reasons visitors bounce from ecommerce websites and how analytics can identify user behavior issues.

    Image source: Unsplash

    Before you start optimizing, you need to know which problem you’re actually solving. Here are the six most common causes of a very high bounce rate in ecommerce.

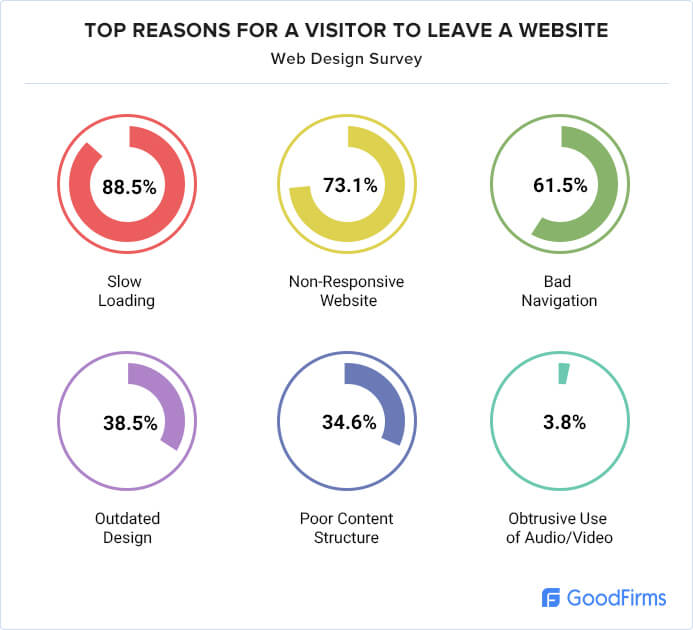
    1. Slow loading speed: According to Digital Applied’s 2026 bounce rate benchmark analysis, pages loading past three seconds inflate bounce rates by 38% compared to pages loading under one second. Loading speed is the fastest way to lose a visitor who was ready to buy. 
    2. Mismatched intent: Your ad or search listing promises one thing, but the particular page visitors land on delivers something different. This is especially common with broad-match PPC campaigns routing users to a generic homepage instead of a specific product.
    3. Poor mobile experience: According to Firework’s 2026 mobile commerce data, 78% of all global ecommerce traffic now comes from mobile devices. A layout that isn’t built for smaller screens sends visitors straight to the back button. 
    4. Weak or missing trust signals: No reviews, no security badges, no visible return policy. On an unfamiliar ecommerce brand, these gaps translate directly into bounces, especially on product pages.
    5. Technical issues: Broken links, 404 errors, JavaScript errors, and product images that fail to render. Your visitors don’t troubleshoot. They leave.
    6. Bad traffic: If your ads or SEO pull in audiences who were never going to buy, your bounce rate reflects an audience problem, not a page problem. Bad traffic inflates your numbers without surfacing anything fixable.

    Reducing bounce rate starts with knowing which pages have the problem and why. This three-step framework gives you a repeatable process.

    Step 1: Detect: find your worst-performing pages

    Open Google Analytics and go to the landing page report. Sort by bounce rate, or by lowest engagement rate in GA4. Filter for pages with at least 200 sessions per month so you’re working with statistically reliable data.

    Segment the results by:

    • Device type (mobile vs. desktop bounce rates often differ by 15-20 percentage points)
    • Traffic source (paid search, organic, social, email)
    • Page type (homepage, collection, product detail, checkout)

    Build a shortlist of the pages where the bounce rate significantly exceeds the benchmark for that page type.

    Step 2: Diagnose: understand why visitors leave

    Standard analytics tells you what happened. It doesn’t tell you why. This is where session recordings become essential.

    Watch recordings of real sessions on your highest-bounce pages. Look for:

    • Rage clicks: rapid, repeated taps on non-interactive elements, signaling that visitors expect something to work, and it doesn’t
    • Scroll depth: whether visitors scroll far enough to see your CTA or key product information
    • Dead zones: sections visitors consistently scroll past without any interaction

    Tracking page views per session alongside time spent on page helps you determine whether visitors are genuinely engaging or stalling before they leave.

    A user-friendly page keeps visitors exploring; a confusing one pushes them out. Understanding the user experience on your highest-bounce pages gives you the qualitative context that quantitative data alone can’t provide.

    Step 3: Fix: apply targeted changes

    Once you know which pages underperform and why, apply the right fix. The next section covers the six most impactful ones.

    Book a demo to see how FullSession finds bounce causes in your store.

    Six fixes cover the majority of bounce rate problems in ecommerce, from the technical issues that push visitors away before the page even loads, to the trust and navigation gaps that lose them once they arrive.

    1. Fix page load speed on product pages

    What it is: Page speed optimization cuts the time between a visitor clicking your link and your page becoming usable.

    Why it drives bounces: A visitor who waits more than three seconds on a mobile device will leave before the page finishes loading. According to Think With Google, a delay from one second to three seconds raises the bounce probability by 32%.

    How to fix it:

    • Convert product and banner images to WebP format and compress them without visible quality loss
    • Enable lazy loading so images below the fold load only as the visitor scrolls
    • Run your key landing pages through Google PageSpeed Insights and address issues flagged under Core Web Vitals

    2. Align landing pages with ad and search intent

    What it is: Intent alignment means the page a visitor lands on matches exactly what they expected based on the ad, search result, or link they clicked.

    Why it drives bounces: A visitor who clicked “women’s running shoes” and landed on your general footwear collection didn’t find what they came for. They bounce within a few seconds, and you’ve paid for the click.

    How to fix it:

    • Audit your top 10 paid landing pages and check whether the headline and product selection match the ad creative
    • Create dedicated landing pages for your top ad groups instead of routing all traffic to category pages
    • For organic traffic, verify that your page title and meta description match the actual page content

    3. Optimize mobile UX for ecommerce shoppers

    What it is: Mobile UX optimization makes your store work as well on a 375px smartphone screen as it does on a desktop.

    Why it drives bounces: A non-responsive layout, buttons too small to tap, or horizontal scrolling sends mobile users straight to a competitor’s online store. This is one of the fastest-growing sources of bounces in modern ecommerce.

    How to fix it:

    • Run mobile-specific heatmaps to see where mobile visitors tap and where they stop scrolling
    • Check that your primary CTA is reachable with a thumb without zooming
    • Test your checkout flow on at least three different mobile screen sizes before publishing changes

    Learn more about CRO for mobile.

    4. Add trust signals to high-bounce product pages

    What it is: Trust signals reduce purchase hesitation: reviews, star ratings, security badges, return policy visibility, and social proof.

    Why it drives bounces: On an unfamiliar ecommerce site, visitors are making a risk calculation. Missing trust signals tip that calculation toward leaving rather than buying. Even a beauty brand with strong products loses potential customers if visitors can’t quickly find evidence that others have bought and been satisfied.

    How to fix it:

    • Place star ratings and review counts directly below the product title, not buried below the fold
    • Add a plain-language return policy statement within the add-to-cart section
    • Display security badges at checkout entry points

    5. Improve internal navigation and product discovery

    What it is: Internal navigation covers your menu structure, search functionality, related product recommendations, and internal links between pages.

    Why it drives bounces: A visitor who doesn’t find exactly what they searched for will leave if your store gives them no clear path to something related. Keeping ecommerce customers engaged means helping them find other pages worth exploring.

    How to fix it:

    • Add related product blocks to every product detail page, especially for items frequently browsed together
    • Improve your site search so it returns results for common misspellings and synonyms
    • Use your ecommerce heatmap data to see which navigation elements visitors actually use

    6. Reduce checkout friction that causes early exit

    What it is: Checkout friction is anything that slows, confuses, or frustrates a visitor who intended to make a purchase.

    Why it drives bounces: Checkout bounces are the most expensive kind. These visitors had enough intent to reach the checkout and then hit a wall. Common culprits include mandatory account creation, unexpected shipping costs, and confusing multi-step forms.

    How to fix it:

    • Enable guest checkout. Removing mandatory account creation reduces bounce rates significantly for new customers
    • Surface shipping costs on product pages, not only at checkout
    • Reduce form fields to the minimum required for order completion

    Fixing bounce rate is a continuous process. Set specific targets before you start so you know what success looks like. Here is an example:

    Page typeTarget bounce rateMonitoring frequency
    HomepageBelow 50%Weekly
    Product detail pageBelow 45%Weekly
    Paid landing pageBelow 35%Weekly
    CheckoutBelow 25%Daily
    Collection / category pageBelow 40%Bi-weekly

    In GA4, track engagement rate alongside bounce rate. Set an alert for any page that exceeds its target by 10 percentage points. That threshold triggers an investigation: pull session recordings and check for new technical issues, content changes, or a traffic source shift.

    The exit rate measures exits from a specific page regardless of session length. High exit rate on a page with normal bounce rate often signals a navigation dead end. Use both metrics together when you improve bounce rate. They tell different parts of the same story.

    Visitors shouldn’t need to go elsewhere to find all the information they need to make a decision. For a deeper look at how these two metrics differ, read the exit rate vs. bounce rate breakdown.

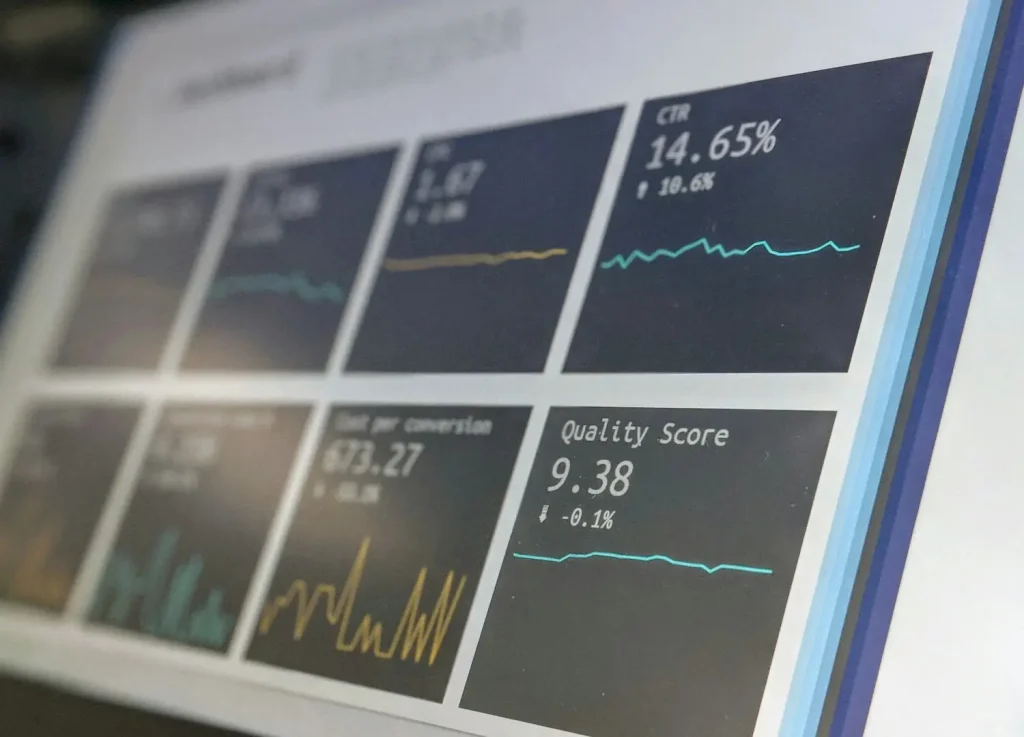
    Analytics dashboard displaying performance metrics, CTR trends, and quality scores used for experimentation, testing, and prioritization in digital optimization strategies.

    Image source: Unsplash

    Not every fix delivers equal return. Use an ICE framework (Impact, Confidence, Ease) to decide where to start.

    Run first (high impact, high ease):

    • Image compression and WebP conversion
    • Mobile tap target sizing
    • Trust signal placement on product pages
    • Guest checkout enablement

    Plan for next sprint (high impact, lower ease):

    • Dedicated landing pages for top ad groups
    • Site search improvements
    • Personalized related product recommendations

    Deprioritize (low impact):

    • Cosmetic color and font changes
    • Navigation label renaming without structural change

    Always A/B test after implementing a fix. Run each variant for at least two weeks before declaring a winner. Data from a controlled test beats intuition every time.

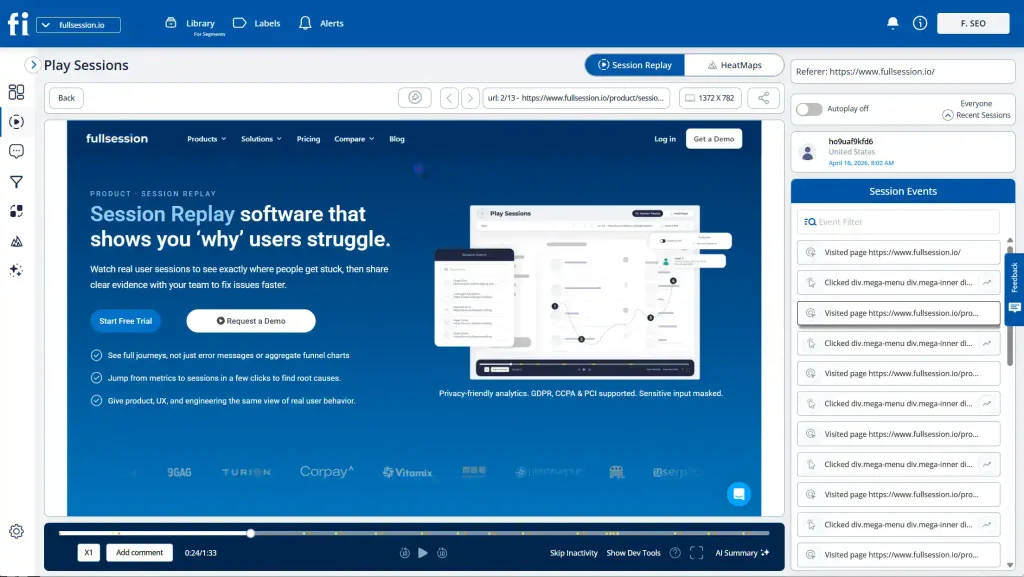
    FullSession session replay dashboard showing playback of a website session, event timeline controls, heatmap tab, and a side panel listing session events.

    Google Analytics tells you a page has a 58% bounce rate. FullSession, a behavior analytics platform for ecommerce teams, shows you what those visitors actually did in the seconds before they left.

    • Session replay records pixel-perfect replays of real user sessions. You can watch exactly how visitors move, click, and scroll on your highest-bounce pages. Rage clicks, hesitation patterns, and the moment someone gives up are all visible without any guessing.
    • Heatmaps aggregate click, scroll, and attention data across all sessions on a given page. You see which sections visitors engage with and which they skip entirely. On a product detail page, a scroll heatmap quickly shows whether visitors ever reach your add-to-cart button or your trust signals.
    • Funnels and conversions maps drop off at every step of your sales funnel. You can see the exact step where users exit and connect that number directly to session recordings from those sessions. That connection turns a drop-off rate into a fixable problem.
    • Errors and alerts catch JavaScript errors, rage clicks, and broken flows in real time. If technical issues are silently driving bounces, a broken form field, a failed image load or a JavaScript error, you get an alert before it compounds into a significant revenue problem.
    • Feedback lets you collect in-page responses from visitors and links each one to the session recording behind it. When a visitor reports confusion or frustration, you can watch exactly what they experienced rather than interpret their words in isolation.
    • Lift AI scans user behavior across your store and predicts which issues have the highest revenue impact. Instead of deciding where to investigate next based on gut feel, you get a prioritized list of what to fix first.
    • Mobile session replay extends the same pixel-perfect replay capability to mobile sessions. Since more than half of ecommerce traffic comes from smartphones, seeing exactly how mobile visitors interact with your pages and where they drop off is a separate diagnostic layer.

    Your marketing efforts shift from assumption-driven to evidence-driven. You fix the right pages, in the right order, with a measurable impact on conversion rate and user satisfaction.

    Book a demo to see how FullSession works on an ecommerce store.

    A high bounce rate isn’t a single problem with a single fix. It’s a signal that something between your traffic, your pages, and your visitor expectations isn’t aligned.

    Work through the Detect, Diagnose, Fix framework, start with the highest-impact changes, and measure every iteration against a clear target for each page type.

    The stores that consistently reduce bounce rate aren’t running more experiments than everyone else; they’re running better-informed ones, because they can see exactly what their visitors are doing.

    FullSession gives you the session replay, heatmaps, funnel analysis, and error tracking to make every experiment count, so you stop guessing and start fixing the right things.

    Start a free trial and watch your first session recordings today.

    What is a good bounce rate for an ecommerce website?

    A good bounce rate for an ecommerce website is generally below 40%. High-performing stores reach 20-30% on key pages like product detail pages and paid landing pages. According to Digital Web Solutions, most e-commerce sites have a bounce rate between 37% to 47%

    How do I reduce my ecommerce bounce rate?

    Start by identifying your top-bouncing pages in Google Analytics 4. Then use session recordings and heatmaps to understand why visitors are leaving. Apply targeted fixes based on what you find: faster page load times, better intent alignment between ads and landing pages, improved mobile UX, and stronger trust signals on product pages.

    Does bounce rate affect Google rankings?

    Google uses engagement signals as quality indicators for search rankings. A high bounce rate doesn’t directly penalize a page, but consistently low engagement signals poor user behavior and weak page performance. Over time, this can suppress your search rankings and reduce organic traffic.

    What causes a high bounce rate on product pages?

    The most common causes are slow page load times, missing or hard-to-find trust signals like reviews and return policies, product images that don’t render, unclear add-to-cart CTAs, and bad traffic that wasn’t looking for that specific product. Session recordings typically reveal which of these applies to your specific pages.

    How is bounce rate measured in Google Analytics 4?

    In Google Analytics 4, bounce rate is the percentage of sessions where users weren’t engaged: sessions lasting under 10 seconds with no conversion event and no second pageview. GA4 also reports engagement rate as the inverse metric. Track both together for a complete picture of page performance.

  • 8 Best Heatmap Software for Ecommerce in 2026

    8 Best Heatmap Software for Ecommerce in 2026

    You can see exactly how many people visited your product pages last month. You can see how many products were bought. But what about the gap in between? The thousands of shoppers who browsed, clicked around, and left without buying?

    That’s what the best heatmap software for ecommerce is built to show you.

    Heatmaps translate raw data about customer behavior into color-coded visuals, visually representing where people click, how far they scroll, and where they lose interest. For ecommerce teams, that’s the difference between guessing why your conversion rate is low and knowing exactly which page elements are costing you sales.

    This guide covers the seven best ecommerce heatmap tools available in 2026, including a comparison table, a selection framework, and a direct answer on which tool is worth your time.

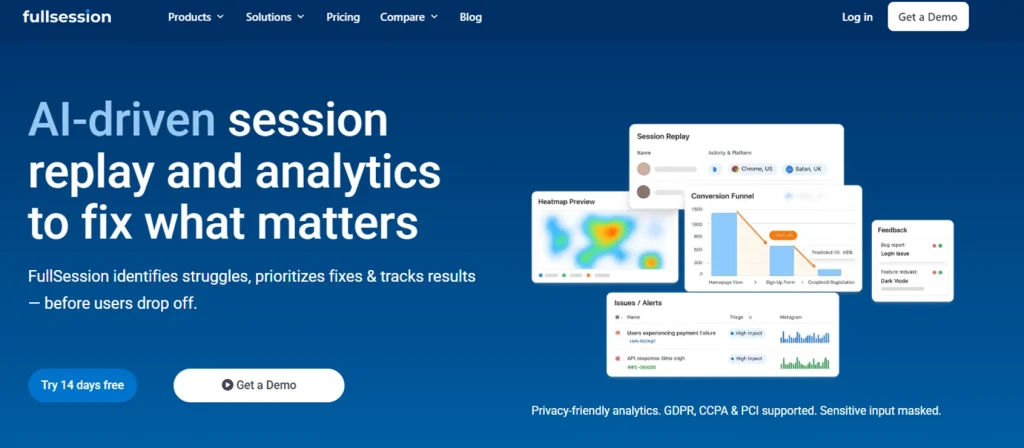
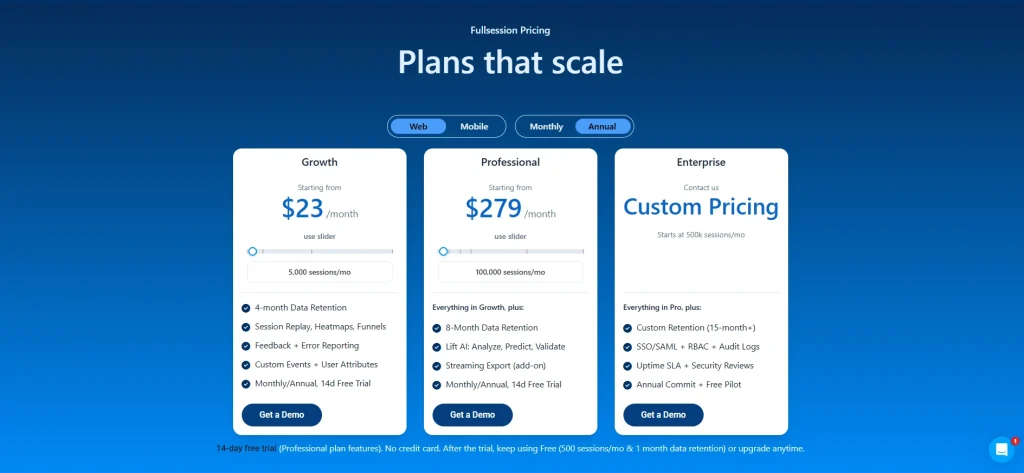
    • FullSession: for teams that want heatmaps, session replay, funnel analysis, and Lift AI in one platform, with behavior data connected directly to conversion outcomes.
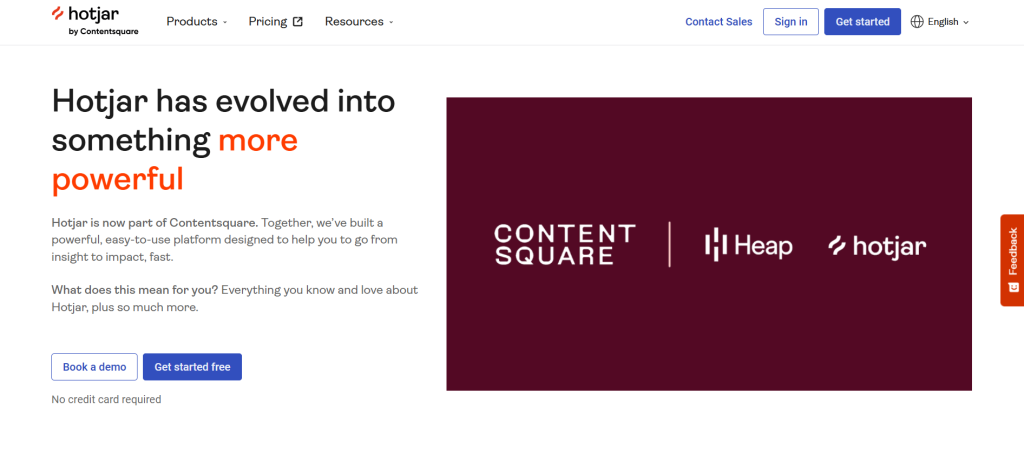
    • Hotjar: for teams that want heatmaps paired with built-in surveys and feedback widgets in a single subscription.
    • Microsoft Clarity: for teams that need completely free heatmap analytics with no session caps, paywalls, or upgrade pressure.
    • Mouseflow: for teams focused on form analytics, with the deep per-field abandonment tracking across checkout flows.
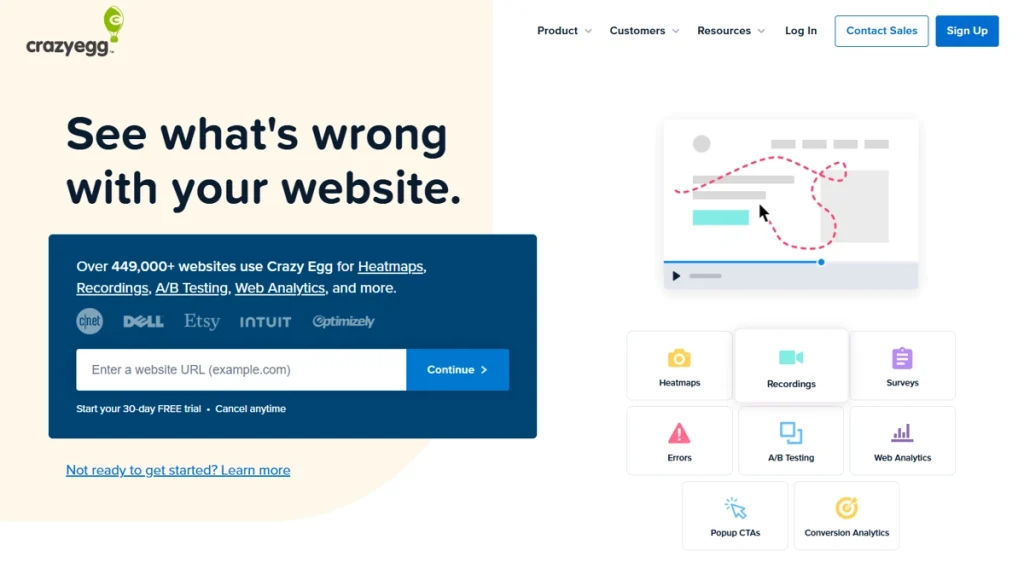
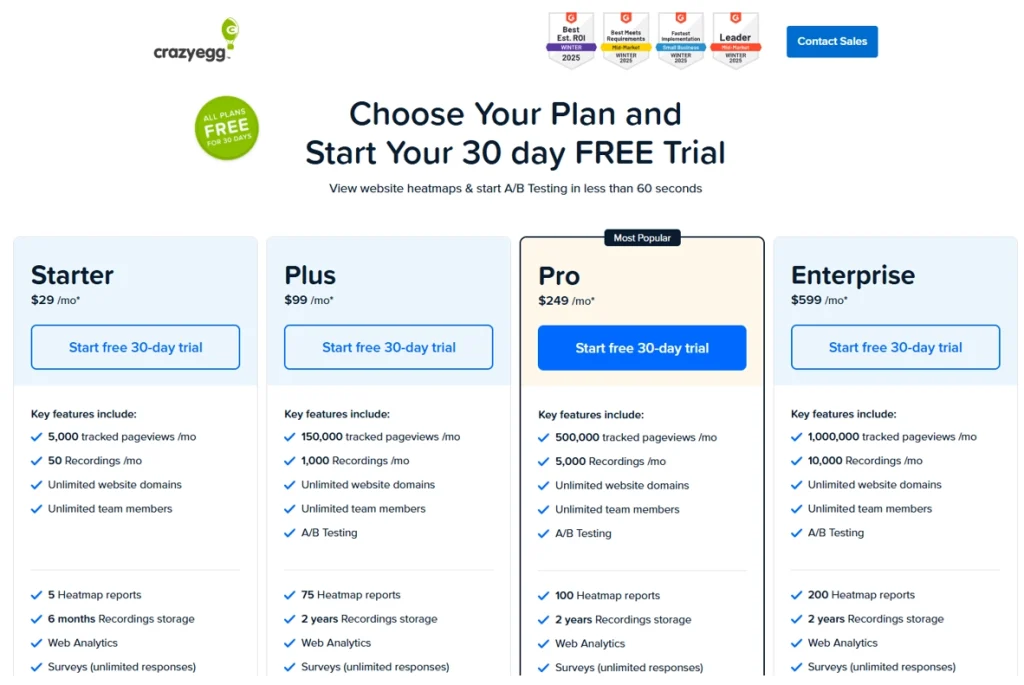
    • Crazy Egg: for teams that want heatmaps and A/B testing natively bundled in the same subscription.
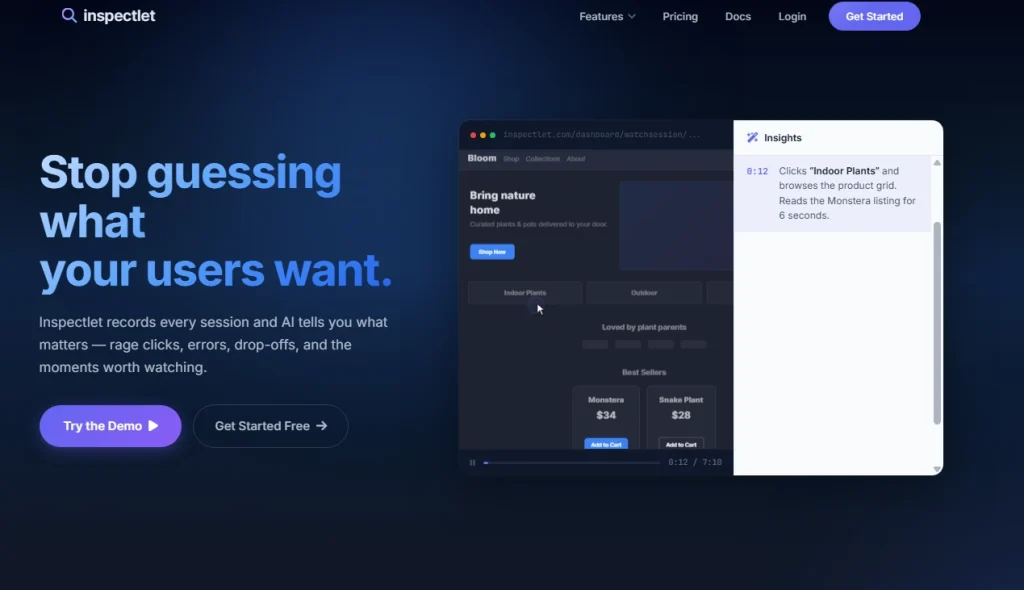
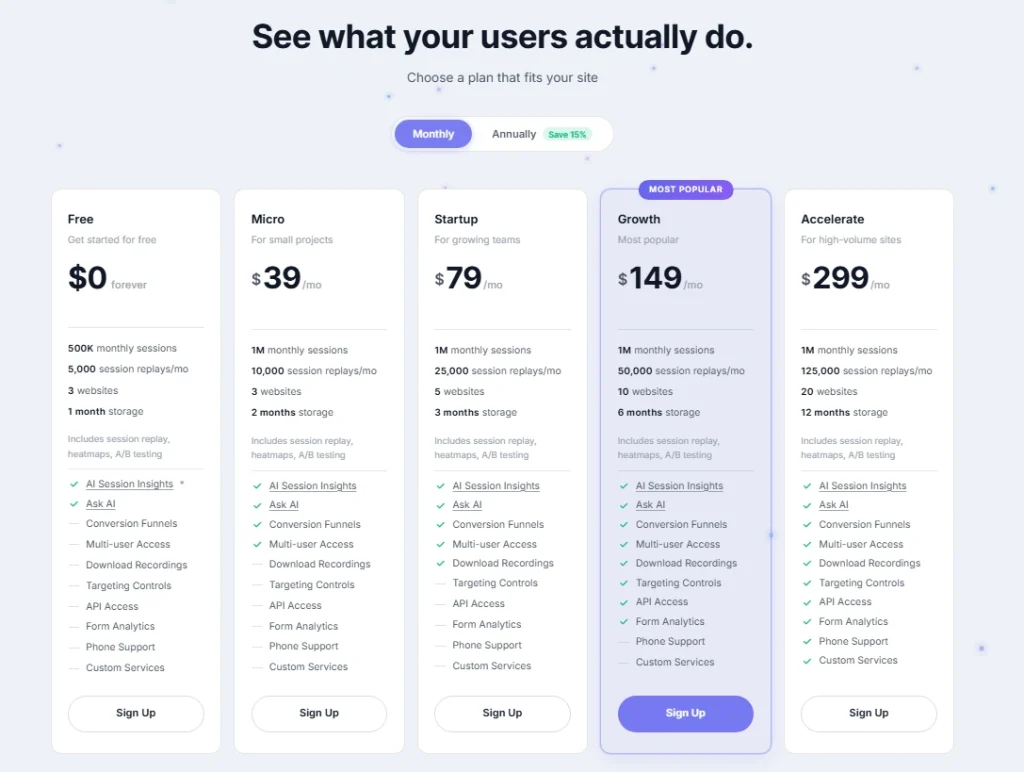
    • Inspectlet: for teams on headless or SPA storefronts that need DOM-based dynamic heatmaps that stay accurate as the page changes.
    • FullStory: for enterprise ecommerce teams that need journey analytics, BI integrations, and data export pipelines at scale.

    Most ecommerce teams need more than a standalone heatmap. They need heatmap data connected to session context, funnel drop-offs, and a clear signal of what to fix first. That’s what FullSession delivers.

    Book a demo to learn more.

    Not every heatmap shows the same thing. Knowing the difference before you choose a tool will save you from paying for heatmap data that doesn’t answer the question you’re actually trying to answer.

    Heatmap TypeWhat It ShowsBest Used For on Ecommerce Sites
    Click mapsWhere visitors tap or click, including dead clicks on non-interactive elementsFinding missed CTAs, ignored add-to-cart buttons, and navigation issues
    Scroll heatmapsHow far down the page visitors scroll before leaving, showing scroll depth by percentageChecking whether shoppers reach pricing, reviews, or the add-to-cart button
    Move / eye-tracking heatmapsCursor movement patterns that approximate where visitors focus visual attentionIdentifying which product content your target audience reads vs. skips
    Geo heatmapsGeographic origin of traffic overlaid on behavior dataSpotting regional differences in user interactions and localization gaps
    Aggregate heatmapsPooled interaction data across all sessions in a single color-coded viewDay-to-day pattern spotting; helps optimize user experience decisions across high-traffic pages
    Dynamic heatmapsLive DOM interactions that update accurately as page elements shiftAccurate tracking on headless storefronts, React apps, and Shopify 2.0 themes

    Static vs dynamic heatmaps in ecommerce

    One difference separates modern tools from outdated ones: static versus dynamic heatmaps.

    Static heatmaps overlay click data on a page screenshot, which breaks badly when your storefront uses interactive filters, tabbed content, or any JavaScript-driven element.

    Dynamic heatmaps record the actual page structure instead, so user actions are always attributed to the right element regardless of how the page changes.

    If your store runs on Shopify 2.0, Hydrogen, or any SPA framework, dynamic heatmap support is a hard requirement, not a nice-to-have.

    Eight tools made this list. Here’s the framework we used to evaluate them.

    1. Ecommerce-specific features: Does the tool help you optimize product pages, checkout flows, cart behavior, or payment forms? Generic website analytics and raw website performance data don’t count.
    2. Heatmap types supported: Does it offer click, scroll, and move data? Does it support dynamic heatmaps for modern storefronts?
    3. Session recording integration: Heatmaps show patterns. Session recordings show why. A tool that connects both in one view delivers dramatically more actionable insights than one that doesn’t.
    4. Mobile tracking accuracy: Touch interactions behave differently than mouse clicks. A tool that can’t accurately capture mobile behavior is a real liability for any ecommerce brand. According to Shopify, 72% of all ecommerce sales now come from mobile devices.
    5. Pricing model fit: Some tools charge by pageview, others by session. Some cap features on lower tiers. We evaluated whether each pricing model makes sense for a typical ecommerce traffic volume.

    What we didn’t evaluate: CRM integrations, enterprise data warehouse connectors, or features unrelated to behavior analytics. This list stays focused on ecommerce heatmap use cases.

    ToolG2 RatingBest ForTop FeatureStarting Price
    FullSession5.0All-in-one ecommerce analyticsHeatmaps + session replay + Lift AI$23/mo (billed annually)
    Hotjar4.3Heatmaps + on-site feedbackSurveys and feedback widgets$49/mo
    Microsoft Clarity4.5Zero-budget ecommerce teamsCompletely free, unlimited sessions$0
    Mouseflow4.6Checkout form optimizationPer-field form abandonment tracking$39/mo
    Crazy Egg4.2A/B testing + heatmapsBuilt-in split testing$29/mo
    Inspectlet4.1Headless and SPA storefrontsDOM-based dynamic heatmaps$39/mo
    FullStory4.5Enterprise ecommerce brandsJourney analytics at scaleNot available
    Smartlook4.6Web + mobile app trackingNative mobile app heatmaps$55/mo

    Here are the seven best heatmap tools for ecommerce in 2026, evaluated across features, pricing, and fit for different store types and team sizes.

    1. FullSession: best for deep user behavior analytics

    AI Driven Session Replay Product Analytics FullSession

    FullSession is a user behavior analytics platform built for ecommerce and SaaS teams that need more than a standalone heatmap.

    What separates it from every other tool on this list is what it delivers in one dashboard: interactive heatmaps, session replay, conversion funnels, error detection, and Lift AI, which predicts the revenue attribution impact of UX issues before you spend time fixing them.

    You’re not just seeing where people click. You’re seeing which clicks lead to purchases and which signal frustration.

    Start a free trial today.

    Best for

    Ecommerce and product teams that want heatmap data connected directly to conversion analysis, without stitching together multiple paid tools.

    Key features:

    • Pixel-perfect session replay reconstructs each visit with a timestamped event timeline, rage clicks, dead clicks, and error flags so you can see exactly what happened before a drop-off.
    • Interactive heatmaps track clicks, mouse movement, and scroll depth in real time with dynamic element support, so the data reflects your live page rather than a static snapshot.
    • Conversion funnels break down drop-offs at each step with segment comparison, letting you isolate whether mobile users, paid traffic, or a specific cohort is driving abandonment.
    • In-page feedback widgets capture direct visitor input linked to the corresponding session replay, so every rating or comment comes with full behavioral context.
    • Lift AI analyzes behavior patterns across your site and ranks friction points by estimated revenue impact, so your team focuses on fixes that move the needle.
    • Error and alert tracking logs JavaScript errors and broken flows tied to individual session replays, giving your team the exact user context when something breaks.
    • Mobile session replay captures interactions on mobile devices at the same fidelity as web, so you get consistent behavioral data across every platform your customers use.

    Pricing

    FullSession pricing

    FullSession’s pricing includes a free plan that covers up to 500 sessions per month. The Growth plan starts at $23/month billed annually (5,000 sessions, four months retention). The Pro plan starts at $279/month for up to 100,000 sessions, with Enterprise pricing available for high-volume stores.

    Book a demo today.

    2. Hotjar: best for lightweight UX research on ecommerce sites

    Hotjar homepage banner showing its evolution into a more powerful platform as part of Contentsquare, alongside Heap and Hotjar logos

    Hotjar, now part of Contentsquare, is a web analytics and customer feedback platform most ecommerce teams will already recognize.

    What sets it apart from others on this list is its native integration of feedback tools. It pairs heatmaps with built-in surveys and feedback widgets. It’s a user-friendly option that most marketers can get running in under an hour, without any developer involvement.

    Best for

    Ecommerce teams that want to combine visual behavior data with qualitative input from visitors, without paying for a separate feedback platform.

    Key features

    • Click, scroll, and move heatmaps across web pages
    • Session recordings with rage click and dead click detection
    • On-site surveys and feedback widgets for collecting visitor input at key moments
    • Funnel tracking to identify where visitors drop out of multi-step flows
    • Integrations with tools like Google Analytics, HubSpot, and Shopify

    Pricing

    Contentsquare pricing page showing Free, Growth, Pro, and Enterprise plans with monthly pricing, session limits, heatmaps, replays, funnels, surveys, and demo options.

    Hotjar provides a free plan. Paid plans start at $49/month, though pricing for higher tiers is not publicly available. Higher-tier plans include advanced filters, segments, and funnel tracking, the features most relevant for ecommerce conversion analysis.

    3. Microsoft Clarity: best free heatmap tool for ecommerce

    Microsoft Clarity homepage hero banner showing AI-powered website analytics, session recordings, heatmaps, and user insight dashboards.

    Microsoft Clarity sits in a category of its own: completely free web analytics with no hidden upgrade paths. There are no session caps, no feature paywalls, and no upgrade pressure.

    Microsoft funds it as part of its broader developer ecosystem, so users get a well-resourced, actively maintained product at zero cost.

    For ecommerce teams that want a deeper understanding of on-site behavior before committing budget to paid tools, it’s a good starting point.

    Best for

    Early-stage online store owners or ecommerce teams testing heatmap analytics before committing to paid tools.

    Key features

    • Unlimited heatmaps and session recordings with no monthly caps
    • Rage click and dead click detection for spotting broken elements on product pages
    • Native integration with Google Tag Manager for fast, no-code installation
    • Direct connection to Google Analytics for combining behavioral data with traffic data
    • Copilot AI summaries of session insights built into the dashboard

    Pricing

    Microsoft Clarity is completely free with no paid plans and no usage limits. The caveat is that it lacks form analytics, funnel tracking, and segmentation. That’s where paid tools earn their cost for more complex stores.

    4. Mouseflow: best for checkout form and funnel analysis

    Mouseflow homepage hero banner promoting AI-powered behavior analytics with a user journey visualization, demo CTA, and free account sign-up option.

    Mouseflow is a session replay and heatmap platform with a particularly strong focus on form behavior.

    It tracks not just which forms get abandoned, but which specific fields cause visitors to quit, how long each field takes to complete, and how often users refill a field after an error.

    For ecommerce teams worried about payment form drop-off, that level of detail is rare in this category of analytics tools.

    Best for

    Ecommerce teams focused on diagnosing checkout friction, reducing cart abandonment, and improving payment form completion rates.

    Key features

    • Click, scroll, movement, attention, and geo heatmaps across five visualization types
    • Per-field form analytics tracking abandonment rate, time-to-complete, and re-entry frequency
    • Funnel analysis showing drop-off at each step of a multi-stage checkout flow
    • Friction score that automatically flags pages with high frustration signals
    • Session replay with filtering by user segment or frustration signal

    Pricing

    Mouseflow pricing page showing a comparison table of Free, Essential, Advanced, Premium, and Enterprise plans with session limits, funnels, replays, heatmaps, and feature differences.

    Paid plans start at $39/month for 5,000 sessions, rising to $399/month for 50,000 sessions. Form analytics and friction scoring are included across all paid tiers, not locked behind the highest plan.

    5. Crazy Egg: best for ecommerce teams running A/B tests

    Crazy Egg homepage banner showing website optimization software with heatmaps, recordings, A/B testing, web analytics, and conversion tools.

    Crazy Egg combines heatmapping with built-in A/B testing. It natively includes a split testing engine in the same subscription, removing the need for a separate experimentation platform.

    The entry-level pricing model is also among the most accessible for small ecommerce stores that want to run A/B testing alongside heatmap analysis without managing two vendor relationships.

    Learn more about Crazy Egg competitors.

    Best for

    Ecommerce marketers who need heatmap data and the ability to run controlled experiments on landing pages without adding another tool to their stack.

    Key features

    • Click, scroll, confetti, and overlay heatmaps for multiple visualization perspectives
    • Built-in A/B testing for testing layout, copy, and design changes directly in the platform
    • Session recordings with filtering by traffic source or device
    • Traffic analysis showing where visitors come from and how their visitor behavior differs by channel
    • Error tracking to surface broken interactions before they affect customer satisfaction

    Pricing

    Crazy Egg pricing page showing Starter, Plus, Pro, and Enterprise plans with monthly pricing, pageview limits, recordings, heatmap reports, and web analytics features.

    Paid plans start at $29/month for up to 5,000 monthly page views. The Plus plan covers 150,000 page views at $99/month. All plans are billed annually.

    6. Inspectlet: best for dynamic heatmaps on SPA storefronts

    Inspectlet website homepage showing AI-powered session replay analytics dashboard with user behavior insights, rage clicks, errors, and drop-off tracking features.

    Inspectlet is a session analytics platform with dynamic heatmap technology at its core. It’s suited for headless or SPA-based stores because of its DOM-recording approach.

    Rather than overlaying click data on a screenshot, it records the actual page structure and renders the heatmap on the live page.

    There’s no steep learning curve for teams already comfortable with session replay tools, and the accuracy improvement on modern storefronts is significant.

    Learn more about Hotjar vs Inspectlet.

    Best for

    Ecommerce developers and CRO teams managing headless commerce setups, Shopify Hydrogen builds, or React-based storefronts where click attribution accuracy is non-negotiable.

    Key features

    • Dynamic heatmaps built on DOM recording rather than static screenshots
    • Eye tracking heatmaps that approximate where visitors focus their visual attention using cursor movement data
    • Session replay with developer console logs included for technical debugging
    • A/B testing built into the same platform for rapid experimentation
    • Form analysis and error logging for identifying broken interactions at checkout

    Pricing

    Inspectlet pricing page displaying Free, Micro, Startup, Growth, and Accelerate plans with monthly pricing, session replay limits, AI session insights, and analytics features.

    Paid plans start at $39/month for 3 websites. All plans include session replays, heatmap tools and A/B testing.

    7. FullStory: best enterprise heatmap tool for ecommerce

    FullStory homepage hero banner with the headline “Better data. Better digital experiences.” and a colorful abstract graphic featuring conversion rate insights and an AI query prompt.

    FullStory is an enterprise digital experience analytics platform where heatmaps are one module inside a broader suite that includes journey analysis, advanced segmentation, BI integrations, and data export pipelines.

    Teams choose it when they need enterprise features and enterprise support alongside behavioral data. It’s not just a heatmap overlay but a complete data infrastructure for understanding how visitors interact with their store at scale.

    Best for

    Enterprise ecommerce brands and large retailers that need behavioral analytics integrated with BI systems, data warehouses, or cross-functional reporting workflows for deeper analysis of the full purchase cycle.

    Key features

    • Click map analytics with retroactive data access across historical sessions
    • Session replay at scale with advanced segment filtering and cohort comparison
    • Journey analytics showing complete user paths across multi-session visits for a deeper understanding of purchase behavior
    • Data export to BigQuery, Snowflake, and other BI tools
    • Enterprise-grade privacy controls and data loss prevention settings

    Pricing

    FullStory pricing page showing analytics plans for businesses, plan add-ons, and behavioral data solution tabs including Analytics, Workforce, and Anywhere.

    FullStory uses custom enterprise pricing. A 14-day trial is available before entering contract discussions.

    8. Smartlook: best for multi-device heatmap tracking

    Smartlook pricing page showing Free, Pro, and Enterprise plans with monthly session limits, product analytics features, heatmaps, integrations, and trial options.

    Smartlook is a product analytics and session recording platform with heatmap capabilities across web and mobile. It’s built for ecommerce brands with a dedicated iOS or Android mobile app and has native mobile app heatmap support.

    Heatmap functionality extends beyond the browser to actual app interfaces running across multiple operating systems, tracking how users interact with your app just as clearly as on the web.

    Best for

    Ecommerce brands operating both a web store and a native mobile app who need unified behavioral data across both platforms without running separate analytics setups.

    Key features

    • Click, scroll, and move heatmaps for web, with heatmap functionality extended to native mobile app interfaces
    • Session replay covering both web and mobile app sessions in one interface
    • Conversion events tracking for custom actions like add-to-cart and checkout initiation
    • Event-based funnel analysis connecting behavior to specific outcomes
    • Rage click and frustration signal detection across multiple operating systems

    Pricing

    Smartlook pricing page showing Free, Pro, and Enterprise plans with monthly session limits, product analytics features, heatmaps, integrations, and trial options.

    The Power plan starts at $55/month for 5,000 sessions and adds funnels, events, and longer data retention. Enterprise plans with custom volumes are available on request.

    Following its acquisition by Cisco, Smartlook is being phased out as a standalone product and will reach End of Sale on May 31, 2026.

    A heatmap tool is only useful if it answers the specific question you’re trying to answer. Tools like Hotjar work well for teams that want a quick entry point into heatmap analytics. FullSession, FullStory, and Inspectlet are better suited when you need more depth.

    Here’s a five-step framework for making the right call.

    1. Define your store’s biggest conversion problem first. Checkout abandonment, low product page engagement, poor mobile UX, and weak landing page performance all call for different tools and different data. Know which one you’re solving before you evaluate anything else.
    2. Check your tech stack before selecting a tool. If your storefront runs on Shopify 2.0, a headless framework like Hydrogen, or any React-based setup, static heatmap tools will misplace click data. You need a tool that supports dynamic heatmaps. This single requirement immediately narrows your options.
    3. Estimate your monthly session volume and match it to the pricing model. A tool that caps at 500 sessions per month will tell you nothing useful if your store gets 50,000 visits. Match the tool’s data volume limits to your actual traffic before committing.
    4. Decide which companion features you actually need. Heatmaps paired with session recordings give you dramatically more insight than heatmaps alone. If you also need A/B testing, form analytics, or customer feedback collection, a multi-feature platform saves you from paying for multiple separate subscriptions. Don’t pay for advanced features you won’t use. Do pay for the ones that directly address your conversion rate optimization goals.
    5. Test mobile tracking accuracy on your own site before committing. Every tool in this guide claims mobile support, but how accurately each one captures visitor behavior from touch devices varies. For any store where mobile visitors drive a material share of revenue, this validation step isn’t optional.

    For a detailed look at where your shoppers drop off at each step, read the guide to conversion funnel analysis on the FullSession blog.

    If you are…Choose…
    Just starting with heatmaps and have no budgetMicrosoft Clarity
    Looking for heatmaps plus on-site visitor surveysHotjar
    Focused on diagnosing checkout and payment form drop-offsMouseflow
    Running A/B tests alongside your heatmap analysisCrazy Egg
    Managing a headless or SPA-based storefrontInspectlet
    An enterprise brand needing behavioral analytics at scaleFullStory
    Running both a web store and a native mobile appSmartlook
    Wanting heatmaps, session replay, funnel analysis, and AI prioritization in one placeFullSession
    FullSession scroll heatmap preview
    FullSession scroll heatmap preview

    FullSession’s heatmaps work accurately on dynamic storefront elements: dropdowns, modals, sticky navigation, and single-page application views, without misattributing click data the way static screenshot tools do. That matters on any modern Shopify or headless build.

    The heatmap data doesn’t sit in isolation either. It’s connected to session replay, so when you spot an unusual click pattern, you can watch the actual sessions behind it with one click. It’s also tied to funnel tracking, so you can see whether a specific user interaction correlates with conversions or drop-offs. That level of in-depth analysis is what standalone heatmap tools can’t deliver.

    Heatmap data
    FullSession heatmap data preview

    Lift AI goes further still. It scans aggregate heatmaps and behavioral signals across your site and surfaces the issues most likely to affect revenue, ranked by estimated impact. You don’t have to guess where to start. The platform tells you which page-level changes and marketing campaigns are worth prioritizing.

    Pricing scales well, too. From a free plan for small stores through to an enterprise tier for large operations, FullSession delivers improved performance visibility without locking its most useful features behind a wall.

    Where a competitor is genuinely the better fit: if you have no budget, Microsoft Clarity is the right answer. If your team needs behavioral data feeding into BI tools, FullStory is worth the investment. If A/B testing is central to your workflow, Crazy Egg is the more efficient all-in-one choice.

    For ecommerce teams running complex storefronts, FullSession combines heatmaps with deeper behavioral analysis in a single platform.

    Book a demo of FullSession and see how the full platform works.

    The best heatmap software for ecommerce shows you not just where people click, but what those clicks mean for your conversion rate.

    A heatmap disconnected from your session data and your funnel gives you visually appealing data points without the context to act on them. It looks informative. It rarely changes anything.

    FullSession gives you that context. Heatmaps, session replay, funnel analysis, and AI-driven prioritization in one platform, built for ecommerce teams that want to boost conversions, not manage dashboards.

    Ready to see your store through your shoppers’ eyes?

    Book a demo or start a free trial and have your first heatmap running today.

    What is the best heatmap tool for ecommerce?

    FullSession is the strongest all-in-one choice for most ecommerce teams. It combines interactive heatmaps with session replay, conversion funnel analysis, and AI-driven issue prioritization in a single platform. For teams with no budget, Microsoft Clarity is the best free option. It offers unlimited heatmaps and session recordings at no cost, with no upgrade required.

    Are website heatmaps useful for ecommerce?

    Yes. Website heatmaps reveal where shoppers click, how far they scroll, and where they hesitate on product pages and during checkout. That behavioral data answers questions that web analytics platforms like Google Analytics can’t. Specifically, why visitors aren’t converting, not just that they’re leaving.

    What is the difference between a click map and a scroll map?

    A click map shows where visitors tap or click on a page, including which buttons get used and which elements attract dead clicks. A scroll map shows how far down the page visitors scroll before leaving. On a product page, scroll maps tell you whether shoppers are actually reaching your reviews, size guides, or add-to-cart button, or abandoning well above the fold.

    Does Google Analytics have heatmaps?

    No. Google Analytics is a web analytics platform focused on traffic, sessions, and goal completions. It doesn’t include heatmap or session replay functionality. To get visual behavior data on top of your existing Google Analytics setup, you need a dedicated heatmap tool. Several tools in this guide, including Microsoft Clarity and FullSession, integrate directly with Google Analytics so you can combine both data streams and track key metrics in one workflow.

  • 7 Best Tools for Web Session Replay in Ecommerce (2026)

    7 Best Tools for Web Session Replay in Ecommerce (2026)

    A large share of shoppers who add items to their cart never complete their purchase. Your analytics platform can show you that it happened, but understanding why is often much harder. That gap is where the best tools for web session replay in ecommerce earn their place.

    Session replay records and replays user sessions, capturing clicks, scrolls, mouse movements, and navigation patterns, so your team can watch real user behavior instead of guessing from aggregate numbers.

    Where your analytics dashboard shows a drop-off, session replay shows the hesitation, the broken field, or the confusing layout that caused it.

    Understanding why session replay tools matter is step one. Choosing the right one for your ecommerce stack is step two. This guide covers both. You’ll find reviews of seven platforms, a comparison table, a team-matching matrix, and a direct answer on which tool works best for ecommerce.

    • FullSession is the strongest pick for ecommerce CRO teams, combining ecommerce-native integrations, Lift AI, funnel tracking, heatmaps, and feedback in one platform built for conversion optimization.
    • FullStory suits enterprise retail teams with dedicated analytics functions, though the complexity and cost put it out of reach for most mid-market operations.
    • LogRocket is the go-to for engineering and QA teams who need session recordings enriched with console logs, network requests, and JavaScript errors for faster bug reproduction.
    • Microsoft Clarity is the free option, offering unlimited recordings and heatmaps with no session cap, but no funnel tracking or ecommerce platform integrations.
    • Hotjar works best for UX and research teams that want behavioral and attitudinal data together through session replay, heatmaps, and on-site surveys in one place.
    • UXCam is the only purpose-built option for native mobile ecommerce apps, capturing touch gestures, crash sessions, and mobile funnels in a way no web-first tool can replicate.
    • Quantum Metric ties session data directly to revenue impact through Felix AI, but an average annual cost of a three-month implementation makes it enterprise-only in every sense.

    For ecommerce teams focused on conversion and checkout recovery, FullSession is the only platform where session replay, Lift AI, funnels, heatmaps, and feedback work together without a complex setup or developer dependency.

    Start a free trial to see why shoppers drop off and start fixing it fast.

    Not every session replay tool is built for ecommerce. Some are developer-focused tools built for debugging. Others target enterprise analytics pipelines. Before you compare session replay software tools, know which capabilities actually move the needle for checkout recovery and conversion optimization.

    Ecommerce-native integrations

    Look for native connectors to Shopify, BigCommerce, WooCommerce, and Wix. Confirm that checkout events and cart interactions are captured with full commerce context, not just as generic page views. A tool that doesn’t understand your platform won’t surface the right data.

    Replay fidelity

    Pixel-perfect DOM reconstruction is the difference between a session that shows exactly what went wrong and one that drops elements or skips frames. For ecommerce, where checkout flows involve multi-step forms and real-time validation, fidelity gaps mean missed diagnoses.

    Frustration signal detection

    Rage clicks, dead clicks, excessive scrolling, and hesitation patterns separate a frustrated shopper from a converting one. Tools that detect these frustration signals automatically save hours of manual review.

    Session filtering and segmentation

    Recording every session is easy. Finding the right one is hard. Effective filtering narrows results by cart value, checkout step, device type, or custom events so your team spends time on sessions that reveal something actionable, not scrolling through noise.

    Privacy and data masking

    Session recording tools capture sensitive data by default: form inputs, addresses and payment fields. Any tool you deploy needs automatic PII masking, configurable exclusion rules, and documented GDPR and CCPA compliance before it touches a live checkout. This isn’t optional.

    AI-powered analysis

    Modern tools use AI-powered analysis to prioritize sessions automatically, surfacing recordings with the highest conversion impact and flagging anomalies before they affect revenue. For teams that can’t manually watch recordings, this has moved from nice-to-have to essential.

    Every tool on this list was evaluated against six criteria from the perspective of a US ecommerce team:

    • Ecommerce integration depth: native connectivity to Shopify, BigCommerce, WooCommerce, and major ecommerce platforms, with checkout event tracking.
    • Replay fidelity: pixel-perfect DOM reconstruction with no dropped interactions on dynamic pages or multi-step checkout flows.
    • Filtering and segmentation: the ability to isolate sessions by cart value, funnel step, device, and custom behavioral events.
    • Pricing transparency: clarity on what you pay at different traffic volumes, with no hidden session caps.
    • Frustration signal detection: automatic identification of rage clicks, dead clicks, and form hesitation.
    • G2 user ratings: verified reviews from practitioners, prioritizing ecommerce and digital marketing teams.
    ToolG2 RatingBest ForTop FeatureStarting Price
    FullSession5.0Ecommerce CRO teamsEcommerce-native replay + Lift AIFrom $23/month (billed annually)
    FullStory4.5Enterprise UX teamsBehavioral analytics + AI anomaly detectionCustom
    LogRocket4.6Engineering/QA teamsConsole logs + network requestsFrom $99/month
    Microsoft Clarity4.5Budget-conscious storesUnlimited recordings, free foreverFree
    Hotjar4.3UX research + feedbackSession replay + heatmaps + surveysFrom $49/month
    UXCam4.6Mobile-first ecommerce appsMobile gesture + funnel analyticsCustom
    Quantum Metric4.6Enterprise ecommerceFelix AI + revenue-tied behavioral dataCustom

    Below are seven of the best session replay software tools for identifying friction, improving conversions, and uncovering issues traditional analytics often miss on web and mobile.

    1. FullSession: ecommerce conversion analytics built around session replay

    AI Driven Session Replay Product Analytics FullSession

    FullSession is a web behavior analytics platform combining session replay, heatmaps, funnel tracking, in-page feedback, and error analysis in a single interface.

    It’s built for teams who need to connect qualitative replay data directly to conversion outcomes, not just observe behavior.

    What sets it apart is Lift AI, which scans user behavior across sessions to predict which issues carry the highest conversion impact, so your team knows what to fix without manually reviewing hundreds of recorded sessions.

    It supports native integrations with Shopify, BigCommerce, Wix, and WordPress, and connects directly to the checkout recovery workflow.

    Best for

    Ecommerce product teams, CRO managers, and marketing leads at direct-to-consumer brands who want to reduce checkout friction and connect replay data to funnel analysis without needing a dedicated developer.

    Key features

    • Pixel-perfect session replay: reconstructs each session with a time-stamped event timeline covering clicks, scrolls, rage clicks, and navigation paths, with no dropped interactions on dynamic checkout pages.
    • Lift AI: automatically surfaces sessions and behavioral patterns with the highest predicted conversion impact so product teams can prioritize fixes by business value, not manual intuition.
    • Ecommerce-native integrations: native connectors for Shopify, BigCommerce, Wix, and WordPress capture cart, checkout, and product page sessions with full commerce context.
    • Funnel and conversion tracking: a built-in funnel builder maps drop-off at every checkout step and links directly to replays from that stage, so you can watch exactly what happened before the abandonment.
    • Error and rage click alerts: proactive detection of JavaScript errors, rage clicks, and broken flows with smart alerts that surface issues before they damage conversion at scale.
    • Interactive heatmaps: click, scroll, and cursor-tracking maps with real-time processing and no impact on site speed.

    Pricing

    FullSession pricing

    A 14-day free trial is available. Paid plans start from $23/month billed annually, or $29/month month-to-month. Custom enterprise pricing is available on request.

    Book a demo to see FullSession’s ecommerce session replay in action.

    2. FullStory: enterprise behavioral analytics with deep session replay search

    FullStory homepage hero banner with the headline “Better data. Better digital experiences.” and a colorful abstract graphic featuring conversion rate insights and an AI query prompt.

    FullStory auto-captures every user interaction without requiring manual event tagging, so your team can run retroactive analysis on behaviors you didn’t think to instrument at setup.

    It’s built for organizations that need to search across behavioral data at scale, filtering by specific interactions, form field states, or device conditions, then jump directly to the relevant replay.

    Its strength is data breadth and searchability. Ease of onboarding and ecommerce specificity are secondary priorities.

    Best for

    Enterprise ecommerce and retail teams with dedicated analytics or UX functions who need deep behavioral search, cross-journey insight, AI-assisted anomaly detection, and shared replay workflows across product, design, and customer success departments.

    Key features

    • Pixel-perfect session replay: high-fidelity session reconstruction with retroactive data access; sessions are searchable even for events not tagged at setup.
    • AI insights and anomaly detection: DX Data scoring surfaces friction moments and quantifies their impact across large user populations without manual configuration.
    • Journey mapping: visualizes the full path a user takes across multiple sessions, revealing patterns that individual replays can’t show.
    • Funnel and conversion tracking: conversion funnels with drop-off visualization link directly to session replays so analysts can move from metric to behavior in one click.
    • Frustration signal detection: rage clicks and error clicks are auto-captured and searchable across the entire session library.
    • Heatmaps: click, scroll, and move heatmaps included within the platform.

    Pricing

    FullStory pricing page showing analytics plans for businesses, plan add-ons, and behavioral data solution tabs including Analytics, Workforce, and Anywhere.

    Custom pricing. A demo is required before pricing is disclosed.

    3. LogRocket: developer-first session replay with full technical context

    logrocket ai session replay dashboard

    LogRocket is built for engineering teams that need more than behavioral data. Each recording comes enriched with console logs, network requests, JavaScript errors, Redux state mutations, and frontend performance metrics in a synchronized timeline.

    Unlike traditional replay tools which show you what the user did, LogRocket shows you what the system was doing at the same time, making it the natural choice for teams whose primary goal is reproducing bugs and cutting time from incident to resolution.

    It’s less suited to ecommerce marketing and CRO teams who need conversion-focused insight.

    Best for

    Engineering teams, QA specialists, and developer-forward product teams at ecommerce companies who need to reproduce frontend errors, diagnose checkout breakage, and connect session replays to their error tracking or observability stack.

    Key features

    • Pixel-perfect session replay: recordings synchronized with console logs, network requests, JS errors, and Redux state so developers can watch user behavior alongside system behavior simultaneously.
    • Error tracking: solid frontend error tracking with direct session replay correlation links every JavaScript error to the exact user interaction that preceded it.
    • Galileo AI: scans sessions to surface and prioritize issues automatically, reducing the manual triage burden for technical teams.
    • Network monitoring: captures all network calls during a session, including request timing, response codes, and payload data, critical for diagnosing silent API failures at checkout.
    • Performance metrics: CPU usage, memory consumption, and page load data are captured per session, making it possible to identify performance regressions tied to specific user journeys.
    • Developer integrations: native connectors to Sentry, Jira, Datadog, and Segment bring session context directly into existing engineering workflows.

    Pricing

    LogRocket pricing page showing Free, Team, Professional, and Enterprise plans with monthly pricing, session limits, data retention, session replay, product analytics, and demo options.

    A free plan is available for limited session volumes. Team plan from $99/month. Professional plan from $350/month. Enterprise pricing is custom.

    Learn more about LogRocket pricing.

    4. Microsoft Clarity: free session replay with no traffic cap

    Microsoft Clarity homepage hero banner showing AI-powered website analytics, session recordings, heatmaps, and user insight dashboards.

    Microsoft Clarity provides unlimited session recordings, heatmaps, and basic frustration signal detection with no session cap and no paid tier. It installs via a lightweight script or Google Tag Manager and integrates directly with Google Analytics.

    It’s the only tool on this list that costs nothing regardless of traffic volume, which makes it widely adopted, though it limits the depth of insight you can extract compared to paid alternatives.

    There’s no native ecommerce platform integration, no funnel builder, and no checkout-specific event tracking.

    Best for

    Small ecommerce teams, solo store owners, and budget-constrained marketers who need a zero-cost starting point to understand basic shopper behavior before investing in a more capable platform.

    Key features

    • Unlimited recordings: no session cap, no traffic threshold, and no paid upgrade required to access historical data.
    • Heatmaps: click, scroll, and area heatmaps are included at no cost, covering both desktop and mobile sessions.
    • AI insights: basic AI-powered session summaries and Microsoft Copilot integration for natural language querying of session data.
    • Google Analytics integration: native GA4 integration lets teams jump from aggregate analytics data to specific session replays without leaving their existing analytics tools.
    • Rage-click and dead-click detection: automatic identification included; no JavaScript error tracking or console logs; network capture is available.
    • Google Tag Manager support: deployable without a developer through Google Tag Manager, making it accessible for non-technical users with no coding resources.

    Pricing

    Completely free. No paid tier and no session limit. This is the only tool on this list with an unlimited free plan.

    5. Hotjar: UX research, qualitative feedback, and session replay in one platform

    Hotjar homepage banner showing its evolution into a more powerful platform as part of Contentsquare, alongside Heap and Hotjar logos

    Hotjar combines session replay with heatmaps, on-site feedback widgets, and user surveys. Teams can start collecting replay data and qualitative feedback without involving a developer.

    Unlike LogRocket or FullStory, Hotjar is built for non-technical practitioners who want to understand shopper behavior quickly and gather user sentiment alongside behavioral evidence.

    It doesn’t capture console logs, network requests, or JavaScript errors, and its ecommerce platform integration is limited to Shopify and Tag Manager. It’s a common entry point for smaller teams evaluating multiple tools before committing to a paid platform.

    Best for

    UX teams, CRO specialists, and marketing managers at ecommerce brands who want to combine session replay with on-site surveys and feedback tools to get both behavioral and attitudinal data from shoppers.

    Key features

    • Session replay: clean, easy-to-use session recording with rage click detection, dead click flagging, and scroll depth tracking, straightforward for non-technical users.
    • Heatmaps: click, scroll, and move heatmaps presented alongside session replays on a shared analytics dashboard.
    • Feedback tools: on-site feedback widgets, NPS surveys, and interview recruitment tools collect qualitative input directly from the shoppers whose sessions you’re watching.
    • Session segmentation: pre-built engagement and frustration segments let teams quickly isolate high-intent sessions or sessions with detected frustration signals.
    • AI summaries: AI-generated session summaries available in higher-tier plans reduce time spent watching full recordings for teams analyzing large session volumes.
    • Shopify integration: native Shopify integration and Google Tag Manager support cover most ecommerce deployment scenarios without custom development.

    Pricing

    Contentsquare pricing page showing Free, Growth, Pro, and Enterprise plans with monthly pricing, session limits, heatmaps, replays, funnels, surveys, and demo options.

    Hotjar offers a free plan. Paid plans available at multiple tiers via Contentsquare, starting at $49 per month. Pricing for higher-tier plans is not public.

    6. UXCam: native mobile session replay for ecommerce apps

    XCam homepage hero banner promoting user journey analytics with AI-powered session insights, demo and free trial CTA buttons, and lifestyle visuals on a dark background.

    UXCam is built from the ground up for mobile applications, with web replay capabilities added more recently. It specializes in capturing touch gestures, taps, swipes, and mobile-specific interactions that web-first replay tools either miss or render poorly.

    Beyond replay, UXCam provides funnel analytics, retention analysis, and feature adoption tracking, positioning it as a broader mobile product analytics platform.

    Best for

    Ecommerce brands with a significant iOS or Android mobile app presence that need to understand in-app shopper behavior, diagnose mobile checkout breakdowns, and optimize native app experiences.

    Key features

    • Mobile session replay: native mobile session recording captures touch gestures, swipes, taps, and screen transitions in iOS and Android apps with frame-accurate playback.
    • Mobile funnel analytics: maps user drop-off across app screens and checkout steps in native mobile environments where web analytics tools have no visibility.
    • Crash session capture: automatically records the session that preceded an app crash, giving engineering teams the behavioral context needed to reproduce and resolve the issue.
    • Gesture heatmaps: touch heatmaps and gesture maps show where users tap, how they scroll, and which elements receive the most engagement on mobile screens.
    • Retention analytics: tracks retention patterns and feature adoption across mobile sessions, helping product teams identify where users disengage after updates.
    • AI session tagging: automatically tags sessions by detected behavior patterns, reducing the time needed to find recordings relevant to a specific investigation.

    Pricing

    UXCam Pricing Plans for Starter, Growth, and Enterprise SEO alt text: UXCam pricing page showing Starter, Growth, and Enterprise plans with monthly session limits, product analytics features, session replay, heatmaps, and demo/request pricing options.

    Paid plans start at 10,000 monthly sessions and use custom pricing. You’ll need to book a demo to get a quote.

    7. Quantum Metric: enterprise session replay tied directly to revenue outcomes

    Quantum Metric homepage hero banner showing the headline “The answers are already there,” a demo CTA button, and a digital analytics interface preview on a dark pink gradient background.

    Quantum Metric connects session replay to real-time behavioral data and revenue impact modeling through Felix AI, its built-in AI companion that interprets session data in response to natural language queries.

    Its advanced features suit large ecommerce organizations that need to attach a dollar value to every friction signal, not just a UX observation. Teams can ask Felix questions like “How many users struggled at checkout this week?” and receive instant summaries with quantified business outcomes.

    Best for

    Enterprise ecommerce and digital retail organizations with dedicated analytics functions that need to quantify the revenue cost of friction, automate behavioral analysis across millions of sessions, and align product, engineering, and business teams around shared behavioral data.

    Key features

    • High-fidelity session replay: session recordings linked directly to transaction data, business metrics, and behavioral signals in a unified timeline.
    • Felix AI: natural language querying of behavioral data delivers instant summaries and impact quantification without requiring an analyst to manually segment and review recordings.
    • Revenue-tied funnel analytics: funnel drop-off at every stage is quantified in revenue terms, not just session counts, so prioritization decisions reflect actual business outcomes.
    • Enterprise integrations: connects to Optimizely, Split, Salesforce, ServiceNow, Looker, and Tealium, covering experimentation, CX, and data platform workflows.
    • Frustration signal detection with revenue thresholds: alerts trigger when frustration signals exceed a revenue impact threshold, not just a frequency count.
    • Zone-based heatmaps: zone and scroll heatmaps are available alongside session replay within the platform.

    Pricing

    Custom pricing. A demo is required before pricing is provided.

    Four questions will help you narrow the field before you evaluate any platform.

    1. Web or mobile app? Web-first teams are well served by FullSession, FullStory, Hotjar, or Microsoft Clarity. If your store runs through a native iOS or Android app, FullSession and UXCam are the options purpose-built for that environment.
    2. Conversion optimization or debugging? Teams focused on reducing checkout abandonment should evaluate FullSession or FullStory. Teams whose primary goal is reproducing frontend errors should look at LogRocket.
    3. What’s your team’s technical depth? Non-technical users will find Hotjar and Microsoft Clarity approachable from day one. LogRocket and Quantum Metric have a more complex setup and require more technical resources to configure. FullSession sits in the middle: powerful yet requires no developer involvement for daily use.
    4. What’s your budget? Microsoft Clarity is the only completely free option with no session limit. FullSession and Hotjar cover the mid-market. FullStory and Quantum Metric carry enterprise-grade price tags.

    Before you commit, confirm the tool handles your traffic volume without session sampling and includes data masking that meets your compliance requirements.

    Different teams need different things from a replay platform. The table below maps common team types to the tool that serves them best, including customer-facing teams who use session context to diagnose reported issues faster.

    Team TypeBest ToolWhy
    CRO and marketing teamsFullSessionEcommerce-native replay + heatmaps + Lift AI, no developer required
    Engineering and QA teamsLogRocketConsole logs, network requests, and JS error tracking in a synchronized timeline
    UX research teamsHotjarSession replay combined with surveys and feedback tools
    Support teamsFullSession or FullStorySession context tied to tickets eliminates back-and-forth with customers
    Budget-constrained storesMicrosoft ClarityUnlimited free recordings with heatmaps and rage click detection
    Mobile-first ecommerce teamsUXCamNative mobile session replay, gesture heatmaps, and crash session capture
    Enterprise ecommerceQuantum Metric or FullStoryRevenue-tied analytics and AI-powered behavioral analysis at scale

    For ecommerce teams whose primary goal is conversion optimization and checkout recovery, FullSession is the strongest option on this list.

    It’s the only platform here that combines ecommerce-native integrations, AI-powered session prioritization through Lift AI, funnel tracking, heatmaps, feedback collection, and error detection in a single product built specifically for web ecommerce workflows.

    For the CRO manager, marketing lead, or product owner who wants to watch real sessions, understand why shoppers drop off, and refine user flows without building a complex analytics setup, FullSession is where to start.

    Book a demo to see the ecommerce session replay workflow in action.

    Session replay tools solve real problems. They also come with operational frustrations. Here are the four most common issues and how to handle them.

    1. Session sampling cuts off the sessions you actually need

    Many platforms on usage-based pricing only record a portion of your traffic. The session with the checkout bug is just as likely to be in the unrecorded half. Choose a tool that records all sessions, or configure sampling to prioritize high-intent events like checkout initiation and cart additions.

    2. Mobile gaps make mobile shoppers invisible

    Other session replay tools built for desktop web produce degraded or incomplete recordings for mobile sessions, skipping touch events or missing interactions on native app screens. If mobile commerce is a meaningful share of your revenue, verify mobile replay quality before committing.

    3. Privacy configuration creates compliance delays

    Manually configuring masking rules for every sensitive field across a checkout flow is time-consuming and error-prone. Tools like FullSession, FullStory, and Microsoft Clarity offer automatic masking of sensitive user data fields by default. Establish your data retention policies before deployment, not after the first compliance question arrives.

    4. Pricing cliffs at scale create budget pressure

    Session-based pricing can look manageable at low traffic and become expensive fast as your store grows. Pairing session replay with A/B testing and experimentation tools as part of a broader optimization stack also amplifies the return per dollar spent.

    Before signing an annual contract, model the cost at 2x and 5x your current session volume. Flat-rate models give more predictable costs at scale than pure usage-based pricing.

    The right session replay tool depends on your primary use case, technical depth, and budget.

    • For debugging-heavy engineering teams: LogRocket.
    • For mobile-first operations: UXCam.
    • For teams starting with zero budget: Microsoft Clarity.

    For ecommerce teams focused on conversion optimization and checkout recovery, FullSession delivers the most complete set of capabilities in a single platform built for that workflow.

    The value of session replay compounds over time. The more sessions your team reviews, the sharper your intuition becomes for where friction lives in your checkout flow, and the faster you can eliminate it.

    When you use session replay data alongside your broader analytics stack to understand user behavior, it becomes one of the highest-leverage tools in your optimization workflow.

    Book a demo for a guided walkthrough, or start a free trial to explore the product at your own pace.

    What is the best free session replay tool for ecommerce?

    Microsoft Clarity is the best completely free option. It offers unlimited recordings, heatmaps, and rage click detection with no session cap and no paid tier. For teams that need ecommerce-specific features like checkout funnel tracking and AI-powered session prioritization, FullSession’s free plan provides a more capable starting point before committing to a paid plan.

    How does session replay help reduce cart abandonment?

    Session replay shows you exactly what happens during sessions that end in cart abandonment: the field that triggered a validation error, the shipping cost that caused a U-turn, the button that didn’t respond on mobile. Replay makes those moments visible and reproducible, so your team can fix them systematically.

    Can session replay tools slow down my ecommerce site?

    A well-implemented session replay tool adds minimal overhead to page load time. Tools like FullSession run asynchronously without blocking page rendering. Test your Core Web Vitals before and after installation using Google PageSpeed Insights, and prioritize tools that load asynchronously and use lightweight SDKs. Microsoft Clarity is widely cited for its low performance footprint.

    What is the difference between session replay and screen recording?

    Session replay reconstructs user sessions from captured DOM events: clicks, scrolls, user actions, and navigation changes, then replays them as a video-like playback. It’s not recording actual video footage of a user’s screen. This produces smaller file sizes, enables event-level filtering across millions of sessions, and allows automatic masking of sensitive fields before data leaves the browser. Traditional screen recording tools capture raw video and offer none of these capabilities.

    Is session replay data GDPR compliant?

    Session replay data can be collected in a GDPR-compliant way, but compliance depends on your implementation. Every tool on this list includes automatic masking for sensitive input fields. You must also inform users through your privacy policy, obtain appropriate consent, configure data retention limits, and restrict access to recorded sessions within your organization. FullSession, FullStory, and Microsoft Clarity all include built-in compliance features, but correct configuration is your team’s responsibility.

  • Introducing Lift AI: Stop Guessing What to Fix Next

    Introducing Lift AI: Stop Guessing What to Fix Next

    Every product team has the same dirty secret: they collect more behavioral data than they can act on.

    Session replays pile up unwatched. Heatmaps confirm what everyone already suspected. Funnels show where users drop off, but not why, and definitely not what to do about it. The real bottleneck was never data collection. It’s prioritization.

    That’s why we built Lift AI.

    Most analytics tools are excellent at telling you what happened. A smaller number can tell you why. Almost none can tell you what to do next, ranked by business impact, with evidence attached.

    This is the gap where teams lose weeks. The PM pulls data one way. The designer interprets it another. Engineering asks for clearer requirements. Growth wants revenue attribution. Alignment meetings multiply. Meanwhile, users keep dropping off at the same checkout step.

    We’ve heard this pattern from dozens of teams. It’s not a data problem. It’s a decision problem.

    Lift AI sits on top of FullSession’s behavioral data layer (session replays, heatmaps, funnels, error tracking) and transforms raw signals into a prioritized action plan.

    Here’s the workflow:

    1. Set a goal

    Choose the business outcome you’re optimizing for: Checkout completion, Revenue per visitor, Visitor-to-Signup, or any custom funnel goal. This anchors every recommendation to revenue.

    2. Lift AI determines the attribution window

    The system automatically selects the optimal lookback and forward analysis window based on your funnel metrics. No manual configuration required.

    3. Get ranked opportunities

    Lift AI analyzes friction, failures, and slowdowns across real sessions. It surfaces a ranked list of opportunities, each with an expected improvement estimate, confidence score, the specific funnel step it impacts, affected pages, and links to example sessions as proof.

    That’s it. No dashboards to configure. No segments to build first. No analyst required to interpret the output.

    A lot of analytics tools have started bolting on AI features that generate text summaries of your data. These read well but rarely change behavior. They describe what you’re already looking at in slightly different words.

    Lift AI is different in three ways:

    1. Goal-anchored, not dashboard-anchored

    Every recommendation ties back to the specific business outcome you selected. Lift AI doesn’t summarize your heatmap. It tells you which friction point, if resolved, would have the largest estimated effect on your chosen goal.

    2. Evidence-backed, not vibes-based

    Each opportunity includes the funnel step it affects, the pages involved, and direct links to session replays where the problem manifests. Your team can verify the recommendation before committing engineering time.

    3. Confidence-scored, not binary

    Not all opportunities are created equal. Lift AI provides a predicated lift impact and when you implemented a recommendation and the post window is complete, it also provides the actual lift. Just be careful not to do lots of changes within the testing timeframe, or the actual lift calculation will be flawed.

    Lift AI is designed for teams responsible for revenue-critical user journeys:

    • Ecommerce and DTC teams focused on checkout completion and basket value.
    • PLG SaaS teams optimizing signup-to-paid conversion and onboarding activation.
    • Growth and Product teams who need a shared, goal-based opportunity list instead of scattered insights across tools.
    • UX, Engineering, and Analytics teams who want to see exactly where technical and experience issues hurt revenue, with sessions attached.

    We’re transparent about what Lift AI is and isn’t. It provides estimates, not guarantees. The recommended workflow is straightforward:

    1. Review the recommendation and its linked evidence (sessions, impacted steps, affected pages).
    2. Ship the fix (UX, copy, flow, or technical) and let Lift AI know you completed the recommended action.
    3. Measure impact using a pre/post comparison.

    Your measurement is always the source of truth.

    Lift AI is available now as a beta feature for all FullSession users. Start a free trial to see it in action, or book a demo if you want a guided walkthrough of how it applies to your specific funnels.

    We built this because we believe the next generation of analytics isn’t about more data. It’s about better decisions. Lift AI is our first step toward that.

  • Ecommerce Heatmaps: How to Interpret Them and Turn Insights Into Prioritized CRO Tests

    Ecommerce Heatmaps: How to Interpret Them and Turn Insights Into Prioritized CRO Tests

    Heatmaps are one of the fastest ways to see how shoppers actually interact with your store. But most ecommerce teams hit the same wall: the heatmap looks interesting…and then what?

    This guide is the missing step between “cool visualization” and “repeatable conversion wins.” You’ll learn how to interpret ecommerce heatmaps without common traps, segment them so they become actionable, and convert patterns into a prioritized CRO test plan—especially for the pages that matter most: category/collection, PDP, cart, and checkout.

    What is an ecommerce heatmap (and what it’s actually telling you)?

    An ecommerce heatmap is a visualization that aggregates user behavior on a page or flow. Instead of looking at rows of events, you get a “hot vs cold” overlay showing where interactions cluster.

    Heatmaps can help you quickly spot:

    • Where shoppers click/tap (and where they try to click but can’t)
    • How far they scroll
    • Where “attention-like” behavior may cluster (with move/hover maps—more on the caveats)

    The key mindset: Heatmaps show where behavior concentrates, not why use that insight to improve user onboarding flows too.

    Types of ecommerce heatmaps (and when to use each)

    Click (tap) heatmaps
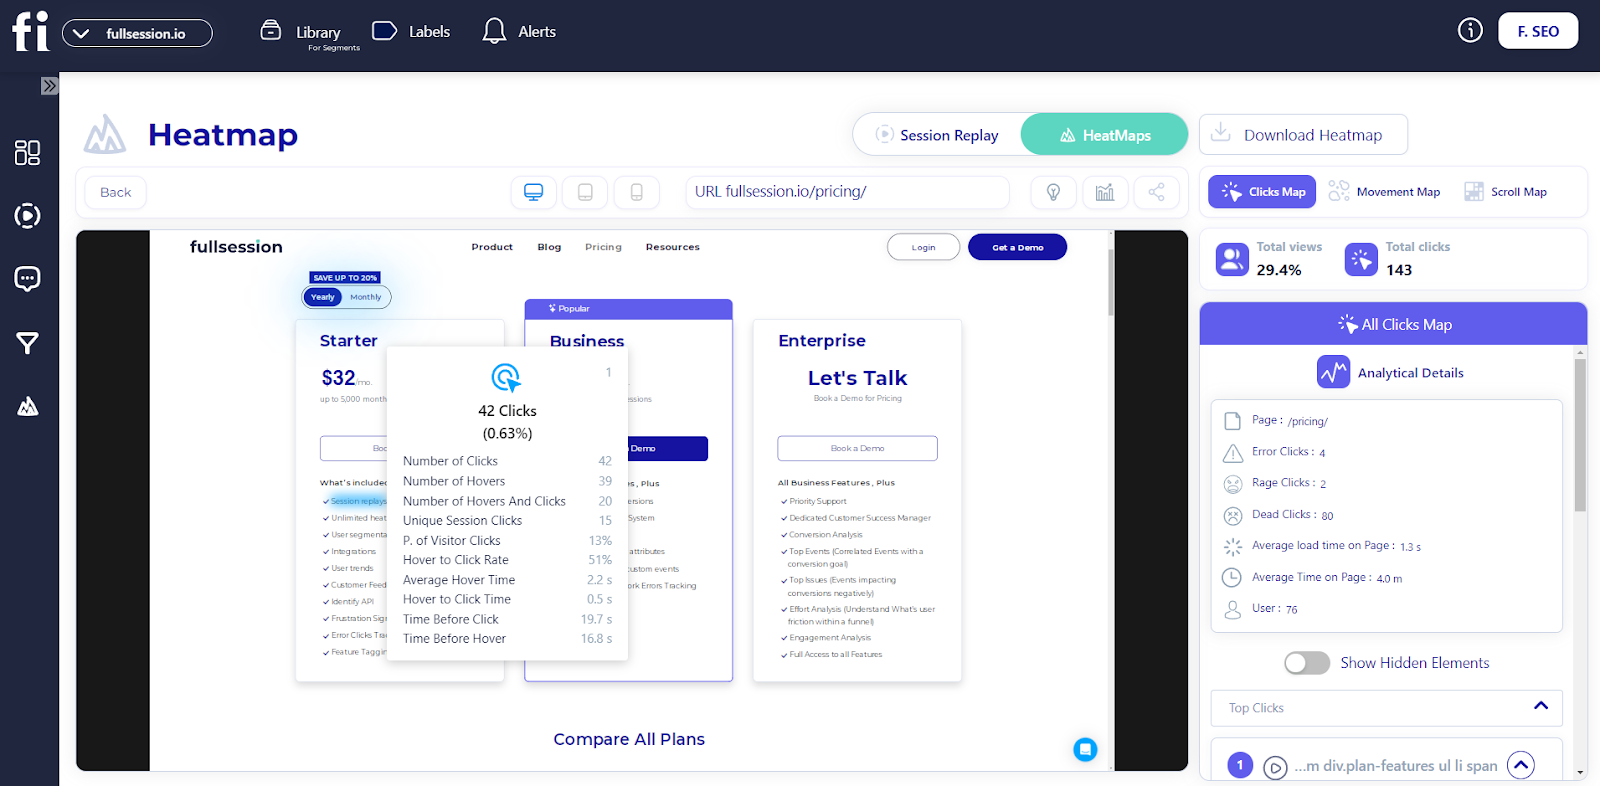
    Click/tap maps answer: What do people try to interact with?
    They’re ideal for diagnosing:

    • CTA placement and hierarchy (“Add to cart,” “Checkout,” “Apply coupon”)
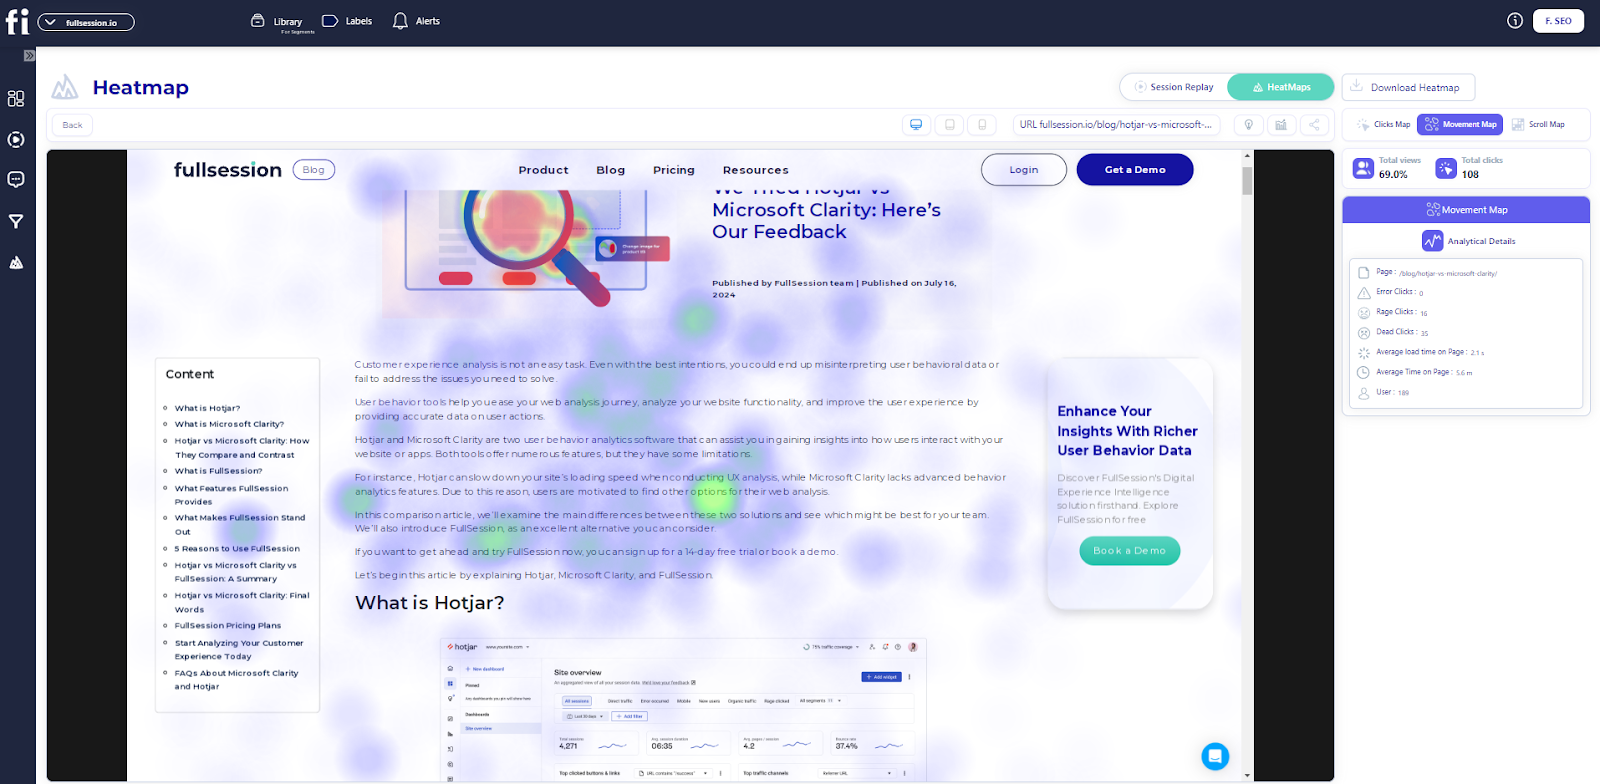
    • Misleading UI affordances (elements that look clickable but aren’t)
    • Navigation clarity (filters, sorting, breadcrumbs)
    • Unexpected clicks (e.g., shoppers clicking product images expecting zoom)

    Ecommerce-specific tip: Always review click maps by device. A “dead zone” on desktop might be a hot zone on mobile (or vice versa).

    Scroll depth heatmaps

    Scroll maps answer: How far do shoppers get before they drop off?
    They help you understand:

    • Whether critical content is being seen (shipping/returns, sizing, price, trust signals)
    • If the page is too long for intent (high bounce + shallow scroll)
    • Where users slow down (an indirect hint of confusion or interest)

    Watch out: “Above the fold” is not a fixed line in ecommerce—different devices, browser UI, and sticky elements change what’s visible.

    Move/hover heatmaps (use carefully)

    Move maps can be helpful for exploratory pages (like long-form landing pages), but they’re often overinterpreted.

    Rule of thumb: hover ≠ attention. Use move/hover as a clue, then confirm with:

    • scroll behavior
    • click behavior
    • session replay
    • funnel analytics

    “Dynamic” heatmaps for carts/checkout and dynamic URLs

    Many ecommerce pages are dynamic: cart states change, checkout steps vary, query parameters appear, and authenticated pages behave differently. If your heatmap tool supports dynamic URLs or templated grouping, use it—otherwise you may end up with fragmented, misleading data.

    The segmentation-first rule (the difference between “interesting” and “actionable”)

    Most heatmap mistakes come from looking at an aggregate view and acting too quickly.

    Before you decide anything, segment at least these three ways:

    1. Device: desktop vs mobile (tablet if material)
    2. Traffic source: paid vs organic vs email vs social vs affiliates
    3. New vs returning: familiarity changes behavior dramatically

    Then, add ecommerce-specific segments when you have enough volume:

    • High intent vs low intent (e.g., branded search vs broad paid social)
    • Cart value bands (low vs high cart value often behave differently)
    • Product category (apparel ≠ electronics ≠ consumables)
    • Geo (shipping expectations and payment methods can change flows)

    Segmentation is how you find the real story: the pattern that’s invisible in the average.

    How to interpret ecommerce heatmaps without fooling yourself

    1) Dead clicks aren’t always “bugs”

    A dead click (clicks on something that doesn’t respond) can mean:

    • the element looks interactive but isn’t
    • the page is slow and users click repeatedly
    • the tap target is too small on mobile
    • users expect a different behavior (e.g., click to expand, zoom, or view details)

    Treat dead clicks as a diagnosis prompt:

    • What did the shopper think would happen?
    • Is the UI hinting at the wrong action?
    • Is performance/latency causing repeated input?

    2) High-traffic bias hides high-value minority behavior

    Heatmaps naturally overweight the largest segments. That means:

    • a small group of high-value shoppers can get washed out
    • a problematic behavior in a specific channel can look “fine” overall

    If you run promos, email pushes, or paid campaigns, segment by those sources before declaring the UX “healthy.”

    3) Time windows matter (a lot)

    Heatmaps can change when:

    • you launch a sale
    • you update layout
    • you change shipping thresholds
    • you adjust product mix

    Use consistent windows and refresh heatmaps after meaningful releases.

    Page-type playbook: what to look for (PDP, category, cart, checkout)

    Category/collection pages

    Goal: help shoppers find and commit to a product quickly.

    Look for:

    • Filter and sort engagement: Are they used? Are “no results” states common?
    • Mis-clicks: People clicking non-interactive labels, swatches, or product card areas
    • Scroll behavior: Are shoppers scrolling deep because discovery is working—or because they can’t narrow down?
    • Clicks on “quick add” vs PDP entry: This affects how much detail they need before committing

    Common test ideas:

    • Rework filter UX (labels, order, sticky behavior on mobile)
    • Improve product card clarity (price, delivery, ratings, variants)
    • Make sorting more meaningful (best-selling, fastest shipping, highest rated)

    Product detail pages (PDP)

    Goal: answer “Is this right for me?” and remove purchase anxiety.

    Look for:

    • Where taps cluster near variants: size/color selection issues often show up as repeated taps or dead clicks
    • Trust signal visibility: shipping/returns, delivery estimates, reviews, guarantees
    • Image interaction: zoom, gallery usage, and whether people click images expecting more detail
    • Scroll map: Do shoppers reach key sections (reviews, specs, sizing)?

    Common test ideas:

    • Move essential reassurance closer to the buy decision (near price/CTA)
    • Improve variant selection clarity (defaults, error states, availability)
    • Reduce “choice friction” (size guides, fit info, comparison)

    Cart

    Goal: turn intent into checkout progression.

    Look for:

    • “Proceed to checkout” visibility and repeated interactions
    • Coupon behavior: are shoppers hunting for promo fields and stalling?
    • Quantity changes and remove actions: signals of price shock or mismatch
    • Shipping estimate interactions: uncertainty can cause drop-offs

    Common test ideas:

    • Clarify shipping costs/thresholds earlier
    • De-emphasize coupon field (or gate it behind a link) if it causes distraction
    • Add reassurance near checkout button (secure payment, delivery window)

    Checkout

    Goal: complete payment with minimal friction.

    Look for:

    • Rage clicks / repeated taps on step navigation, payment methods, address fields
    • Checkout drop-off points (scroll depth + step-level funnel analytics)
    • Form friction hotspots (field-level issues, validation confusion, mobile tap targets)

    Common test ideas:

    • Reduce field count and ambiguity
    • Improve inline validation and error messaging
    • Optimize mobile spacing and tap targets
    • Make payment options clearer and faster to select

    Privacy note: Checkout/account pages often contain sensitive information. Ensure proper masking and consent practices before analyzing.

    From heatmap insight → prioritized CRO test plan

    Here’s the workflow most teams are missing.

    Step 1 — Write the observation (not the conclusion)

    Bad: “The CTA is in the wrong place.”
    Good: “On mobile PDPs, 38% of taps cluster on the product image area near the CTA; ‘Add to cart’ receives fewer taps than expected for this traffic segment.”

    Keep it descriptive. Conclusions come later.

    Step 2 — Pair heatmaps with session replay + analytics

    Heatmaps tell you where. Session replay and analytics help tell you why.

    • Use replay to confirm whether clicks are mis-taps, performance issues, or confusion
    • Use analytics to see if the behavior correlates with drop-off, low add-to-cart, or checkout abandonment

    Step 3 — Create hypotheses using a simple template

    Use this structure:

    • Because (insight + segment): “Because mobile shoppers from paid social frequently tap the image area near the CTA…”
    • We believe (mechanism): “…they’re trying to view details/zoom before committing…”
    • If we (change): “…add an explicit ‘Tap to zoom’ affordance and move key reassurance next to the CTA…”
    • Then (expected result): “…more shoppers will proceed to add-to-cart, increasing conversion rate.”

    Step 4 — Score opportunities so you test the right things first

    Use a lightweight scoring model to avoid “heatmap whack-a-mole.”

    Opportunity score (example):

    • Impact (1–5): revenue/conversion upside if fixed
    • Confidence (1–5): strength of evidence across heatmap + replay + analytics
    • Effort (1–5): design/dev/QA complexity (lower is better)
    • Optional: Funnel weight: checkout/cart > PDP > category if KPI is conversion rate

    A simple formula:

    • (Impact × Confidence) ÷ Effort, then apply funnel weight if useful.

    This creates a ranked backlog you can defend—and repeat every month.

    Step 5 — Define validation: A/B vs pre/post + guardrails

    Before shipping:

    • Choose your primary metric (here: conversion rate)
    • Pick guardrails that could be harmed by the change (e.g., AOV, refund rate, error rate, page performance)

    Then decide method:

    • A/B test when you can isolate impact and have stable traffic
    • Disciplined pre/post when A/B isn’t feasible (but control for promos/seasonality and use guardrails)

    Measurement and validation (so you can prove it worked)

    Heatmap-led changes fail politically when teams can’t prove outcomes.

    A practical validation checklist:

    • Define who you’re measuring (segment matches the insight)
    • Define when (avoid sale launches and major merch changes)
    • Track conversion rate plus relevant guardrails:
      • add-to-cart rate (for PDP changes)
      • cart-to-checkout progression (for cart changes)
      • checkout completion rate + error rate (for checkout changes)
      • page performance metrics if you touched media or scripts

    If your store runs frequent promos, document the exact dates and compare like-for-like windows.

    Privacy + data governance on checkout/account pages

    Heatmaps can accidentally expose sensitive interactions if you’re not careful.

    Operational rules:

    • Confirm consent requirements and configurations
    • Ensure masking for any sensitive fields and personal data
    • Treat checkout/account flows as high-risk pages—analyze behavior patterns without capturing sensitive inputs

    FAQs

    Does Shopify have heatmaps?

    Shopify doesn’t ship a universal heatmap feature for every store by default. Many teams use third-party tools or analytics add-ons to generate heatmaps and pair them with session replay.

    Heatmap vs session replay: which should I use?

    Use both when possible:

    • Heatmaps help you spot patterns fast
    • Session replay helps you understand the behavior behind the pattern
      If you can only pick one for early diagnosis, replay often provides faster “why,” while heatmaps make prioritization easier once you have volume.

    How long should I run heatmaps before acting?

    Run long enough to capture a representative sample for the segment you care about (device/source/new vs returning). If you’re in a promo-heavy business, ensure the window reflects “normal” behavior or segment your promo traffic separately.

    Closing CTA

    If you’re evaluating heatmaps for ecommerce optimization, map your top revenue pages, segment by device and traffic source, and validate changes with a clear measurement plan.

  • Ecommerce Conversion Optimization: A Practical CRO System for Prioritizing, Testing, and Proving Lift

    Ecommerce Conversion Optimization: A Practical CRO System for Prioritizing, Testing, and Proving Lift

    Most ecommerce teams do not have a “tactic problem.” They have a decision problem.

    You can find endless lists telling you to add reviews, tweak your checkout, or speed up pages. The harder part is knowing what to do first, how to prove it worked, and what to do when the data is noisy or the test shows no lift.

    This guide gives you a practical CRO system: how to choose the right KPI, diagnose where the money is leaking, prioritize what to fix, and validate results without fooling yourself.

    What is ecommerce conversion optimization?

    Ecommerce conversion optimization (often called ecommerce CRO) is the practice of increasing revenue from the traffic you already have by reducing friction and improving decision clarity across the shopping journey. If you want a broader set of tactics to pair with this system, see ecommerce conversion optimization strategies

    It includes UX changes (navigation, product pages, checkout), offer and trust changes (shipping clarity, returns, guarantees), and measurement changes (choosing the right KPI, instrumenting the funnel correctly).

    Definition box: ecommerce conversion rate formula

    Ecommerce conversion rate (CVR) is typically calculated as conversion rate is typically calculated as:

    CVR = Transactions / Sessions (or Visitors)

    That formula is useful, but it can also mislead you. If a change increases average order value (AOV) but slightly reduces CVR, you could still make more money. That is why many teams run CRO against a revenue metric, not just a confirmation-page metric.

    Choose the right primary KPI (why RPV often beats CVR)

    If you only optimize for CVR, you can accidentally push the business into bad trade-offs: more low-intent orders, worse margins, higher cancellations, or more support load.

    A practical default for ecommerce CRO is Revenue per Visitor (RPV) because it bakes in both conversion and basket value.

    RPV also forces better questions:

    • Are we converting the right traffic, or just more traffic?
    • Are we improving checkout completion, or lowering order value to do it?
    • Are we shifting revenue between segments (mobile vs desktop) instead of growing it?

    Here’s a simple metric selection table you can use when aligning stakeholders.

    MetricBest used whenCommon risk if you over-focus
    RPVYou want a single north star that reflects revenue impactCan hide margin, refunds, or cancellations if you do not track counter-metrics
    CVRYou have stable AOV and want to reduce friction fastCan reward “cheap wins” that lower order value or quality
    AOVYou are improving bundles, thresholds, and merchandisingCan decrease CVR if you push too hard or add choice overload
    Cart abandonment rateYou have strong add-to-cart but weak checkout completionCan improve while revenue stays flat if traffic quality shifts

    Counter-metrics to keep you honest: refunds, cancellations, payment failures, support tickets, and delivery exceptions. If your checkout change increases RPV but also increases cancellations, that is not a win. It is a delayed loss.

    The practical CRO loop (from signal to shipped change)

    A CRO program works when it produces decisions, not decks. You need a repeatable loop that connects funnel data to user-level evidence and then to a test plan.

    Here is a workflow that holds up in the real world, including traffic constraints and competing priorities.

    1. Define the conversion event and the funnel path
      Start with what you actually care about: purchase revenue, subscription start, lead with deposit, or whatever “value” means for your store. Then map the steps that create it (product view → add to cart → checkout start → payment success). If you need a full breakdown of funnel stages and what to optimize in each, use ecommerce conversion funnel as a reference.
    2. Find the highest-value drop-off
      Look for steps where a meaningful share of users fall out and where the business impact is obvious. “Checkout start to purchase” is often the highest-value zone, but not always.
    3. Segment before you brainstorm
      Do not mix all users together. At minimum, split by device, new vs returning, and primary acquisition channels. Many “sitewide” CRO ideas are actually one-segment ideas in disguise.
    4. Collect session-level evidence
      Funnel analytics tells you where. It rarely tells you why. Pair the drop-off with session replay, rage clicks, dead clicks, error states, and form hesitation patterns. The goal is not storytelling. It is evidence you can turn into a specific hypothesis.
    5. Write a falsifiable hypothesis
      “Improve trust” is not a hypothesis.
      “If we show delivery date and total cost earlier in checkout, mobile users will complete payment more often because uncertainty drops” is testable.
    6. Choose the smallest test that can prove or disprove it
      You are not trying to rebuild the storefront. You are trying to reduce uncertainty. Start with the smallest change that meaningfully targets the friction source.
    7. Validate with guardrails, then ship or iterate
      Decide up front what “good evidence” looks like, what segments you will read, and which counter-metrics must not regress. Then ship the winner, document the result, and feed the learnings back into prioritization.

    If you want to operationalize steps 1 to 3 with less guesswork, start from your funnel drop-offs and step-to-step completion inside.

    Prioritization that survives real constraints

    Every ecommerce team has more ideas than capacity. Your system should prevent two failure modes:

    • Tactic sprawl: 25 “good ideas” and no focus.
    • Local optimization: improving a micro-step that does not move revenue.

    A simple prioritization approach that works well in practice is Impact × Confidence ÷ Effort, scored per funnel zone and per key segment.

    Impact: If this works, how much revenue could it move?
    Confidence: How strong is the evidence (not opinions)?
    Effort: How long to build, QA, and measure correctly?

    A typical failure mode is treating “confidence” as gut feel. Instead, tie confidence to what you can actually point to:

    • A consistent replay pattern (users stuck on the same field).
    • A measurable error spike (payment failures, address validation loops).
    • A segment-specific drop-off (mobile only, paid social only).

    Practical decision rule:
    If you cannot describe the friction in one sentence and show at least one supporting artifact (funnel step drop-off, replay pattern, or user feedback), your confidence score should be low. That idea goes to the backlog, not the next sprint.

    Diagnose by funnel zone (what to fix first, and why)

    Different funnel zones have different “jobs.” If you apply generic tips everywhere, you waste time.

    Product page (job: decision clarity)

    On product pages, the highest-impact improvements usually reduce uncertainty:

    • Can I trust this product?
    • Will it fit my use case?
    • What will it cost me all-in?

    A common failure mode is optimizing for aesthetic polish while the real blocker is missing information. If you see users bouncing between images, shipping info, and returns, that is not “engagement.” It is uncertainty.

    What to do first: pick one high-traffic product template and fix clarity issues that affect many SKUs (delivery estimates, return policy visibility, size guidance, variant selection usability).

    Cart (job: commitment)

    Cart is where doubt spikes. Users are deciding if the order is worth it once fees and shipping become real.

    What to do first: reduce surprises. If the total cost changes late, you will see it as sudden exits and back-and-forth navigation.

    Checkout (job: completion under constraint)

    Checkout is not where you “sell.” It is where you remove reasons to quit.

    Checkout improvements tend to win when they address:

    • Form friction (address fields, validation loops, mobile keyboard issues)
    • Payment failure and error handling
    • Trust signals at the moment of risk (returns, security reassurance, delivery guarantees)

    Post-purchase (job: reduce regret and support)

    Post-purchase UX affects refunds, cancellations, and repeat purchases. If you only measure confirmation-page conversion, you can miss the damage.

    What to do first: track cancellations and refund reasons as part of your CRO feedback loop. If “did not realize shipping cost” shows up after purchase, that is a checkout transparency problem, not a support problem.

    Validation guardrails (so you do not “prove” the wrong thing)

    Most ecommerce CRO programs fail quietly in measurement. Not because teams do not test, but because they test in ways that overstate confidence.

    Here are practical guardrails that keep teams from shipping false wins:

    • Decide the primary KPI and counter-metrics before you look at results. If you pick the KPI after the test, you are optimizing for a story.
    • Do not peek early and declare victory. Early swings often regress.
    • Avoid running overlapping tests on the same funnel step. You will not know what caused the change.
    • Treat “no lift” as information, not failure. It often means your hypothesis was wrong or your change was too small, not that CRO is broken.
    • Sanity-check tracking before you test. If your checkout events are inconsistent by browser or device, you will chase ghosts.

    Show practical judgment here: if your store does not have enough traffic to run clean A/B tests quickly, you can still do CRO. You just need to rely more on stronger qualitative evidence, larger changes, and longer measurement windows. The trade-off is slower certainty, not zero progress.

    When to use FullSession for ecommerce CRO

    Use FullSession when your KPI is tied to revenue outcomes and you need to connect funnel drop-offs to the real user behaviors causing them.

    FullSession is a privacy-first behavior analytics platform that helps you:

    • See where users drop in the purchase funnel and which steps are leaking value via – Funnels and Conversion
    • Diagnose checkout friction patterns that drive abandonment and payment failure, then route remediation around.
    • Turn “we think” into “we saw,” so your confidence score is earned, not guessed.

    If you want a starting point that is hard to argue with internally, map your funnel drop-offs first, then pick three high-impact tests you can validate with clean measurement.


    FAQs

    What is a good ecommerce conversion rate?

    A “good” conversion rate depends on your category, traffic quality, device mix, and price points. Use your own historical baseline and segment splits (mobile vs desktop, new vs returning) before you chase external benchmarks.

    Should I optimize for conversion rate or revenue per visitor?

    If you can only pick one, RPV is often the better north star because it captures both conversion and order value. Still track CVR and AOV to understand what is driving changes in RPV.

    What usually causes cart abandonment?

    Common causes include surprise costs, forced account creation, slow or confusing checkout on mobile, and payment failures. The fastest path to clarity is pairing funnel drop-off with session-level evidence.

    Do I need A/B testing to do ecommerce CRO?

    A/B testing is useful, but it is not the only path. If traffic is limited, focus on stronger qualitative evidence, bigger changes, and careful counter-metric tracking. The goal is decision quality, not perfect experimental purity.

    What are the first CRO tests most ecommerce teams should run?

    Start where revenue leaks are largest and evidence is strongest. For many stores that means checkout transparency, mobile form friction, and payment error handling before you touch cosmetic product page tweaks.

    How do I prioritize CRO ideas across devices and channels?

    Prioritize per segment. A change that helps desktop organic users can hurt mobile paid traffic. Segment first, then score impact and confidence within that segment so you do not average away the truth.

    What should I track besides conversion rate?

    At minimum: RPV, AOV, checkout start rate, payment success, refunds, cancellations, and support contacts related to ordering. These prevent “wins” that create downstream problems.

  • Session Replay for JavaScript Error Tracking: When It Helps and When It Doesn’t (Especially in Checkout)

    Session Replay for JavaScript Error Tracking: When It Helps and When It Doesn’t (Especially in Checkout)

    Checkout bugs are rarely “one big outage.” They are small, inconsistent failures that show up as drop-offs, retries, and rage clicks.

    GA4 can tell you that completion fell. It usually cannot tell you which JavaScript error caused it, which UI state the user saw, or what they tried next. That is where the idea of tying session replay to JavaScript error tracking gets appealing.

    But replay is not free. It costs time, it introduces privacy and governance work, and it can send engineers on detours if you treat every console error like a must-watch incident.

    What is session replay for JavaScript error tracking?

    Definition box
    Session replay for JavaScript error tracking is the practice of linking a captured user session (DOM interactions and UI state over time) to a specific JavaScript error event, so engineers can see the steps and screen conditions that happened before and during the error.

    n practical terms: error tracking tells you what failed and where in code. Replay can help you see how a user got there, and what the UI looked like when it broke, which is why teams often operationalize this inside an Engineering & QA workflow

    If you are evaluating platforms that connect errors to user behavior, start with FullSession’s Errors and Alerts hub page.

    The checkout debugging gap engineers keep hitting

    Checkout funnels punish guesswork more than most flows.

    You often see the symptom first: a sudden increase in drop-offs at “Payment submitted” or “Place order.” Then you pull your usual tools:

    • GA4 shows funnel abandonment, not runtime failures.
    • Your error tracker shows stack traces, not the UI state.
    • Logs may miss client-side failures entirely, especially on flaky devices.

    Quick diagnostic: you likely need replay if you can’t answer one question

    If you cannot answer “what did the customer see right before the failure,” replay is usually the shortest path to clarity.

    That is different from “we saw an error.” Many errors do not affect checkout completion. Your goal is not to watch more sessions. Your goal is to reduce checkout loss.

    When session replay meaningfully helps JavaScript error tracking

    Replay earns its keep when the stack trace is accurate but incomplete.

    That happens most in checkout because UI state and third-party scripts matter. Payment widgets, address autocomplete, fraud checks, A/B tests, and feature flags can change what the user experienced without changing your code path, especially when you integrate replay with optimization experiments and QA the setup

    The high-value situations

    Replay is most useful when an error is tied to a business-critical interaction and the cause depends on context.

    Common examples in checkout:

    • An error only occurs after a specific sequence (edit address, apply coupon, switch shipping, then pay).
    • The UI “looks successful” but the call-to-action is dead or disabled for the wrong users, which often shows up as a dead click style failure mode
    • A third-party script throws and breaks the page state, even if your code did not error.

    The error is device or input specific (mobile keyboard behavior, autofill, locale formatting).

    Common failure mode: replay shows the symptoms, not the root cause

    A typical trap is assuming replay replaces instrumentation.

    Replay can show that the “Place order” click did nothing, but it may not show why a promise never resolved, which request timed out, or which blocked script prevented handlers from binding. If you treat replay as proof, you can blame the wrong component and ship the wrong fix.

    Use replay as context. Use error events, network traces, and reproducible steps as confirmation.

    When session replay does not help (and can slow you down)

    Replay is a poor fit when the error already contains the full story.

    If the stack trace clearly points to a deterministic code path and you can reproduce locally in minutes, replay review is usually overhead.

    Decision rule: if this is true, skip replay first

    If you already have all three, replay is rarely the fastest step:

    1. reliable reproduction
    2. clean stack trace with source maps
    3. known affected UI state

    In those cases, fix the bug, add a regression test, and move on.

    Replay can also be misleading when:

    • the session is partial (navigation, SPA transitions, or blocked capture)
    • the issue is timing related (race conditions that do not appear in the captured UI)
    • privacy masking removes the exact input that matters (for example, address formatting)

    The point is not “replay is bad.” The point is that replay is not the default for every error.

    Which JavaScript errors are worth replay review in checkout

    This is the missing piece in most articles: prioritization.

    Checkout pages can generate huge error volume. If you watch replays for everything, you will quickly stop watching replays at all.

    Use a triage filter that connects errors to impact, and if you want the broader framework behind this, use the impact-based frontend error monitoring triage workflow

    A simple prioritization table for checkout

    Error signalLikely impact on checkout completionReplay worth it?What you’re trying to learn
    Error occurs on checkout route and correlates with step drop-offHighYesWhat UI state or sequence triggers it
    Error spikes after a release but only on a single browser/deviceMedium to highOftenWhether it is input or device specific
    Error is from a third-party script but blocks interactionHighYesWhat broke in the UI when it fired
    Error is noisy, low severity, happens across many routesLowUsually noWhether you should ignore or de-dupe it
    Error is clearly reproducible with full stack traceVariableNot firstConfirm fix rather than discover cause

    This is also where a platform’s ability to connect errors to sessions matters more than its feature checklist. You are trying to reduce “unknown unknowns,” not collect more telemetry.

    A 3-step workflow to debug checkout drop-offs with session replay

    This is a practical workflow you can run weekly, not a one-off incident play.

    1. Start from impact, not volume.
      Pick the checkout step where completion dropped, then pull the top errors occurring on that route and time window. The goal is a short shortlist, not an error dump.
    2. Use replay to extract a reproducible path.
      Watch just enough sessions to identify the smallest sequence that triggers the failure. Write it down like a test case: device, browser, checkout state, inputs, and the exact click path.
    3. Confirm with engineering signals, then ship a guarded fix.
      Validate the hypothesis with stack trace plus network behavior. Fix behind a feature flag if risk is high, and add targeted alerting so the error does not quietly return.

    Practical constraint: the fastest teams limit replay time per error

    Put a time box on replay review. If you do not learn something new in a few minutes, your next best step is usually better instrumentation, better grouping, or a reproduction harness.

    How to tell if replay is actually improving checkout completion

    Teams often claim replay “improves debugging” without measuring it. You can validate this without inventing new metrics.

    What to measure in plain terms

    Track two things over a month:

    • Time to a credible hypothesis for the top checkout-breaking errors (did replay shorten the path to reproduction?)
    • Checkout completion recovery after fixes tied to those errors (did the fix move the KPI, not just reduce error counts?)

    If error volume drops but checkout completion does not recover, you may be fixing the wrong problems.

    Common mistake: optimizing for fewer errors instead of fewer failed checkouts

    Some errors are harmless. Some failures never throw. Checkout completion is the scoreboard.

    Treat replay as a tool to connect engineering work to customer outcomes, not as a new backlog source.

    When to use FullSession for checkout completion

    If your KPI is checkout completion, you need more than “we saw an error.”

    FullSession is a fit when:

    • you need errors tied to real sessions so engineers can see the UI state that produced checkout failures
    • you need to separate noisy JavaScript errors from conversion-impacting errors without living in manual video review
    • you want a shared workflow where engineering and ecommerce teams can agree on “this is the bug that is costing orders”

    Start with /solutions/checkout-recovery if the business problem is lost checkouts. If you are evaluating error-to-session workflows specifically, the product entry point is /product/errors-alerts.

    If you want to see how this would work on your checkout, a short demo is usually faster than debating tool categories. If you prefer hands-on evaluation, a trial works best when you already have a clear “top 3 checkout failures” list.

    FAQs

    Does session replay replace JavaScript error tracking?

    No. Error tracking is still the backbone for grouping, alerting, and stack-level diagnosis. Replay is best as context for high-impact errors that are hard to reproduce.

    Why can’t GA4 show me checkout JavaScript errors?

    GA4 is built for behavioral analytics and event reporting, not runtime exception capture and debugging context. You can push custom events, but you still won’t get stacks and UI state.

    Should we review a replay for every checkout error?

    Usually no. Prioritize errors that correlate with checkout step drop-offs, release timing, device clusters, or blocked interactions.

    What if replay is masked and I can’t see the critical input?

    Then replay might still help you understand sequence and UI state, but you may need targeted logging or safer instrumentation to capture the missing detail.

    How do we avoid replay becoming a time sink?

    Use time boxes, focus on impact-linked errors, and write down a reproducible path as the output of every replay review session.

    What is the fastest way to connect an error to revenue impact?

    Tie errors to the checkout route and step-level funnel movement first. If an error rises without a corresponding KPI change, it is rarely your top priority.

  • How to Get More Conversions on Shopify: 9 Expert Tips for Success

    How to Get More Conversions on Shopify: 9 Expert Tips for Success

    Increasing your conversion rate is key to your Shopify store success. A higher conversion rate means more sales, improved ROI and a healthy online business. But how can you turn more of your visitors into paying customers?

    In this ultimate guide, you’ll learn:

    • How to optimize your Shopify store 
    • How to get more conversions on Shopify
    • How to optimize user experience and build trust
    • How to decrease cart abandonment and sell more

    We’ll also introduce you to FullSession, an all-in-one user behavior analytics software that helps Shopify store owners like you capture and visualize all user engagement, analyze trends and patterns with laser precision and optimize online shops for peak performance to drive conversions.

    You can start a free trial or get a demo to learn more.

    Let’s begin with our tips and strategies to help you maximize your Shopify store’s potential.

    Understanding Conversion Rate Optimization (CRO)

    Conversion rate formula

    Image source: Hubspot

    Conversion Rate Optimization (CRO) helps you grow the percentage of website visitors who take an expected action, such as buying, subscribing to a newsletter or adding a product to a cart.

    For Shopify stores, CRO is about analyzing user behavior, identifying friction points and making changes to improve the user experience and get more sales.

    Why CRO matters for Shopify stores

    CRO impacts your bottom line. Increasing the percentage of visitors who buy your products can grow your revenue without boosting traffic. That means you’re getting more out of your existing marketing efforts and a better return on investment.

    CRO links to improving the user experience. As you optimize for conversions, you’re also making your store more user-friendly, intuitive and appealing to your customers. It means more sales, customer loyalty and repeat business.

    A Shopify store optimized for CRO provides a smooth and frictionless shopping experience that sets you apart from the competition. 

    A data-driven approach to decision-making helps you improve your store’s design, products and marketing based on real user behavior and preferences.

    Key metrics to track Shopify store performance

    You need to monitor and measure the key performance indicators (KPIs) to optimize your Shopify store conversion rate.

    Here are the top ten metrics to track:

    1. Conversion Rate: Percentage of visitors who take an expected action.
    2. Average Order Value (AOV): Average amount spent per transaction.
    3. Cart Abandonment Rate: Percentage of users who add products to the cart but don’t checkout.
    4. Bounce Rate: Percentage of visitors who exit your site after viewing one page.
    5. Time on Site: How long visitors stay in your store.
    6. Pages per Session: Number of pages visited in one session.
    7. Revenue per Visitor: Amount of revenue generated per visitor to your store.
    8. Add to Cart Rate: Percentage of visitors who add products to the cart.
    9. Checkout Completion Rate: Percentage of users who start checkout and complete the transaction.
    10. Customer Lifetime Value (CLV): Total revenue you can expect from one customer during your business relationship.

    Now that we have covered the basics, let’s begin with the best strategies on how to get more conversions on Shopify.

    1) Improve User Experience

    User experience statistics

    Image source: UserGuiding

    Improving the user experience on your Shopify store is key for ensuring that visitors have a seamless, engaging, and satisfying journey from browsing to checkout.

    Optimize site speed and performance

    A fast-loading website is essential for keeping visitors engaged and converting on ecommerce sites. Slow-loading pages can increase bounce rates and cost you sales.

    To optimize your Shopify store speed:

    1. Compress images
    2. Minify HTTP requests
    3. Use a CDN
    4. Implement browser caching
    5. Reduce the number of apps and plugins

    Remember, a second delay in page load time can reduce conversions by 7%.

    Create a user-friendly navigation structure

    A clear navigation structure helps visitors find what they’re looking for quickly. 

    Consider these tips:

    1. Use clear, descriptive category names
    2. Implement a logical hierarchy
    3. Include a search function
    4. Use breadcrumbs for easy backtracking
    5. Limit the number of main categories to avoid overwhelming users

    Effective navigation can increase conversions by 18.5%, making it a top priority in your store design.

    Implement responsive design for mobile users

    Mobile commerce is rising, so your Shopify store must be fully responsive. A responsive design:

    1. Adapts to different screen sizes
    2. Improves mobile user experience
    3. Increases mobile conversions
    4. Boosts SEO
    5. Reduces mobile bounce rates

    Mobile-friendly sites are 67% more likely to convert visitors into buyers, so responsive design is non-negotiable.

    Use FullSession session recordings and replays to find UX issues

    FullSession session recording and replay tools

    FullSession session recordings and replays capture all user interactions on your site, including mouse movements, clicks, scrolls and form inputs. 

    This shows you how users navigate your store so you can see your site through your customer’s eyes and identify conversion blockers.

    Analyze user behavior patterns

    With session recording tools, you can:

    • See common navigation paths
    • Spot where users hesitate or get lost
    • See how users interact with different elements of your site
    • See patterns in successful vs. unsuccessful sessions

    It is a goldmine for making data-driven decisions about your store’s layout and functionality.

    Find and fix pain points

    Session replays help you find specific issues that are blocking conversions:

    • Broken links or buttons
    • Confusing content
    • Design elements that distract or annoy users
    • Form fields that users struggle with

    Once you’ve found these pain points, you can fix them to improve the customer journey and increase conversions.

    With these UX improvements and FullSession’s analytics tools, you can make a Shopify store that attracts visitors and converts them into customers. 

    Analyze User Behavior in Real-Time

    Discover how our session recordings and replays help you capture the entire user journey.

    2) Optimize Product Pages

    Image source: Whidegroup

    Product pages serve as the primary showcase for your offerings and directly influence purchasing decisions.

    Write compelling product descriptions

    Optimized product descriptions are key to converting browsers into buyers. To write good descriptions:

    1. Focus on benefits, not features
    2. Use persuasive language that appeals to emotions
    3. Include specific details
    4. Address customer concerns or objections
    5. Optimize for SEO with relevant keywords

    High web page quality is important for user engagement and conversions.

    Excellent product descriptions can increase conversions by up to 78%, making them a key element on your product pages.

    Use high-quality product images and videos

    Visual content is a big part of the purchasing decision and is critical to your online store’s success.

    High-quality product images and videos can greatly increase the product appeal as they help customers visualize items they want to buy.

    • Use high-resolution images from multiple angles
    • Include zoom for detailed views
    • Show products in context or in use
    • Create short product videos
    • Consider 360 product views for complex items

    Products with videos can increase sales by up to 144%, making visual content a conversion driver.

    Use FullSession heatmaps to optimize the product page layout

    FullSession click map

    FullSession website heatmap tools visually represent all user interactions on your online store. They use color-coding to show cold spots and dead zones so you can test different page elements, validate design changes, and improve your website’s visual hierarchy.

    FullSession provides click maps, scroll maps, and mouse heatmaps with instant data processing, and without affecting your store performance.

    Learn how to read a heatmap.

    Identify areas of high and low engagement

    FullSession mouse heatmap

    By looking at UX heatmaps, you can:

    • Identify the most viewed product images
    • Determine which parts of your product descriptions attract readers
    • Assess whether customers click your “Add to Cart” buttons frequently enough
    • Spot areas of the page that customers ignore

    It is critical for optimizing your product page layout and content hierarchy.

    Make data-driven design

    FullSession scroll map

    Use the heatmap insights to:

    • Move key elements to make them more visible
    • Adjust the layout to guide users to important info
    • Remove or redesign elements that aren’t getting engagement
    • Test different button placements

    For example, if your heatmap shows users not scrolling far enough to see important product details, you can move that info above the fold.

    FullSession’s heatmap feature allows you to make design decisions on your product page based on real user behavior, not assumptions. It leads to big data-driven improvements in your product page performance and conversions.

    3) Optimize Product Recommendations

    Product recommendation statistics

    Image source: Clerk.io

    Research by McKinsey & Company indicates that product recommendations can boost conversion rates by up to 300%. Let’s explain how to optimize your product recommendation strategy.

    Implement personalized recommendations

    Personalized recommendations can improve the shopping experience:

    1. Use AI-powered recommendation engines to analyze user behavior
    2. Implement “Recommended for You” sections based on browsing history
    3. Suggest products based on past purchases
    4. Create personalized email recommendations
    5. Use collaborative filtering to recommend products popular with similar customers

    A study by Barilliance found that personalized product recommendations can account for up to 31% of e-commerce revenue, highlighting their potential impact on your Shopify store’s performance.

    Use cross-selling and upselling techniques

    Strategic cross-selling and upselling can increase order value:

    1. Suggest complementary products on product pages
    2. Offer bundle deals with related items
    3. Recommend higher-priced alternatives on product pages
    4. Use post-purchase recommendations for follow-up sales
    5. Implement “Complete the Look” suggestions for fashion items

    According to Hubspot, the probability of selling to an existing customer is between 60-70%, while the likelihood of selling to a new prospect ranges from 5-20%. This contrast shows the importance of nurturing existing customer relationships through these methods.

    Showcase best-selling products

    Showcasing popular items can guide customers to purchase:

    1. Create a “Best Sellers” category in your navigation menu
    2. Display “Popular Items” on your homepage
    3. Show “Trending Now” sections in relevant product categories
    4. Use “Customer Favorites” in email marketing campaigns
    5. Add “Often Bought Together” suggestions for popular combinations

    Monetate reported that customers who interacted with product recommendations experienced an average cart value boost of 5.5%. Best-sellers often feature in these recommendations, contributing to higher overall spending.

    Use FullSession’s user behavior data for better recommendations

    FullSession user behavior data

    FullSession gives you plenty of data to optimize your recommendation strategy.

    Analyze product viewing patterns

    Use FullSession’s e-commerce analytics tools to:

    • Identify which products are most frequently viewed together
    • Determine the average time spent on different product pages
    • Analyze the path users take through your product catalog
    • Spot patterns in product interest across different user segments

    This will help you create more relevant product recommendations and increase customer engagement.

    Identify frequently paired items

    Leverage user behavior tools to:

    • Discover which products are often added to cart together
    • Analyze successful cross-sell and upsell combinations
    • Identify complementary products that users frequently purchase
    • Spot opportunities for new bundle offerings

    Understanding these patterns helps you optimize your cross-selling and upselling strategies.

    Optimize recommendation placement using heatmaps

    Use FullSession UX research tools to:

    • Determine the most viewed areas of your product pages
    • Identify the optimal placement for recommendation sections
    • Analyze how users interact with existing recommendation modules
    • Test different layouts and designs for recommendation displays
    • Measure the impact of recommendation placement on click-through rates

    Use FullSession heatmaps to position your recommendations where they’re most likely to catch users’ attention and drive conversions.

    Continuously test and refine your recommendation tactics based on the insights you gather, and don’t be afraid to experiment with different approaches. 

    Improve Your Website UX and UI

    Learn how FullSession’s interactive heat maps help you find cold spots and dead zones on your site.

    4) Use Social Proof

    ecommerce social proof statistics

    Image source: SMB Guide

    Social proof is a powerful psychological trigger that can increase conversions by showing the positive experiences of other customers. Let’s look at how to use social proof in your Shopify store

    Display customer reviews and ratings

    Customer reviews and ratings are valuable to potential customers and can sway purchasing decisions. Use them effectively:

    1. Show star ratings on product pages
    2. Feature detailed reviews that highlight product benefits
    3. Make the review system easy for customers to use
    4. Ask customers to review products after purchase
    5. Respond to positive and negative reviews professionally

    Products with reviews are 270% more likely to be purchased than those without, showing the importance of this social proof element.

    Showcase user-generated content

    User-generated content (UGC) is authentic visual proof of your product in use. 

    1. Create a branded hashtag for customers to share their photos
    2. Show customer photos on product pages
    3. Use UGC in your social media marketing
    4. Run contests to get more UGC
    5. Use UGC in email marketing campaigns

    Approximately 70% of consumers consider UGC reviews or ratings before making a purchase, and 93% believe that UGC is very helpful when deciding what to buy.

    Implement trust badges and security seals

    Trust badges and security seals can reassure customers their personal and financial info is safe. Use them effectively:

    1. Show SSL certificates
    2. Show logos of trusted payment providers
    3. Include industry-specific certifications or awards
    4. Use trust seals from recognized security companies
    5. Place trust elements near critical conversion points, like the checkout button

    According to a survey by Econsultancy, 48% of respondents indicated that trust badges reassured them about the security and trustworthiness of a website, showing their importance for building customer confidence.

    Use FullSession’s website feedback forms to get testimonials

    FullSession website feedback forms

    FullSession’s customer feedback collection tools help you gather customer testimonials to improve your store. To get useful testimonials:

    • Keep forms short and sweet
    • Mix rating scales and open ended questions
    • Ask specific questions about the customer’s experience
    • Allow customers to opt in to be featured publicly
    • Time the form to appear after a positive interaction (e.g. a successful purchase)

    Review customer feedback report

    FullSession customer feedback report

    Once you start getting reviews, analyze the customer feedback report:

    • Look for common themes in positive responses
    • Identify specific product features or service aspects customers love
    • Pay attention to the language customers use to describe their experience
    • Use FullSession’s analytics to see trends in feedback over time
    • Watch the connected session recording to better understand the comments
    • Categorize feedback to see areas of strength and opportunities for improvement

    Add positive feedback to your store

    Use the feedback you get to:

    • Show short, punchy quotes on product pages
    • Create a testimonials page
    • Use customer stories in your marketing materials
    • Share feedback on social media
    • Include testimonials in email marketing campaigns

    Remember to update your social proof regularly and be transparent about collecting and showing customer feedback. With these practices in place, you’ll be on your way to more conversions and a loyal customer base for your Shopify store.

    Boost Customer Satisfaction and Experience

    Learn how our customer feedback tools help you identify recurring issues and user needs.

    5) Implement Live Chat to Improve Customer Support

    live chat for ecommerce customer support

    Image source: Velaro

    Customer support can have a big impact on your conversion rates by answering customer questions and building trust. Let’s see how to set up a solid support system with live chat and FullSession.

    Choose a live chat provider

    Choosing the right live chat tool is crucial for your Shopify store:

    1. Consider integration capabilities with Shopify 
    2. Look for features like chat routing, canned responses, and analytics
    3. Ensure mobile compatibility for on-the-go management
    4. Check for customization options to match your brand
    5. Evaluate pricing based on your expected chat volume

    LiveChat is a popular choice with great features and easy Shopify integration.

    Train customer support reps

    Well-trained support staff can make a big difference in customer experience:

    1. Provide comprehensive product knowledge training
    2. Develop clear communication guidelines and best practices
    3. Train on using the live chat software effectively
    4. Teach problem-solving and de-escalation techniques
    5. Regularly update training based on common customer issues

    Improving customer experience can lead to a 2-7% increase in sales revenue and a 2% increase in profits for businesses that prioritize customer service.

    Use chatbots for 24/7 support

    Chatbots can provide 24/7 support and reduce response times:

    1. Implement chatbots to handle common queries and FAQs
    2. Use AI-powered chatbots for more complex interactions
    3. Set up chatbots to qualify leads before transferring to human agents
    4. Create a seamless handoff process from bot to human support
    5. Continuously improve chatbot responses based on user interactions

    Chatbots can handle 80% of routine customer service questions, so your human agents can focus on complex issues.

    Use FullSession’s session recordings with customer feedback tools 

    FullSession session recordings

    FullSession’s session recordings, when combined with customer feedback tools, offer powerful insights for e-commerce support teams.

    Visualize customer experiences 

    Use FullSession’s behavior tracking to:

    • Watch the exact user journey that led to a support request or feedback
    • Observe how customers interact with your site before contacting support
    • Identify specific elements or pages that cause confusion or frustration
    • See technical glitches or UX issues in real-time as the customer experiences them

    This visual context helps support teams understand and address issues more effectively, improving response accuracy and resolution times.

    Improve issue detection and resolution

    Use FullSession’s data to:

    • Quickly replicate and verify reported problems by viewing customer actions
    • Identify patterns in user behavior that frequently result in support tickets
    • Recognize website areas or features that consistently generate negative feedback
    • Assess the effectiveness of current help resources and FAQs

    By gaining deeper insights into the root causes of customer issues, support teams can resolve problems more efficiently and prevent recurring problems.

    Create proactive support strategies

    Use FullSession insights to:

    • Create targeted help content for common pain points identified in recordings
    • Implement chatbot triggers on pages that frequently generate support requests
    • Develop more effective onboarding processes for new customers
    • Suggest improvements to product descriptions or site content to reduce confusion
    • Design guided tours or tooltips for areas where users often struggle

    FullSession helps you create a customer support strategy that fixes issues and drives conversions. Optimize your processes, train your team and improve your chatbot responses. Turn your support center into a conversion tool for your Shopify store.

    6) Optimize for Mobile Shopping Experience

    Mobile shopping experiences

    Image source: Miquido

    With mobile shopping on the rise, optimizing your Shopify store for mobile users is key. Let’s explain how to improve their mobile shopping experience and use FullSession’s insights to boost mobile conversions.

    Ensure a mobile-responsive design

    A mobile responsive design is key to a good mobile user experience:

    1. Use a responsive Shopify theme or customize your current theme
    2. Ensure all elements resize and reposition appropriately on smaller screens
    3. Optimize images and media for faster loading on mobile devices
    4. Use legible fonts and appropriate text sizes for mobile viewing
    5. Implement touch-friendly buttons and interactive elements

    Mobile-friendly websites can achieve a 40% higher conversion rate than those that are not optimized for mobile use. It improves the user experience and search engine rankings.

    Streamline mobile navigation

    Simplified navigation is key for mobile users:

    1. Use a clear and easily accessible menu icon (hamburger menu)
    2. Display search bar at the top of the page
    3. Simplify category structure for mobile users
    4. Use infinite scroll or “load more” buttons instead of pagination
    5. Use sticky headers for quick access to navigation elements

    Websites that implement effective mobile navigation strategies can experience conversion rates increase by up to 15% when combined with fast loading times.

    Optimize mobile checkout

    A streamlined mobile checkout will reduce cart abandonment:

    1. Implement a single-page checkout for mobile users
    2. Use autofill for forms to reduce typing on mobile devices
    3. Offer mobile-friendly payment options like Apple Pay or Google Pay
    4. Ensure error messages are clear and easily fixable on mobile
    5. Provide a guest checkout option to speed up the process

    A smooth and optimized mobile checkout process can increase conversions by up to 35.62%. This highlights its critical role in driving sales on mobile devices.

    Use FullSession’s mobile session recordings for improvements

    FullSession mobile session recordings

    FullSession mobile session recordings can give you valuable insights for mobile optimization.

    Analyze mobile-specific user behavior

    Use FullSession’s mobile session recordings to:

    • Observe how users navigate your mobile site
    • Identify which elements users interact with most frequently
    • Analyze the path users take through your mobile checkout process
    • Determine which products or categories are most popular on mobile

    This data can help you tailor your mobile experience to user preferences and behaviors.

    Identify mobile usability issues

    Use FullSession to:

    • See where users seem to struggle or hesitate
    • Identify forms or interactive elements that are hard to use on mobile
    • Detect pages or elements that load slowly on mobile devices
    • Recognize patterns in cart abandonment on mobile

    Detecting these issues helps you prioritize mobile experience improvements.

    Implement mobile-specific optimizations

    Based on FullSession analysis, you can:

    • Redesign problematic page elements for better mobile usability
    • Implement mobile-specific features like swipe gestures or touch-friendly controls
    • Create mobile-optimized product pages with key information easily accessible
    • Develop mobile-specific promotional strategies based on observed behavior
    • Continuously test and refine your mobile user interface

    With ongoing optimization and mobile user needs at the forefront you can increase your mobile conversion rates and capture more of the growing mobile e-commerce market.

    7) Address Cart Abandonment

    cart abandonment rate stats

    Image source: Webuters

    Cart abandonment is a big problem for e-commerce sites, but also an opportunity to recover lost sales. Let’s share e-commerce conversion optimization strategies to help you reduce cart abandonment and show you how to use FullSession for better results.

    Implement exit-intent popups

    Exit-intent popups can catch visitors who are about to leave your site:

    1. Offer a discount or free shipping to complete the purchase
    2. Use persuasive copy to address the common objections
    3. Add countdown timer to create urgency
    4. Ask for email addresses for abandoned cart follow-ups
    5. Customize the popup message based on cart value or items

    Exit-intent popups can recover 10-15% of lost website visitors, allowing you to re-engage potential customers just as they are about to leave the site.

    Create compelling cart abandonment emails

    Well-designed abandonment emails can remind customers of their forgotten cart:

    1. Send a series of 2-3 emails over a few days
    2. Use attention-grabbing subject lines
    3. Include images of the abandoned items
    4. Offer a time-limited discount to encourage quick action
    5. Provide clear, prominent calls to action to return to the cart

    Cart recovery emails significantly outperform standard email campaigns with an average conversion rate of 8.76%

    It confirms their effectiveness in re-engaging potential customers who have shown interest but haven’t completed their purchase.

    Offer cart saving options

    Allowing customers to save their cart can lead to future purchases:

    1. Implement a “save for later” feature
    2. Enable guest cart saving with email capture
    3. Sync carts across devices for logged-in users
    4. Send reminders about saved carts after a set period
    5. Display recently saved items prominently on return visits

    Integrating financial incentives like discounts or coupons into your cart saving features can boost conversion rates, motivating hesitant shoppers to finalize their purchases.

    Use FullSession’s session recordings to understand abandonment reasons

    FullSession session recordings can give you valuable insights into why customers are abandoning their cart:

    Analyze user behavior leading to cart abandonment

    Use FullSession’s session recordings and replays to:

    • Observe the path users take before abandoning their carts
    • Identify which pages or elements users interact with most before leaving
    • Analyze the time spent on each step of the checkout process
    • Detect patterns in user behavior that frequently lead to abandonment

    This will help you understand the context of cart abandonment and inform your prevention strategies.

    Identify common exit points

    Use FullSession customer journey analytics to:

    • Pinpoint the specific steps in the checkout process where users most often leave
    • Recognize which product pages have the highest abandonment rates
    • Identify any error messages or form fields that frequently precede abandonment
    • Analyze the impact of shipping costs or delivery times on abandonment rates

    By understanding where and why users are leaving, you can focus your optimization efforts more effectively.

    Implement targeted interventions to reduce abandonment

    Based on FullSession website visitor tracking:

    • Simplify steps in the checkout process that are causing friction
    • Add reassurance messaging at key abandonment points
    • Create exit intent popups for specific abandonment scenarios
    • Improve product pages or descriptions for high-abandonment items
    • Develop personalized retargeting strategies based on abandonment patterns

    With continuous optimization and focusing on the specific pain points you’ve identified through your analysis, you can improve your cart completion rates and overall conversion rates.

    8) Streamline the Checkout Process

    checkout process stats

    Image source: WebScoot

    A smooth checkout is key to converting interested shoppers into paying customers. Let’s look at how to optimize this part of the journey.

    Simplify the checkout form

    A long checkout form can cause cart abandonment. To simplify your checkout:

    1. Minimize the number of form fields
    2. Use auto-fill where possible
    3. Implement real-time form validation
    4. Group related information together
    5. Show a progress indicator for multi-step checkouts

    Research from HubSpot indicated that reducing the number of form fields from 4 to 3 led to an increase in conversion rates by nearly 50%.

    Offer guest checkout options

    Requiring account creation can be a big barrier to purchase. Consider the following:

    1. Provide a guest checkout option
    2. Offer account creation after purchase completion
    3. Explain the benefits of creating an account
    4. Use social login options for quick account creation
    5. Allow easy conversion from guest to registered user

    According to the Baymard survey, 35% of users abandon shopping carts because websites require them to create an account. With the guest checkout option, you can significantly reduce this abandonment rate.

    Provide multiple payment options

    Offer free shipping and different payment methods for Shopify conversion rate optimization:

    1. Accept major credit cards
    2. Integrate digital wallets like PayPal, Apple Pay, and Google Pay
    3. Consider buy now, pay later options 
    4. Include local payment methods for international customers
    5. Ensure all payment options are clearly displayed

    A report indicated that 70% of consumers prefer to shop with retailers that offer multiple payment options, showcasing the importance of flexibility in meeting customer expectations and improving their shopping experience.

    Use FullSession’s conversion funnel analysis to optimize checkout flow

    FullSession conversion funnel analysis

    FullSession’s conversion funnel analysis is a powerful tool for finding and fixing issues with your checkout. Here’s how to use it.

    Setup conversion funnels

    Conversion funnel analysis allows you to track the customer journey from product page to purchase completion. To set up funnels:

    • Define the steps in your checkout process
    • Collect user behavior data for each step
    • Conduct an effort analysis 

    Find drop-off points

    FullSession helps you build an e-commerce conversion funnel that works:

    • Pinpoint where customers are abandoning the checkout process
    • Compare conversion rates between different stages
    • Identify unexpected paths customers are taking
    • Spot differences in behavior between new and returning customers

    It will help you focus your optimization efforts on the most important parts of your checkout flow.

    Make changes based on funnel data

    Use CRO tools to make targeted changes:

    • Address issues at stages with high drop-off rates
    • Streamline steps where customers are spending too much time
    • Test different layouts or designs for problematic stages
    • Implement personalized interventions at critical points

    For example, if you see a high drop-off at the shipping info stage, consider adding an address autocomplete feature to make this step easier for customers. 

    Remember, even small improvements in your checkout conversion rate can mean significant revenue for your Shopify store.

    Maximize Your Conversion Rate

    See how our CRO tools help you improve website performance to drive conversions.

    9) Promotional Strategies to Boost Conversions

    ecommerce promotional strategies

    Image source: Freepik

    Strategic promotions can be a powerful tool to drive sales and conversions on your Shopify store. Let’s explore effective promotional tactics and how to optimize them with FullSession data.

    Create compelling discounts and offers

    Discounts and offers can drive purchases and create value for customers:

    1. Offer percentage-based or dollar-amount discounts
    2. Create bundle deals or “buy one, get one” offers
    3. Implement tiered discounts based on purchase amount
    4. Provide exclusive discounts for first-time buyers or loyalty program members
    5. Use exit-intent popups with special offers to reduce cart abandonment

    Discounts and special offers increase customer engagement and boost conversion rates by making purchases more appealing.

    Implement free shipping thresholds

    Free shipping can be a big motivator for customers to complete purchases:

    1. Set a minimum spend for free shipping
    2. Display free shipping threshold throughout the site
    3. Offer free shipping on specific products or categories
    4. Test different threshold amounts to find the sweet spot
    5. Use free shipping as a limited-time offer to create scarcity

    Free shipping is still a big conversion driver with many customers looking for this offer.

    Run limited-time promotions

    Create urgency to encourage customers to act fast:

    1. Implement flash sales for short periods
    2. Create seasonal promotions tied to holidays or events
    3. Use countdown timers to highlight the end of a promotion
    4. Offer exclusive “members-only” deals for a limited time
    5. Run “deal of the day” promotions to encourage repeat visits

    Limited-time offers can increase conversions by creating scarcity and getting customers to make quicker decisions.

    Optimize promotional timing with FullSession data

    FullSession user behavior analytics

    FullSession helps you optimize your promotional strategy. You can create personalized promotions that speak directly to individual customer interests, increasing the likelihood of conversion.

    Identify peak conversion times

    Use FullSession to:

    • See the days and times your store converts the most
    • Identify seasonal trends in buying behavior
    • Spot patterns in conversion rates across product categories
    • Analyze how conversion rates vary by customer segment

    This will help you adjust the time of your promotions for maximum impact.

    Tailor promotions to user behavior

    Use FullSession behavior analytics to:

    • Create targeted promotions based on common user paths through your site
    • Develop promotions that address specific pain points in the customer journey
    • Customize promotional messaging for different user segments
    • Use behavioral triggers to deliver personalized promotions

    You can make your promotions more relevant and effective by matching them to user behavior.

    Measure promotional impact on conversions

    Use FullSession with your Shopify analytics to:

    • See how different promotions affect your overall conversion rate
    • Measure promotional impact on average order value
    • See how promotions impact customer acquisition and retention
    • Compare different promotional strategies
    • Evaluate the long-term effects of promotions on customer behavior

    Test and refine as you go, and don’t be afraid to get creative with your promotions. You can create a conversion-boosting strategy for your Shopify store with the right mix of offers and data-driven timing.

    Final Words About How to Get More Conversions on Shopify

    FullSession user behavior analytics software

    So there you have it, the full guide on how to increase conversions on Shopify. These steps will help you convert visitors into customers and get the most out of your online store.

    Remember, conversion rate optimization is not a one-time task; the e-commerce landscape and customer preferences and behavior are always changing. To stay ahead and keep improving your conversion rates:

    1. Analyze your store’s metrics regularly
    2. Stay up to date with e-commerce trends and best practice
    3. Test new ideas and improve existing strategies
    4. Listen to customer feedback and adjust
    5. Use FullSession user behavior data to inform your decisions

    With FullSession, you can get to the bottom of how visitors interact with your store, find the pain points in the user journey and make data-driven decisions to improve your conversion rates.

    Remember, conversion rate optimization is not just about implementing these strategies; it’s about doing so in a way that’s relevant to your audience and continuously refined by real user data.

    FullSession gives you the user behavior tools to do just that: create a Shopify store that attracts visitors and converts them into loyal customers.

    As you go ahead with your optimization efforts, remember that even minor improvements can add up to considerable revenue. Be patient and persistent, and always let the data guide your decisions.

    With the right approach and FullSession by your side, you’re ready to grow your e-commerce business!

    Drive Revenue Growth With FullSession

    Learn how to visualize and improve each step in your sales or marketing funnel.

    FAQs on How to Get More Conversions on Shopify

    Let’s answer the most common questions on how to increase your conversions on Shopify.

    How to increase Shopify conversion rate?

    To increase your Shopify conversion rate, focus on optimizing your store’s user experience across all devices. It includes improving site speed, creating compelling product pages with high-quality images and clear descriptions, and streamlining checkout. 

    Implement trust signals like customer reviews and security badges, and offer clear pricing information. Use strategies like exit-intent popups and abandoned cart emails to recover potential lost sales. 

    Provide excellent customer support, personalize the shopping experience, and create a sense of urgency with limited-time offers. 

    Continuously analyze user behavior and A/B test key elements to identify areas for improvement. Remember, even small increases in conversion rate can significantly impact your bottom line.

    How do I make my Shopify store convert? 

    Make your Shopify store convert by having a user-friendly design, clear value proposition, great customer support, optimizing for mobile users and testing and refining your site based on user behavior data.

    How do I increase my conversion rate?

    Increase your conversion rate by addressing cart abandonment, personalizing the shopping experience, providing multiple payment options, and including product recommendations, targeted promotions, and discounts.

    Why is my Shopify conversion rate so low? 

    Your Shopify conversion rate might be low because of slow site speed, confusing navigation, lack of trust signals, complicated checkout or missing product information. Use analytics tools like FullSession to find out what’s going wrong and optimize your user experience accordingly.