More traffic does not automatically mean more revenue. If you’re running marketing campaigns, investing in SEO, and spending on paid ads, yet revenue stays flat, the problem probably isn’t your traffic volume. It’s what happens after visitors land on your site.
Revenue per visitor (RPV) is the metric that exposes this gap. It tells you exactly how much your site earns every time a unique visitor arrives, and it’s a cleaner measure of site effectiveness than traffic counts or raw sales figures alone.
This article explains how to increase revenue per visitor across all four key levers: traffic quality, conversion rate, average order value, and customer retention.
You’ll get specific strategies for each stage of the buyer journey, a diagnostic workflow for prioritizing what to fix first, and a look at how FullSession’s Lift AI turns behavioral data into revenue-focused action.
Key Takeaways
- Revenue per visitor (RPV) is the clearest measure of ecommerce efficiency because it combines conversion rate and average order value into one number that reflects real revenue impact.
- Traffic alone does not solve revenue problems. Low-quality or mismatched traffic increases costs while keeping RPV flat or declining.
- The biggest RPV gains come from fixing friction in the funnel, especially in discovery, product pages, and checkout, where intent is either lost or converted.
- Raising average order value through bundles, cross-sells, and upsells is often faster and cheaper than acquiring new traffic.
- Sustainable growth comes from improving multiple levers together: conversion rate, order value, retention, and traffic quality, not in isolation.
FullSession helps ecommerce teams increase revenue per visitor by identifying which sessions, devices, campaigns, and checkout steps are pulling RPV down.
Instead of guessing what to fix, your team gets a ranked list of opportunities backed by real user sessions and revenue-impact estimates.
Book a demo to see how it works.
What Is Revenue Per Visitor?
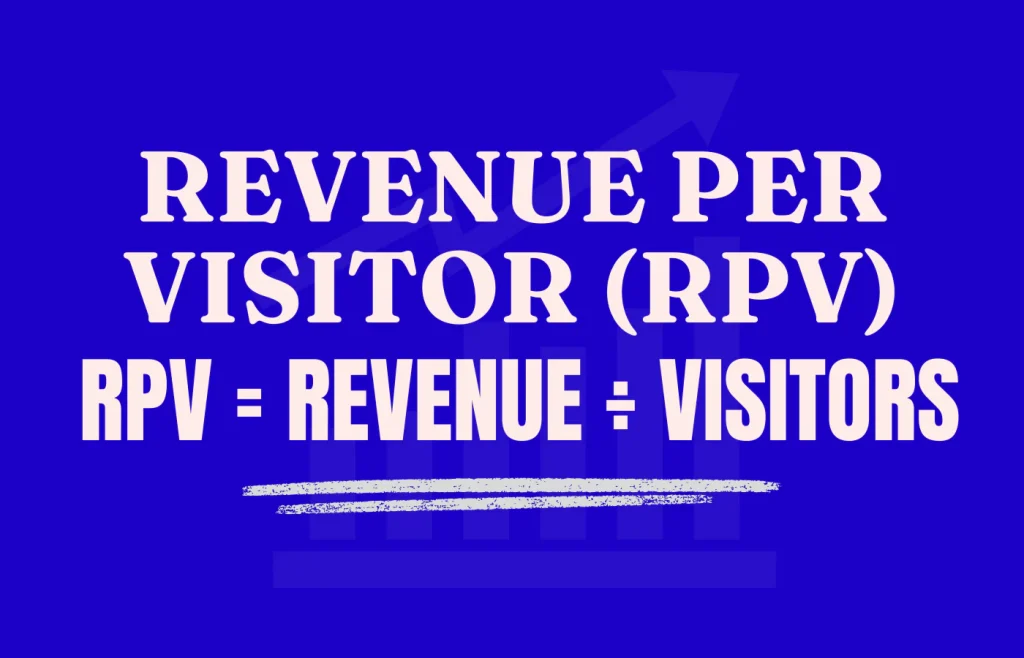
Image source: The Revenue Systems Lab
Revenue per visitor is the average revenue your store generates each time a unique visitor arrives. Use only unique visitors, not sessions or page views, so each individual person is counted once.
RPV = Total Revenue / Total Unique Visitors
A store that earns $50,000 from 10,000 unique visitors has an RPV of $5.00. That single number tells you more about site effectiveness than either traffic counts or raw sales figures alone.
The reason RPV matters more than most metrics is that it captures two things at once: how many visitors convert, and how much they spend when they do.
A boost to either one lifts RPV. A drop in either shows up immediately.
Revenue per visitor formula: Two ways to calculate it
RPV can be calculated in two useful ways.
The first is the raw formula:
RPV = Total Revenue / Total Unique Visitors
This tells you how much revenue each unique visitor generates on average.
The second makes the strategy clearer:
RPV = Conversion Rate × Average Order Value
This version shows the two direct levers that move RPV. Your revenue per visitor rises when more visitors buy, when each buyer spends more, or when both improve together.
Here’s what that looks like in practice, using a simple example:
| Scenario | Visitors | Conversion Rate | AOV | RPV |
| Baseline | 10,000 | 2.0% | $75 | $1.50 |
| Checkout fix | 10,000 | 2.4% | $75 | $1.80 |
| Checkout fix + bundles | 10,000 | 2.4% | $85 | $2.04 |
The table makes one thing obvious: small, targeted fixes compound quickly. A checkout improvement and a bundling strategy together raise RPV by 36% without adding a single new visitor.
Why Revenue Per Visitor Matters More Than Traffic Alone
Most companies track conversion rate and average order value as separate metrics, which is useful. But watching them in isolation means you can miss the bigger picture.
A promotion might lift conversion rate while dropping average spend per transaction. RPV catches that trade-off in one number, making it a cleaner signal of overall site health. This is the gap many businesses miss when they optimize conversion rate and AOV separately.
RPV also matters because acquisition is expensive.
If your RPV is $2.00 and you spend $3.00 per visitor on ads, you’re losing money on every click. The faster path to profit is increasing what your existing traffic is worth, not scaling new visitor acquisition efforts that compound a leaky funnel.
RPV vs. Related Metrics: Where It Fits in Your Analytics Stack
RPV is not a replacement for other metrics. It’s the number that connects them.
Here’s how it compares to the metrics ecommerce teams track most often:
- Conversion rate tells you the percentage of visitors who buy. RPV tells you how much money those conversions actually generate.
- Average order value (AOV) tells you what each buyer spends. RPV shows what each visitor is worth, including those who don’t buy.
- Revenue per session counts all sessions, including return visits from the same person. RPV uses unique visitors, making it a purer measure of individual visitor value.
- Customer lifetime value (CLV) measures total revenue across all purchases. RPV measures a single visit’s revenue contribution.
- Customer acquisition cost (CAC) measures what you spend to get a visitor. Comparing CAC to RPV tells you immediately whether a channel is profitable.
Tracking RPV alongside conversion rate and AOV gives you the full picture. RPV is the outcome; the other two are the inputs.
Common Reasons Ecommerce RPV Drops
Before you can fix RPV, you need to know why it dropped. The symptoms are often obvious. The cause usually isn’t.
| Symptom | Likely Cause | What to Check |
| Traffic up, revenue flat | Low-intent acquisition | RPV by traffic channel and campaign |
| Add-to-cart strong, checkout weak | Checkout friction | Funnel drop-off and session replay |
| Mobile RPV below desktop | Mobile UX issue | Mobile heatmaps, form errors, and rage clicks |
| AOV falling | Discounting or weak merchandising | Bundles, upsells, and product mix |
| Paid traffic unprofitable | CAC exceeds visitor value | RPV vs. CPC or CPA by campaign |
| Drop-off without visible cause | Silent technical errors | JavaScript errors and broken payment flows |
Run this diagnostic before touching any tactics. The fix for low-intent traffic is completely different from the fix for a broken payment method.
The Four Levers That Increase Revenue Per Visitor
Image source: Pexels
There are four levers that move RPV. Improving anyone raises it. The real gains come from improving more than one at the same time.
Traffic quality
Are the visitors arriving at your site actually interested in buying? Poorly targeted traffic drags RPV down even as traffic numbers go up.
Evaluate your visitor acquisition efforts by the RPV they produce, not the volume of clicks. A paid social campaign sending 5,000 visitors at $0.50 RPV is worth less than an email campaign sending 500 visitors at $8.00 RPV.
Identify which sources generate the highest RPV today and invest there before scaling the others.
Conversion rate
What percentage of visitors complete a purchase? Even small improvements compound across every visitor who arrives.
Conversion rate is one side of the RPV equation. The fixes are often straightforward: remove checkout friction, align landing pages with visitor intent, and fix the technical errors silently suppressing purchases for entire device or browser segments.
Average order value
How much does each buyer spend? Raising AOV doesn’t require additional visitors.
Bundles, cross-sells, upsells, and add-ons all lift basket size without changing traffic volume. This is often the fastest lever to move because it targets visitors already in buying mode.
Retention and repeat purchases
How much total revenue does each customer generate over time? A customer who buys once and never returns has low lifetime value. One who buys regularly compounds your RPV growth without additional acquisition spend.
Loyalty programs, post-purchase email sequences, and personalized re-engagement campaigns turn single transactions into ongoing revenue. They also convert new customers into repeat buyers, compounding RPV growth without additional acquisition spend.
Where Ecommerce Revenue Per Visitor Is Won or Lost

Image source: Pexels
Every interaction a visitor has with your site either moves them closer to buying or nudges them toward leaving. There are three key touchpoints that matter most.
Product discovery
Product discovery is where the buyer journey begins. If shoppers can’t find what they’re looking for quickly through search or browsing, they leave.
Show high-value items prominently using best-seller labels, trending badges, and recently viewed products. A well-structured discovery experience increases both the likelihood of purchase and the average value of what gets added to the cart.
Product pages
Your product pages are where the average order gets set. High-quality images, benefit-focused descriptions, and authentic reviews reduce hesitation.
Social proof, star ratings, review counts, and customer photos help a shopper feel certain they’re making the right choice.
A strong customer experience on the product page reduces the mental cost of the decision. Place upsell options here: a next-tier version, a natural add-on, or a bundle at a modest discount.
Cart and checkout
According to Baymard Institute, 70.19% of all shopping carts are abandoned globally. Most of that abandonment happens because something at checkout made the shopper pause: an unexpected shipping cost, required account creation, or a form that asked for too many details.
Every friction point at checkout is a direct tax on RPV. Learn more about checkout recovery and how to recapture lost revenue.
Post-purchase
Post-purchase is where single transactions become repeat customers. A confirmation email with a relevant recommendation, a loyalty program invite, or a timed re-engagement sequence can convert a one-time buyer into a long-term revenue source.
How to Find the First RPV Fix

Image source: Pexels
The strategies below work. The challenge is knowing which one to tackle first. Here’s the diagnostic workflow that identifies where in the sales funnel revenue is leaking, so you can act with precision instead of guessing.
Segment RPV by traffic source, device, campaign, and product category
Don’t analyze RPV as a single blended number. Segmentation is essential because a low overall RPV often masks a deeper problem. Mobile shoppers may be converting at half the rate of desktop shoppers, or one paid channel may be dragging performance for the entire account.
Find the weakest high-value segment
Look for the combination of high traffic volume and low RPV. That’s where the biggest revenue opportunity lives.
Locate the drop-off step in the funnel
Use conversion funnel analysis to find exactly where visitors are leaving. The funnel shows you where revenue drops. It doesn’t show you why.
Watch the sessions behind the drop-off
This is where ecommerce session replay earns its place. Pull the sessions from the segment with the drop-off and watch what shoppers actually do: where they hesitate, what they click, where they give up.
Check heatmaps and error logs
Ecommerce heatmaps reveal click and scroll patterns on product pages and checkout screens by device. Error tracking catches JavaScript errors and broken payment flows that look like abandonment in standard analytics but are actually technical failures.
A single broken payment method can collapse RPV for everyone on a specific device or browser. Error tracking surfaces these failures before they drain revenue at scale.
Prioritize fixes by expected revenue impact
Not every fix is equal. Prioritize by the size of the segment affected, the severity of the friction, and the effort required to fix it.
Ship the fix and validate with before/after RPV
Measure RPV before and after every change. If a fix doesn’t move revenue per visitor, it didn’t improve business performance, regardless of what other metrics changed.
Tactics to Increase Conversion Rate
Image source: Alphawhale
Start by auditing your checkout against what actually drives abandonment. The fixes are usually straightforward: show shipping costs early, offer guest checkout, reduce required form fields, and add express payment options.
Baymard’s research shows that the average large ecommerce business can increase checkout conversion by 35.26% through better checkout design alone. That’s recovered revenue without spending more on traffic.
Fix the errors that silently suppress RPV
JavaScript errors, broken form validation, and failed payment processing are invisible in standard analytics. They show up as drop-off without revealing their cause. The visitors affected don’t report the issue. They abandon and don’t return.
Error tracking surfaces these failures so your team can fix them before they compound.
Align your landing page with the intent of each traffic source
Traffic from a branded email campaign converts very differently from cold paid social traffic. If visitors arrive expecting a specific offer and land on a generic homepage, you’ve already lost the visit.
Align each landing page to the promise that brought visitors in. Every disconnect between ad and landing page costs you conversion rate and, therefore, revenue per visitor.
Tactics to Increase Average Order Value
Product bundles encourage customers to buy more in a single order by packaging related products at a combined price. A slight discount relative to buying those products individually removes the friction from purchasing decisions.
If many customers buy Product A and Product B within 30 days, turn that pair into a bundle priced below what the same products cost individually. This approach works especially well for small businesses because it increases revenue per transaction without requiring new products or more traffic.
Place cross-sells where shoppers are ready to add more items
Cross-sells surface complementary products at the moment purchase intent is highest. The cart page works best. A shopper who has already added something is in buying mode, and “often bought with” suggestions shown there are far more effective than pop-ups triggered after they’ve decided.
Recently viewed products nudge shoppers back to items they showed interest in without discounting or selling them anything they weren’t already considering.
Offer upsells that feel like value, not pressure
An upsell suggests a better version of what the shopper is already considering: a warranty, a premium tier or a personalization option. Keep framing benefit-led: “Protect your purchase with a two-year warranty” converts better than “Add warranty for $15.”
Match add-ons to the specific item in the cart. Personalization here lifts AOV without making the customer feel pressured or sold to.
Tactics to Improve Traffic Quality and Retention
A campaign can increase conversion rate while lowering RPV or profit if it relies too heavily on discounts. A discount-driven traffic spike that trains shoppers to wait for sales is a net negative for RPV over time.
Compare RPV against cost per click, cost per visitor, and customer acquisition cost. If a channel’s CAC exceeds its RPV, it’s destroying value, not creating it.
Build retention into your revenue model
Loyalty programs, post-purchase email sequences, and personalized re-engagement campaigns are not nice-to-haves. They’re the highest-return growth lever available to most ecommerce businesses because they compound without requiring new acquisition spend.
One customer who buys four times in a year is worth four times what a one-time buyer is worth. Track repeat purchase rate alongside RPV to see whether your retention efforts are working.
RPV Mistakes to Avoid

Image source: Pexels
These are the patterns that most commonly stall ecommerce revenue growth.
- Optimizing conversion rate with discounts while destroying AOV. A sitewide 20% off promotion may lift conversion, but drops RPV if it cuts more from order value than it adds through volume.
- Raising AOV with upsells that lower conversion. Aggressive upsell prompts at checkout can push hesitant shoppers to abandon entirely. Test upsell placement and messaging before scaling.
- Blending all traffic together. Overall, RPV can look healthy while a specific channel or device segment is deeply unprofitable. Always segment before drawing conclusions.
- Measuring sessions instead of unique visitors. Sessions count every visit, including return visits from the same person. Unique visitors count each person once. Make sure your team uses the same denominator when comparing RPV across periods.
- Declaring test winners based on clicks or add-to-cart instead of RPV. If a change doesn’t increase revenue per visitor, it didn’t meaningfully improve business performance, regardless of what other metrics moved.
- Ignoring margin and profitability. RPV measures revenue, not profit. A high-RPV traffic segment can still be unprofitable if CAC or discount depth is too high. Factor in gross margin when evaluating optimization priorities.
Quick Wins to Increase Revenue Per Visitor This Week
Not every gain requires a development sprint. These improvements can often be implemented quickly, though some may require testing, development support, or QA depending on your ecommerce platform and checkout setup.
- Add a free shipping threshold message to the cart page. “Add $15 more for free shipping” is one of the most effective incentives for lifting basket size without discounting.
- Enable guest checkout if your site requires account creation before purchase.
- Add three product recommendations to your cart page using your best-performing product pairs.
- Add one cross-sell to your highest-traffic product pages based on existing purchase data.
- Set up an abandoned cart email sequence if you don’t have one. A single follow-up email recovers additional revenue from visitors who were already close to buying.
- Check checkout on mobile for broken form validation or error messages. Many ecommerce sites have silent failures that only appear under real mobile traffic.
- Audit your highest-traffic landing page for message alignment with the source that sends the most visitors.
Each of these is a direct improvement that can produce measurable RPV gains for any specific business without additional acquisition spend.
How FullSession Helps Ecommerce Teams Improve RPV
The strategies above are proven. The challenge for most teams is knowing where to start and whether the fix worked. That’s exactly what FullSession is built for.
FullSession is a web behavior analytics platform for ecommerce teams who need to connect behavioral data to revenue outcomes. Here’s how it fits into the RPV diagnostic workflow:
- You see that RPV is down.
- You segment by device, source, campaign, landing page, or product category using funnel tracking.
- Funnel analysis shows where revenue drops.
- Session replay shows exactly what shoppers do at that step: where they hesitate, what they click and where they give up.
- Interactive heatmaps reveal engagement patterns on product pages and checkout screens by device.
- Error tracking catches JavaScript errors and broken payment flows before they compound.
- In-app feedback collects in-page responses linked to the session where they were submitted.
- Mobile session replay shows checkout issues that only appear under real mobile traffic.
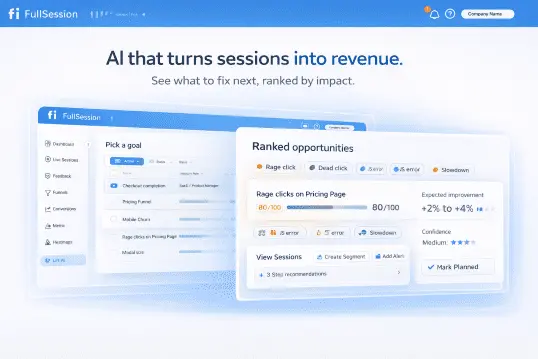
FullSession Lift AI sits on top of all of this. It is a great tool for teams that have data but lack a clear next action. You set a goal: checkout completion, revenue per visitor, or visitor-to-signup. It scans real user sessions to identify friction, failures, and slowdowns, then outputs a ranked list of opportunities.
Each opportunity includes a confidence score, an expected improvement estimate, the specific funnel step affected, and direct links to the sessions behind it.
The recommended workflow: review the opportunity and its linked sessions, ship the fix, then measure impact with a before/after RPV comparison. Lift AI provides estimates. Your data confirms the outcome.
Start a free trial to see where your revenue is leaking, or book a demo to walk through the checkout recovery workflow in detail.
Conclusion on How to Increase Revenue Per Visitor
Increasing revenue per visitor comes down to improving efficiency, not just scale. More traffic only helps when each visitor has a clear path to conversion and meaningful spend.
The biggest gains usually come from removing friction, improving intent matching, and increasing value per transaction. Small fixes in checkout flow, product discovery, and page relevance often outperform large acquisition investments.
Take a look at checkout conversion benchmarks for more information.
Over time, the real advantage comes from compounding improvements across conversion rate, order value, and retention. Teams that consistently measure RPV and act on it treat growth as a system, not a channel.
That shift turns existing traffic into a stronger revenue engine.
FullSession helps ecommerce teams do this by connecting behavioral signals to revenue outcomes and giving Growth, Product, UX, and Engineering teams a shared starting point.
Start a free trial to identify friction points, fix revenue leaks, and increase RPV across your funnel.
FAQs on How to Increase Revenue Per Visitor
What are the four ways to increase revenue?
The four core ways to maximize revenue are growing the number of customers, increasing purchase frequency, raising average order value, and reducing churn. In ecommerce, these map directly to the four RPV levers: traffic quality, conversion rate, basket size, and customer retention. Improving anyone raises revenue. Improving all four compounds growth.
What is the average revenue per visitor?
Average revenue per visitor is total revenue in a given time period divided by the total number of unique visitors during that period. RPV varies widely by category, price point, margin, and traffic mix, so your own trend is usually more useful than a generic benchmark. Focus on whether RPV is rising, flat, or falling over time.
What is the average revenue per guest?
Average revenue per guest measures how much revenue each individual visitor generates over a defined period. In ecommerce, it’s calculated as total revenue divided by the total number of unique visitors. The formula and interpretation are identical to revenue per visitor.
How do you calculate revenue per visitor?
Revenue per visitor is calculated as RPV = Total Revenue / Total Unique Visitors. If your store generated $25,000 from 5,000 unique visitors in April, your RPV is $5.00. You can also express this as RPV = Conversion Rate × Average Order Value, which makes the two levers explicit. Track RPV alongside conversion rate and AOV for a complete view of performance.
What is a good revenue per visitor for ecommerce?
A good revenue per visitor depends on your category, price point, and traffic quality. Rather than chasing a benchmark, measure your own baseline and track the direction it moves. Rising RPV over time is the signal that your optimization efforts are compounding into real growth.

Roman Mohren is CEO of FullSession, a privacy-first UX analytics platform offering session replay, interactive heatmaps, conversion funnels, error insights, and in-app feedback. He directly leads Product, Sales, and Customer Success, owning the full customer journey from first touch to long-term outcomes. With 25+ years in B2B SaaS, spanning venture- and PE-backed startups, public software companies, and his own ventures, Roman has built and scaled revenue teams, designed go-to-market systems, and led organizations through every growth stage from first dollar to eight-figure ARR. He writes from hands-on operator experience about UX diagnosis, conversion optimization, user onboarding, and turning behavioral data into measurable business impact.