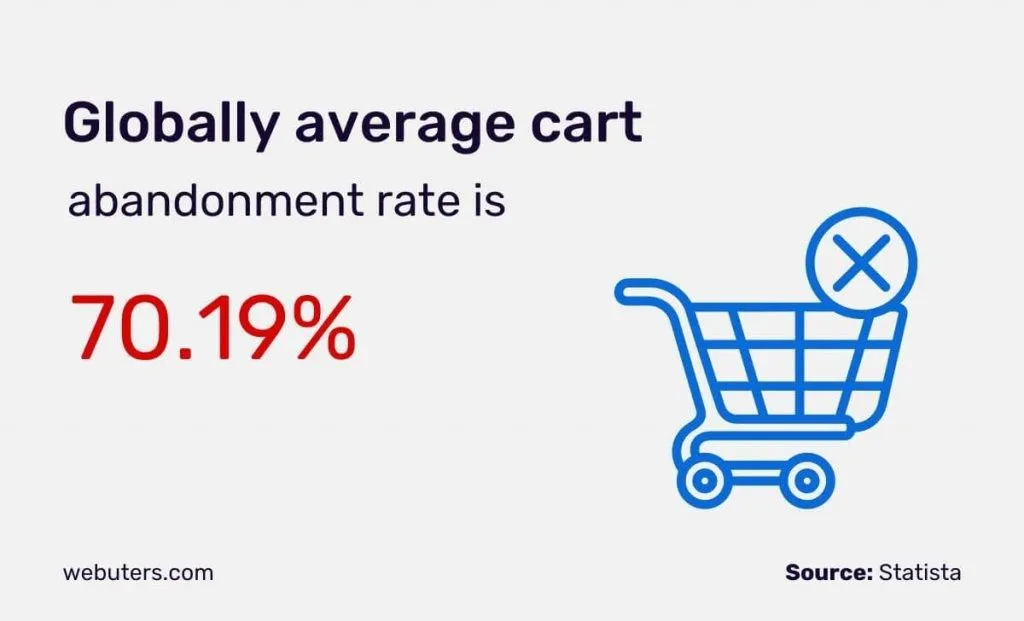
You run an ecommerce site. Cart abandonment sits at 71 percent. You install a session replay tool, watch 30 sessions, and notice users stalling at the shipping fee step. You have a hunch.
You ship a fix. Maybe a shipping fee calculator earlier in the flow. You wait a month. Abandonment is still 71 percent.
Was the fix wrong? Did something else mask the improvement? Was the original diagnosis off? You cannot tell. This is where most teams find themselves, stuck in a cycle of observation without clear impact.
The Industry Sells Insight When You Need Impact
The biggest misconception in UX analytics is treating insight as the deliverable. Almost the entire category sells “watch what your users did.” That is table stakes.
Watching sessions provides a window into user behavior, but customers do not buy session replay to spend their afternoons watching playback. They buy it because someone, somewhere, is supposed to figure out what is broken, fix it, and lift a key metric.
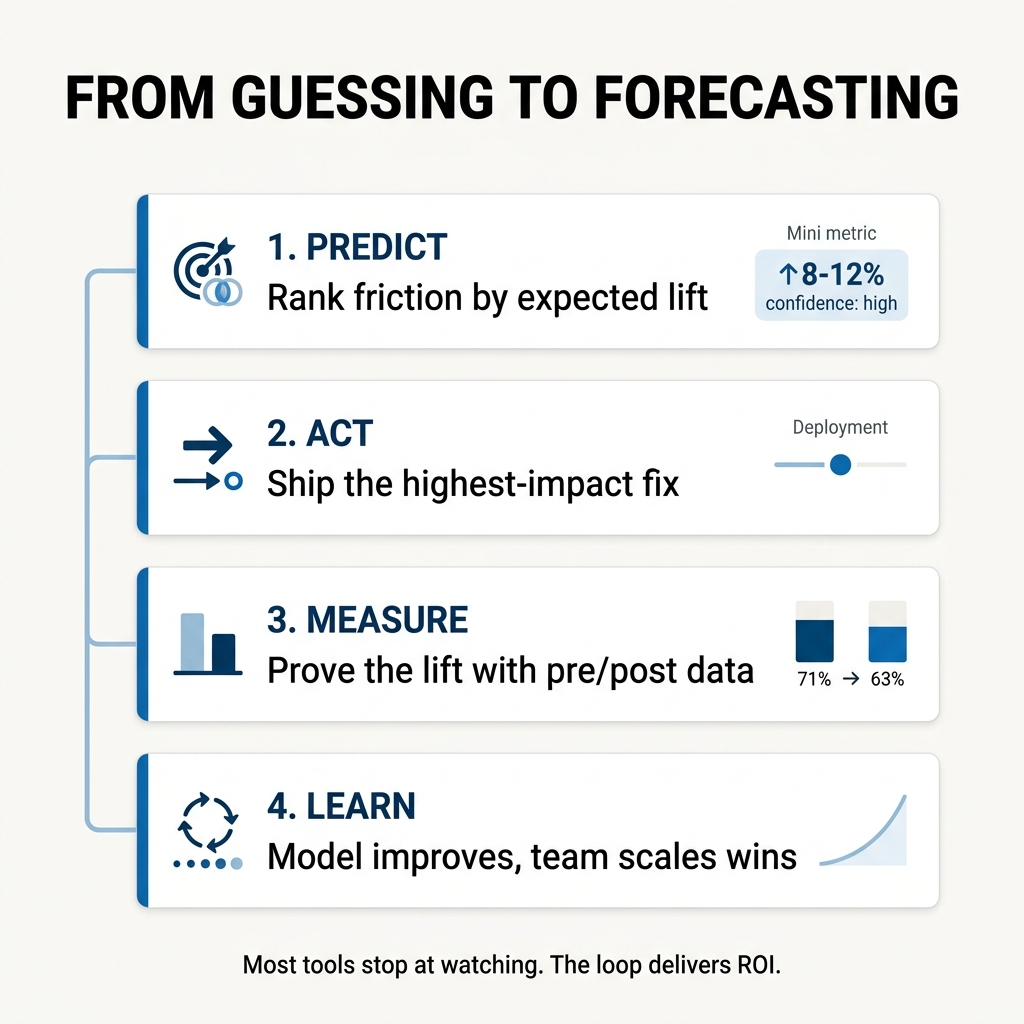
The actual job to be done is impact. Predict which fix will move the number, ship the change, prove the lift, and learn from what worked. Most tools stop at the first step and call themselves an insight platform.
This is exactly why teams using UX analytics for years still struggle to defend the ROI of their tools when finance asks.
Many in the industry also mistakenly treat session replay as the product itself, rather than just one input. Replay is a signal, but so are heatmaps, funnels, frustration signals, errors, and in-app feedback. These all matter equally.
The real product is what you do with these signals together. Over-indexing on replay, often because it is the most demo-friendly feature, leads customers to pay enterprise prices for a single feature wrapped in marketing.
Close the Predict, Act, Measure, Learn Loop
The solution lies in closing the predict, act, measure, learn loop. This framework converts UX work from a subjective vibe to a quantifiable forecast, a language every product manager, marketer, and executive already understands because it is how every other part of the business runs.
UX has been the holdout. It does not have to be.
Here is how the predict-and-prove loop functions:
1. Predict
Look at every friction signal across replay, heatmaps, funnels, and feedback. The goal is to identify the one with the most expected lift, not just the one that is most interesting to watch.
A robust system ranks these signals using a model that considers prevalence (how many users encounter it), funnel position (where in the user journey it occurs), and severity (how badly it blocks the user).
A confusing copy element on the homepage is annoying. The same confusion on the payment step costs revenue every single time. The further down the funnel, the higher the dollar-per-user cost of friction.
The tool should provide a predicted lift range and a confidence tier. Crucially, it should also factor in sample size, returning “insufficient data” rather than a misleading number if the data is too thin. This conservative approach builds credibility, prioritizing accuracy over over-confident guesses.
2. Act
Once you identify the most impactful fix and prioritize it, ship the change. This is the execution phase, where you implement the predicted solution.
3. Measure
Compare the pre-period and post-period for that specific signal, on the right user segment, with enough sample size to ensure statistical honesty. The tool should clearly indicate if the change cleared significance, providing objective validation of its impact.
4. Learn
Did the predicted lift show up? If yes, you have identified a successful pattern you can reuse and scale. If no, the model learns and becomes more conservative next time, and you gain a valuable artifact to discuss with your team or your CFO, understanding why a predicted outcome did not materialize.
Why Incumbents Struggle to Build This
The predict-and-prove loop is a structural differentiator, and it is precisely why many incumbent UX analytics providers struggle to offer this level of actionable intelligence. Their challenges are often deeply embedded in their corporate structure, pricing models, or foundational product philosophy.
Hotjar’s structural weakness is corporate.
Acquired by Contentsquare in 2021, the company now houses two distinct products chasing different buyers. Contentsquare targets enterprise zone-analytics, while Hotjar focuses on mid-market session replay and heatmaps.
This creates internal conflict. Roadmaps fight each other, pricing models clash, and messaging becomes diluted. Every time Contentsquare incorporates Hotjar features, it risks cannibalizing its own enterprise deals. Conversely, when Hotjar attempts to move up-market, it finds Contentsquare already established there.
This tension is evident in their public positioning, which has become less specific over time. The fix is corporate, requiring either a full merger of products with a single buyer focus or a complete split, neither of which is simple. Their content SEO moat also inadvertently locks them into the SMB market, as that is where their organic traffic converts.
FullStory faces a different structural challenge: its cost structure.
They built a sales motion around enterprise ACVs ranging from $25,000 to $150,000. Their narrative is “we surface behavioral data, you decide what to do with it.”
A predict-and-prove model would require them to become opinionated, recommend specific fixes, and stand behind a lift forecast. This directly contradicts their established positioning and pricing model.
Customers paying $100,000 expect a platform that provides data for their own analysis, not an opinionated recommendation engine. Furthermore, their organization would need to absorb the significant support load that comes with shipping a recommendation engine that, by its nature, can sometimes be wrong.
Implementing a predict-and-prove layer would necessitate shrinking down-market and adding an AI layer that takes positions, both of which represent existential moves for them, not mere roadmap items.
Even free tools like Microsoft Clarity lack the validation layer.
Their business model does not support the deep analytics, predictive modeling, and outcome measurement required to move beyond simply showing “what happened” to confidently asserting “what to fix and what impact to expect.”
What This Means for Your Team
For leaders across various industries, the predict-and-prove loop translates directly into tangible business outcomes.
SaaS companies can achieve significant activation lift, ensuring new users quickly find value in their product. When you predict which onboarding friction blocks the most users and prove the fix worked, you compress time-to-value and reduce early churn.
Ecommerce and DTC brands can dramatically improve cart-to-confirmation lift, turning more browsers into buyers. Identifying which friction point on the checkout flow costs the most revenue and validating the fix gives you a repeatable playbook for conversion improvement.
High-stakes customer portals in financial services, insurance, healthcare, and government can boost task completion and ensure compliance. Where a missed funnel step can cost real money or have serious regulatory consequences, predicting and proving impact becomes a risk management tool, not just an optimization exercise.
Stop Guessing, Start Forecasting
Moving beyond mere observation to a system that predicts, acts, measures, and learns is no longer a luxury. It is a necessity for any organization serious about driving measurable impact from their UX efforts.
The gap between “something is broken” and “it is fixed” determines how fast you can scale. The distance between “we think this will help” and “we proved this lifted conversion by 8 percent” determines whether your UX team gets budget next quarter or gets questioned.
You do not need more sessions to watch. You need a system that tells you what to fix, predicts the impact, and proves whether it worked.
To learn how FullSession’s Lift AI can transform your UX analytics from observation to predictable impact, visit FullSession and explore how the predict-and-prove loop works in practice.
Roman Mohren is CEO of FullSession, a privacy-first UX analytics platform offering session replay, interactive heatmaps, conversion funnels, error insights, and in-app feedback. He directly leads Product, Sales, and Customer Success, owning the full customer journey from first touch to long-term outcomes. With 25+ years in B2B SaaS, spanning venture- and PE-backed startups, public software companies, and his own ventures, Roman has built and scaled revenue teams, designed go-to-market systems, and led organizations through every growth stage from first dollar to eight-figure ARR. He writes from hands-on operator experience about UX diagnosis, conversion optimization, user onboarding, and turning behavioral data into measurable business impact.
Your analytics show 5,000 shoppers hit your product page yesterday. Four thousand left without buying. Google Analytics tells you they left. It can’t tell you why.
E-commerce session recording captures every interaction a visitor has on your store: clicks, scrolls, taps, form inputs, and page transitions. Session replay reconstructs that visit as a precise, event-by-event playback from logged DOM data, not video. The result is a lightweight, searchable, privacy-safe record of exactly what each shopper saw and did.
This guide covers how e-commerce session recording and replay work, what to look for in a session replay tool, and how FullSession connects replay with heatmaps, conversion funnels, error tracking, customer feedback, and Lift AI to give your team a complete picture of your store’s performance.
Key Takeaways
Session replay reconstructs real visitor interactions (clicks, scrolls, taps, form inputs) as event-by-event playback, not video, making it lightweight, searchable, and privacy-safe by default.
Traditional analytics tools like Google Analytics tell you where shoppers drop off. Session replay shows you why, whether it’s a rage-clicked button buried under a cookie banner or a mobile keyboard covering the checkout field.
The most valuable sessions to watch aren’t random ones. Filter for rage clicks, cart abandoners who never hit confirmation, sessions with JavaScript errors, or visits over four minutes on a page designed to take 30 seconds.
Mobile users hit completely different friction points than desktop users. Filter and analyze them separately, because the fixes rarely overlap.
Session replay works best when paired with quantitative data. Use analytics to find the problem page, then use replay to understand exactly what went wrong there.
Checkout is your highest-revenue page and usually your most friction-filled. Session replay commonly uncovers hidden cost reveals, broken form validation, and UI elements blocking the payment button on mobile.
Privacy compliance isn’t optional. Sensitive fields like passwords and payment details should be masked at the point of capture, before data ever reaches the recording server.
FullSession goes further than standard replay tools by connecting session recordings to heatmaps, conversion funnels, error tracking, and customer feedback in a single platform.
Its Lift AI feature automatically highlights the issues most likely to affect your revenue, so your team spends time on what matters rather than manually sorting through thousands of sessions.
For e-commerce teams serious about conversion rate optimization, it’s the difference between watching behavior and actually understanding it.
The two terms describe the same technology. What matters is what the tool captures and what you can do with that data.
The tool captures the Document Object Model, the underlying structure of your web page, along with every change to that structure and all user events triggered during the visit.
When you hit play, it rebuilds the page from those logged events in sequence. It looks like a video, but it’s a precise reconstruction, not a screen recording.
Three practical benefits follow from this.
Files are lightweight, with no bulky video storage. You can search and filter recordings by behavior, errors, or segments. And sensitive data like passwords and payment details gets masked at capture, so it never enters the recording at all.
Compare Screen Recording, Session Replay, and Traditional Analytics
Here’s how session replay stacks up against the alternatives.
Method
How it works
Privacy risk
Filterable by behavior
Best for
Screen recording
Records full-screen video of a user’s device
High
No
Moderated usability testing
Session replay
Reconstructs visits from logged DOM events
Low
Yes
Ongoing behavioral analysis at scale
Web analytics (GA4)
Aggregates event data into metrics and reports
Very low
Metrics only
Measuring volume and trends
Why traditional web analytics tools fall short for e-commerce
Traditional web analytics tools like Google Analytics show bounce rates, exit rates, and funnel drop-off percentages. They can’t show you why those numbers are what they are.
A checkout page with, say, a 68% drop-off rate is measurable in GA4. When you watch session replays on that page, you might find that mobile users on iOS are rage-clicking a “Place Order” button blocked by a floating cookie banner. That’s the insight that drives the actual fix.
Qualitative and quantitative data need each other. Quantitative data tells you the scale. Qualitative data shows you the cause.
How session replay differs from screen recording
A screen recording captures a full video of a user’s screen: heavy, hard to search, and a privacy liability at scale.
Session replay reconstructs visits from structured event data. That makes it searchable, filterable, and privacy-safe.
You can skip inactive periods, jump to rage-click moments, and attach session data to error events or funnel steps. None of that is possible with a video file.
Key Features of E-commerce Session Replay Tools
There are many session replay tools on the market. For e-commerce teams, the right platform shows you not just what happened, but gives you the tools to act on it.
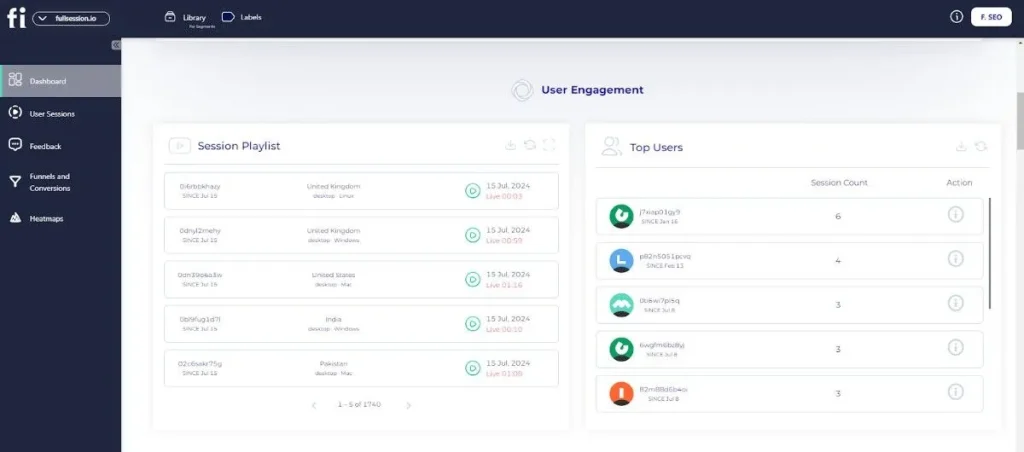
FullSession is a user behavior analytics platform built for teams who need session replay connected to heatmaps, conversion funnels, error tracking, feedback, and AI-powered prioritization.
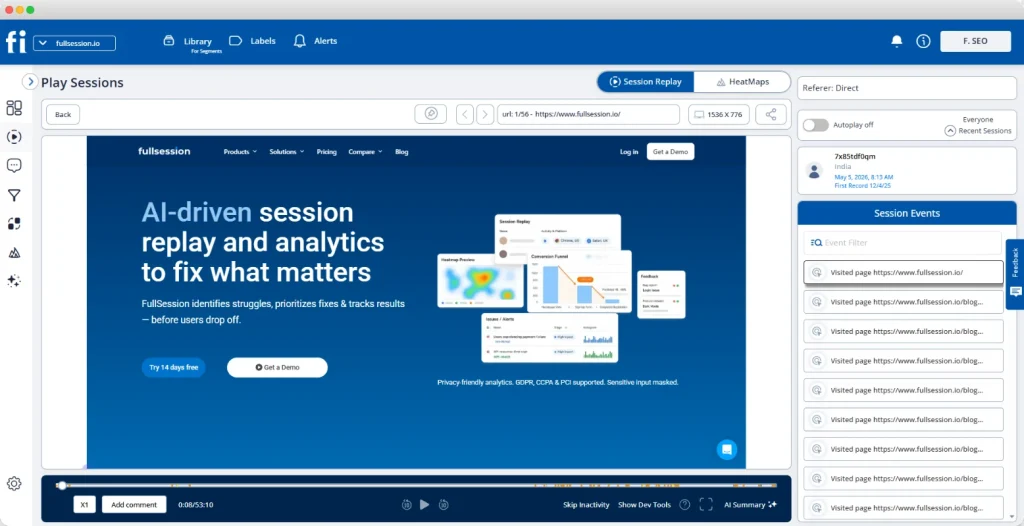
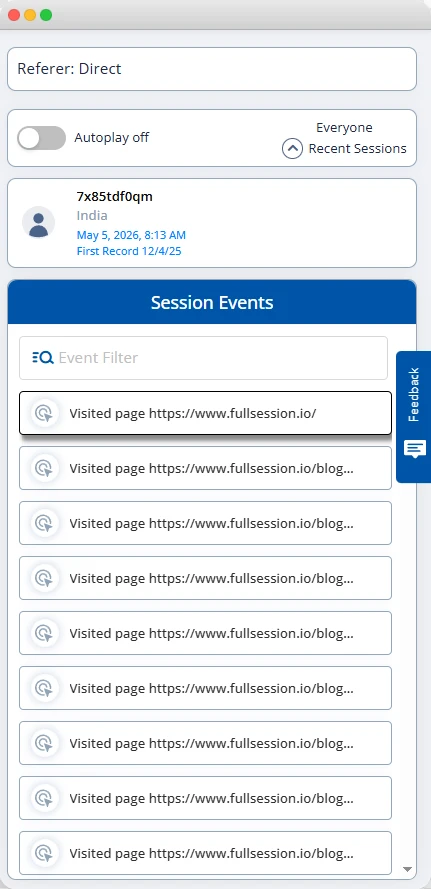
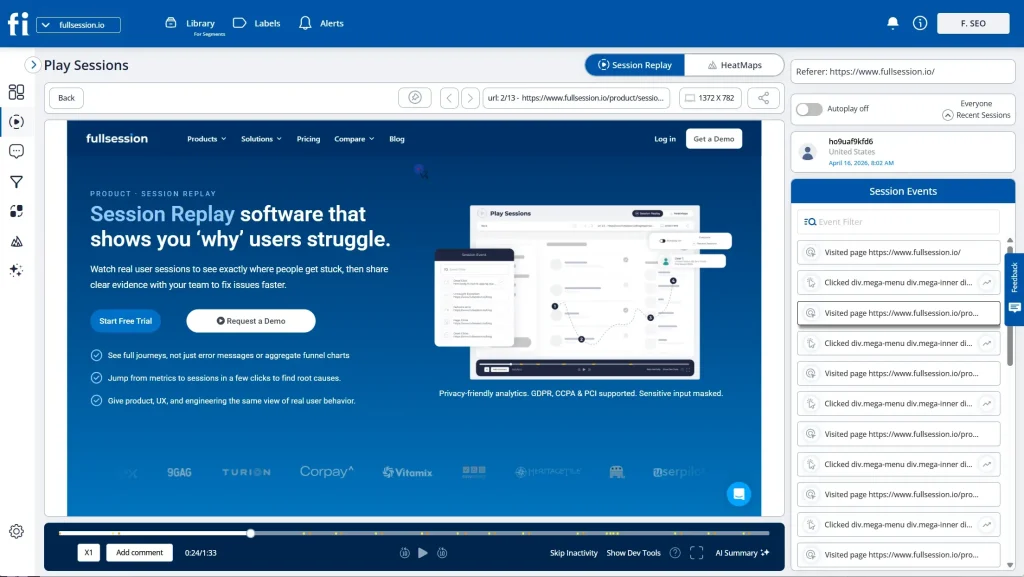
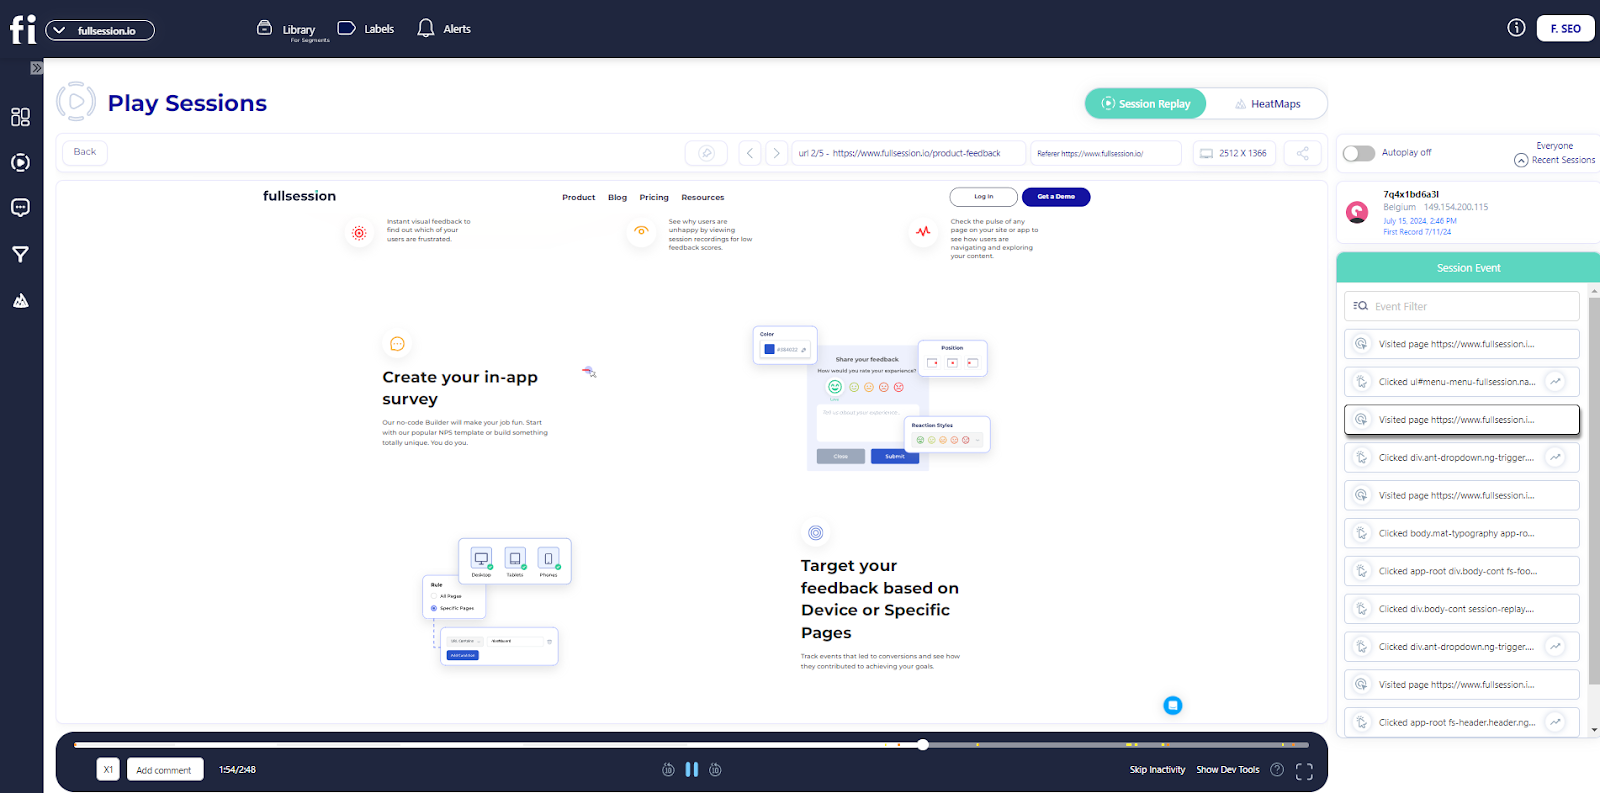
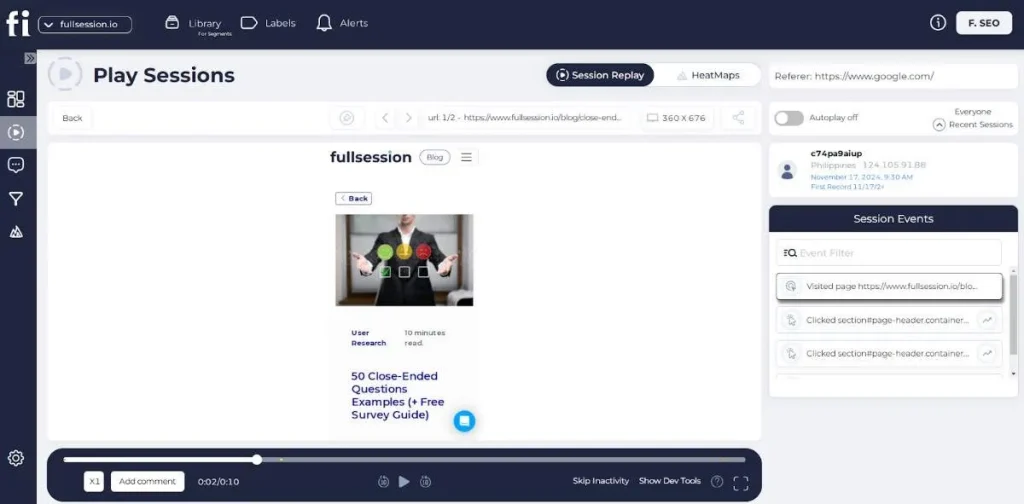
The session replay player shows a live timeline of user events on the right, while the left panel plays back exactly what the visitor saw, with tabs to switch instantly between replay and HeatMaps on the same session.
Here are the key features to look for in any e-commerce session replay platform, and how FullSession delivers each one.
Behavioral tracking and user event capture
A strong session replay tool captures the full range of user interactions: clicks, taps, scrolls, mouse movements, form inputs, and navigation between pages. It should also flag frustration signals automatically: rage clicks, dead clicks, and long pauses before abandonment.
On an online store, these signals are direct revenue indicators.
A rage-click cluster on your “Add to Cart” button means something is broken. A dead click on your product image means shoppers expect a zoom you haven’t built.
FullSession captures all of these and shows them in the event timeline alongside the replay.
Session filtering and segmentation
Session filtering
With FullSession, you can filter session replays by:
Device type
Browser
Geographic region
Landing page
Visited URL
User behavior
Error type
User ID
Filter recordings according to your needs to stop watching random sessions. FullSession helps you watch only the relevant sessions that tell you something useful.
Session filtering to mobile users who dropped off at the payment step on a Tuesday might reveal a payment gateway error that only surfaces on certain devices.
The filtering panel sits directly in the session list, not buried in settings.
Mobile session replays
Mobile session replays show problems that the analysis on desktop devices misses: thumb-zone issues, form fields too small to tap, payment widgets failing on specific browsers, and mobile keyboards covering the submit button.
FullSession records both mobile web and mobile app sessions in the same dashboard, so you never have to switch tools or reconcile separate data sources.
Error tracking and JavaScript errors
FullSession heatmap data preview
When a checkout page breaks, most customers don’t report it. They leave.
Error tracking connected to your session replay platform shows the problem in real time, linked to the sessions where it occurred.
JavaScript errors, failed API calls, and broken form validation all leave behavioral traces, and with FullSession, your engineering team watches what the user experienced and reads the attached console logs without a support ticket to reproduce the bug. See how session replay and JavaScript error tracking work together.
Privacy controls and sensitive data protection
A credible session recording software masks sensitive information at capture: passwords, payment card numbers, billing addresses, and any field you designate as private.
That data never reaches the recording server.
For US ecommerce teams with California customers or EU traffic, GDPR, CCPA, and PCI DSS compliance aren’t optional. FullSession applies masking at capture by default and meets all three standards.
Choose the Right Session Replay Tool for Your E-commerce Store
Picking the right e-commerce session replay tool comes down to three questions.
Does it integrate with your e-commerce platform?
The right session replay connects to your existing stack without an engineering project. Native integrations with Shopify, BigCommerce, WooCommerce, and Magento matter.
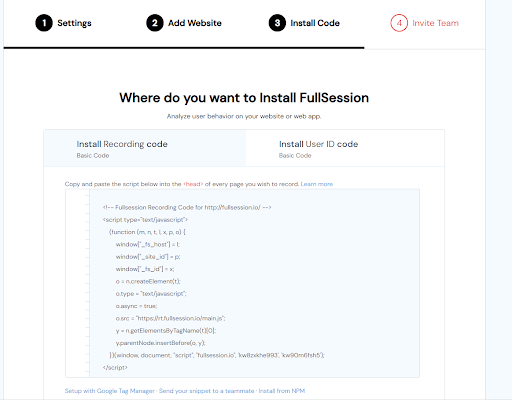
So does Google Tag Manager support, which lets you deploy the recording script without touching your codebase.
FullSession integrates directly with Shopify, BigCommerce, WordPress, and Wix, and supports GTM. Most teams record live sessions the same day they sign up.
Do you need an advanced e-commerce session recording or a basic recorder?
Advanced session replay tools connect session data to conversion funnels, heatmaps, error logs, and in-app feedback forms. That moves you from watching what happened to understanding why and knowing what to fix.
Session recording tools at the basic end record visits and let you play them back. Fine for small stores needing occasional qualitative context.
For any ecommerce team working on conversion rate optimization, you need the connected workflow FullSession provides from day one.
What session volume do you need?
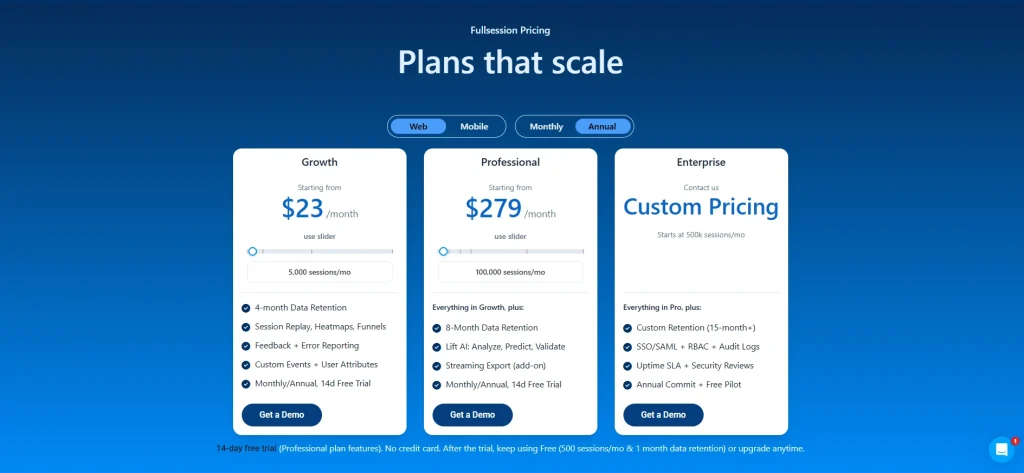
FullSession scales from a free plan through enterprise, with tiers built around your actual session volume. See the current plans and limits on the pricing page.
Capture Real Users and Map the Customer Journey
Setting up session recording is easy. Getting value from it takes a systematic approach to which sessions you capture and how you review them.
Define which pages to record: at a minimum, product pages, cart, and checkout page.
Configure masking rules to exclude fields containing sensitive information before going live.
Go live. Within minutes, real users start appearing in your dashboard.
Mapping the user journey across multiple pages
A single ecommerce session typically spans multiple pages: a landing page, a collection page, a product detail page, the cart, and checkout.
FullSession’s session replay lets you follow that entire path in one continuous playback.
The point of abandonment is rarely where the problem started. A shopper who drops off at payment may have hit friction on your product page first: a confusing size guide, a missing trust signal, or a slow image carousel.
The user journey across pages reveals that chain. Watching pages in isolation misses it.
Identifying the sessions worth watching
A high-value session is one where a real user encounters friction, triggers an error, or reaches a key conversion step without completing it. Focus your review time on these:
Sessions with rage clicks on any element
Sessions that hit the cart but not the order confirmation page
Sessions over four minutes on a page designed to take under 30 seconds
Sessions where error messages appeared in the browser console
FullSession’s Lift AI shows these automatically, ranked by predicted impact, so your team spends time on only the recordings that matter.
Integrate With Analytics Tools and Quantitative Data
E-commerce session replay doesn’t replace your existing analytics tools. It completes them.
Pairing session replay with Google Analytics
Google Analytics pinpoints where problems exist: high-exit pages, drop-off funnel steps, and behavioral differences across traffic sources. E-commerce session replay shows what users experienced at those exact points.
Step
Tool
What you get
1. Identify the problem page
Google Analytics
High exit rate or drop-off percentage
2. Filter sessions to that page
FullSession
Recordings of users who exited there
3. Watch what users experienced
Session replay
The specific friction causing the exit
4. Act on the insight
Your dev/design team
A targeted fix, not a guess
That combination of data analytics turns a percentage into a specific change you can ship.
Combining qualitative and quantitative data
Quantitative data (conversion rates, session duration, funnel drop-off percentages) tells you the magnitude of a problem. Qualitative data from session replays shows you the specific cause.
Teams relying only on web analytics build theories and test them through expensive A/B experiments. Teams that use session replays alongside their analytics confirm the issue through replay first, then run a targeted test. That sequence wastes far less budget and engineering time.
The goal is to understand user behavior at the moment it happens, not weeks later when it shows up as a conversion drop in your dashboard.
Analyze Customer Behavior to Improve Conversion Rates
These use cases deliver direct, measurable impact on conversion rates.
Checkout page optimization
Your checkout is the highest-revenue page on your store. Session replay shows the exact moments where shoppers hesitate, abandon form fields, search for a coupon they can’t find, or hit a broken payment step.
Common checkout friction points visible in ecommerce session recording:
Shipping cost reveals that trigger immediate exits
Mobile keyboards covering the “Continue” button
Coupon fields sending shoppers off-site to hunt for a discount code
Product page friction and user behavior
Users click on product images expecting them to zoom. They scroll for the size guide. They hover over “Add to Cart” without clicking, not because they’re uninterested, but because they haven’t found the information they need to commit.
Ecommerce session replay software makes each pattern visible and maps it to a fix:
Dead clicks on static images: add zoom functionality
Repeated scrolling past specs: move sizing info above the fold
Exits after viewing the shipping policy: improve delivery cost transparency
Understanding cart abandonment through behavioral data
Behavioral data from session replays lets you categorize abandonment rather than just count it. Most ecommerce teams watching a sample of abandoned sessions find the causes cluster into four buckets:
UX confusion: shoppers can’t find what they’re looking for
Technical error: something is broken in the checkout flow
Price friction: an unexpected cost appears late in the process
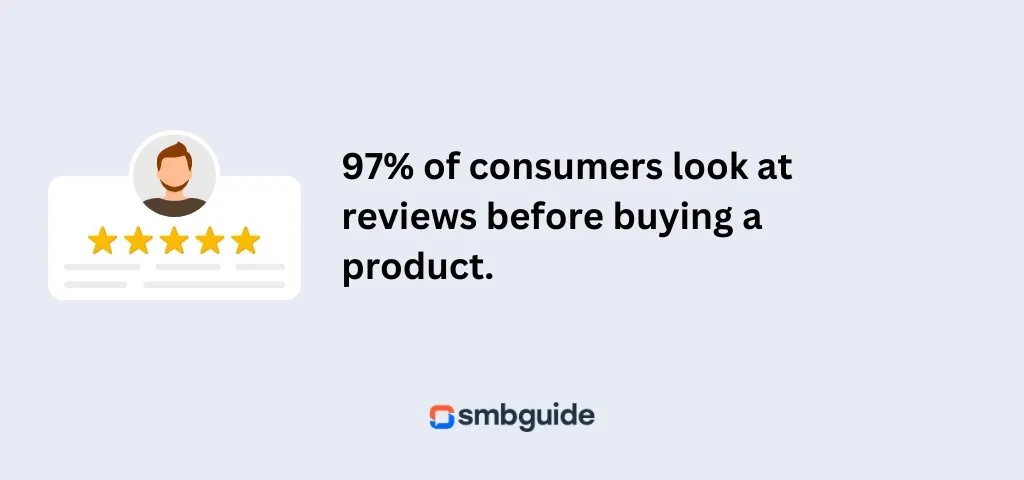
Trust deficit: no reviews, unclear return policy, or unfamiliar payment options
Knowing which bucket drives most of your abandonment tells you exactly where to focus. For a deeper breakdown of how to approach this, see our guide to cart abandonment analysis.
Analyzing how mobile users behave differently
Mobile users don’t just behave differently from desktop users. They hit entirely different friction points. A dropdown menu that works in Chrome on desktop can break on mobile Safari. A tap target fine for a mouse cursor is too small for a thumb.
Filter your session replays to mobile-only traffic and review them as a separate analysis pass, not an afterthought to your desktop review. The fixes you find will rarely overlap, and treating them as one combined audience means you’ll consistently under-serve one of them.
Common ecommerce friction issue
What session replay reveals
High checkout page drop-off
Rage-clicks on a payment button blocked by a floating element
Low product page add-to-cart rate
Dead clicks on static images; shoppers expecting zoom
High exit rate on landing pages
Users scroll past the key CTA without seeing it
Mobile conversion gap
Keyboard covers submit button; form fields too small to tap
Cart abandonment spike
Shipping cost reveal at the final step triggers immediate exit
Pairing Replay With Heatmaps, Funnels, and Error Tracking
Session recording software alone shows you what happened. FullSession connects session replay to five additional capabilities that show you why and what to fix.
Heatmaps for ecommerce teams
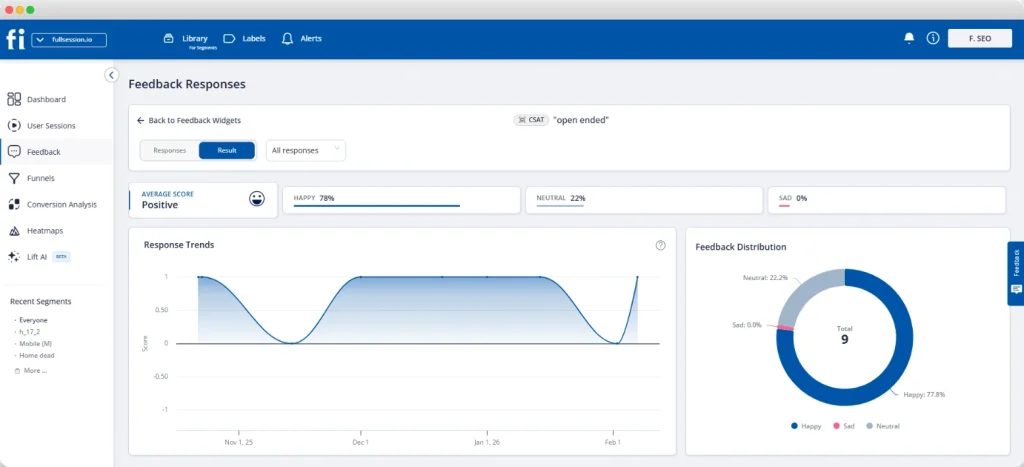
FullSession’s heatmaps aggregate user interactions across all sessions into a visual overlay. Click maps show where users interact most. Scroll maps show how far down users navigate before dropping off. Movement maps track mouse movements across your layout.
On key pages like product detail pages and landing pages, heatmaps reveal attention patterns individual replays can’t surface: the CTA below the scroll threshold for the majority of visitors, the nav element pulling clicks away from your conversion path, the trust badge nobody sees on mobile.
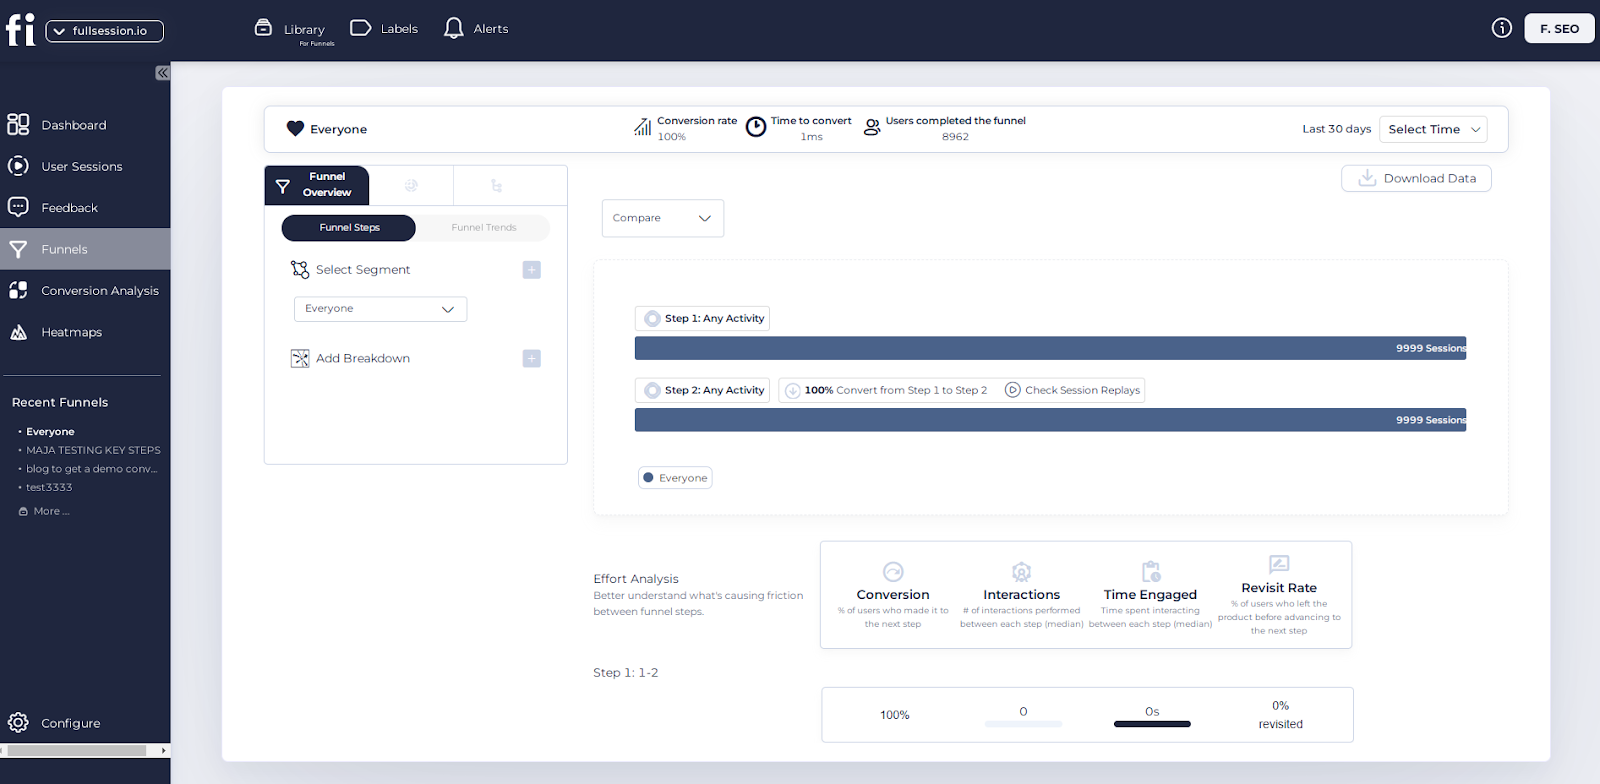
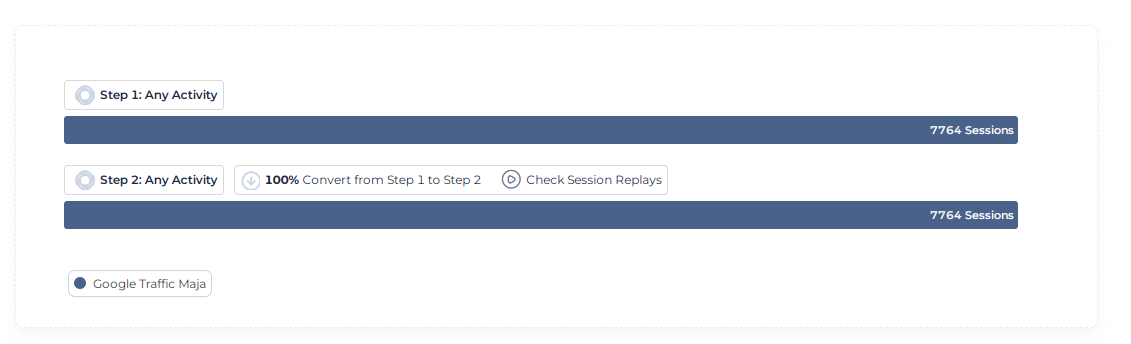
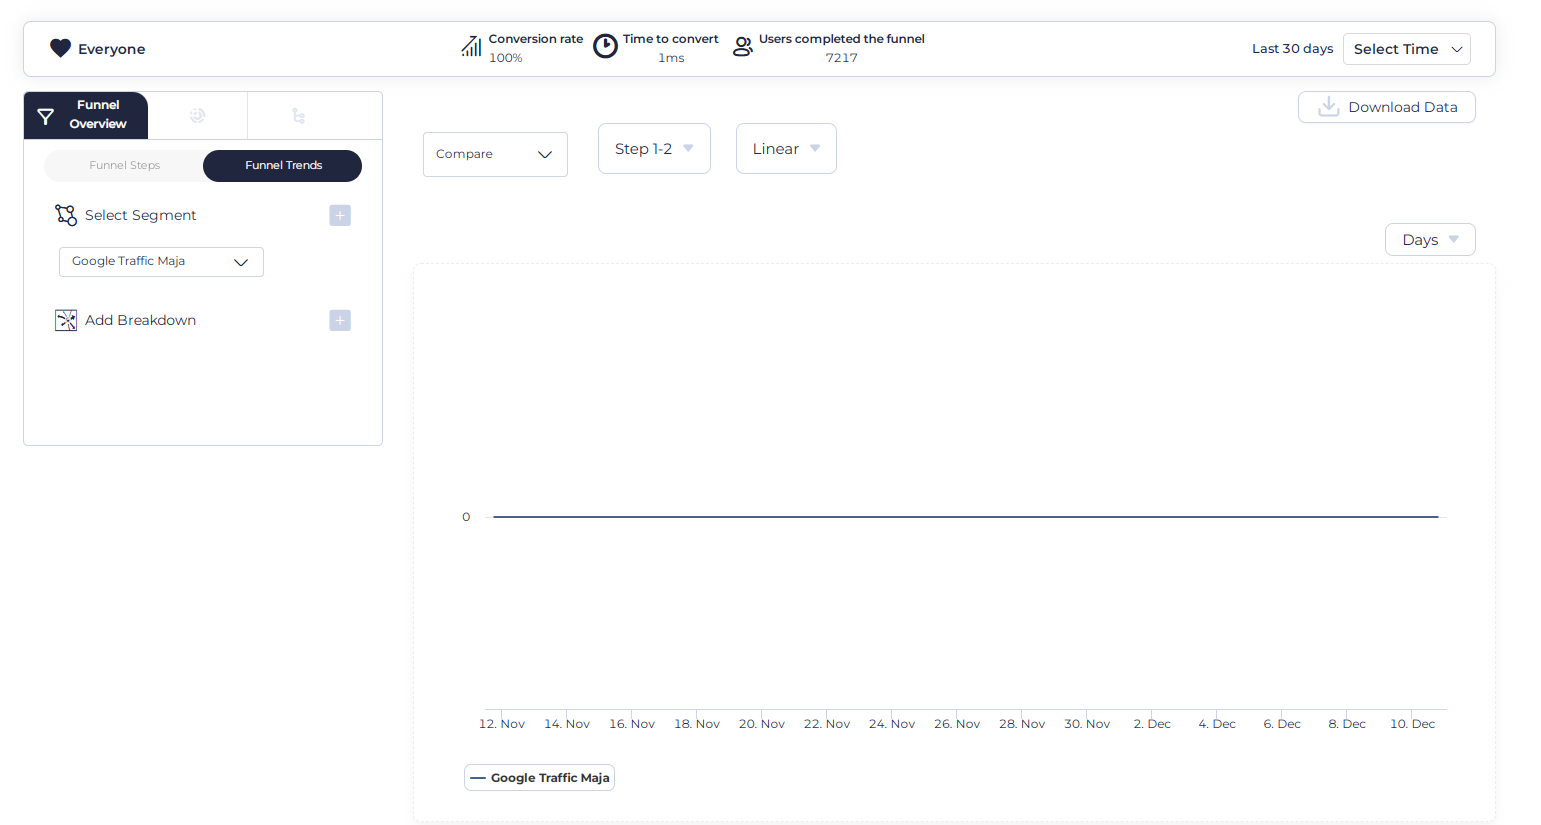
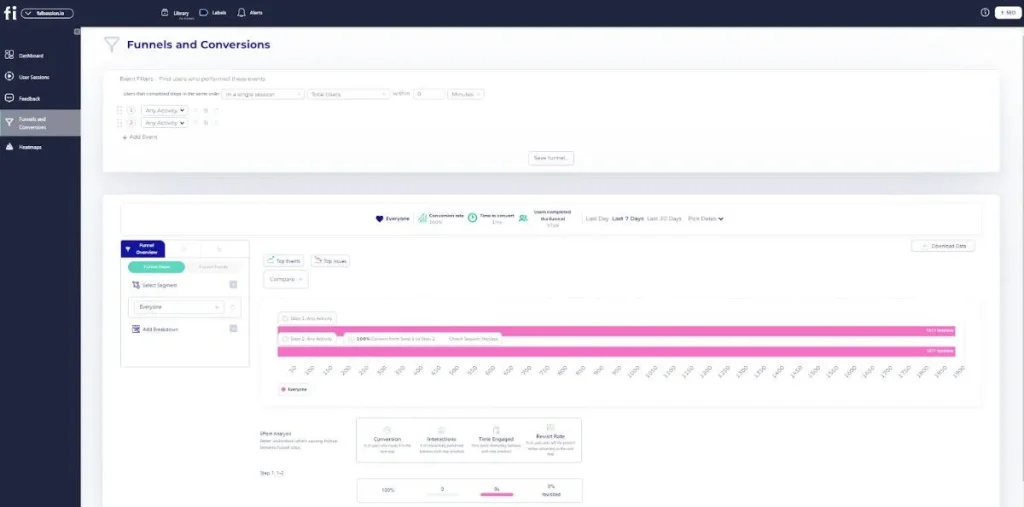
FullSession’s funnel tool maps each step of your ecommerce flow: product view, add to cart, checkout initiation, payment, and confirmation. It shows conversion rates and drop-off percentages at every stage.
Click any funnel step and FullSession surfaces the session replays from users who dropped off there. You go from knowing that roughly half your shoppers abandon between cart and checkout to watching exactly what they experienced at that moment.
FullSession monitors your store for JavaScript errors, failed API calls, and broken interactions in real time. When an error spike hits your checkout page, you get an alert and a direct link to the session replays where that error appeared.
Your engineering team watches a real user session where the issue occurred, reads the attached console logs, and resolves in hours what used to take days.
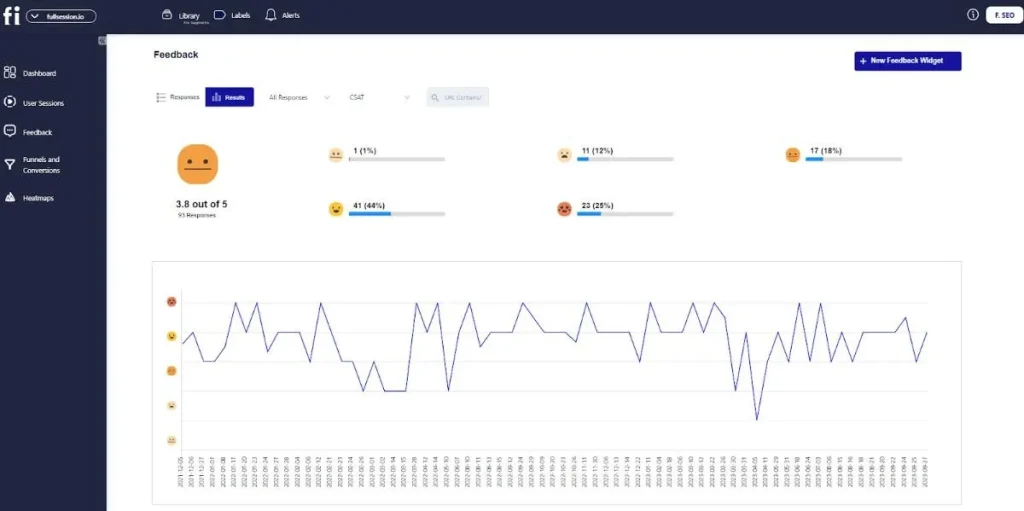
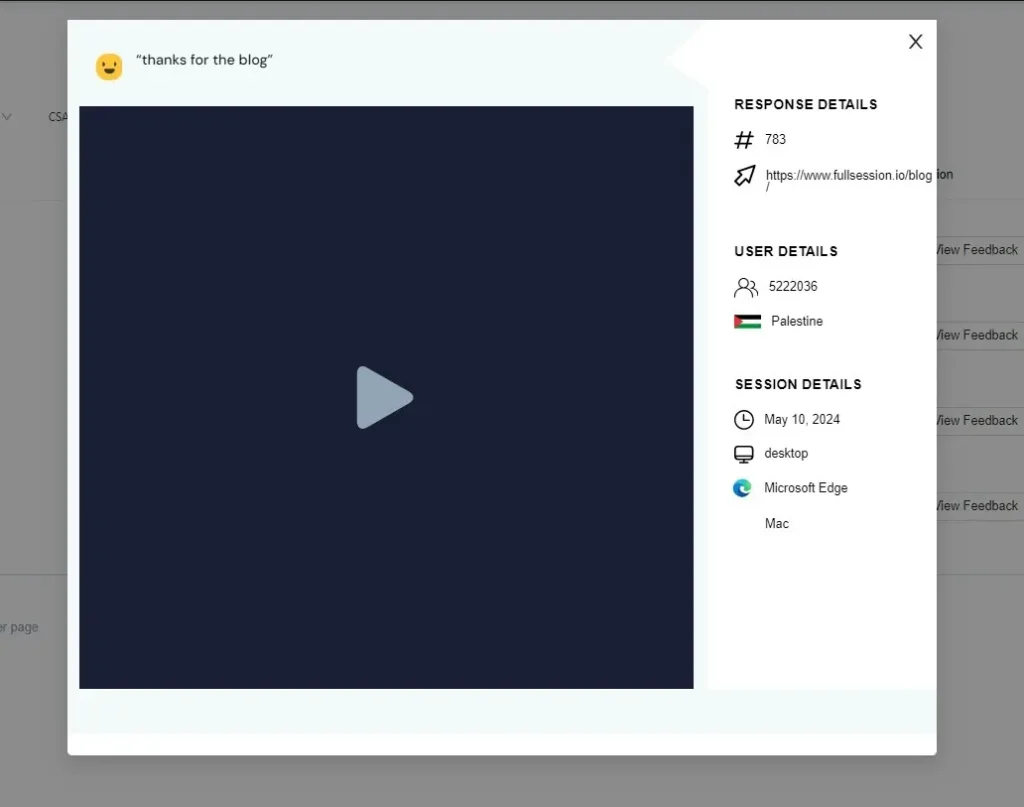
Customer feedback integration
FullSession’s in-page feedback widgets let you ask shoppers a specific question at the moment that matters: on the checkout page, after an error, or when they’re about to leave.
Each response links automatically to the session replay from that visit.
When a shopper says “the checkout is confusing,” you click through to their session and watch exactly what they experienced. Direct feedback combined with user behavior context removes all ambiguity about what to fix.
Lift AI
Lift AI reviews your session replay data automatically, identifies friction patterns across large session volumes, and surfaces the issues most likely to affect your conversion rates, ranked by severity and predicted revenue impact.
For ecommerce teams managing thousands of sessions per week, Lift AI answers “what should we watch?” before you open the session player. You start with a prioritized list of the user session replays that matter most, not a queue of recordings to sort through manually.
Session replay isn’t only for conversion optimization. Two more teams get direct value from it.
Using session replays for customer support
When a customer contacts customer support about a problem, the usual process involves back-and-forth questions to reconstruct what happened. Ecommerce session replay cuts that out entirely.
If the customer’s user ID is known, support agents pull the exact session from their visit and understand the issue in under two minutes. No reconstruction, no frustration, no re-explaining. The customer experience improves because resolution happens fast.
Connect session replays to your customer journey tracking workflow to give support and product teams a shared view of what’s actually happening.
Product team use cases for ecommerce
Usability testing traditionally requires scheduling participants, preparing scripts, and running moderated sessions. Session replay gives you a continuous alternative: real, unmoderated sessions from actual customers, captured as they shop.
Product teams use session replays to validate design decisions before shipping to all users and build evidence for roadmap priorities based on observed behavior, not stakeholder opinions.
When users encounter friction on a new feature, session replay surfaces it within hours of launch, not weeks later when it appears in your conversion trends.
Operational and Privacy Best Practices
Getting ecommerce session replay right operationally protects your customers and your team.
Privacy compliance checklist for US ecommerce teams
Enable automatic masking for all password, payment card, and personally identifiable information fields before recording goes live in production.
Add a cookie consent mechanism and CCPA opt-out for California users. Confirm your session replay vendor supports consent-based recording.
Configure recording exclusions for logged-in account pages displaying order history, saved payment methods, or personal profile data.
Set data retention to match your actual needs. Most ecommerce teams work with 30 to 90 days. Storing longer than necessary creates unnecessary compliance exposure.
Confirm your vendor supports consent-based recording for GDPR and CCPA, and masks payment card and CVV fields at capture. FullSession does both, supporting PCI DSS scope reduction while keeping sensitive data off the recording server entirely.
Performance and site speed
A session replay script that slows your store costs you more than it saves. FullSession’s recording script runs as a background process and doesn’t block page rendering.
High-traffic teams should configure retention and capture rules based on privacy, performance, and plan limits.
Measure Impact and Track Outcomes
Session replay delivers the most value when it connects to a measurement loop.
Before-and-after conversion rate tracking
Before acting on any session replay insight, baseline your funnel metrics: the conversion rate at each checkout step, cart abandonment rate by device type, and exit rate on key product pages.
After shipping the fix, measure those same metrics against the baseline.
That’s how session replay becomes a revenue tool rather than a research exercise. The ecommerce checkout optimization workflow in FullSession makes this straightforward: set up your funnel before the fix, ship the change, and compare step-level conversion rates.
KPIs to track after session replay optimization
A meaningful KPI for session replay optimization is any metric that changes directly when a friction point is removed. Track these weekly after any change informed by session replay data:
Checkout completion rate at each funnel step, segmented by device
Cart abandonment rate on mobile vs. desktop separately
Session duration on product pages (long sessions often signal confusion, not engagement)
JavaScript error frequency on checkout and payment pages
Rage-click rate on your key call-to-action elements
A successful fix shows measurable improvement within one to two weeks on a well-trafficked store.
Conclusion About Ecommerce Session Recording
Ecommerce session recording and replay is the missing layer between your analytics dashboard and the actual experience your customers have on your store. It answers what web analytics can’t: not just where shoppers drop off, but what they were doing and experiencing in the moments before they left.
FullSession connects session replay to heatmaps, conversion funnels, error tracking, customer feedback, and Lift AI. Your team doesn’t just watch what happened. They understand why, and they know what to fix.
What is the best user session recording software for ecommerce websites?
FullSession is the strongest choice for ecommerce teams that need more than basic playback. It connects session recording to heatmaps, conversion funnels, error tracking, and Lift AI in one platform. The right session recording tools for your store depend on your session volume, ecommerce platform, and whether you need an integrated workflow or a standalone recorder.
What is an ecommerce session recording?
An ecommerce session recording captures every interaction a visitor has on your online store during a single visit: clicks, scrolls, taps, and page transitions. Unlike a screen recording, it logs structured event data from the Document Object Model rather than video, making it lightweight, searchable, and privacy-safe by default.
What are sessions in ecommerce?
A session is a single continuous visit by one of your website visitors, from arrival to exit or 30 minutes of inactivity. Each session includes the pages users navigate, the actions they take, and the device they’re on. Session replay tools reconstruct these visits to give your team valuable insights into individual customer behavior.
What sites use session recording?
Session recording is used by ecommerce stores of all sizes, from Shopify merchants to enterprise retailers, and by SaaS companies, media publishers, and fintech platforms. For ecommerce specifically, it’s most valuable where customer behavior on product pages, carts, and checkout flows has a direct impact on revenue.
Roman Mohren is CEO of FullSession, a privacy-first UX analytics platform offering session replay, interactive heatmaps, conversion funnels, error insights, and in-app feedback. He directly leads Product, Sales, and Customer Success, owning the full customer journey from first touch to long-term outcomes. With 25+ years in B2B SaaS, spanning venture- and PE-backed startups, public software companies, and his own ventures, Roman has built and scaled revenue teams, designed go-to-market systems, and led organizations through every growth stage from first dollar to eight-figure ARR. He writes from hands-on operator experience about UX diagnosis, conversion optimization, user onboarding, and turning behavioral data into measurable business impact.
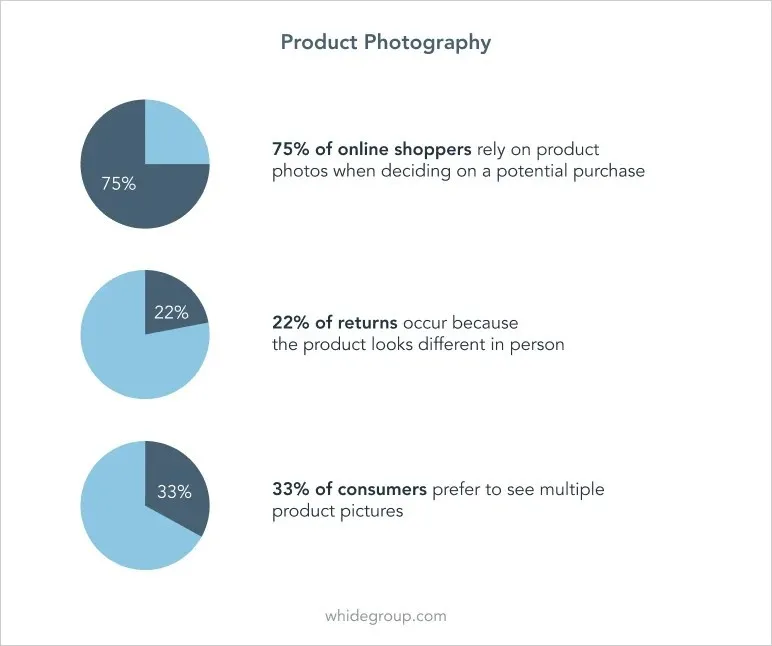
An e-commerce heatmap is a visual representation of how visitors interact with your store pages. It overlays color-coded behavior directly on your web page: red and orange mark the zones getting the most clicks, taps, and attention; blue and green reveal areas shoppers scroll past or ignore.
Standard analytics tells you what happened, not where on the page or why. A website heatmap closes that gap by turning raw website traffic data into a graphical representation you can read and act on in seconds.
This guide covers heatmap types, where to apply them in your conversion funnel, how to analyze the data, advanced tactics, technical setup, measurement, integrations, and compliance.
Key Takeaways
There are four types worth knowing: click heatmaps, scroll heatmaps, mouse movement maps, and dynamic heatmaps. Dynamic heatmaps are the only type that work on cart and checkout pages with dynamic URLs, which makes them essential for any e-commerce team serious about conversion optimization.
Apply e-commerce heatmaps across all four funnel stages (Category, Product Detail, Cart, Checkout), and you’ll identify patterns in visitor behavior that standard analytics simply can’t surface. A heat map turns a vague “high bounce rate” into a specific, fixable layout problem.
Always segment by device before you analyze. Mobile users and desktop users behave differently on the same page, and aggregate heatmap data blends both into a picture that accurately reflects neither.
Use heatmap insights to drive specific A/B tests, not general redesigns. The goal is to identify areas where visitor behavior signals a clear problem, form a testable hypothesis, and measure the outcome.
Pair heatmaps with session replay to validate what you see before you act. A pattern in aggregate data becomes a confirmed finding when you watch real users reproduce it in a recording.
Compliance isn’t optional. Any ecommerce website running heatmaps on checkout pages needs PCI DSS field masking, GDPR consent handling, and a clear data retention policy in place before going live.
Most heatmap tools give you the visual layer and nothing else. FullSession combines click maps, scroll maps, movement maps, and dynamic heatmaps with session replay, funnel analysis, error tracking, and Lift AI in one platform.
Every insight connects to a measurable business outcome, without jumping between tools or manually connecting the dots.
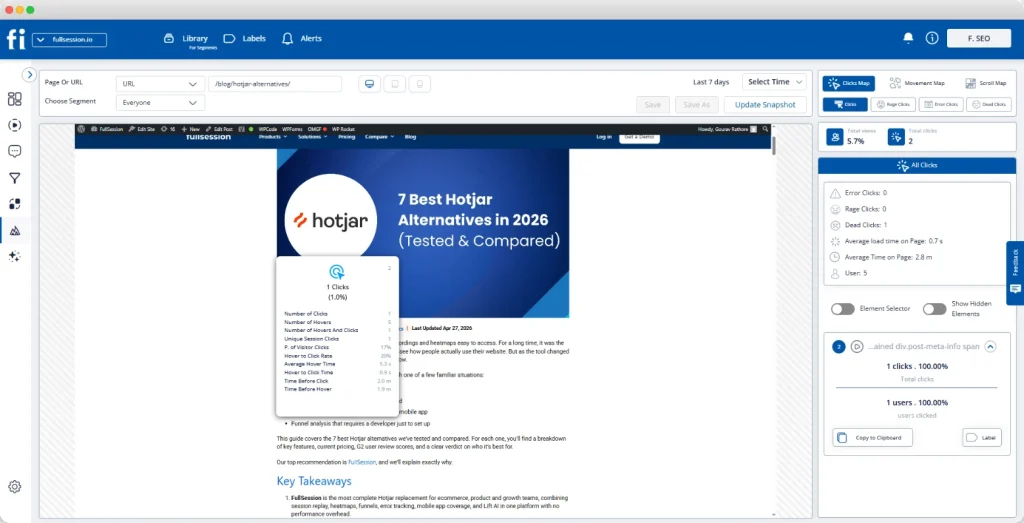
Click heatmaps record every place users click or tap on a page and aggregate those user interactions across sessions. For ecommerce teams, they reveal three things:
Where users click vs. where you want them to. If shoppers are clicking around your add-to-cart button rather than on it, you have a layout problem.
Dead zones. Clicks on non-interactive elements mean visitors expect something to happen, and it doesn’t. A dead click kills purchase momentum fast.
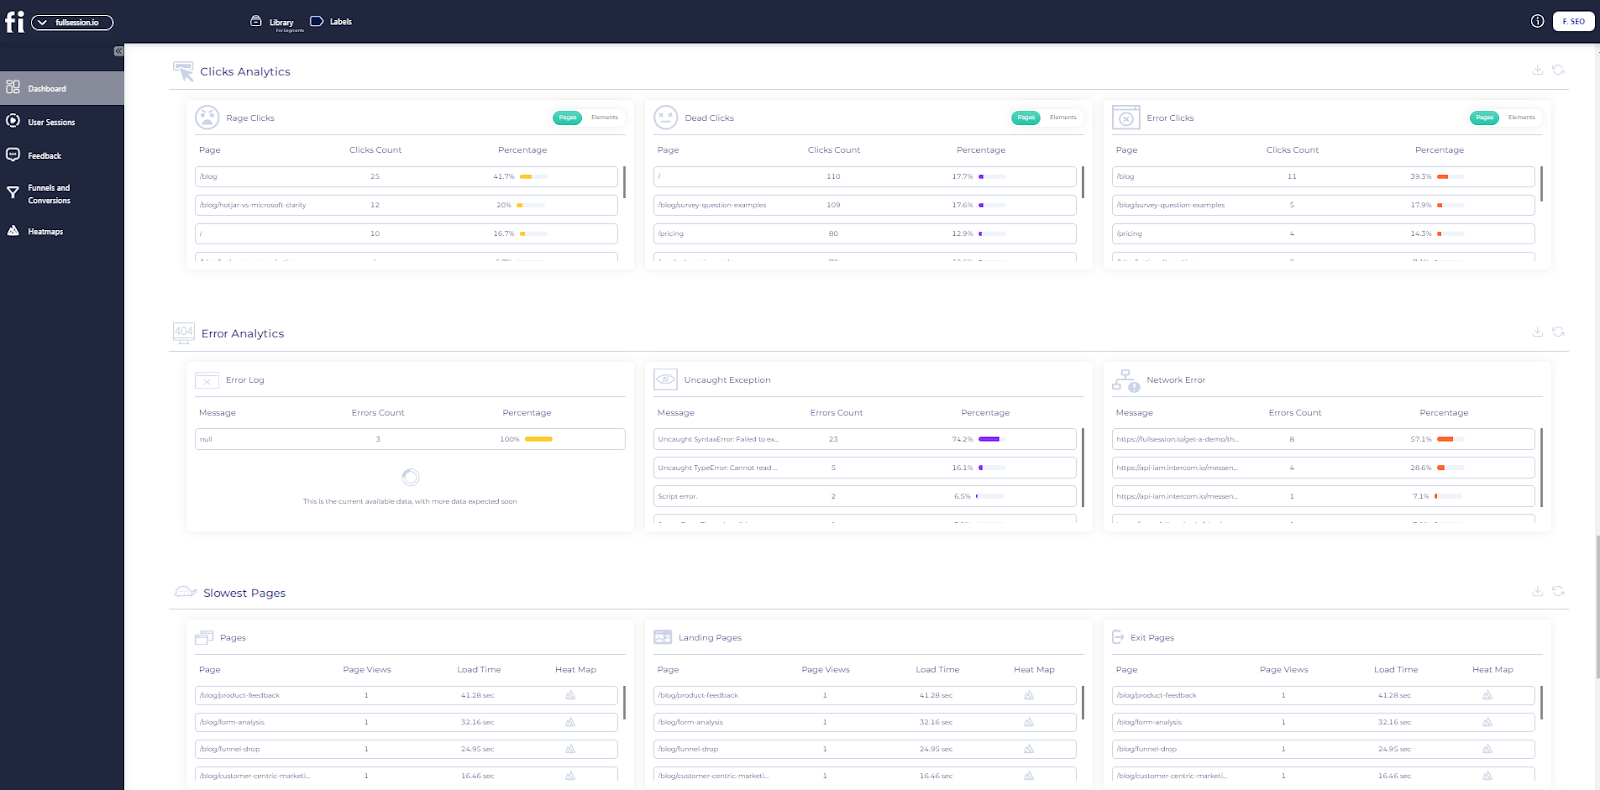
Rage clicks. When users repeatedly click the same spot, they’re frustrated. On a product image, it usually means shoppers want a zoom feature that doesn’t exist. On your checkout button, it often signals a payment error or slow page load.
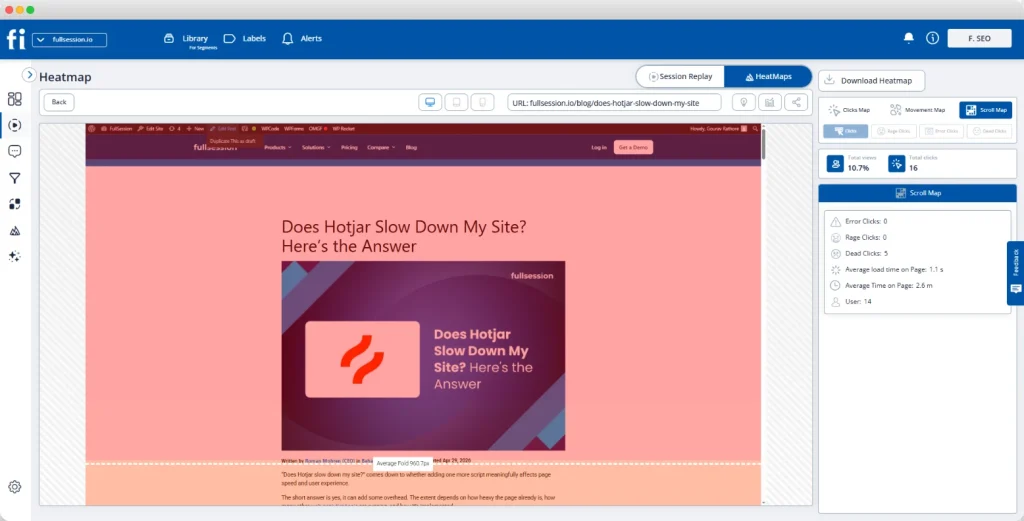
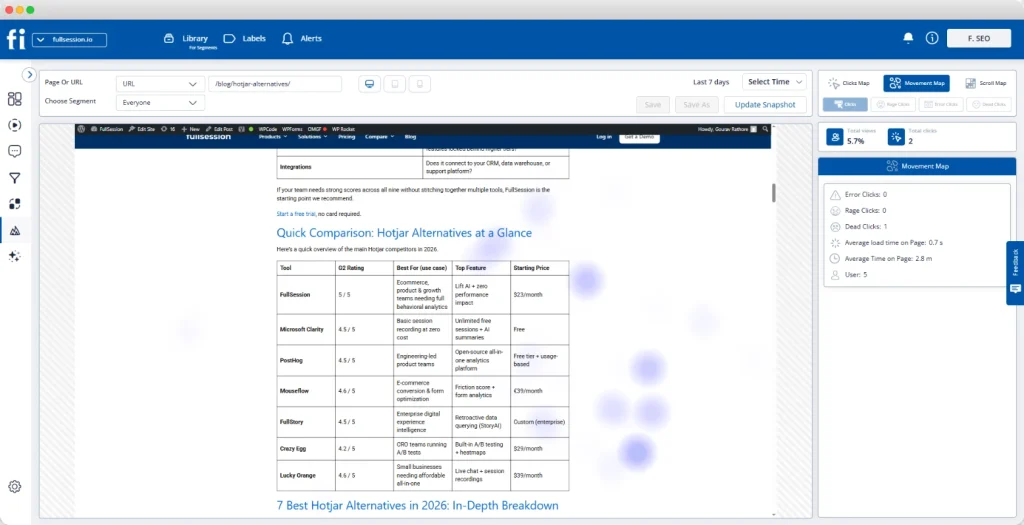
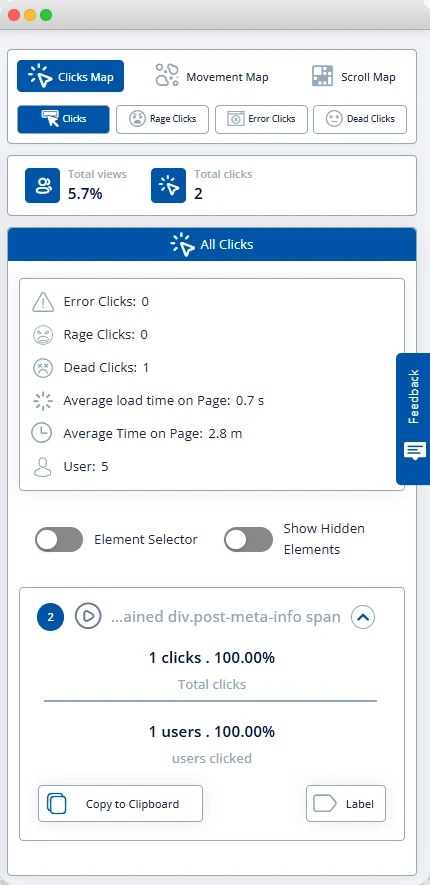
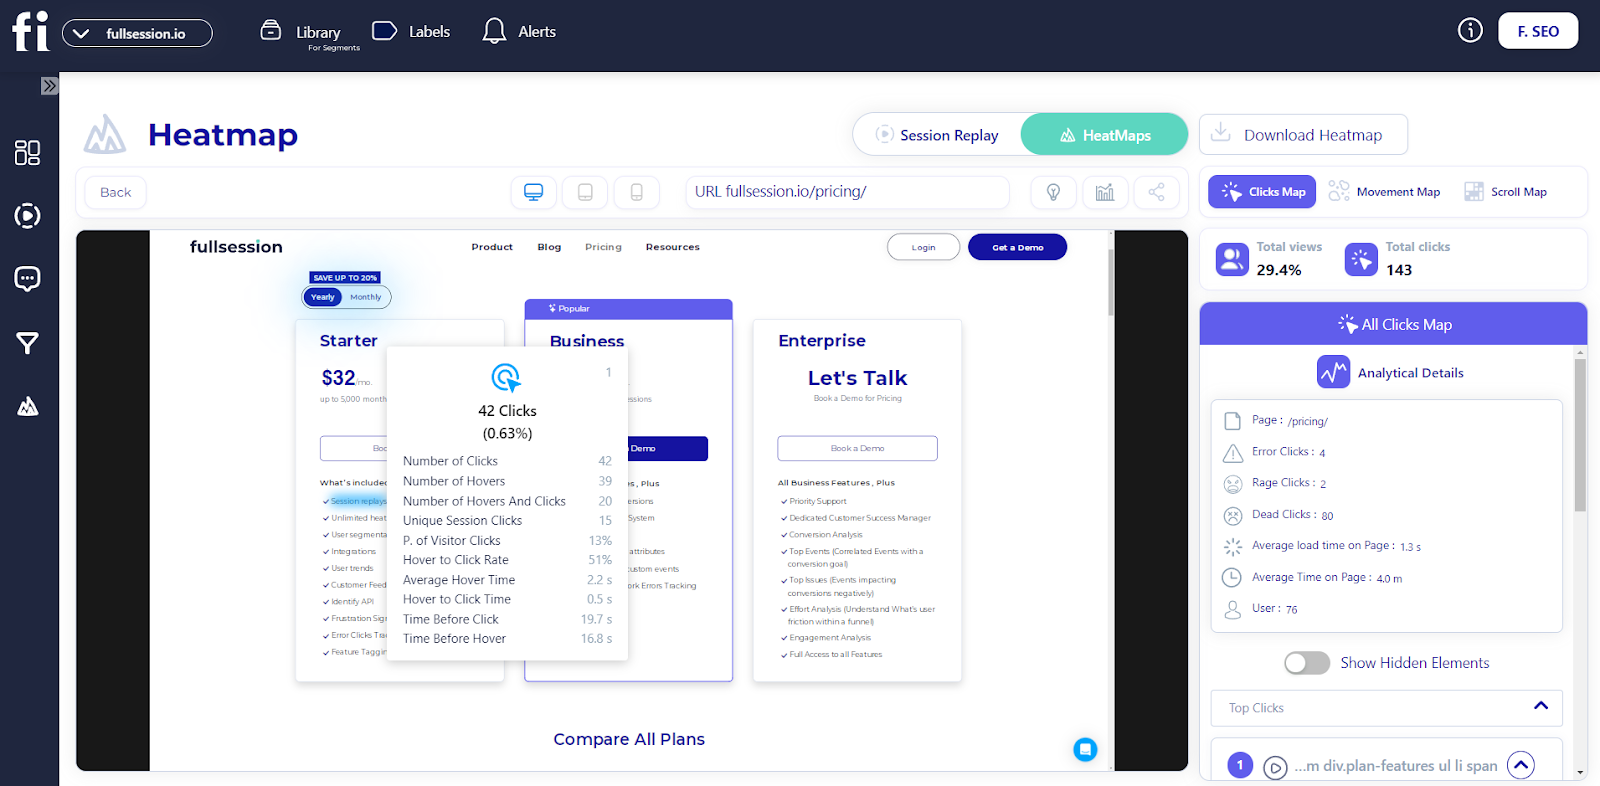
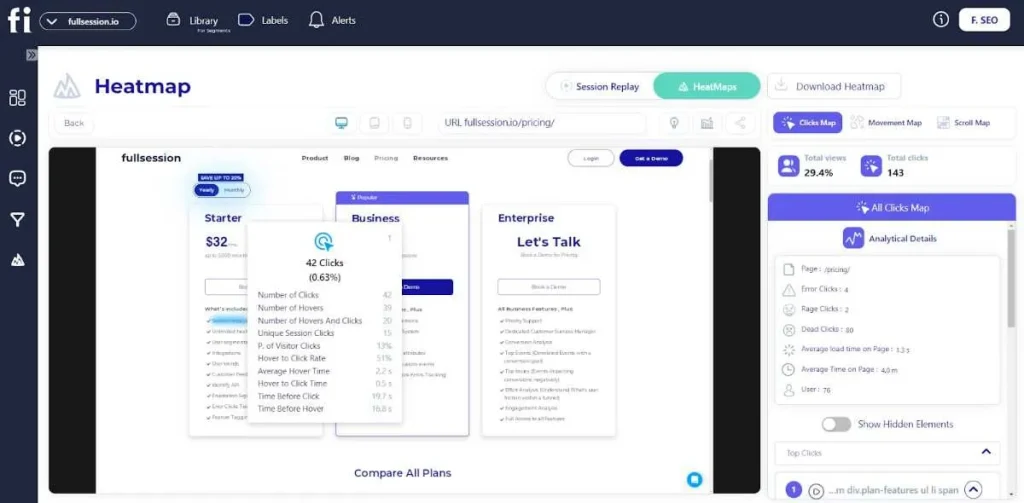
In FullSession, the Click Map view shows total clicks, rage clicks, error clicks, and dead clicks in a single right-hand panel.
You can toggle between signal types without leaving the heatmap view, and the panel displays click counts alongside average load time and average time on page.
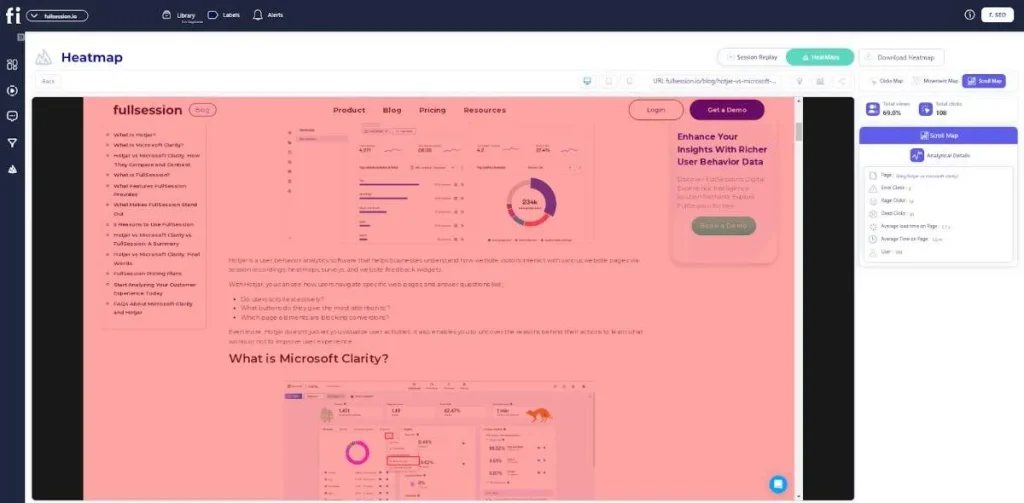
Scroll heatmaps
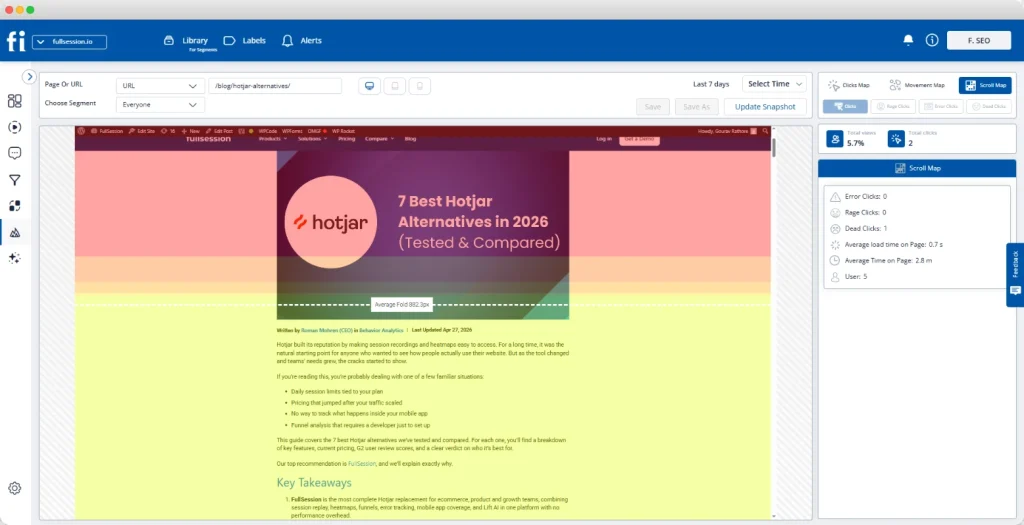
FullSession scroll heatmap preview
Scroll heatmaps show how far users scroll down a page before leaving. The top is always the hottest zone. A sharp color change marks where most visitors scroll no further.
Key page elements (product reviews, size guides, shipping details, and the call to action) are often positioned below where most visitors stop scrolling. That means your target audience never sees the content you need them to see.
FullSession’s Scroll Map automatically marks the average fold line, showing a warm red zone at the top that transitions to yellow, then cool to green below the fold.
You can see this across both desktop heatmaps and mobile devices.
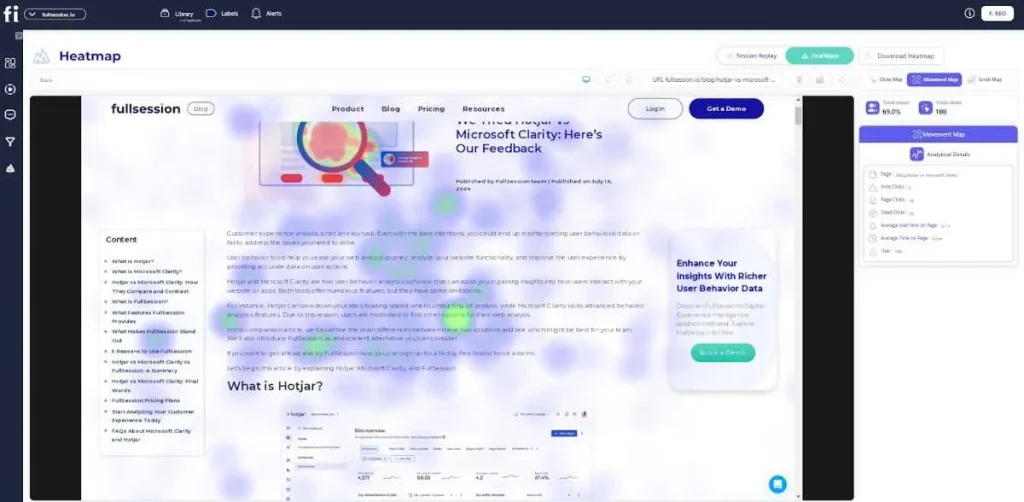
Mouse movement heatmaps and hover maps
FullSession mouse movement heatmap preview
Hover maps track cursor movement on the desktop to identify areas where users linger without clicking. Unlike eye tracking, which involves tracking eye movements with specialist hardware, hover maps use cursor data as a proxy for attention.
Cursor clusters near a price element without a corresponding click mean shoppers are pausing to evaluate. Clusters near a return policy link confirm that information is a genuine decision point.
FullSession’s Movement Map displays these clusters as soft purple blur spots, and they work best as a supporting signal alongside click and scroll data.
One thing to keep in mind: hover maps only capture desktop user behavior. Mobile users don’t generate hover events, so always analyze the mobile experience and desktop heatmaps separately.
Most ecommerce teams overlook dynamic heatmaps. That’s a mistake, because they cover the pages where revenue is won or lost.
Standard heatmaps work on static pages with fixed URLs. Your cart, checkout steps, and order history all use dynamic URLs that change per session, and a static heatmap can’t track them.
Dynamic heatmaps solve this by grouping all URL variants that match a defined pattern into a single, readable view.
FullSession handles dynamic URL grouping natively. Configure a pattern once, and it aggregates all matching sessions into one heatmap.
Apply E-commerce Heatmaps Across Your Conversion Funnel
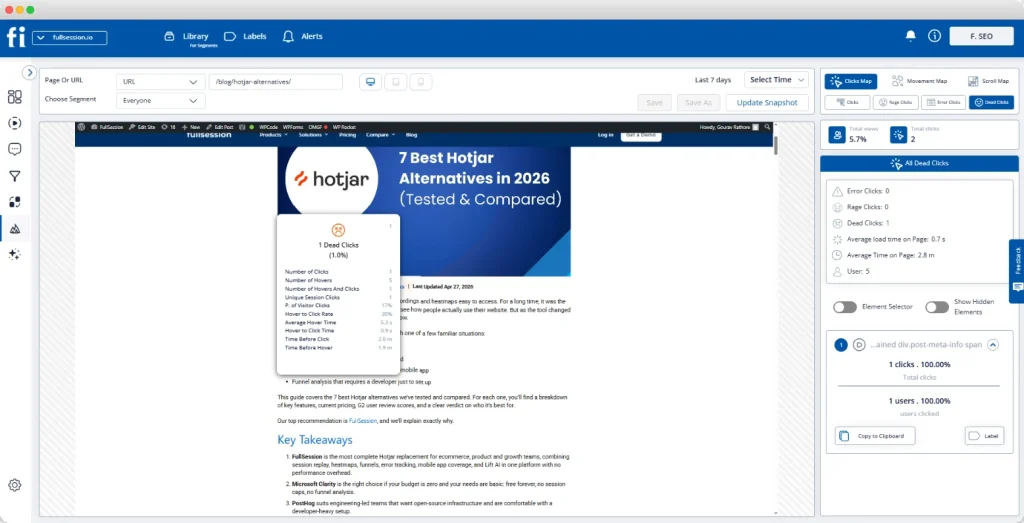
FullSession dead clicks preview
The highest return comes from applying e-commerce heatmaps systematically across four pages. Think of it as the e-commerce heatmap funnel audit: Category, Product Detail, Cart, Checkout.
Category and collection pages
Goal: help shoppers find and commit to a product quickly.
Scroll signal: A sharp drop-off after the first row means visitors aren’t browsing. They land, fail to find what they want immediately, and leave.
Click signal: No activity on filter and sort controls usually means those elements are poorly positioned, not unwanted.
Dead zone signal: Clicks on product thumbnails that don’t generate PDP traffic indicate a broken link, a direct revenue leak that’s invisible without a click heatmap.
Use the scroll map and the click map together. Collect at least 2,000 sessions per device type before drawing conclusions.
Product detail pages
Scroll signal: If fewer than 40% of visitors reach your product reviews, moving reviews above the fold is almost always worth testing first.
Dead click signal: Repeated clicks on a size or color selector that register as dead clicks mean the selector isn’t responding. This is one of the most common friction points on apparel and footwear ecommerce sites.
Hover signal: Cursor clustering near shipping estimates or return policy text on desktop confirms those elements are active decision points. Make them easier to find.
FullSession lets you link directly from a heatmap click cluster into session replay filtered to the same segment, so you can watch the exact moment a shopper hits the friction.
Goal: maintain purchase intent and move shoppers to checkout.
Product image clicks: Shoppers clicking cart product images are rechecking their choice. Link those images back to the PDP.
Coupon field rage clicks: Repeated attempts on a discount field mean the field is broken, or code failures have no clear feedback.
Scroll drop-off before checkout: On smaller screens, mobile users who don’t scroll to the checkout call to action simply never see it.
Cart pages require dynamic heatmaps. FullSession handles URL pattern matching automatically for all cart sessions.
Checkout page
Goal: complete payment with minimum friction.
Click signals: Rage clicks on form fields indicate unclear labels or broken validation. A cluster directly on the “Pay Now” button typically signals a payment processing error.
Scroll signals: Visitors who don’t scroll to the payment section may be blocked by a form field error they can’t see.
Session replay bridge: When a heatmap shows an anomaly, move into session replay tools. FullSession’s replay view shows the full page recording alongside a timestamped session event timeline, so you can identify exactly what broke and why.
Heatmaps show what’s happening. Interpreting what it means is where most teams go wrong.
Step 1: Segment before you analyze
Filter by device type first. Mobile and desktop behavior look completely different, and aggregate data blends both. Then segment by traffic source and new versus returning visitors.
Step 2: Identify the pattern type
A hot zone near an important element means engagement. A hot zone near a non-interactive element means confusion. A dead zone on a CTA means a visibility problem. Rage clicks mean broken expectations. Name the pattern type before assigning meaning to it.
Step 3: Map the pattern to a business outcome
A dead click on a product image only matters if product detail page traffic is low. A rage click on a coupon field only matters if checkout abandonment is high at that step. Proximity to a commercial decision point determines priority.
Step 4: Form a specific hypothesis
State the observation, the mechanism, and the predicted outcome. For example: “The scroll heatmap shows that most mobile visitors stop before reaching the add-to-cart button. Moving add-to-cart above the fold on mobile should increase the product-detail-to-cart rate.”
Step 5: Validate with session replay before testing
Watch 10 to 15 recordings from visitors who show the pattern. A scroll drop-off that looks like a UX issue may turn out to be a broken image causing a layout collapse on certain screen sizes, which is a technical fix rather than a design test.
Heatmaps give you both qualitative and quantitative data. The visual pattern shows where; click counts and scroll percentages tell how often. Together, they give you what analytics dashboards and user interviews alone can’t.
If you’ve completed this process and want to move into structured testing, see a prioritized CRO test plan built from ecommerce heatmap data.
Run A/B Tests Driven by Heatmap Insights
Heatmaps are most valuable when they drive specific tests, not general redesigns. Here’s how heatmap insights map directly to testable ideas to help you optimize your store:
Layout test: Scroll heatmap shows most mobile visitors stop before reaching the add-to-cart button. Test: move add-to-cart to a sticky bar visible throughout the scroll.
CTA test: Click heatmap shows cursor lingering near “Add to Cart” on desktop, but click-through rate is low. Test: add micro-copy directly below the button, such as “Free returns within 30 days,” and measure the change.
Form fix: Rage clicks cluster around billing address fields. Session replay confirms phone number validation errors. Test: accept multiple phone formats and add inline error messages field by field.
Navigation test: Filter panel shows a dead zone on mobile. Test: move filters to a horizontal bar above the product grid and measure pages-per-session and add-to-cart rate.
Always collect at least 2,000 sessions per device type before taking action. Low-traffic pages need 30-day collection windows. Acting on fewer than 500 sessions is the fastest way to reach a confident but wrong conclusion.
Compare E-commerce Heatmap Tools
Not all heatmap tools handle e-commerce use cases equally. The table below covers the five platforms most commonly evaluated for online stores. Choosing the right one has a direct impact on website performance monitoring at the funnel level.
Yes, via URL targeting, with support for dynamic content and SPAs.
Yes
Yes
No
No (masks inputs, PCI via processor)
VWO
Yes
Yes
Yes
No
Partial (PCI Level 2 compliant)
Use Advanced Dynamic Heatmap Tactics
Once your core heatmap setup is running, these tactics help you get more out of the data on pages and traffic segments that most teams never look at closely enough.
Consolidate cart sessions into one view
The most useful dynamic heatmap setup for e-commerce teams is URL pattern matching on the cart page. Instead of scattered individual sessions, you see aggregate behavior across all cart visits: which product images get the most attention, where coupon attempts fail, and where users scroll to.
Track carousel and slider engagement
Many e-commerce homepages and category pages use rotating banners to promote products. Standard heatmaps can’t track what happens as the carousel advances.
Dynamic heatmaps capture engagement with each slide state, revealing whether shoppers click through to promoted products or only engage with the default slide.
This is often how teams discover their banner is generating zero website traffic to the items it features.
Use hover maps as hesitation indicators
On high-consideration product pages (high-price items, subscriptions, configurable products) hover maps are most useful on desktop. Cursor clustering near a price element without a click means shoppers are pausing.
Rather than removing the element, make the information it carries more visible. Display monthly payment options next to the full price. The hesitation tells you what to fix.
Compare heatmaps across traffic sources
Shoppers from Google Shopping behave differently from email subscribers arriving on the same page. Paid traffic typically has higher purchase intent but less brand familiarity.
Segment your heatmaps by traffic source before setting a hypothesis; otherwise, a fix that works for paid visitors looks inconclusive when measured against all traffic.
Validate releases with before-and-after heatmaps
Every time your team ships a meaningful layout change, run a new heatmap cycle for at least two weeks before declaring success. Redesigns frequently optimize one metric while creating new friction elsewhere.
A before-and-after comparison shows the full picture that conversion rate alone obscures.
Follow Technical Best Practices for Reliable Data
A heatmap tool running without proper setup generates misleading data. These five requirements are non-negotiable:
Install via tag manager. Add the FullSession script through Google Tag Manager or your platform’s native integration: Shopify, BigCommerce, WooCommerce, WordPress, or Wix. Setup takes under five minutes and requires no direct theme code changes.
Set minimum sample thresholds. Don’t act until a page has at least 2,000 sessions per device type. High-traffic pages reach this in days. Slower pages need a 30-day window.
Configure dynamic URL grouping. Set URL patterns like /cart/* or /checkout/step/* for cart and checkout pages. Without this, each session generates an orphaned heatmap too small to be useful.
Mask sensitive fields. Payment card numbers and CVV inputs are masked at the script level and never transmitted. Verify masking is active on every checkout page before going live. See our data masking best practices for a full configuration checklist.
Refresh baselines after releases. Historical data reflects the old layout. Create a clean baseline the day a redesign goes live. FullSession lets you compare snapshots side by side.
Measure Impact on Conversions and Customer Experience
Running ecommerce heatmaps without measurement turns them into activity rather than results.
Track these metrics after every heatmap-driven change:
Conversion rate before and after: Compare checkout completion rate and add-to-cart rate over 14-day windows on each side of the change. Use page-level goals, not site-wide conversion rate.
Revenue per visitor: More reliable than conversion rate alone because it captures average order value changes alongside conversion rate shifts.
Rage click and dead click frequency: After fixing a broken element, track whether frustration signals drop in the next heatmap cycle. A reduction confirms that the fix resolved the actual problem.
Scroll depth to target element: After repositioning content, confirm in the next heatmap that more users scroll to reach the element. If scroll depth improves but conversion stays flat, the content (not the position) is the real barrier.
Funnel drop-off rate: Pair heatmaps with funnel analysis to move from “this area has friction” to a specific step, a percentage, and an estimated monthly revenue impact. That’s how you build the business case for your optimization efforts and prioritize them above everything else on the roadmap.
Integrate Heatmaps With Session Replay and AI Prioritization
FullSession is a full behavioral analytics platform, not a standalone website heatmap tool. E-commerce heatmaps are the entry point into a broader workflow.
Platform integrations
FullSession integrates natively with Shopify, BigCommerce, WooCommerce, WordPress, and Wix. It works alongside GA4: GA4 provides quantitative traffic data, while FullSession adds the qualitative behavioral layer on the same pages.
For experimentation, FullSession integrates with Optimizely so you can see not just which A/B variant won, but how visitors interact differently with each version.
Session replay
When a heatmap shows an anomaly, move directly into session replay. This happens inside FullSession without leaving the platform.
The replay interface shows the full page recording on the left and a timestamped session event timeline on the right, including every page the visitor navigated.
This is how “something is wrong at checkout step 3” becomes “Android Chrome users are hitting a JavaScript error that blocks form submission.”
Lift AI
FullSession’s Lift AI is an AI agent that scans heatmaps, session replays, funnels, and error data together, then ranks friction issues by severity and predicted revenue impact.
The dashboard shows issues sorted into Severe, High, Medium, and Low, each with the affected page, issue type, funnel step, and predicted lift. Once you apply the fix, Lift AI validates the result.
You’re not choosing between fixing the cart page and the PDP on gut feel. You’re working from a ranked, evidence-backed list ordered by expected impact on website performance and more sales.
Error tracking
When a rage click cluster appears on a checkout button, it may be a UX problem or a JavaScript error silently blocking form submission.
FullSession’s error tracking connects JS errors and failed API calls to the sessions and heatmap patterns where they occur. Your engineering team sees the error, the session that triggered it, and the behavioral impact, all in one place.
Follow Privacy and Compliance Requirements
Ecommerce heatmap tools operate under stricter privacy requirements than most other website analytics. FullSession is built with compliance as a default, not an add-on.
GDPR: Your tool should integrate with consent management platforms and capture behavioral data only from visitors who have provided consent. EU data residency options should be available.
CCPA: Visitors who have exercised opt-out rights must be excluded from tracking automatically. No California resident session data should be shared with third parties.
PCI DSS: Payment card numbers and CVV inputs must be masked at the tracking script level and never transmitted. Verify masking is active on every checkout page before launch.
Data retention: Set a 30 to 90-day window matching your optimization cycle. Shorter windows keep data current with the live layout of your store.
Ethical data collection: Confirm your tool doesn’t track users across other websites, doesn’t use behavioral data for advertising, and doesn’t share session data with third parties outside your configured integrations.
Conclusion About E-commerce Heatmaps
Your analytics tells you shoppers are leaving. Ecommerce heatmaps show you where, and that’s the difference between guessing at fixes and knowing which ones to make.
Click maps, scroll maps, movement maps, and dynamic heatmaps give you the visual layer. Paired with session replay, funnel analysis, and error tracking, every pattern connects to a specific fix and a measurable result. Used consistently, they’re the most direct path to more sales without increasing your ad spend.
An e-commerce heatmap is a visual representation of how visitors interact with your store pages. It overlays color-coded user interactions (clicks, scroll depth, mouse movement) onto a screenshot of your web page. Red indicates high interaction; blue shows areas users ignore. Ecommerce teams use heatmap insights to identify areas of friction on product, cart, and checkout pages and to drive conversions without guesswork.
Can ChatGPT create heatmaps?
No. Heatmaps require actual behavioral data from real visitors on your ecommerce site. ChatGPT has no access to your website traffic or user interactions. A tool like FullSession embeds a tracking script that captures real clicks, scroll depth, and mouse movements, then visualizes those user experiences as a color-coded overlay on your live pages.
Can heatmaps be misleading?
Yes. A red hotspot can mean engagement or confusion, depending on whether the element is interactive. Aggregate data can also hide mobile-specific problems: a pattern that looks healthy on a desktop may signal serious friction for mobile users on smaller screens. Always segment by device and validate patterns with session replay before acting on heatmap data.
What is the purpose of a heatmap?
A heatmap makes visitor behavior visible. It transforms raw user interactions into a color-coded overlay so ecommerce teams can instantly identify patterns: where shoppers focus, what they ignore, and where they get stuck. This replaces guesswork with visual evidence, helping teams identify areas to test and fix for maximum impact on conversion rate and customer experience.
Roman Mohren is CEO of FullSession, a privacy-first UX analytics platform offering session replay, interactive heatmaps, conversion funnels, error insights, and in-app feedback. He directly leads Product, Sales, and Customer Success, owning the full customer journey from first touch to long-term outcomes. With 25+ years in B2B SaaS, spanning venture- and PE-backed startups, public software companies, and his own ventures, Roman has built and scaled revenue teams, designed go-to-market systems, and led organizations through every growth stage from first dollar to eight-figure ARR. He writes from hands-on operator experience about UX diagnosis, conversion optimization, user onboarding, and turning behavioral data into measurable business impact.
Every product team has the same dirty secret: they collect more behavioral data than they can act on.
Session replays pile up unwatched. Heatmaps confirm what everyone already suspected. Funnels show where users drop off, but not why, and definitely not what to do about it. The real bottleneck was never data collection. It’s prioritization.
That’s why we built Lift AI.
The prioritization gap in UX analytics
Most analytics tools are excellent at telling you what happened. A smaller number can tell you why. Almost none can tell you what to do next, ranked by business impact, with evidence attached.
This is the gap where teams lose weeks. The PM pulls data one way. The designer interprets it another. Engineering asks for clearer requirements. Growth wants revenue attribution. Alignment meetings multiply. Meanwhile, users keep dropping off at the same checkout step.
We’ve heard this pattern from dozens of teams. It’s not a data problem. It’s a decision problem.
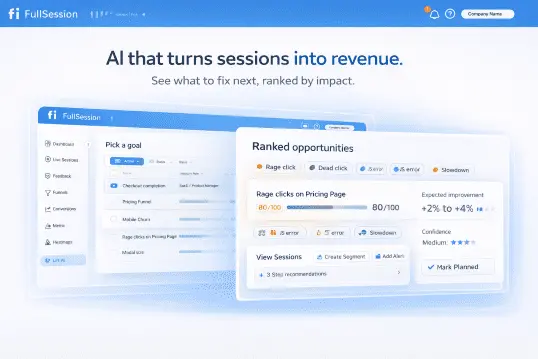
How Lift AI works
Lift AI sits on top of FullSession’s behavioral data layer (session replays, heatmaps, funnels, error tracking) and transforms raw signals into a prioritized action plan.
Here’s the workflow:
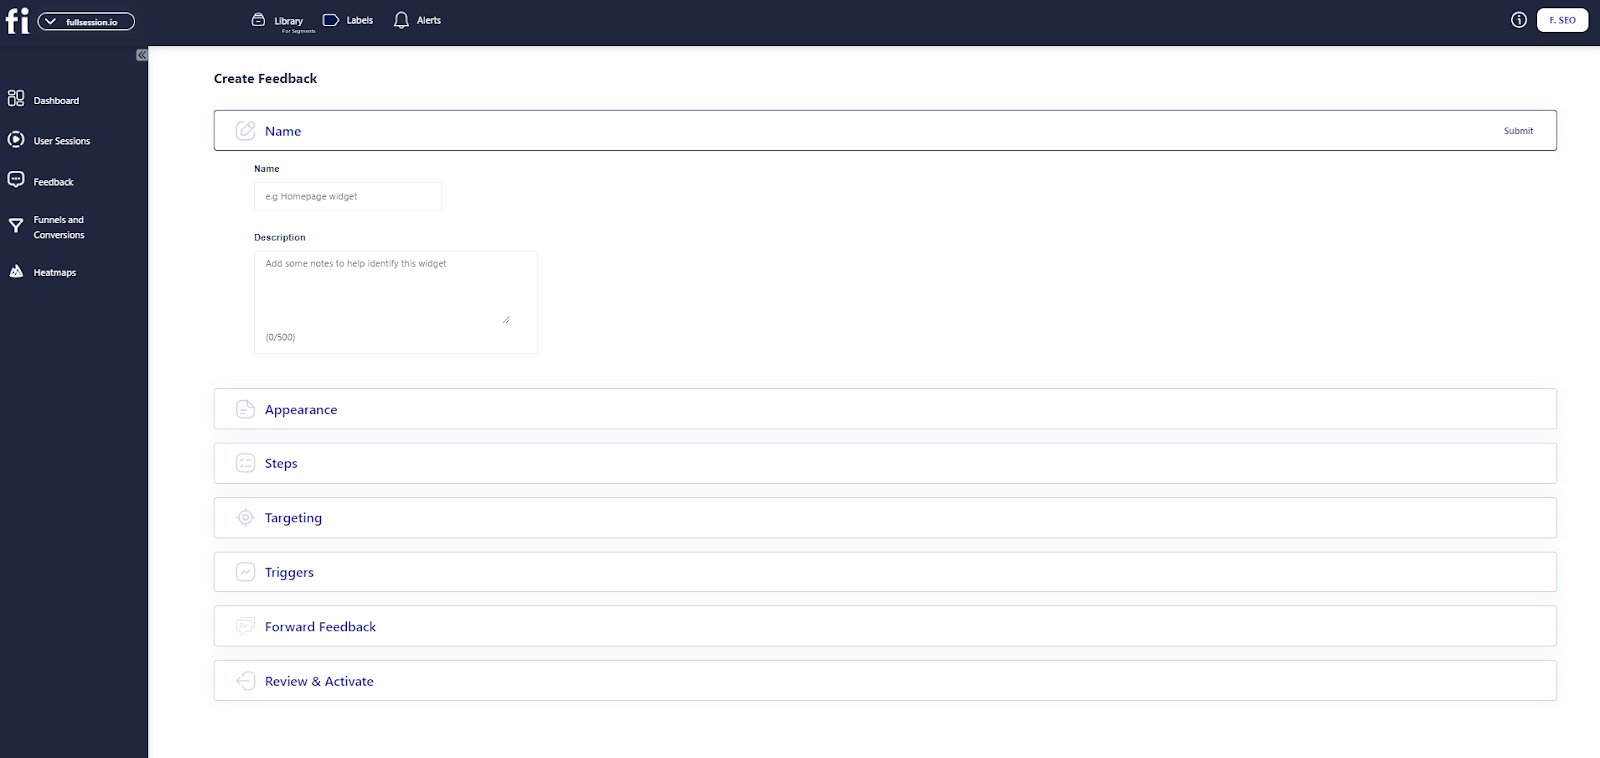
1. Set a goal
Choose the business outcome you’re optimizing for: Checkout completion, Revenue per visitor, Visitor-to-Signup, or any custom funnel goal. This anchors every recommendation to revenue.
2. Lift AI determines the attribution window
The system automatically selects the optimal lookback and forward analysis window based on your funnel metrics. No manual configuration required.
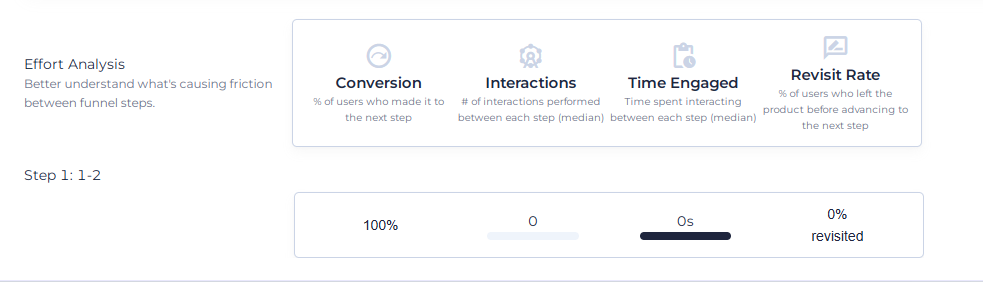
3. Get ranked opportunities
Lift AI analyzes friction, failures, and slowdowns across real sessions. It surfaces a ranked list of opportunities, each with an expected improvement estimate, confidence score, the specific funnel step it impacts, affected pages, and links to example sessions as proof.
That’s it. No dashboards to configure. No segments to build first. No analyst required to interpret the output.
What makes this different from AI summaries
A lot of analytics tools have started bolting on AI features that generate text summaries of your data. These read well but rarely change behavior. They describe what you’re already looking at in slightly different words.
Lift AI is different in three ways:
1. Goal-anchored, not dashboard-anchored
Every recommendation ties back to the specific business outcome you selected. Lift AI doesn’t summarize your heatmap. It tells you which friction point, if resolved, would have the largest estimated effect on your chosen goal.
2. Evidence-backed, not vibes-based
Each opportunity includes the funnel step it affects, the pages involved, and direct links to session replays where the problem manifests. Your team can verify the recommendation before committing engineering time.
3. Confidence-scored, not binary
Not all opportunities are created equal. Lift AI provides a predicated lift impact and when you implemented a recommendation and the post window is complete, it also provides the actual lift. Just be careful not to do lots of changes within the testing timeframe, or the actual lift calculation will be flawed.
Who Lift AI is for
Lift AI is designed for teams responsible for revenue-critical user journeys:
Ecommerce and DTC teams focused on checkout completion and basket value.
PLG SaaS teams optimizing signup-to-paid conversion and onboarding activation.
Growth and Product teams who need a shared, goal-based opportunity list instead of scattered insights across tools.
UX, Engineering, and Analytics teams who want to see exactly where technical and experience issues hurt revenue, with sessions attached.
How to validate a Lift AI recommendation
We’re transparent about what Lift AI is and isn’t. It provides estimates, not guarantees. The recommended workflow is straightforward:
Review the recommendation and its linked evidence (sessions, impacted steps, affected pages).
Ship the fix (UX, copy, flow, or technical) and let Lift AI know you completed the recommended action.
Measure impact using a pre/post comparison.
Your measurement is always the source of truth.
Try Lift AI in beta
Lift AI is available now as a beta feature for all FullSession users. Start a free trial to see it in action, or book a demo if you want a guided walkthrough of how it applies to your specific funnels.
We built this because we believe the next generation of analytics isn’t about more data. It’s about better decisions. Lift AI is our first step toward that.
Roman Mohren is CEO of FullSession, a privacy-first UX analytics platform offering session replay, interactive heatmaps, conversion funnels, error insights, and in-app feedback. He directly leads Product, Sales, and Customer Success, owning the full customer journey from first touch to long-term outcomes. With 25+ years in B2B SaaS, spanning venture- and PE-backed startups, public software companies, and his own ventures, Roman has built and scaled revenue teams, designed go-to-market systems, and led organizations through every growth stage from first dollar to eight-figure ARR. He writes from hands-on operator experience about UX diagnosis, conversion optimization, user onboarding, and turning behavioral data into measurable business impact.
If feature adoption is flat, onboarding drop-off is often the quiet culprit. Users never reach the first value moment, so they never reach the features that matter.
The trap is treating every drop as a UX problem. Sometimes it is tracking. Sometimes it is an intentional qualification. Sometimes it is a technical issue that only shows up for a segment.
What is onboarding funnel drop-off? Onboarding funnel drop-off is the share of users who start an onboarding step but do not reach the next step within a defined time window. In practice, it is a measurement of where users stop progressing, not why they stopped.
Why onboarding drop-off hurts feature adoption
Feature adoption depends on users reaching value early, then repeating it. Drop-off blocks both.
A typical failure mode is optimizing “completion” instead of optimizing “activation quality.” You push more people through onboarding, but they arrive confused, churn later, and support tickets spike.
So the job is not “reduce drop-off at any cost.” The job is: reduce the wrong drop-off, at the right step, for the right users, without harming downstream outcomes.
What most teams do today (and where it breaks)
Most teams rotate between three approaches. Each works, until it does not.
Dashboards-first funnels. Great for spotting the leakiest step. Weak at explaining what users experienced in that step.
Ad hoc replay watching. Great for empathy and spotting obvious friction. Weak at coverage and prioritization. You can watch 20 sessions and still be wrong about the top cause.
Multiple disconnected tools. Funnels in one place, replays in another, errors in a third. It slows the loop, and it makes disagreements more likely because each tool tells a partial story.
The same issue appears in conversion optimization for ecommerce when teams track cart or checkout drop-off without connecting the numbers to session evidence, errors, hesitation, and real shopper behavior.
If you want a repeatable workflow, you need one shared source of truth for “where,” and a consistent method for “why.”
Before you optimize: make sure the drop-off is real
You can waste weeks fixing a drop-off that was created by instrumentation choices.
Common mistake: calling it “drop-off” when users are actually resuming later
Many onboarding flows are not single-session. Users verify email later, wait for an invite, or switch devices.
If your funnel window is too short, you will manufacture abandonment.
A quick integrity check you can run in one hour
Pick the leakiest step and answer three questions:
Is the “next step” event firing reliably? Look for missing events, duplicate events, or events that only fire on success states.
Is identity stitching correct? If users start logged out and finish logged in, you can split one user into two.
Are there alternate paths? Users may skip a step (SSO, invite links, mobile deep links). Your funnel must reflect reality.
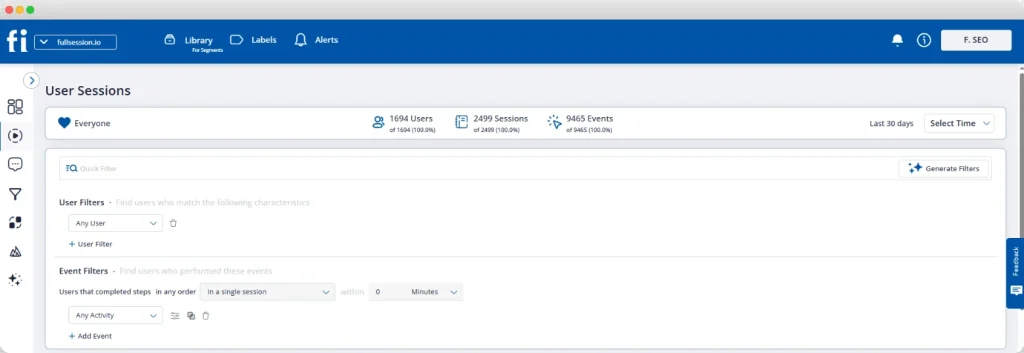
If you use FullSession funnels to quantify the drop, treat that as the “where” layer. Then use sessions to validate whether the “where” is truly a behavior problem or a measurement artifact.
A repeatable diagnose and fix workflow
You need a loop your team can run every sprint, not a one-time investigation.
Step 1: Define the funnel around the first value moment
Pick the moment that predicts feature adoption. Not a vanity milestone like “completed tour.”
Examples in PLG SaaS:
Created the first project and invited a teammate
Connected the first integration and saw data flow
Shipped the first artifact (report, dashboard, deployment)
Write the funnel steps as observable events. Then add the time window that matches your product’s reality.
Step 2: Segment the drop so you do not average away the cause
The question is rarely “why do users drop?” It is “which users drop, under what conditions?”
Start with segments that frequently change onboarding outcomes:
Device and platform (desktop vs mobile web, iOS vs Android)
Acquisition channel (paid vs organic vs partner)
Geo and language
New vs returning
Workspace context (solo vs team, invited vs self-serve)
Plan tier or eligibility gates (trial vs free vs enterprise)
This step is where teams often discover they have multiple onboarding funnels, not one.
Step 3: Sample sessions with a plan, not randomly
Session replay is most useful when you treat it like research.
A simple sampling plan:
10 sessions that dropped at the step
10 sessions that successfully passed the step
Same segment for both sets (same device, same channel)
Now you are comparing behaviors, not guessing.
If your workflow includes FullSession Session Replay, use it here to identify friction patterns that the funnel alone cannot explain.
Step 4: Classify friction into a short taxonomy you can act on
Avoid “users are confused” as a diagnosis. It is not specific enough to fix.
Use a practical taxonomy:
Value clarity friction: users do not understand why this step matters
Interaction friction: misclicks, hidden affordances, unclear form rules
Error friction: validation failures, API errors, dead states
Trust friction: permission prompts, data access, security concerns
Qualification friction: users realize the product is not for them
Attach evidence to each. A screenshot is not evidence by itself. A repeated pattern across sessions is.
Step 5: Validate with an experiment and guardrails
The minimum bar is: drop-off improves at the target step.
The better bar is: activation quality improves, and downstream outcomes do not degrade.
Guardrails to watch:
Early retention or repeat activation events
Support tickets and rage clicks on the same step
Error volume for the same endpoint
Time to value, not just completion
What to fix first: a prioritization rule that beats “largest drop”
The biggest drop is a good starting signal. It is not a complete decision rule.
Here is a practical way to prioritize onboarding fixes for feature adoption:
Priority = Value moment proximity × Segment size × Fixability − Risk
Value moment proximity
Fixes closer to the first value moment tend to matter more. Removing friction from a tooltip step rarely beats removing friction from “connect your integration.”
Segment size
A 40% drop in a tiny segment may be less important than a 10% drop in your core acquisition channel.
Fixability
Some issues are fast to fix (copy, UI clarity). Others require cross-team work (permissions model, backend reliability). Put both on the board, but do not pretend they are equal effort.
Risk and when not to optimize
Some drop-off is intentional, and optimizing it can hurt you.
Decision rule: If a step protects product quality, security, or eligibility, optimize clarity and reliability first, not “conversion.”
Examples:
Role-based access selection
Security verification
Data permissions for integrations
Compliance gates
In these steps, your goal is fewer confused attempts, fewer errors, and faster completion for qualified users. Not maximum pass-through.
Quick patterns that usually produce a real win
These patterns show up across PLG onboarding because they map to common user constraints.
Pattern: drop-off spikes on mobile or slower devices
This is often performance, layout, or keyboard issues. Look for long waits, stuck states, and mis-taps.
Tie the funnel step to technical signals where you can. If you use FullSession Errors & Alerts, use it to connect the “where” to the failure mode. (/product/errors-alerts)
Pattern: drop-off happens right after a value promise
This is usually a mismatch between promise and required effort. Users expected “instant,” but got “set up.”
Fixes that work here are honest framing and progressive setup:
State the time cost up front
Show an immediate partial payoff
Defer optional complexity until after first value
Pattern: users complete onboarding but do not adopt the key feature
Your onboarding may be teaching the wrong behavior.
Look at post-onboarding cohorts:
Who reaches first value but never repeats it?
Which roles adopt, and which do not?
Sometimes the correct “onboarding fix” is a post-onboarding nudge that drives the second meaningful action, not more onboarding steps.
When to use FullSession for onboarding drop-off
If your KPI is feature adoption, FullSession is most useful when you need to move from “we see a drop” to “we know what to ship” without weeks of debate.
Use FullSession when:
You need funnels plus qualitative evidence in the same workflow, so your team aligns on the cause faster.
You need to compare segments and cohorts to avoid averaging away the real problem.
You suspect errors or performance issuesare multiplying drop-off for specific users or devices. (/product/errors-alerts)
You want a consistent diagnose-and-validate loop for onboarding improvements that protects activation quality.
If you are actively improving onboarding, the most direct next step is to map your real funnel steps and identify the single step where you are losing qualified users. Then connect that step to session evidence before you ship changes.
If your team is evaluating platforms, a FullSession demo is the fastest way to see how funnels, replay, and error signals fit into one diagnostic loop.
FAQs
How do I calculate onboarding drop-off rate? Pick two consecutive steps and a time window. Drop-off is the share that completes step A but does not complete step B within that window. Keep the window consistent across comparisons.
What is a good onboarding drop-off benchmark for SaaS? Benchmarks are usually misleading because onboarding includes intentional gates, different value moments, and different user quality. Use benchmarks only as a rough prompt, then prioritize based on your own segments and goals.
How many steps should my onboarding funnel have? As many as your first value moment requires, and no more. The right number is the minimum set of actions that create a meaningful outcome, not a checklist of UI screens.
How do I know whether drop-off is a tracking issue or a UX issue? If replays show users reaching the outcome but your events never fire, it is tracking. If users are stuck, retrying, or hitting errors, it is UX or technical friction. Validate identity stitching and alternate paths first.
Should I remove steps to reduce drop-off? Sometimes. But if a step qualifies users, sets permissions, or prevents bad data, removing it can reduce product quality and increase support load. Optimize clarity and reliability before removing gates.
How do I connect onboarding improvements to feature adoption? Define the activation event that predicts adoption, then track repeat behavior after onboarding. Your success metric is not only “completed onboarding,” it is “reached first value and repeated it.
”What segments matter most for diagnosing onboarding drop-off? Start with device, channel, new vs returning, geo, and role or workspace context. Then add product-specific gates like trial vs paid and integration-required vs not.
Roman Mohren is CEO of FullSession, a privacy-first UX analytics platform offering session replay, interactive heatmaps, conversion funnels, error insights, and in-app feedback. He directly leads Product, Sales, and Customer Success, owning the full customer journey from first touch to long-term outcomes. With 25+ years in B2B SaaS, spanning venture- and PE-backed startups, public software companies, and his own ventures, Roman has built and scaled revenue teams, designed go-to-market systems, and led organizations through every growth stage from first dollar to eight-figure ARR. He writes from hands-on operator experience about UX diagnosis, conversion optimization, user onboarding, and turning behavioral data into measurable business impact.
25 Website Optimization Tools to Boost Traffic and Conversions in 2025
By Daniela Diaz • Updated 2025
TL;DR: In the competitive digital landscape of 2025, a “good” website isn’t enough. If your site is slow, confusing, or invisible to search engines, you are leaving money on the table. Website optimization is the holistic practice of improving every aspect of your site—from speed and SEO to UX and conversions.With thousands of tools available, this guide curates the top 25 across SEO, UX, CRO, speed, and content to build a high-performance stack that actually drives growth.
Roman Mohren is CEO of FullSession, a privacy-first UX analytics platform offering session replay, interactive heatmaps, conversion funnels, error insights, and in-app feedback. He directly leads Product, Sales, and Customer Success, owning the full customer journey from first touch to long-term outcomes. With 25+ years in B2B SaaS, spanning venture- and PE-backed startups, public software companies, and his own ventures, Roman has built and scaled revenue teams, designed go-to-market systems, and led organizations through every growth stage from first dollar to eight-figure ARR. He writes from hands-on operator experience about UX diagnosis, conversion optimization, user onboarding, and turning behavioral data into measurable business impact.
TL;DR: Teams that pair interactive heatmaps with funnel jump-to-replay identify friction faster and protect conversion on priority flows. Updated: Nov 2025.
Privacy: Sensitive inputs are masked by default; allow-list only when truly necessary.
Choose FullSession if you want interactive heatmaps with real-time readouts, quick funnel drop-off context, and a privacy-first capture model designed to keep payloads light—ideal for PLG teams who need fast diagnosis and fewer tools to juggle.
Choose Hotjar if you mainly want a surveys‑first UX stack and prefer its broader template library.
Note: FullSession also includes in‑app feedback, so teams can keep feedback + heatmaps + funnels in one workflow.
Risk #1: Different heatmap sampling windows create apparent discrepancies. Mitigation: Align windows (e.g., 7 days) and device filters before comparing.
Risk #2: SDK overhead on Core Web Vitals. Mitigation: Use streamed, batched capture; keep masking defaults to reduce payload.
Risk #3: Team change-management. Mitigation: Save presets (A/B Rescue, Mobile Fold, Rage-Tap) and run a 15-minute workflow enablement.
Does FullSession support the same heatmap types as Hotjar?
Yes—click/tap and scroll coverage, plus frustration signals. FullSession emphasizes interactive/near real-time readouts and quick funnel context.
How does pricing compare?
Both have public pricing pages; Hotjar highlights a free plan with session caps and paid tiers. Confirm current details on each vendor’s site.
What about privacy?
FullSession masks sensitive inputs by default with allow-lists for exceptions; Hotjar documents privacy practices across its suite. Evaluate per your data policy.
Can I migrate saved views?
Recreate your top filters (pages, devices, variants) as saved presets in FullSession; parity typically takes ~30 minutes.
Will this slow my site?
FullSession capture is engineered for low overhead via streaming/batching; keep masking defaults to minimize payload.
Can I still use surveys/polls?
If you rely heavily on Hotjar’s surveys, you can keep them and run FullSession for heatmaps/funnel triage—or consolidate as your team prefers.
Do I need replays?
Heatmaps show where; replays reveal why. Many teams use both for faster fixes, especially on mobile friction.
Roman Mohren is CEO of FullSession, a privacy-first UX analytics platform offering session replay, interactive heatmaps, conversion funnels, error insights, and in-app feedback. He directly leads Product, Sales, and Customer Success, owning the full customer journey from first touch to long-term outcomes. With 25+ years in B2B SaaS, spanning venture- and PE-backed startups, public software companies, and his own ventures, Roman has built and scaled revenue teams, designed go-to-market systems, and led organizations through every growth stage from first dollar to eight-figure ARR. He writes from hands-on operator experience about UX diagnosis, conversion optimization, user onboarding, and turning behavioral data into measurable business impact.
TL;DR: Teams that pair interactive heatmaps with funnel drop-off context identify checkout friction faster and protect completion rates on the most valuable paths. Updated: Nov 2025.
Privacy: Inputs are masked by default; allow-list only when necessary.
SaaS checkout (subscriptions): Choose heatmaps + Funnels with device segmentation to isolate plan card interactions, below-the-fold CTAs, and disabled “Continue” states. Prioritize steps where payment + tax + address forms stack vertically on mobile.
Ecommerce checkout (carts): Choose heatmaps + Funnels focused on coupon/gift card fields, shipping method toggles, and guest vs sign-in friction. Prioritize tap clusters near Apply buttons and address auto-complete behavior.
Hybrid orgs: Standardize on Interactive Heatmaps for both flows so teams triage where (heatmap) → drop-off (funnel) → why (optional replay) in one motion.
Feature / Cost / Privacy Parity (Updated Nov 2025)
Snapshot of how SaaS vs Ecommerce checkout optimization typically uses FullSession. Use it to choose your starting configuration, then compare the best checkout optimization software if your ecommerce team needs a broader view of tools for checkout diagnosis, funnel analysis, and conversion improvement.
Feature parity (SaaS vs Ecommerce)
Capability
SaaS Checkout
Ecommerce Checkout
Updated
Device/viewport segmentation
Required for plan grid + billing stacks
Required for cart + shipping steps
Nov 2025
Rage-tap / dead-tap overlays
Disabled “Continue”, SSO, plan toggles
Coupon “Apply”, gift card, shipping toggles
Nov 2025
Scroll/fold analysis
CTA falls below fold on mobile
Order summary pushes CTA below fold
Nov 2025
Funnel jump-to-heatmap
Plan → Billing → Confirm
Cart → Shipping → Payment → Confirm
Nov 2025
(Optional) jump-to-replay
Validate validation states & timing
Validate auto-complete & API latencies
Nov 2025
Cost posture (operating guidance)
Lens
SaaS Checkout
Ecommerce Checkout
Updated
Data capture scope
Target pricing/plan + payment steps
Target cart + checkout steps
Nov 2025
Scaling watch-outs
Long forms inflate retries; keep masking
High traffic → sample windows sensibly
Nov 2025
Optimization cadence
Weekly micro-tweaks behind flags
Daily micro-tweaks tied to promo cadence
Nov 2025
Privacy posture
Area
SaaS Checkout
Ecommerce Checkout
Updated
Input masking defaults
Keep masked; allow-list only non-sensitive display fields
Get started on the plan that fits your workflow. You can switch plans anytime.
FAQs
What’s the difference between SaaS and ecommerce checkout heatmaps?
SaaS emphasizes plan selection + form validation, while ecommerce emphasizes cart/coupon and shipping/payment toggles. Heatmaps reveal where attention stalls; Funnels quantify impact.
Do I need session replay to optimize checkout?
Heatmaps + Funnels identify where and how much. Replay is optional but useful to verify why (e.g., disabled states, API errors).
How do we avoid exposing sensitive data?
FullSession masks inputs by default. Only allow-list non-sensitive fields required for UX diagnosis and document the decision.
Will adding heatmaps slow checkout?
FullSession capture is streamed/batched to minimize overhead and avoid blocking render.
Can I compare pre- and post-fix quickly?
Yes—re-run heatmaps for 24–72h, then compare predicted median vs observed median completion in Funnels.
What should we test first?
Start with mobile fold position, coupon “Apply” UX, tap-target sizes, and disabled-state feedback. These drive frequent, high-leverage wins.
How do we scale this across brands/locales?
Create saved views for common steps and replicate filters by brand/locale; review daily during promo periods.
Roman Mohren is CEO of FullSession, a privacy-first UX analytics platform offering session replay, interactive heatmaps, conversion funnels, error insights, and in-app feedback. He directly leads Product, Sales, and Customer Success, owning the full customer journey from first touch to long-term outcomes. With 25+ years in B2B SaaS, spanning venture- and PE-backed startups, public software companies, and his own ventures, Roman has built and scaled revenue teams, designed go-to-market systems, and led organizations through every growth stage from first dollar to eight-figure ARR. He writes from hands-on operator experience about UX diagnosis, conversion optimization, user onboarding, and turning behavioral data into measurable business impact.
Website optimization tools help you improve rankings, speed, user experience, and conversions, but the best choice depends on what is actually holding your site back. If your issue is low traffic, you need SEO tools. If users are dropping off, you need UX and CRO tools. If pages feel slow, you need speed diagnostics. This guide breaks down the best website optimization tools by use case so you can choose the right stack faster.
The best website optimization tools depend on your goal. Use Ahrefs or Semrush for SEO, FullSession or Hotjar for user behavior and conversion friction, Google PageSpeed Insights or GTmetrix for speed, VWO for experimentation, and WAVE or BrowserStack for accessibility. Most teams get the best results from a small stack, not a single tool.
Tool
Best for
Category
Best when you need
Main limitation
FullSession
Behavioral insight + funnel friction
UX / CRO
Replay, heatmaps, feedback, funnel analysis together
Best value comes with active optimization work
Hotjar
Lightweight UX research
UX
Quick heatmaps, recordings, surveys
Less depth than larger platforms
Ahrefs
SEO research
SEO
Keywords, backlinks, competitor gaps
Requires regular use to justify spend
Semrush
Broad marketing workflows
SEO
SEO plus content and campaign support
Can feel broad for narrow use cases
Google PageSpeed Insights
Fast diagnostics
Speed
Quick performance review and Core Web Vitals checks
Limited for deeper debugging alone
GTmetrix
Technical performance analysis
Speed
Waterfalls and monitoring
More technical than beginner tools
VWO
Structured experimentation
CRO
A/B testing and optimization programs
Needs traffic and test discipline
WAVE
Accessibility checks
Accessibility
Quick issue detection
Best used with broader testing
How to choose the right website optimization tools
Choose tools based on the problem you need to solve first.
If traffic is low: prioritize SEO tools like Ahrefs or Semrush.
If visitors are not converting: prioritize behavior analytics and CRO tools like FullSession, Hotjar, or VWO.
If your pages are slow: start with Google PageSpeed Insights, GTmetrix, or WebPageTest.
If usability or compliance is a concern: use accessibility tools like WAVE or BrowserStack.
Before buying anything, ask:
What is the biggest performance bottleneck on our site right now?
Which team will actually use this tool every week?
Does this tool help us find issues, validate fixes, or both?
Can we act on the insights without heavy technical overhead?
Key Takeaways
Website optimization tools usually fall into five categories: SEO, UX analytics, page speed, CRO, and accessibility.
The right tool depends on your bottleneck: traffic, friction, speed, or conversions.
Most businesses do better with a focused stack of 2–4 tools than one overloaded platform.
If you want better rankings, start with SEO tools.
If you want higher conversions, start with behavior analytics and CRO tools.
If your site is slow, start with page speed diagnostics
Visualize, Analyze, and Optimize with FullSession
See how to transform user data into actionable insights for peak website performance.
Website optimization tools help you measure, diagnose, and improve specific parts of your website, but they are not the same as optimization strategy. Your strategy tells you what to improve first; tools help you analyze issues, validate changes, and monitor results.
This guide focuses on choosing the right software for UX, SEO, page speed, CRO, and accessibility.
The 5 main types of website optimization tools
UX and behavior analytics tools – show where users get stuck
SEO tools – improve rankings, visibility, and topical coverage
Page speed tools – diagnose performance issues and Core Web Vitals problems
CRO tools – test changes and improve conversion rates
Accessibility tools – find usability and compliance issues
Many of these tools have free and paid versions. Free tools often provide basic features, while paid versions offer more advanced features.
User Experience (UX) Tools: Create Intuitive User Journeys
UX tools help you understand where visitors hesitate, get confused, or abandon key journeys. If your traffic is healthy but conversions are weak, this is often the first category to prioritize.
Which UX tool should you choose?
Choose FullSession if you want behavior analytics plus funnel visibility in one workflow.
Choose Hotjar if you want lightweight heatmaps, recordings, and surveys.
Choose FullStory if you need enterprise-grade experience analytics.
Choose Crazy Egg if your main goal is visual page analysis and simple testing.
Choose UserTesting if you want direct qualitative feedback from real users.
Top UX tools for website owners
Once you know what kind of insight you need, the next step is choosing the right platform. Below are the top UX tools for website owners, along with what each one does best.
FullSession
FullSession is a comprehensive user behavior analytics platform that captures all user interactions, helping you visualize and analyze trends and patterns to optimize your website’s usability, interface, and performance for increased conversions.
FullSession provides a complete overview of user behavior data in a single interface.
Forget about spending hours analyzing numbers. Instead, view real-time session recordings and replays to identify what drives or hinders your user experience, affecting the conversion rate. FullSession highlights the crucial stages of each user’s journey, delivering actionable insights instantly.
Employ website heatmap tools to identify effective and ineffective web page elements. Discover which areas of your website users overlook, evaluate page components, and verify if your changes cause better outcomes.
Identify and remove obstacles preventing visitors from becoming customers. Use conversion rate optimization tools to improve critical stages in your user’s journey and create a streamlined path to conversion through your sales funnel.
Gather user feedback in real-time using website feedback forms. Get a clear understanding of their frustrations and swiftly address their pain points. Rather than guessing, you’ll have precise knowledge of what’s causing issues and why.
Identify, analyze, and fix errors that affect user experience with advanced error analysis. Get visual data on error clicks, network issues, console errors, error logs, and uncaught exceptions. Improve the site reliability and user satisfaction of your digital products.
Rely on FullSession to safeguard your data and protect your users’ privacy. We prioritize security, allowing you to concentrate on improving your site without worrying about data risks.
Hotjar is a full user behavior analytics tool showing how visitors use your website. It helps you understand user behavior to improve their experience.
Key features include heatmaps showing where users click and scroll and session recordings, which playback individual user interactions. Hotjar also has feedback polls and surveys to collect user input directly.
Combining insights from surveys and recordings provides a complete understanding of user experience. It helps you make data-driven decisions to optimize your site and potentially increase engagement and conversions.
Crazy Egg is all about visualizing user behavior with a big focus on heatmaps and A/B testing.
Features include click heatmaps, scroll maps and user recordings. The platform also has strong A/B testing features so you can compare different versions of your pages.
It helps you optimize page layout and content placement based on real user behavior and potentially increase user experience and conversion rates.
FullStory is a digital intelligence platform that shows detailed session replays and makes customer journey analysis.
Features include high-fidelity session recordings, conversion funnel analysis and error tracking. The platform uses machine learning to identify and categorize user frustrations automatically.
You can quickly spot and fix usability issues, understand drop-off points and optimize the overall user experience. It can lead to higher customer satisfaction and potentially higher retention rates.
UserTesting allows for live usability testing with real users for direct feedback. It gathers qualitative insights into user experience and preferences.
Features include video feedback of users completing tasks on your website or app and written answers to specific questions. You can define your target audience and set up custom test scenarios.
You can get in-depth qualitative feedback on your site’s usability, design and overall user experience to inform more user-centric design decisions and improvements.
To improve your website’s UX, consider these best practices:
Simplify navigation: Make it easy for users to find what they need.
Optimize page load times: Fast-loading pages improve user satisfaction.
Use clear calls-to-action: Guide users towards desired actions.
Ensure mobile responsiveness: Your site should work well on all devices.
Implement user feedback: Regularly collect and act on user suggestions.
Conduct A/B testing: Compare different design elements to see what works best.
With UX tools, you can create a more effective website for your visitors leading to increased user engagement, higher conversion rates, and improved overall performance.
SEO Tools: Boost Rankings and Drive Organic Traffic
SEO tools help you improve visibility, discover content opportunities, find technical issues, and benchmark competitors. If your problem is low organic traffic or weak keyword coverage, this should be one of the first categories you invest in.
Which SEO tool should you choose?
Choose WooRank for quick audits and technical issue discovery.
Choose GrowthBar if your team wants AI-assisted content workflows.
Choose Ahrefs for backlink analysis, keyword gaps, and competitor research.
Choose Semrush for a broader SEO and digital marketing suite.
Choose Moz Pro if you want more guided recommendations.
Once you know what kind of SEO support you need, the next step is choosing the platform that best fits your workflow, budget, and level of technical depth.
WooRank
WooRank is an SEO audit and website review tool that helps you boost your search rankings. It gives you actionable insights to optimize your website.
On-page SEO analysis, keyword tracking and competitor analysis are the main features. WooRank also has a site crawl feature that finds technical SEO issues.
You can quickly identify and fix SEO weaknesses and get more search visibility and traffic.
GrowthBar
GrowthBar is an SEO tool for content creators and marketers. It simplifies keyword research and content optimization. AI content outlines, keyword suggestions and backlink analysis are the main features.
GrowthBar also integrates with Google Search Console for real-time data. You can streamline your content creation process, ensure you follow the best SEO practices, and get higher-ranking content and more traffic.
Ahrefs
Ahrefs is a full SEO toolset known for its massive backlink database and competitor analysis. It gives you SEO insights and competitor intelligence.
The main features are site audits, keyword research, content explorer and rank tracking. Ahrefs also has a unique “Content Gap” feature that shows you the keywords your competitors rank for but you don’t.
You can develop data-driven SEO strategies based on competitor insights and complete link analysis.
SEMrush
SEMrush is an all-in-one marketing toolkit with a strong SEO and content marketing focus.
It includes a full digital marketing suite. Keyword research, site audit, backlink analysis and position tracking are the main features.
SEMrush also has tools for PPC, social media and content marketing. You can manage multiple aspects of your digital marketing from one place.
Moz Pro
Moz Pro is a complete SEO software suite that boosts search rankings and traffic. It gives you actionable SEO insights and recommendations.
The main features are site crawl, keyword research, link research, and rank tracking. Moz Pro has a unique “Page Optimization” feature that gives you specific on-page SEO recommendations.
It includes trusted SEO metrics like Domain Authority and gives detailed insights to guide your SEO efforts and increase search visibility and traffic.
How to use SEO tools effectively
To get the most out of SEO tools, follow these tips:
Set clear goals for your SEO efforts.
Use multiple tools to get a complete picture.
Focus on actionable data and insights.
Regularly monitor your progress.
Keep learning about SEO best practices.
Start by auditing your site to find quick wins. Use keyword research to guide your content strategy. Track your rankings and adjust your approach as needed.
Prioritize fixing technical issues that may hurt your rankings. Pay attention to your competitors’ strategies and learn from their successes.
Remember, SEO is an ongoing process. Use these tools consistently to stay on top of changes and opportunities in your niche.
Page Speed Optimization Tools: Accelerate Your Website
Page speed affects how people use your website. Slow sites make visitors leave quickly. Fast sites keep people around longer. Google looks at page speed when ranking sites. Faster sites often rank higher in search results.
Slow load times can decrease your conversion rates. People don’t like waiting. They might go to a faster site instead of yours. It means you could lose customers and sales.
Mobile users expect quick loading. With more people using phones to browse, speed matters even more. A fast mobile site can give you an edge over slower competitors.
Key metrics for measuring page speed
To improve speed, you need to measure it. Here are important metrics to track:
Time to First Byte (TTFB): How fast your server responds
First Contentful Paint (FCP): When the first content appears
Largest Contentful Paint (LCP): When the main content loads
First Input Delay (FID): How fast your site reacts to user input
Cumulative Layout Shift (CLS): How stable your page elements are
These metrics help you understand different aspects of your site’s performance. They show where you need to focus your optimization efforts.
Top page speed optimization tools
Several tools can help you check and improve your website speed. Here are some of the best:
Google PageSpeed Insights
GTmetrix
Pingdom
WebPageTest
Dareboost
Each tool offers unique features to analyze your site’s performance.
Google PageSpeed Insights is a free tool from Google. It checks both mobile and desktop versions of your site. It gives you a score out of 100 for your page speed.
It offers detailed suggestions to fix issues. These tips cover things like image optimization and code minification. Google PageSpeed Insights uses real-world data from Chrome users to show how your site performs.
It is great for beginners and experts alike. It’s easy to use and gives actionable advice.
GTmetrix
GTmetrix is a popular tool for checking website performance. It gives you grades for your site’s speed and structure. The tool shows you how long it takes for your page to load fully.
You get a breakdown of what’s slowing your site down. GTmetrix suggests ways to fix these issues. It can also compare your site to others in your industry.
The free version is useful, but paid plans offer more features. These include monitoring and alerts for your site’s performance.
Pingdom
Pingdom offers a simple interface for checking your site’s speed. It shows you how fast your site loads from different locations around the world. It helps you see how your site performs for users in various countries.
The tool breaks down each element of your page. You can see which parts take the longest to load. Pingdom gives you a performance grade and suggests improvements.
It’s good for getting a quick overview of your site’s speed. The paid version offers more detailed monitoring and reporting.
WebPageTest
WebPageTest is a free tool for advanced users. It lets you test your site from many locations and browsers. You can also set up custom test scenarios.
The tool provides detailed waterfall charts. These show you exactly how your page loads over time. WebPageTest also offers video capture of your page loading.
It gives you in-depth data about your site’s performance. This includes information on server response times and content delivery.
Dareboost
Dareboost combines speed testing with monitoring features. It checks your site’s speed and gives you a detailed report. The tool suggests ways to improve your performance.
One unique feature is its ability to compare two versions of your site. It helps you see if the changes you make actually improve speed. Dareboost also offers privacy and security checks.
The tool is good for both technical and non-technical users. It explains issues in plain language and offers clear fixes.
Tips for improving website speed using these tools
Use these tools to find and fix speed issues on your site:
Optimize images: Compress and resize large images.
Minify code: Remove unnecessary characters from your HTML, CSS, and JavaScript.
Use browser caching: Let browsers store static files to load pages faster.
Reduce server response time: Upgrade your hosting or optimize your database.
Enable compression: Use Gzip to reduce the size of your files.
Minimize redirects: Too many redirects slow down your page load time.
Remove render-blocking JavaScript: Load critical JS first and defer the rest.
Use a content delivery network (CDN): Serve your content from servers closer to your users.
Test your site regularly with these tools. Make small changes and measure the impact. Keep working on your site’s speed to stay competitive and keep visitors happy.
CRO Tools: Turn Visitors into Customers
CRO tools offer valuable insights and testing capabilities to optimize websites effectively. It helps you improve user experience and boost conversions.
With CRO tools, you can:
Identify areas of improvement on your website
Test different design elements and content
Understand user preferences and pain points
Increase sales and revenue without more traffic
CRO tools let you analyze user behavior and make data-driven decisions. It leads to higher conversion rates and better ROI.
Top CRO tools for website owners
CRO tools come in various types, each serving different purposes. Here are some top picks:
FullSession
Kissmetrics
VWO (Visual Website Optimizer)
Unbounce
Heap
Let’s review each one.
FullSession
Besides all the user behavior tools we mentioned previously, FullSession also provides conversion funnel analysis. It lets you track, understand and optimize every step of the user journey so you can make data-driven decisions to improve user experience and conversion rates.
The Funnel Steps Visualization is a key part of this feature. You can see users’ flow through each step of your funnel. It helps you identify drop-off points and conversion rates between steps to pinpoint where to improve.
The Funnel Trends feature monitors how user flow and conversion rates change over time. This time series analysis helps you identify trends and seasonality in user behavior so you can plan and optimize better.
The Events Correlations feature shows you the top events that are driving conversions and the top events that are causing drop-offs. It allows you to replicate the good and fix the bad so you can streamline the user journey and improve conversion rates.
The Effort Analysis part gives you a deeper understanding of user engagement in the funnel. It includes metrics like Time Engaged, Top Engaged steps and Revisit Rate. It helps you identify friction points in the funnel, where users struggle, and which steps are most engaging. You can make informed decisions to optimize the user experience and reduce exits from the funnel.
Finally, FullSession’s Segmentation and Comparison feature lets you dive deeper into funnel performance. You can compare performance across different user segments, device type, geographic location or referral source. You can create tailored strategies for specific user groups and compare funnel performance across periods to identify long-term trends and seasonality.
This full-funnel analysis can lead to higher conversion rates and, ultimately, more revenue, so FullSession is a must-have tool for any business looking to optimize its online presence.
Maximize Your Conversion Rate With FullSession
See how our CRO tools help you improve website performance to drive conversions.
Kissmetrics is a customer analytics and engagement platform that tracks and analyzes user behavior across the customer lifecycle. Key features include customer journey mapping, cohort analysis, and A/B testing.
It helps you understand user interactions, optimize conversion funnels, and personalize marketing efforts. The main benefit is its ability to provide actionable insights for improving customer retention and lifetime value.
VWO (Visual Website Optimizer)
VWO is a conversion rate optimization platform. It provides tools to test, analyze and improve website conversions. Features include A/B testing, multivariate testing, heatmaps and advanced targeting options for personalization.
You can create and run complex optimization experiments and see big conversion rate improvements across user segments.
Teams comparing experimentation platforms can also evaluate VWO competitors and alternatives to see which tools better fit their testing volume, analytics needs, and CRO workflow.
Unbounce is a landing page builder and a platform for conversion optimization. It helps you create and test high-converting landing pages without needing developer resources.
Features include a drag-and-drop landing page builder, A/B testing and dynamic text replacement for PPC campaigns. Unbounce also has AI powered optimization suggestions.
You can create and optimize landing pages for specific campaigns and potentially see higher conversion rates and better ROI on marketing spend.
Heap
Heap is an automated digital insights platform for user behavior analysis and conversion optimization. It captures all user interactions automatically without manual tagging. Features include retroactive analysis, funnel analysis and user segmentation.
Heap also integrates with other business tools. You can analyze any user behavior or conversion path and find unexpected insights that can lead to a better user experience and conversion rate improvements.
Strategies for effective A/B testing and conversion optimization
To get the most out of CRO tools, follow these strategies:
Set clear goals for each test
Test one element at a time for best results
Run tests for at least two weeks or until statistical significance
Use both qualitative and quantitative data
Gather direct user feedback through surveys and interviews. This helps you understand the “why” behind user actions.
Use session recordings to spot usability issues and user frustrations. This visual data complements your analytics.
Always base your tests on data and user insights. Avoid making changes based on assumptions or personal preferences.
Remember to test your entire funnel, not just landing pages. Look for optimization opportunities at every stage of the user journey.
Regularly review and update your CRO strategy. User preferences and market trends change, so your website should evolve too.
Website Accessibility Tools: Ensure Inclusivity and Compliance
Web accessibility makes your site usable for everyone, including those with disabilities. It’s not just good practice – it’s often a legal requirement.
By making your site accessible, you reach a wider audience and improve user experience for all visitors. Accessible websites are easier to use on mobile devices and often rank better in search results.
Key accessibility standards (WCAG 2.1)
WCAG 2.1 (Web Content Accessibility Guidelines) sets the standard for web accessibility.
These guidelines focus on four main principles:
Perceivable: Users must be able to see the information presented.
Operable: Users must be able to use the interface.
Understandable: Users need to understand the information and interface.
Robust: Content must be robust enough to work with various technologies.
Following these guidelines helps you create a site that works for everyone.
Top accessibility tools for website owners
Several tools can help you check and improve your site’s accessibility. Here are some top picks:
BrowserStack
WAVE
Tanaguru
Rocket Validator
accessScan
These tools scan your site for issues and offer suggestions for fixes.
BrowserStack
BrowserStack’s Accessibility Testing Tool helps developers and website owners ensure their websites are accessible to everyone. It automates the process of checking web pages against WCAG guidelines.
Features include real-time testing across multiple browsers and devices, detailed reports of accessibility issues and integration with popular development workflows. Y
You can identify and fix accessibility barriers quickly and potentially improve user experience and accessibility compliance.
WAVE
WAVE (Web Accessibility Evaluation Tool) is a suite of tools that help authors make their web content more accessible to people with disabilities. Its main purpose is to provide visual feedback about the accessibility of web content by injecting icons and indicators into the page.
Features include detailed error and alert reporting, contrast checking and structure/order view. The benefit for website owners is its simplicity and the ability to see accessibility errors and good practice.
Tanaguru
Tanaguru is an open source automated accessibility testing tool for web developers and quality assurance teams. Its main purpose is to automate accessibility checks against WCAG guidelines and other standards.
Features include full website scanning, detailed reporting with prioritized issues and ability to run tests via API or command line. You can integrate accessibility testing into your development process and catch issues early to reduce the cost of fixes.
Rocket Validator
Rocket Validator is an accessibility and HTML validation tool. Its main purpose is to scan entire websites for accessibility issues and HTML errors.
Features include bulk URL checking, detailed reports referencing WCAG success criteria and the ability to schedule regular scans. You can maintain accessibility compliance across large websites with minimal manual effort.
accessScan
accessScan is an AI-powered web accessibility testing tool. Its main purpose is to provide fast and accurate accessibility audits using machine learning algorithms.
Features include WCAG 2.1 compliance checking, prioritized issue reporting and recommendations for fixes. You can identify and fix accessibility issues quickly, improve user experience, and reduce legal risk of noncompliance.
How to use these tools to improve website accessibility
To improve your site’s accessibility:
Run a scan using one or more of the tools mentioned.
Review the results and prioritize issues.
Fix high-priority issues first, such as broken links or missing alt text.
Test your site on different browsers and devices.
Use Google’s Mobile-Friendly Test to ensure your site works well on mobile.
Regularly re-scan your site to catch new issues.
Remember, accessibility is an ongoing process. Keep checking and improving your site over time.
Benefits of making your website more accessible
Making your website accessible offers many benefits:
Wider audience reach: You’ll be able to serve users with disabilities.
Improved user experience: Accessible sites are often easier for everyone to use.
Better SEO: Many accessibility features also improve search engine rankings.
Legal compliance: You’ll meet legal requirements for web accessibility.
Enhanced brand image: Shows you care about all users.
By using these tools and focusing on accessibility, you create a better website for all users.
How to build the right website optimization stack
Start with one primary goal for the next 90 days.
If your goal is more organic traffic
Use:
Ahrefs or Semrush
Google Search Console
Google PageSpeed Insights
If your goal is higher conversion rates
Use:
FullSession or Hotjar
VWO or another experimentation tool
Funnel analysis and user feedback
If your goal is better UX on high-value pages
Use:
Session replay
Heatmaps
Form analysis
User testing or surveys
If your goal is enterprise-level visibility
Use:
a strong SEO suite
a behavior analytics platform
accessibility scanning
a formal testing workflow
Why Choose FullSession for Website Optimization
FullSession is the top choice for website optimization, offering a range of strong features that can truly transform your approach. Here’s why FullSession should be your go-to tool:
Real-time insights on dynamic elements: We track how users interact with your site’s dynamic content as it happens, giving you the most up-to-date and accurate view of user behavior.
Lightning-fast heatmaps without slowing you down: Our heatmaps process quickly without putting any drag on your site speed. This means you get valuable data without sacrificing performance.
We take privacy seriously: We automatically exclude sensitive information from our recordings, keeping your users’ data safe and your business compliant with privacy regulations.
Make sense of big data, fast: Even with tons of data, FullSession helps you zero in on what matters. Our tools sift through the noise to reveal key insights quickly, so you can make informed decisions without delay.
Keep data where it belongs: We only track user behavior on your site, preventing any misuse of data and ensuring the insights you get are 100% relevant to your business.
Get everyone on the same page: FullSession brings all your teams together on one platform. Whether it’s marketing, design, or development, everyone can access and analyze the same data, making collaboration a breeze.
By choosing FullSession, you’re not just getting a tool – you’re getting a partner in optimization.
We combine comprehensive features with a focus on privacy, performance, and teamwork, giving you everything you need to boost your site’s user experience and conversion rates.
Visualize, Analyze, and Optimize with FullSession
See how to transform user data into actionable insights for peak website performance.
Website optimization tools help you analyze and improve various aspects of your website.
These tools can boost your site’s speed, user experience, and search engine visibility. By using them, you can identify areas that need improvement and make data-driven decisions.
Each tool offers unique features to help you optimize your website. You can track metrics, perform A/B tests, or generate heatmaps to understand user behavior.
Remember, website optimization is an ongoing process. Regularly using these tools will help you stay competitive and provide a better experience for your visitors.
By investing time in website optimization, you can:
Increase conversion rates
Improve search engine rankings
Enhance user satisfaction
Reduce bounce rates
Choose the tools that best fit your needs and budget. With the right combination, you’ll be well-equipped to boost your web performance and achieve your online goals.
FAQs About Website Optimization Tools
Let’s answer the most common questions about website optimization tools.
What are website optimization tools?
Website optimization tools are software platforms that help improve a site’s performance, visibility, usability, and conversion rate. They usually fall into five groups: SEO, UX analytics, page speed, CRO, and accessibility tools.
What is the best website optimization tool?
There is no single best tool for every site. The best option depends on the problem you are solving. For SEO, many teams prefer Ahrefs or Semrush. For UX and behavior analysis, teams often choose tools like FullSession or Hotjar. For page speed, Google PageSpeed Insights is a common starting point.
Which website optimization tools should I use first?
Start with the category closest to your bottleneck. If traffic is low, begin with SEO tools. If traffic is healthy but conversions are weak, start with UX and CRO tools. If your site is slow, begin with performance testing tools.
Do small businesses need multiple optimization tools?
Not always. Small teams can often start with a lean stack: one SEO tool, one speed tool, one accessibility checker, and one behavior analytics tool.
Are free website optimization tools enough?
Free tools can cover a lot of ground early on, especially for site audits, performance checks, and basic SEO data. Paid tools become more useful when you need competitive analysis, advanced segmentation, or formal experimentation.
What is the difference between website analytics and website optimization tools?
Analytics tools show what happened. Optimization tools help you understand why it happened and what to improve next.
Remember, the best solution depends on your specific needs and goals.
Increasing your conversion rate is key to your Shopify store success. A higher conversion rate means more sales, improved ROI and a healthy online business. But how can you turn more of your visitors into paying customers?
In this ultimate guide, you’ll learn:
How to optimize your Shopify store
How to get more conversions on Shopify
How to optimize user experience and build trust
How to decrease cart abandonment and sell more
We’ll also introduce you to FullSession, an all-in-one user behavior analytics software that helps Shopify store owners like you capture and visualize all user engagement, analyze trends and patterns with laser precision and optimize online shops for peak performance to drive conversions.
Conversion Rate Optimization (CRO) helps you grow the percentage of website visitors who take an expected action, such as buying, subscribing to a newsletter, or adding a product to a cart.
For Shopify stores, CRO is about analyzing user behavior, identifying friction points, and making changes to improve the user experience and get more sales. If checkout is where users drop off, ecommerce checkout optimization software can help teams diagnose form friction, payment errors, and abandonment patterns more clearly.
Why CRO matters for Shopify stores
CRO impacts your bottom line. Increasing the percentage of visitors who buy your products can grow your revenue without boosting traffic. That means you’re getting more out of your existing marketing efforts and a better return on investment.
CRO links to improving the user experience. As you optimize for conversions, you’re also making your store more user-friendly, intuitive and appealing to your customers. It means more sales, customer loyalty and repeat business.
A Shopify store optimized for CRO provides a smooth and frictionless shopping experience that sets you apart from the competition.
A data-driven approach to decision-making helps you improve your store’s design, products and marketing based on real user behavior and preferences.
Key metrics to track Shopify store performance
You need to monitor and measure the key performance indicators (KPIs) to optimize your Shopify store conversion rate.
Here are the top ten metrics to track:
Conversion Rate: Percentage of visitors who take an expected action.
Average Order Value (AOV): Average amount spent per transaction.
Cart Abandonment Rate: Percentage of users who add products to the cart but don’t checkout.
Bounce Rate: Percentage of visitors who exit your site after viewing one page.
Time on Site: How long visitors stay in your store.
Pages per Session: Number of pages visited in one session.
Revenue per Visitor: Amount of revenue generated per visitor to your store.
Add to Cart Rate: Percentage of visitors who add products to the cart.
Checkout Completion Rate: Percentage of users who start checkout and complete the transaction.
Customer Lifetime Value (CLV): Total revenue you can expect from one customer during your business relationship.
Now that we have covered the basics, let’s begin with the best strategies on how to get more conversions on Shopify.
Improving the user experience on your Shopify store is key for ensuring that visitors have a seamless, engaging, and satisfying journey from browsing to checkout.
Optimize site speed and performance
A fast-loading website is essential for keeping visitors engaged and converting on ecommerce sites. Slow-loading pages can increase bounce rates and cost you sales.
Use FullSession heatmaps to optimize the product page layout
FullSession website heatmap tools visually represent all user interactions on your online store. They use color-coding to show cold spots and dead zones so you can test different page elements, validate design changes, and improve your website’s visual hierarchy.
FullSession provides click maps, scroll maps, and mouse heatmaps with instant data processing, and without affecting your store performance.
Determine which parts of your product descriptions attract readers
Assess whether customers click your “Add to Cart” buttons frequently enough
Spot areas of the page that customers ignore
It is critical for optimizing your product page layout and content hierarchy.
Make data-driven design
Use the heatmap insights to:
Move key elements to make them more visible
Adjust the layout to guide users to important info
Remove or redesign elements that aren’t getting engagement
Test different button placements
For example, if your heatmap shows users not scrolling far enough to see important product details, you can move that info above the fold.
FullSession’s heatmap feature allows you to make design decisions on your product page based on real user behavior, not assumptions. It leads to big data-driven improvements in your product page performance and conversions.
Research by McKinsey & Company indicates that product recommendations can boost conversion rates by up to 300%. Let’s explain how to optimize your product recommendation strategy.
Implement personalized recommendations
Personalized recommendations can improve the shopping experience:
Use AI-powered recommendation engines to analyze user behavior
Implement “Recommended for You” sections based on browsing history
Suggest products based on past purchases
Create personalized email recommendations
Use collaborative filtering to recommend products popular with similar customers
A study by Barilliance found that personalized product recommendations can account for up to 31% of e-commerce revenue, highlighting their potential impact on your Shopify store’s performance.
Use cross-selling and upselling techniques
Strategic cross-selling and upselling can increase order value:
Suggest complementary products on product pages
Offer bundle deals with related items
Recommend higher-priced alternatives on product pages
Use post-purchase recommendations for follow-up sales
Implement “Complete the Look” suggestions for fashion items
According to Hubspot, the probability of selling to an existing customer is between 60-70%, while the likelihood of selling to a new prospect ranges from 5-20%. This contrast shows the importance of nurturing existing customer relationships through these methods.
Showcase best-selling products
Showcasing popular items can guide customers to purchase:
Create a “Best Sellers” category in your navigation menu
Display “Popular Items” on your homepage
Show “Trending Now” sections in relevant product categories
Use “Customer Favorites” in email marketing campaigns
Add “Often Bought Together” suggestions for popular combinations
Monetate reported that customers who interacted with product recommendations experienced an average cart value boost of 5.5%. Best-sellers often feature in these recommendations, contributing to higher overall spending.
Use FullSession’s user behavior data for better recommendations
FullSession gives you plenty of data to optimize your recommendation strategy.
Determine the most viewed areas of your product pages
Identify the optimal placement for recommendation sections
Analyze how users interact with existing recommendation modules
Test different layouts and designs for recommendation displays
Measure the impact of recommendation placement on click-through rates
Use FullSession heatmaps to position your recommendations where they’re most likely to catch users’ attention and drive conversions.
Continuously test and refine your recommendation tactics based on the insights you gather, and don’t be afraid to experiment with different approaches.
Improve Your Website UX and UI
Learn how FullSession’s interactive heat maps help you find cold spots and dead zones on your site.
Social proof is a powerful psychological trigger that can increase conversions by showing the positive experiences of other customers. Let’s look at how to use social proof in your Shopify store
Display customer reviews and ratings
Customer reviews and ratings are valuable to potential customers and can sway purchasing decisions. Use them effectively:
Show star ratings on product pages
Feature detailed reviews that highlight product benefits
Make the review system easy for customers to use
Ask customers to review products after purchase
Respond to positive and negative reviews professionally
User-generated content (UGC) is authentic visual proof of your product in use.
Create a branded hashtag for customers to share their photos
Show customer photos on product pages
Use UGC in your social media marketing
Run contests to get more UGC
Use UGC in email marketing campaigns
Approximately 70% of consumers consider UGC reviews or ratings before making a purchase, and 93% believe that UGC is very helpful when deciding what to buy.
Implement trust badges and security seals
Trust badges and security seals can reassure customers their personal and financial info is safe. Use them effectively:
Show SSL certificates
Show logos of trusted payment providers
Include industry-specific certifications or awards
Use trust seals from recognized security companies
Place trust elements near critical conversion points, like the checkout button
According to a survey by Econsultancy, 48% of respondents indicated that trust badges reassured them about the security and trustworthiness of a website, showing their importance for building customer confidence.
Use FullSession’s website feedback forms to get testimonials
FullSession’s customer feedback collection tools help you gather customer testimonials to improve your store. To get useful testimonials:
Keep forms short and sweet
Mix rating scales and open ended questions
Ask specific questions about the customer’s experience
Allow customers to opt in to be featured publicly
Time the form to appear after a positive interaction (e.g. a successful purchase)
Identify specific product features or service aspects customers love
Pay attention to the language customers use to describe their experience
Use FullSession’s analytics to see trends in feedback over time
Watch the connected session recording to better understand the comments
Categorize feedback to see areas of strength and opportunities for improvement
Add positive feedback to your store
Use the feedback you get to:
Show short, punchy quotes on product pages
Create a testimonials page
Use customer stories in your marketing materials
Share feedback on social media
Include testimonials in email marketing campaigns
Remember to update your social proof regularly and be transparent about collecting and showing customer feedback. With these practices in place, you’ll be on your way to more conversions and a loyal customer base for your Shopify store.
Boost Customer Satisfaction and Experience
Learn how our customer feedback tools help you identify recurring issues and user needs.
Customer support can have a big impact on your conversion rates by answering customer questions and building trust. Let’s see how to set up a solid support system with live chat and FullSession.
Choose a live chat provider
Choosing the right live chat tool is crucial for your Shopify store:
Consider integration capabilities with Shopify
Look for features like chat routing, canned responses, and analytics
Ensure mobile compatibility for on-the-go management
Check for customization options to match your brand
Evaluate pricing based on your expected chat volume
LiveChat is a popular choice with great features and easy Shopify integration.
Train customer support reps
Well-trained support staff can make a big difference in customer experience:
Provide comprehensive product knowledge training
Develop clear communication guidelines and best practices
Train on using the live chat software effectively
Teach problem-solving and de-escalation techniques
Regularly update training based on common customer issues
Use FullSession’s session recordings with customer feedback tools
FullSession’s session recordings, when combined with customer feedback tools, offer powerful insights for e-commerce support teams.
Visualize customer experiences
Use FullSession’s behavior tracking to:
Watch the exact user journey that led to a support request or feedback
Observe how customers interact with your site before contacting support
Identify specific elements or pages that cause confusion or frustration
See technical glitches or UX issues in real-time as the customer experiences them
This visual context helps support teams understand and address issues more effectively, improving response accuracy and resolution times.
Improve issue detection and resolution
Use FullSession’s data to:
Quickly replicate and verify reported problems by viewing customer actions
Identify patterns in user behavior that frequently result in support tickets
Recognize website areas or features that consistently generate negative feedback
Assess the effectiveness of current help resources and FAQs
By gaining deeper insights into the root causes of customer issues, support teams can resolve problems more efficiently and prevent recurring problems.
Create proactive support strategies
Use FullSession insights to:
Create targeted help content for common pain points identified in recordings
Implement chatbot triggers on pages that frequently generate support requests
Develop more effective onboarding processes for new customers
Suggest improvements to product descriptions or site content to reduce confusion
Design guided tours or tooltips for areas where users often struggle
FullSession helps you create a customer support strategy that fixes issues and drives conversions. Optimize your processes, train your team and improve your chatbot responses. Turn your support center into a conversion tool for your Shopify store.
With mobile shopping on the rise, optimizing your Shopify store for mobile users is key. Let’s explain how to improve their mobile shopping experience and use FullSession’s insights to boost mobile conversions.
Ensure a mobile-responsive design
A mobile responsive design is key to a good mobile user experience:
Use a responsive Shopify theme or customize your current theme
Ensure all elements resize and reposition appropriately on smaller screens
Optimize images and media for faster loading on mobile devices
Use legible fonts and appropriate text sizes for mobile viewing
Implement touch-friendly buttons and interactive elements
Mobile-friendly websites can achieve a 40% higher conversion rate than those that are not optimized for mobile use. It improves the user experience and search engine rankings.
Streamline mobile navigation
Simplified navigation is key for mobile users:
Use a clear and easily accessible menu icon (hamburger menu)
Display search bar at the top of the page
Simplify category structure for mobile users
Use infinite scroll or “load more” buttons instead of pagination
Use sticky headers for quick access to navigation elements
Websites that implement effective mobile navigation strategies can experience conversion rates increase by up to 15% when combined with fast loading times.
Optimize mobile checkout
A streamlined mobile checkout will reduce cart abandonment:
Implement a single-page checkout for mobile users
Use autofill for forms to reduce typing on mobile devices
Offer mobile-friendly payment options like Apple Pay or Google Pay
Ensure error messages are clear and easily fixable on mobile
Provide a guest checkout option to speed up the process
A smooth and optimized mobile checkout process can increase conversions by up to 35.62%. This highlights its critical role in driving sales on mobile devices.
Use FullSession’s mobile session recordings for improvements
FullSession mobile session recordings can give you valuable insights for mobile optimization.
Analyze mobile-specific user behavior
Use FullSession’s mobile session recordings to:
Observe how users navigate your mobile site
Identify which elements users interact with most frequently
Analyze the path users take through your mobile checkout process
Determine which products or categories are most popular on mobile
This data can help you tailor your mobile experience to user preferences and behaviors.
Identify mobile usability issues
Use FullSession to:
See where users seem to struggle or hesitate
Identify forms or interactive elements that are hard to use on mobile
Detect pages or elements that load slowly on mobile devices
Recognize patterns in cart abandonment on mobile
Detecting these issues helps you prioritize mobile experience improvements.
Implement mobile-specific optimizations
Based on FullSession analysis, you can:
Redesign problematic page elements for better mobile usability
Implement mobile-specific features like swipe gestures or touch-friendly controls
Create mobile-optimized product pages with key information easily accessible
Develop mobile-specific promotional strategies based on observed behavior
Continuously test and refine your mobile user interface
With ongoing optimization and mobile user needs at the forefront you can increase your mobile conversion rates and capture more of the growing mobile e-commerce market.
Cart abandonment is a big problem for e-commerce sites, but also an opportunity to recover lost sales. Let’s share e-commerce conversion optimization strategies to help you reduce cart abandonment and show you how to use FullSession for better results.
Implement exit-intent popups
Exit-intent popups can catch visitors who are about to leave your site:
Offer a discount or free shipping to complete the purchase
Use persuasive copy to address the common objections
Add countdown timer to create urgency
Ask for email addresses for abandoned cart follow-ups
Customize the popup message based on cart value or items
It confirms their effectiveness in re-engaging potential customers who have shown interest but haven’t completed their purchase.
Offer cart saving options
Allowing customers to save their cart can lead to future purchases:
Implement a “save for later” feature
Enable guest cart saving with email capture
Sync carts across devices for logged-in users
Send reminders about saved carts after a set period
Display recently saved items prominently on return visits
Integrating financial incentives like discounts or coupons into your cart saving features can boost conversion rates, motivating hesitant shoppers to finalize their purchases.
Use FullSession’s session recordings to understand abandonment reasons
FullSession session recordings can give you valuable insights into why customers are abandoning their cart:
Analyze user behavior leading to cart abandonment
Use FullSession’s session recordings and replays to:
Observe the path users take before abandoning their carts
Identify which pages or elements users interact with most before leaving
Analyze the time spent on each step of the checkout process
Detect patterns in user behavior that frequently lead to abandonment
This will help you understand the context of cart abandonment and inform your prevention strategies.
Simplify steps in the checkout process that are causing friction
Add reassurance messaging at key abandonment points
Create exit intent popups for specific abandonment scenarios
Improve product pages or descriptions for high-abandonment items
Develop personalized retargeting strategies based on abandonment patterns
With continuous optimization and focusing on the specific pain points you’ve identified through your analysis, you can improve your cart completion rates and overall conversion rates.
A smooth checkout is key to converting interested shoppers into paying customers. Let’s look at how to optimize this part of the journey.
Simplify the checkout form
A long checkout form can cause cart abandonment. To simplify your checkout:
Minimize the number of form fields
Use auto-fill where possible
Implement real-time form validation
Group related information together
Show a progress indicator for multi-step checkouts
Research from HubSpot indicated that reducing the number of form fields from 4 to 3 led to an increase in conversion rates by nearly 50%.
Offer guest checkout options
Requiring account creation can be a big barrier to purchase. Consider the following:
Provide a guest checkout option
Offer account creation after purchase completion
Explain the benefits of creating an account
Use social login options for quick account creation
Allow easy conversion from guest to registered user
According to the Baymard survey, 35% of users abandon shopping carts because websites require them to create an account. With the guest checkout option, you can significantly reduce this abandonment rate.
Provide multiple payment options
Offer free shipping and different payment methods for Shopify conversion rate optimization:
Accept major credit cards
Integrate digital wallets like PayPal, Apple Pay, and Google Pay
Consider buy now, pay later options
Include local payment methods for international customers
Ensure all payment options are clearly displayed
A report indicated that 70% of consumers prefer to shop with retailers that offer multiple payment options, showcasing the importance of flexibility in meeting customer expectations and improving their shopping experience.
Use FullSession’s conversion funnel analysis to optimize checkout flow
FullSession’s conversion funnel analysis is a powerful tool for finding and fixing issues with your checkout. Here’s how to use it.
Setup conversion funnels
Conversion funnel analysis allows you to track the customer journey from product page to purchase completion. To set up funnels:
Streamline steps where customers are spending too much time
Test different layouts or designs for problematic stages
Implement personalized interventions at critical points
For example, if you see a high drop-off at the shipping info stage, consider adding an address autocomplete feature to make this step easier for customers.
Remember, even small improvements in your checkout conversion rate can mean significant revenue for your Shopify store.
Maximize Your Conversion Rate
See how our CRO tools help you improve website performance to drive conversions.
Strategic promotions can be a powerful tool to drive sales and conversions on your Shopify store. Let’s explore effective promotional tactics and how to optimize them with FullSession data.
Create compelling discounts and offers
Discounts and offers can drive purchases and create value for customers:
Offer percentage-based or dollar-amount discounts
Create bundle deals or “buy one, get one” offers
Implement tiered discounts based on purchase amount
Provide exclusive discounts for first-time buyers or loyalty program members
Use exit-intent popups with special offers to reduce cart abandonment
Discounts and special offers increase customer engagement and boost conversion rates by making purchases more appealing.
Implement free shipping thresholds
Free shipping can be a big motivator for customers to complete purchases:
Set a minimum spend for free shipping
Display free shipping threshold throughout the site
Offer free shipping on specific products or categories
Test different threshold amounts to find the sweet spot
Use free shipping as a limited-time offer to create scarcity
Free shipping is still a big conversion driver with many customers looking for this offer.
Run limited-time promotions
Create urgency to encourage customers to act fast:
Implement flash sales for short periods
Create seasonal promotions tied to holidays or events
Use countdown timers to highlight the end of a promotion
Offer exclusive “members-only” deals for a limited time
Run “deal of the day” promotions to encourage repeat visits
Limited-time offers can increase conversions by creating scarcity and getting customers to make quicker decisions.
Optimize promotional timing with FullSession data
FullSession helps you optimize your promotional strategy. You can create personalized promotions that speak directly to individual customer interests, increasing the likelihood of conversion.
Identify peak conversion times
Use FullSession to:
See the days and times your store converts the most
Identify seasonal trends in buying behavior
Spot patterns in conversion rates across product categories
Analyze how conversion rates vary by customer segment
This will help you adjust the time of your promotions for maximum impact.
Create targeted promotions based on common user paths through your site
Develop promotions that address specific pain points in the customer journey
Customize promotional messaging for different user segments
Use behavioral triggers to deliver personalized promotions
You can make your promotions more relevant and effective by matching them to user behavior.
Measure promotional impact on conversions
Use FullSession with your Shopify analytics to:
See how different promotions affect your overall conversion rate
Measure promotional impact on average order value
See how promotions impact customer acquisition and retention
Compare different promotional strategies
Evaluate the long-term effects of promotions on customer behavior
Test and refine as you go, and don’t be afraid to get creative with your promotions. You can create a conversion-boosting strategy for your Shopify store with the right mix of offers and data-driven timing.
Final Words About How to Get More Conversions on Shopify
So there you have it, the full guide on how to increase conversions on Shopify. These steps will help you convert visitors into customers and get the most out of your online store.
Remember, conversion rate optimization is not a one-time task; the e-commerce landscape and customer preferences and behavior are always changing. To stay ahead and keep improving your conversion rates:
Use FullSession user behavior data to inform your decisions
With FullSession, you can get to the bottom of how visitors interact with your store, find the pain points in the user journey and make data-driven decisions to improve your conversion rates.
Remember, conversion rate optimization is not just about implementing these strategies; it’s about doing so in a way that’s relevant to your audience and continuously refined by real user data.
FullSession gives you the user behavior tools to do just that: create a Shopify store that attracts visitors and converts them into loyal customers.
As you go ahead with your optimization efforts, remember that even minor improvements can add up to considerable revenue. Be patient and persistent, and always let the data guide your decisions.
With the right approach and FullSession by your side, you’re ready to grow your e-commerce business!
Drive Revenue Growth With FullSession
Learn how to visualize and improve each step in your sales or marketing funnel.
Let’s answer the most common questions on how to increase your conversions on Shopify.
How to increase Shopify conversion rate?
To increase your Shopify conversion rate, focus on optimizing your store’s user experience across all devices. It includes improving site speed, creating compelling product pages with high-quality images and clear descriptions, and streamlining checkout.
Implement trust signals like customer reviews and security badges, and offer clear pricing information. Use strategies like exit-intent popups and abandoned cart emails to recover potential lost sales.
Provide excellent customer support, personalize the shopping experience, and create a sense of urgency with limited-time offers.
Continuously analyze user behavior and A/B test key elements to identify areas for improvement. Remember, even small increases in conversion rate can significantly impact your bottom line.
How do I make my Shopify store convert?
Make your Shopify store convert by having a user-friendly design, clear value proposition, great customer support, optimizing for mobile users and testing and refining your site based on user behavior data.
How do I increase my conversion rate?
Increase your conversion rate by addressing cart abandonment, personalizing the shopping experience, providing multiple payment options, and including product recommendations, targeted promotions, and discounts.
Why is my Shopify conversion rate so low?
Your Shopify conversion rate might be low because of slow site speed, confusing navigation, lack of trust signals, complicated checkout or missing product information. Use analytics tools like FullSession to find out what’s going wrong and optimize your user experience accordingly.