Keeping tabs on your product performance is crucial to any business, but it can be challenging to measure the right metrics. Even if you have a solid internal structure for monitoring your products, figuring out exactly how each one is doing can be tricky.
Product metrics are standard measurements that allow you to evaluate the performance of various aspects of a product. You can determine the adjustments you need to make to keep your customers happy and continue to drive revenue.
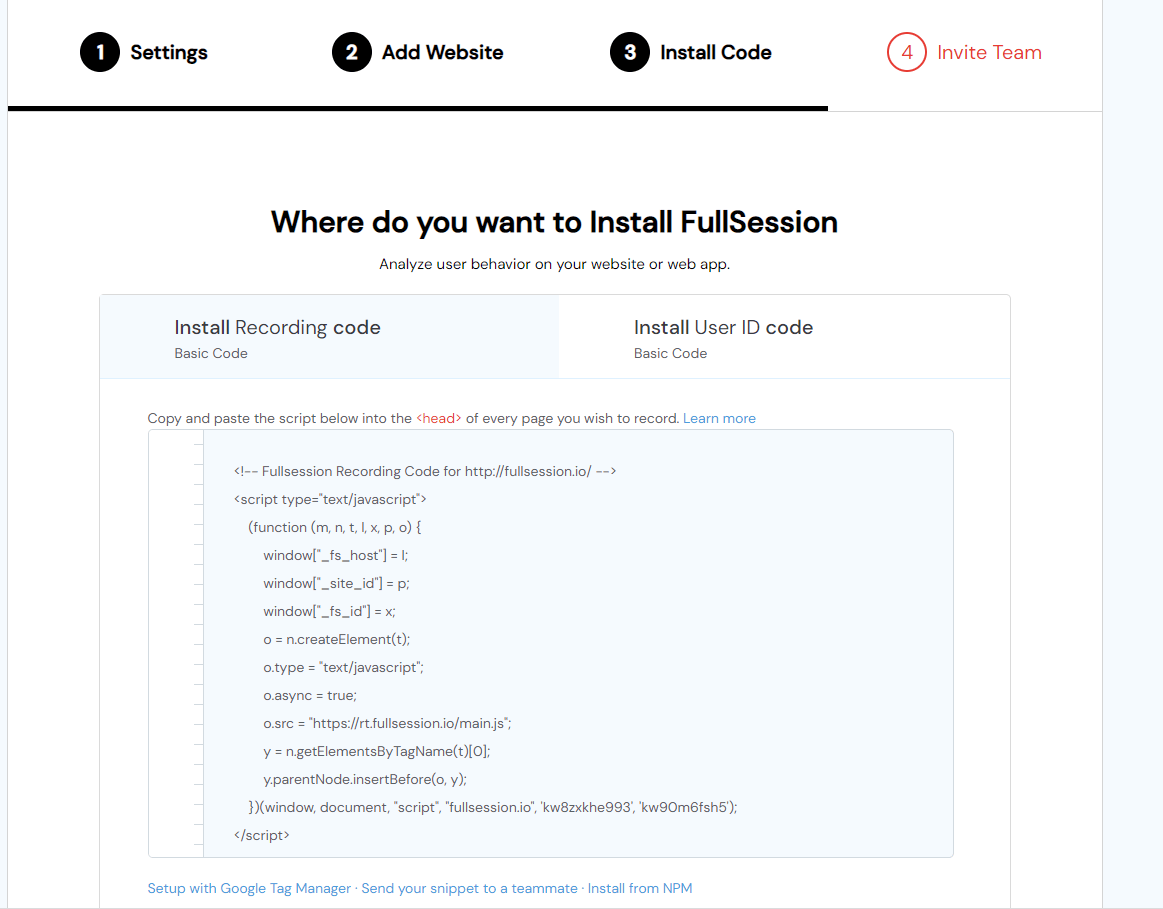
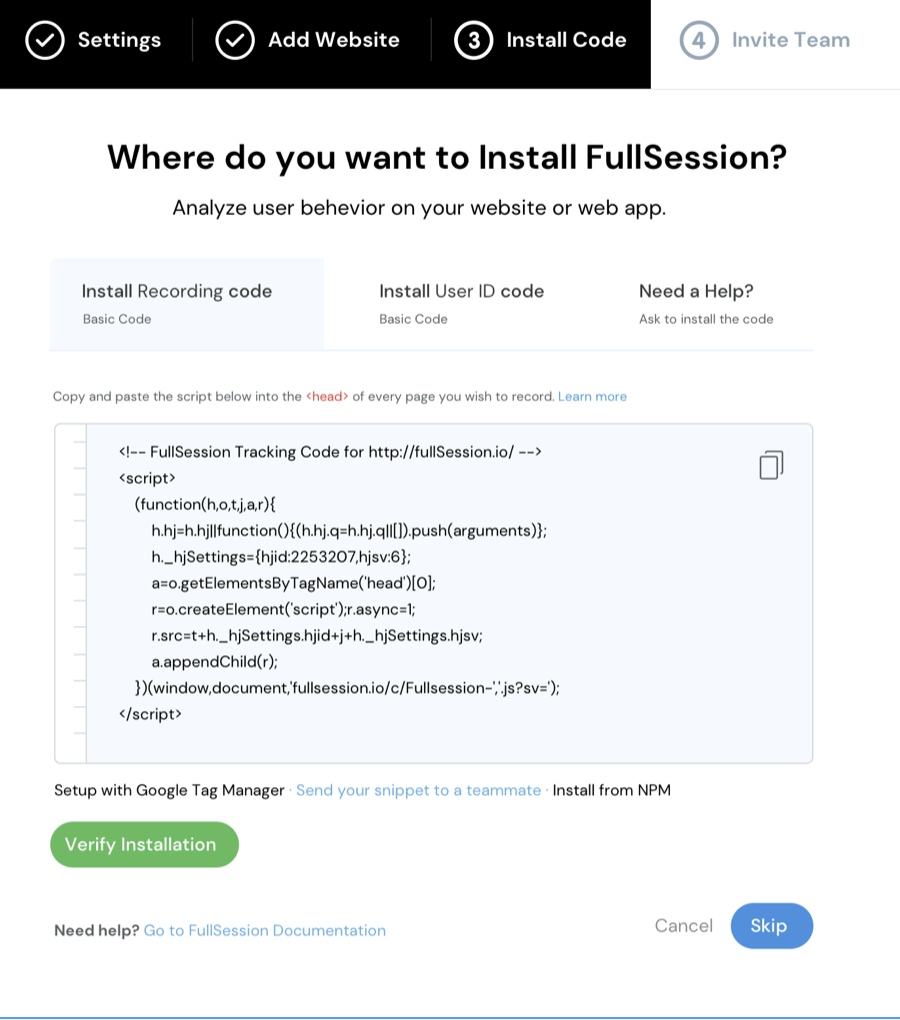
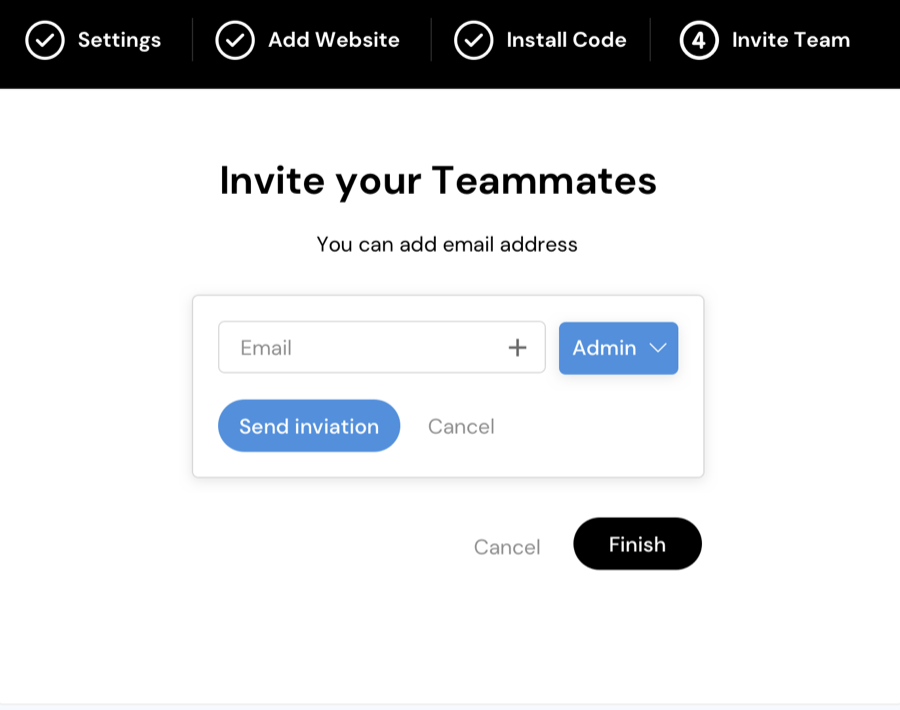
You use specialized software to track this data. Our FullSession web analytics platform lets you collect user behavior data with session recording and replay tools. You can also create customer feedback forms, which allow you to get valuable information directly from users browsing your website, web app, or landing page.
FullSession offers plenty of ways to improve your product design or features. It’s an excellent UX analytics tool. It helps product teams, UI designers, UX researchers, and digital marketers, and it’s an invaluable addition to the toolset of a product manager. To see how FullSession works, start your 14-day free trialor demo.
However, product metrics aren’t always straightforward, and there are various metrics you can track. In this article, we’ll explain what metrics you should pay attention to. We’ll also show you how FullSession helps you collect valuable product metrics data.
What are product metrics?

Image source: Pexels
A product metric is a measure of the performance of a product, usually in the form of a numerical value.
You can use them to evaluate marketing campaigns’ effectiveness and track changes in customer behavior over time. Product metrics are also helpful in determining whether your business is profitable.
There are different types of product metrics that businesses can track.
- Sales metrics show the number of units sold and the revenue generated by your products.
- Conversion metrics track the number of users who sign up for your service and become customers.
- Engagement metrics describe how often users interact with the site and how engaged they are with its content.
- Retention metrics show the percentage of users returning to the site after a certain period.
You know the definition of product metrics, but how exactly do they differ from Key Performance Indicators (KPIs)? Let’s explain in the following section.
Product metrics vs product KPIs: What’s the difference?
Key Performance Indicators are specific types of metrics. The main goal of tracking KPIs is to measure a product’s performance against the competition or progress towards completing a particular business goal. They always have to be objective and can’t depend on the opinions or feelings of users. Some examples of KPIs:
- Customer retention
- Sales growth
On the other hand, non-KPI metrics aren’t goal-oriented, and you can’t use them to measure the entire business’s performance. Tracking these metrics isn’t as crucial as tracking KPIs, but they can still be helpful.
They can give an insight into how your company is doing in specific areas, such as sales or conversions. Some examples of non-KPI metrics:
- Lead-to-conversion rate
- Return rate
Business metrics are another type of statistic you probably heard about. Why are they important? Let’s explain in the next section.
Business metrics vs product metrics: Which matters more?

Image source: Pexels
Business metrics focus on the financial performance of a product or company and other aspects that can affect how well the business is doing. Some examples of business metrics include:
- Recurring revenue (monthly or annual)
- Average customer lifetime value
Product metrics provide broader data to shape or change your product at various stages of its development. Some examples:
- User adoption
- Customer retention rate
In other words, you primarily use business metrics to measure the success or failure of a product. In contrast, product metrics help you achieve that success in the first place.
For example, they can highlight a significant issue with your solution that you can eliminate to get more customers and increase your revenue. It makes product metrics more important overall.
Consider FullSession, if you want to collect data quickly. Start your free trial or contact us right now to get a demo of our platform.
Why are product metrics important?
Product metrics are essential as they help you measure your product’s success and inform how people interact with it. They can also help you identify critical areas of improvement if necessary.
Choosing the right metric for your business is crucial as each type has different uses and implications. For example, the retention rate is suitable for identifying the areas of your product that are working well and those that need improvement.
Conversely, the conversion rate can help you identify what in your solution attracts the most users. You can boost these metrics using CRO tools.
How to pick the right product metrics
There are no good or bad metrics, but each metric has its use case. You need to know what to track in your specific situation.
First, you need to consider what you want to achieve because you need to match the metrics you track with your goals. For example, product teams and UX designers will probably be interested in engagement data and other customer-oriented metrics.
On the other hand, business specialists will focus on data regarding clients and revenue. Also, it’s essential to look at tracking metrics as an ongoing process. Don’t just collect data because you did it last month. Shift your focus and concentrate on different data points when your goals change or when you need additional information for a specific project.
How to use product metrics to optimize your product
Product metrics are data points that help you optimize your product. They allow you to understand how it’s performing and whether it’s meeting the needs of your users. This kind of data can help you in several different ways:
- You can use it to evaluate various aspects of your product, including sales volume, conversion rates, engagement, and retention. You can track how well it does on the market.
- Using product metrics, you can better understand what’s working or not. For example, you can learn which features draw customers and which they avoid whenever they can. You can use this information to make improvements as necessary.
Of course, to successfully use metrics in your product optimization, you need to know which ones to track and which to avoid. Let’s evaluate the critical product metrics you can start monitoring today.
Nine product metrics to track in 2022
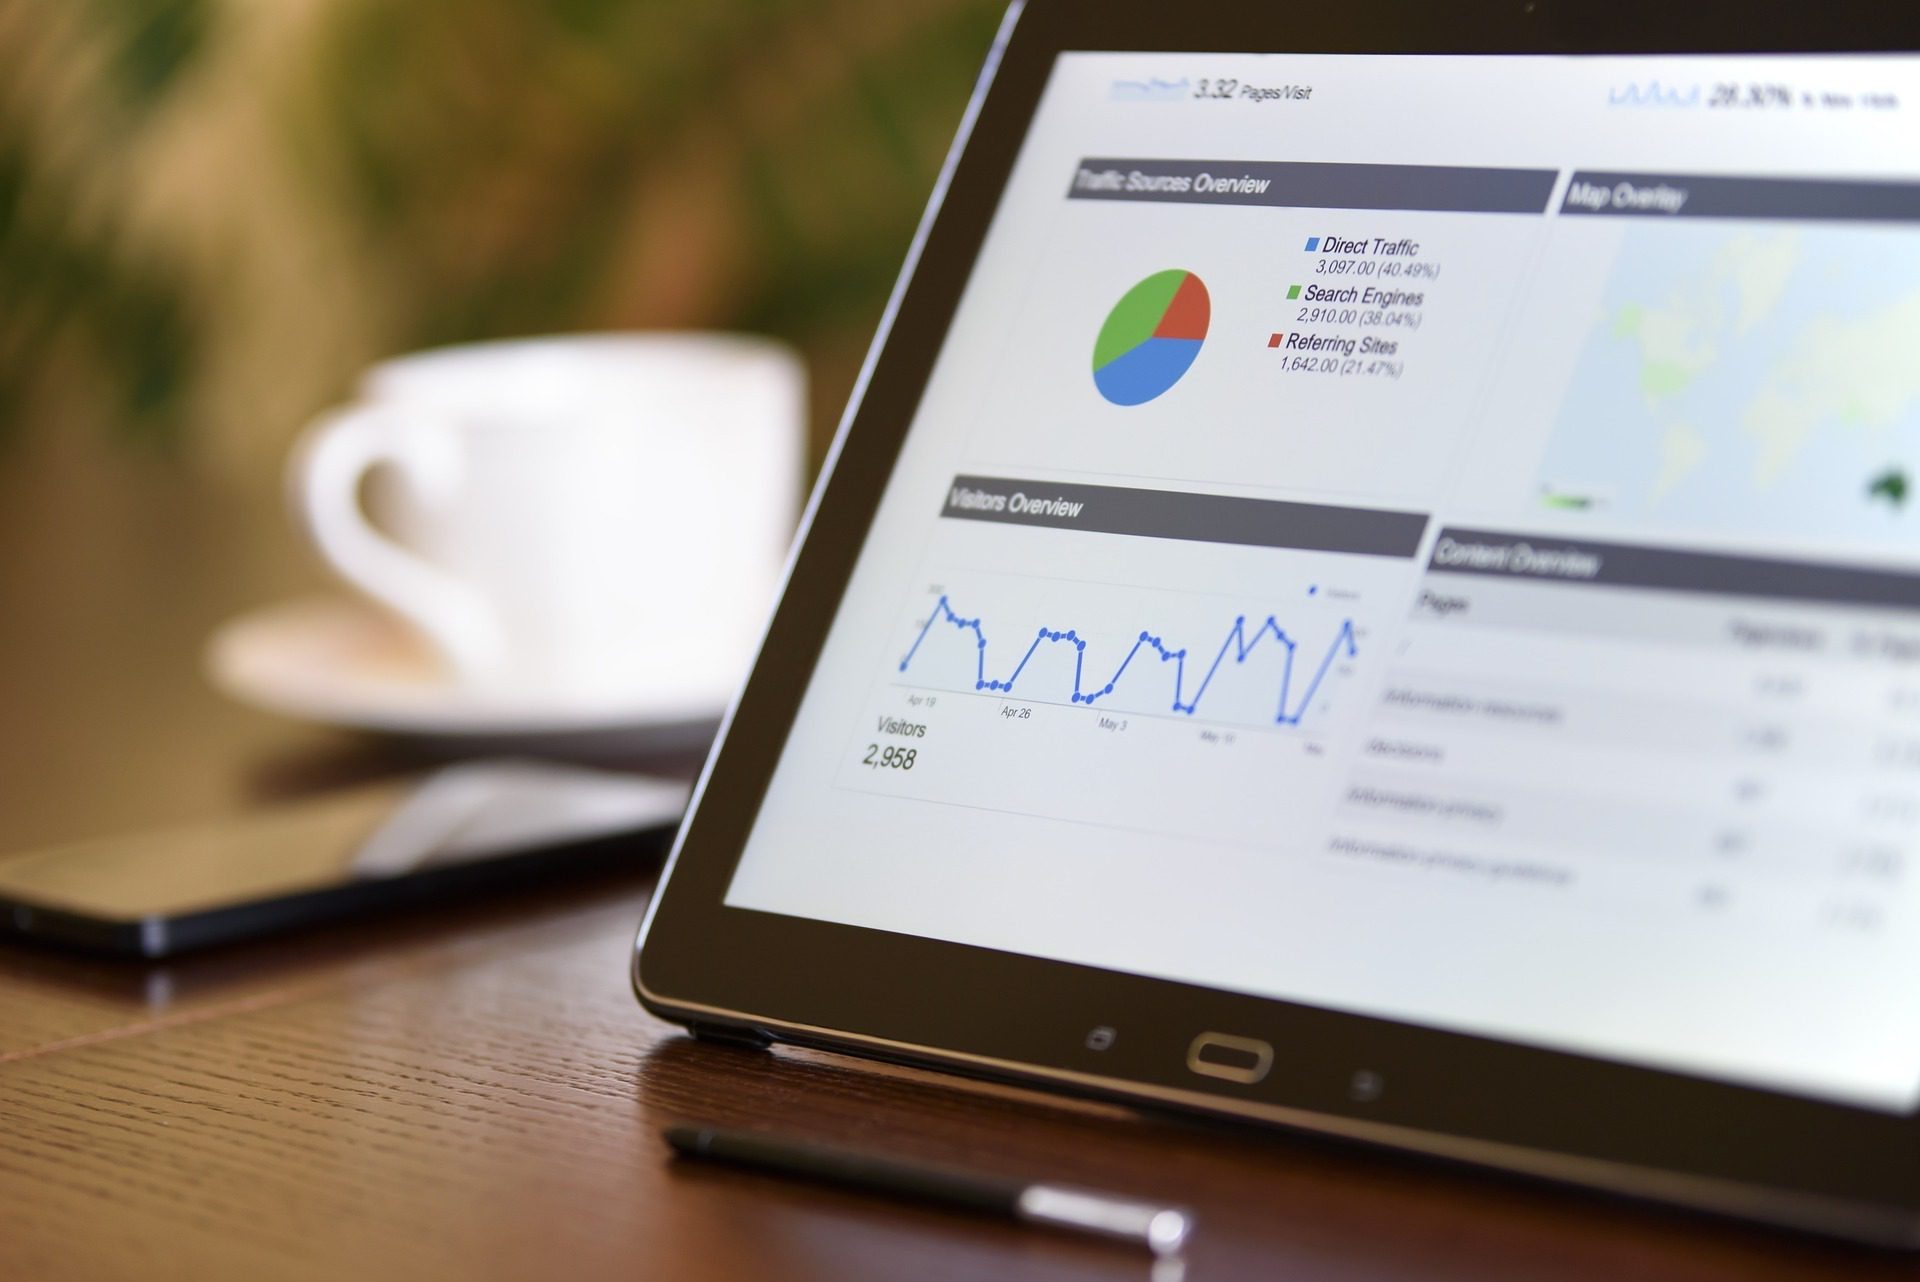
Image source: Pixabay
Here are the most important metrics you should track if you want your digital product to be successful.
-
Bounce rate
Bounce rate allows you to track how many people visited one page on your website and then decided to leave. A high bounce rate is an indication of severe problems with user experience. Technical issues can also cause it – for example, slow load times.
-
Retention rate
Customer retention rate tells you how many people stayed with your brand after a specified time. It helps you optimize your marketing efforts. Low retention rates can also point toward a problem with the product, such as a poorly designed interface, a slow website, or a lack of a feature.
-
Net promoter score
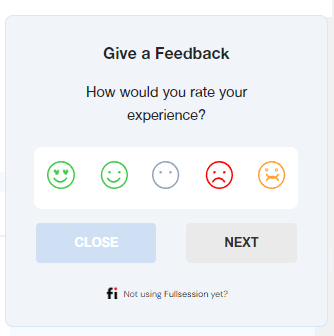
NPS – Net Promoter Score – measures how many customers like your product enough to recommend it to their friends. You can use FullSession website feedback forms to get this data to ask users to rate your product.
To calculate NPS, ignore neutral scores, and substruct the percentage of people who don’t like your solution (detractors) from the percentage of those who do (promoters).
-
Customer satisfaction score
CSS helps you measure the level of satisfaction with your product or a specific feature. It’s another metric you can track through customer feedback tools. You can ask people to rate the product or an aspect of it, sum up all the scores you got, and divide the result by the number of respondents.
-
Churn rate
It is the opposite of the retention rate. This metric measures how many people left your brand during a specified time. You can focus on two aspects: the raw number of customers or the revenue you lost.
The churn rate is easy to calculate. Take the number of customers you have at the end of the specified period, and divide it by the number of clients you had when that period began.
-
Session duration
It allows you to see how much time people spend on your website. It helps you understand why you lose customers, primarily when combined with metrics such as bounce and churn rates.
You can analyze data thoroughly using a web analytics platform like FullSession. It’ll allow you to watch how users with short sessions interact with your product, so you can identify and eliminate the issue that’s hurting your business.
-
The number of sessions per user
Tracking the number of sessions per individual user helps you measure customer engagement – it shows you how popular your product is among your users. You can track this metric easily by looking at how often people log in or by counting visits from a specific IP address.
-
Active user ratio
One of the easiest ways to track a digital product’s growth is to look at how many people actively use it. You can get this information by looking at how many subscribers you have. Businesses usually track monthly active users, but you can also look at yearly, weekly, or daily active users.
-
Monthly recurring revenue
The best measure of a company’s success is usually the amount of money it makes. Stable income is often the most important for businesses, and you can track it by looking at monthly recurring revenue. How to calculate it?
Add the revenue generated through new subscriptions to your revenue at the beginning of the month. Then subtract the money you lost – you can get it by tracking the churn rate. While it’s not a critical metric, it’s also a good idea to consider the customer acquisition cost to see how much gaining new customers costs you.
As you can see, plenty of metrics offer insights into your business operation and product value. That doesn’t mean, however, that you should track everything. Consider an investment in FullSession to collect valuable data easily. You can start a 14-day free trial right now.
Two metrics to avoid during your analysis
Some metrics aren’t as valuable, and you probably shouldn’t waste time tracking them. Here are some examples:
- Clicks – the number of clicks alone doesn’t give you much information. You can boost it artificially, and it doesn’t help you understand user engagement.
- The number of users or page views – there’s no real point in tracking the total number of users who visit your website. Active users are what matters. People who don’t perform actions on the page will never become customers.
Look at your product and choose metrics that align with your goals. You also need to select the right software to collect product data. We think FullSession is your best option, so in the following sections, we will explain how it works and helps you track product metrics.
How FullSession helps you evaluate your product
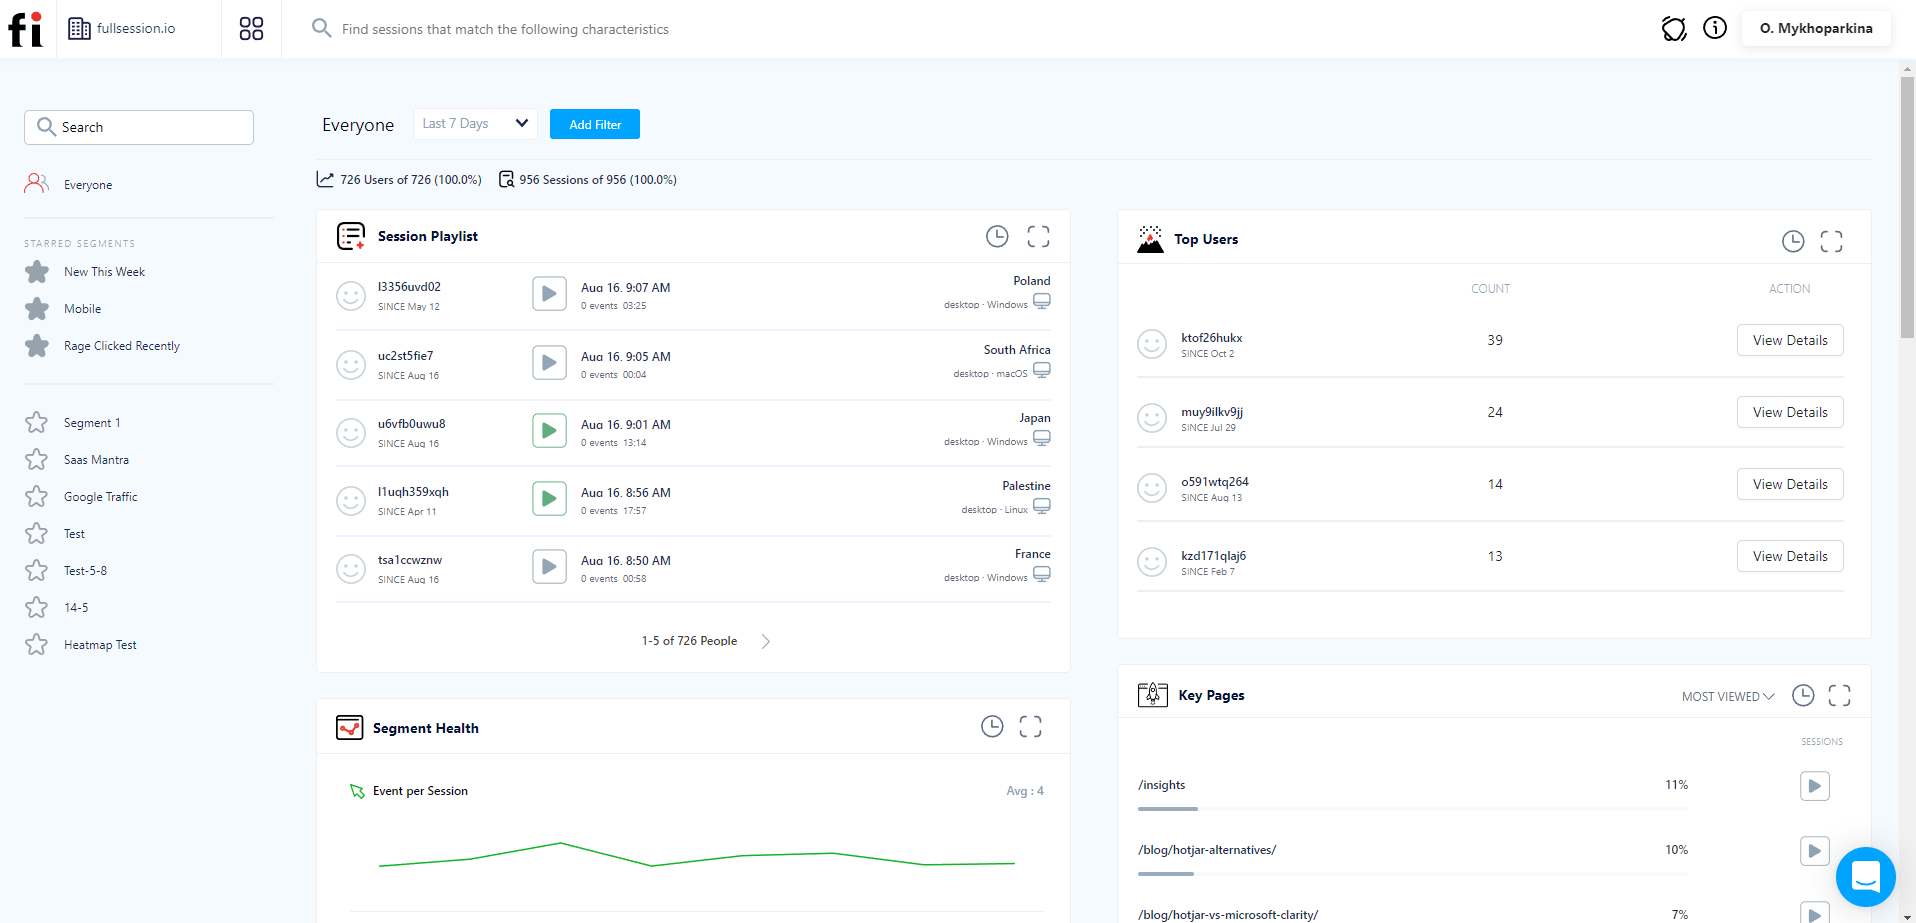
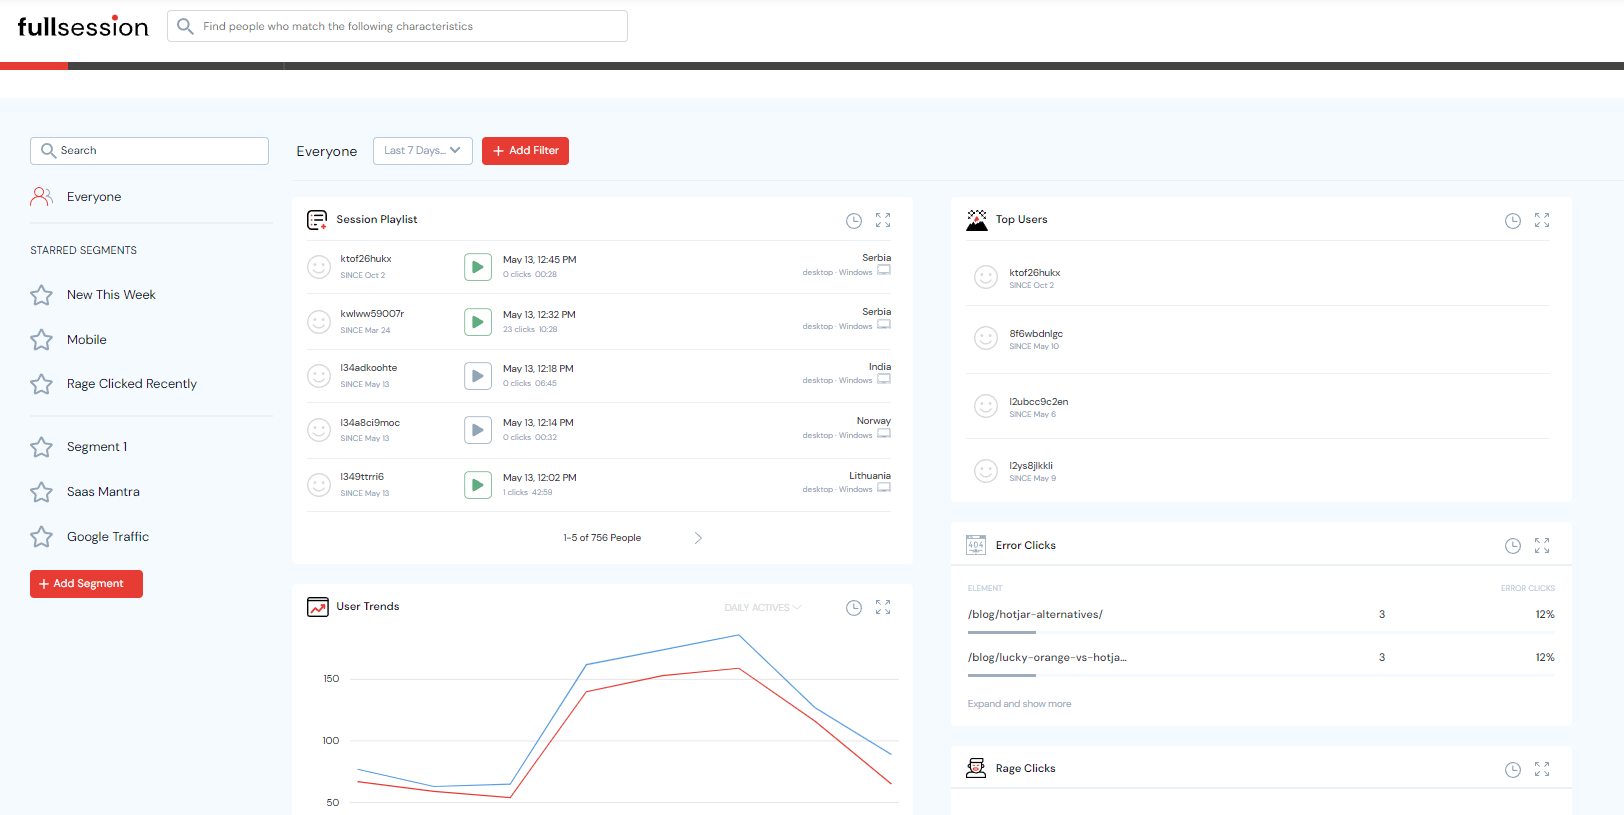
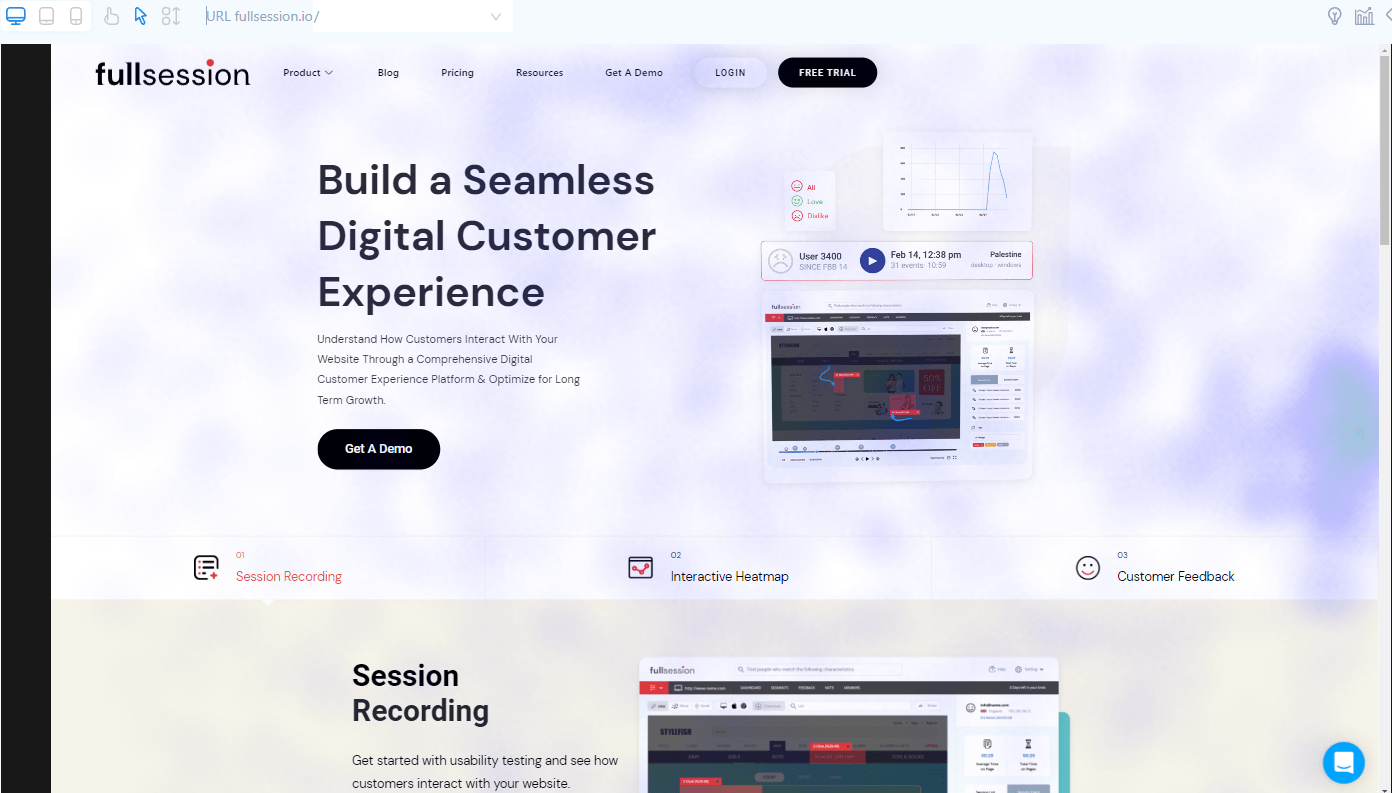
FullSession platform helps you track various metrics regarding your digital product – a website, web app, or landing page.
Our software doesn’t rely on hired testers – it lets you observe real users. FullSession uses website visitor tracking. You can watch session recordings and replays and use interactive heatmaps to track users’ clicks, scrolls, and mouse movements. FullSession also provides website feedback forms to help you collect customer feedback.
Our platform has advanced filtering and segmentation features, so finding the data you’re interested in is never a problem. You can also leave notes to your co-workers to share your findings easily.
FullSession is a great way to track the crucial metrics you need to measure. It helps you boost conversion rates and improve the UX of your solution.
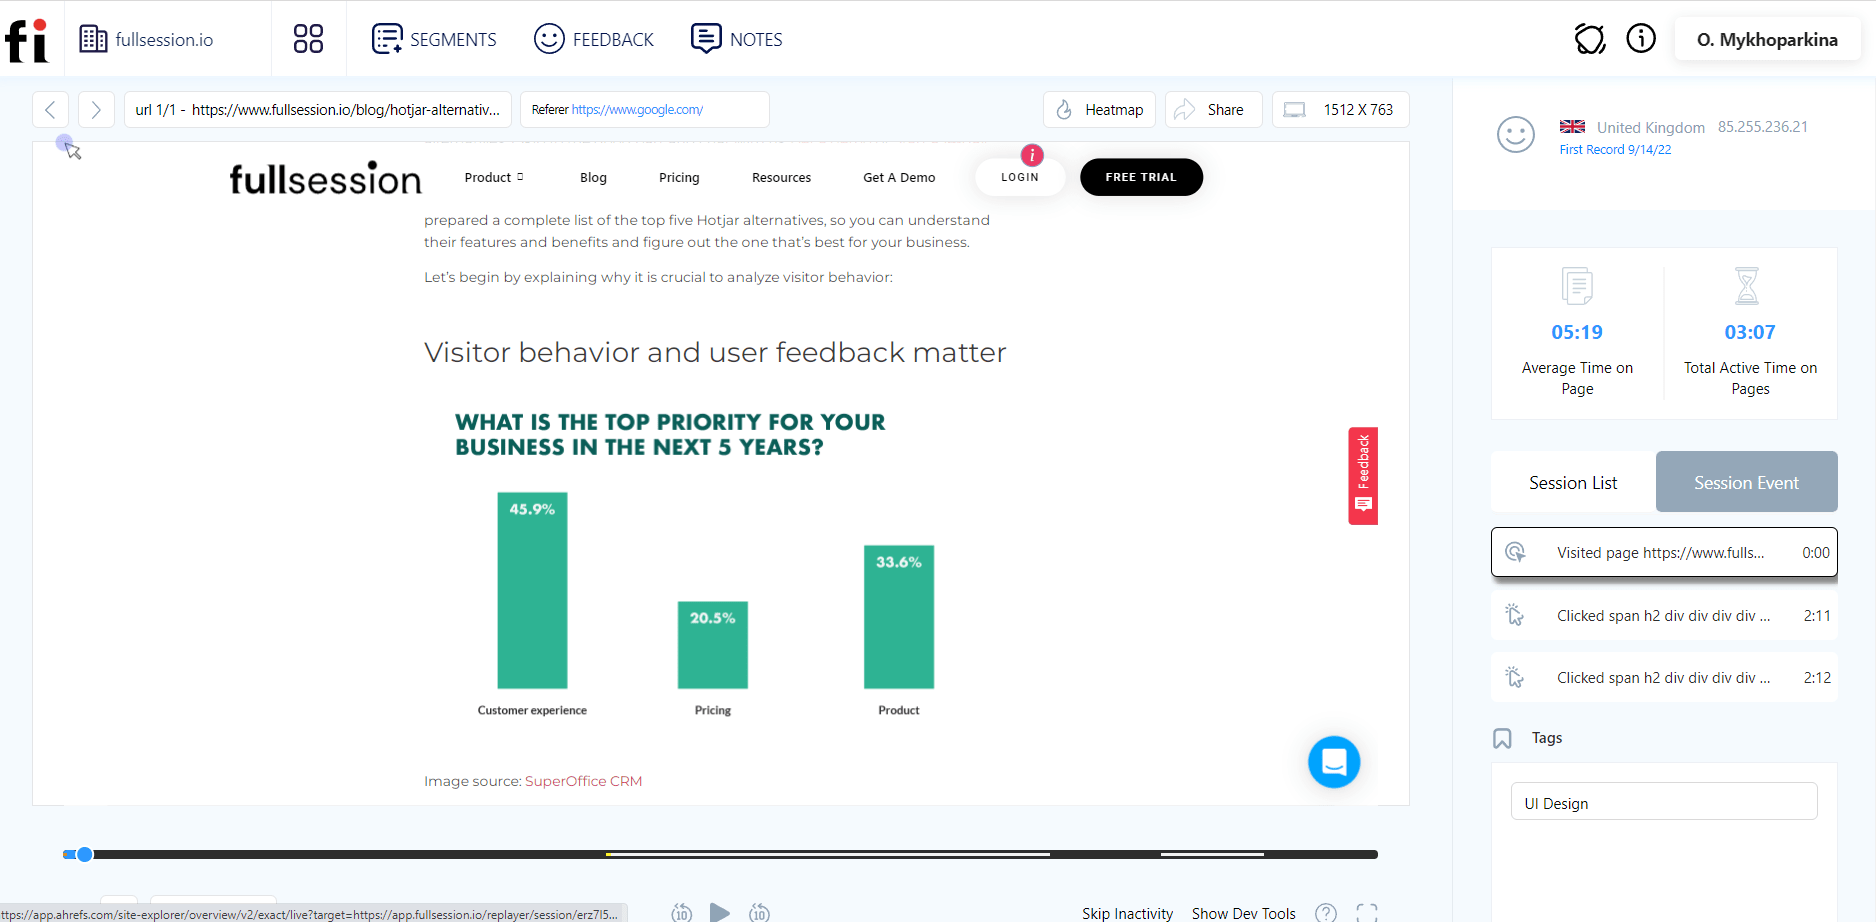
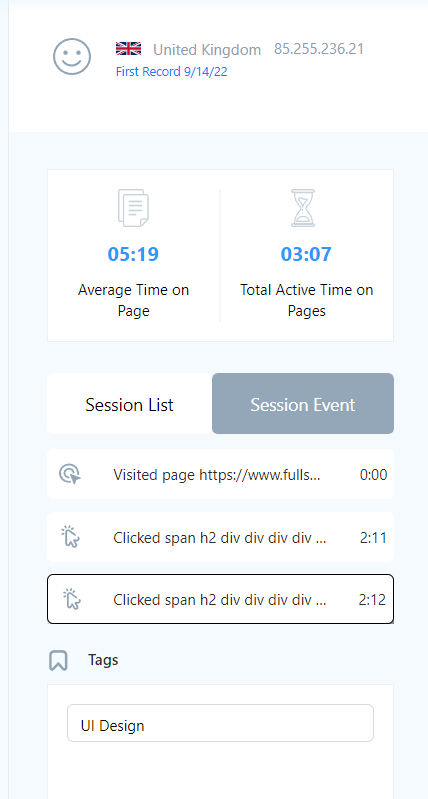
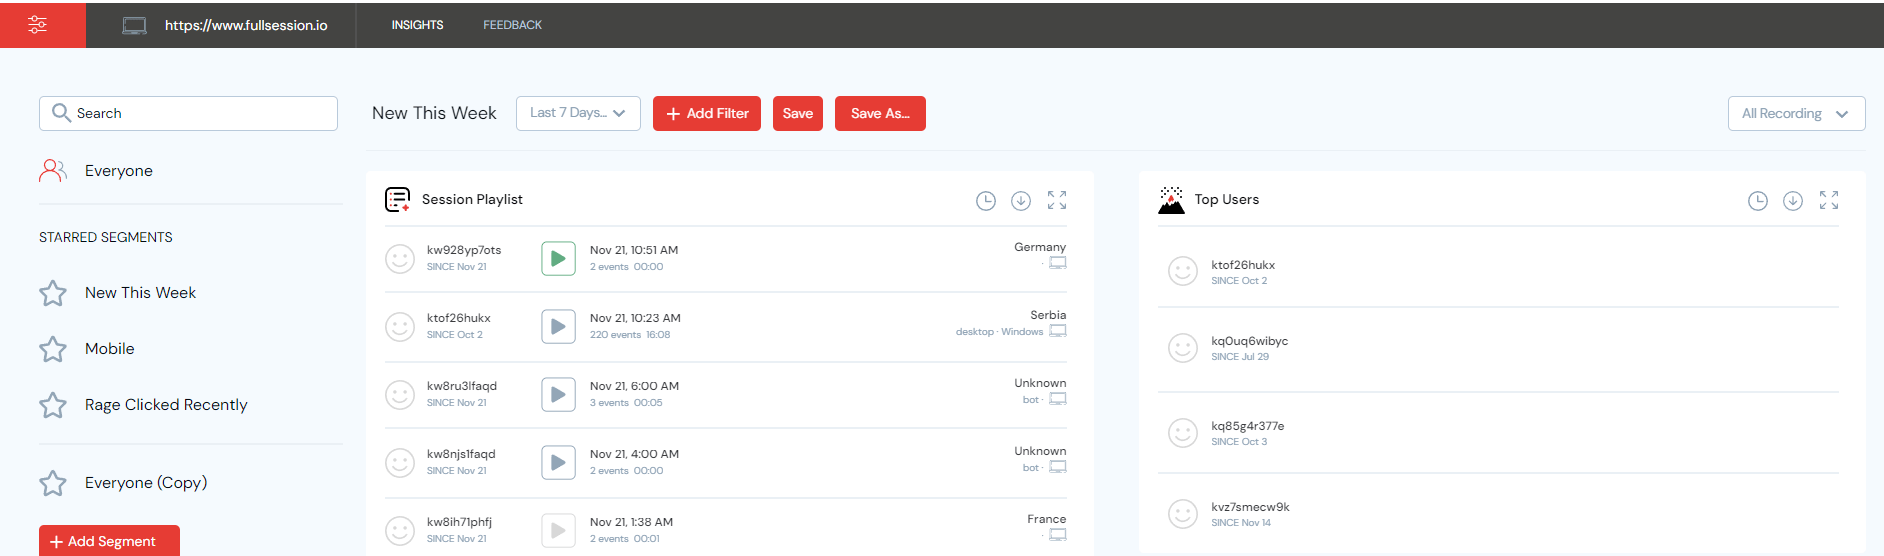
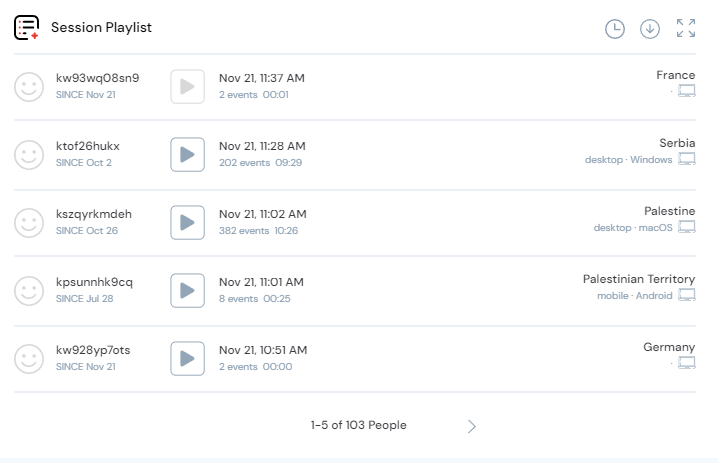
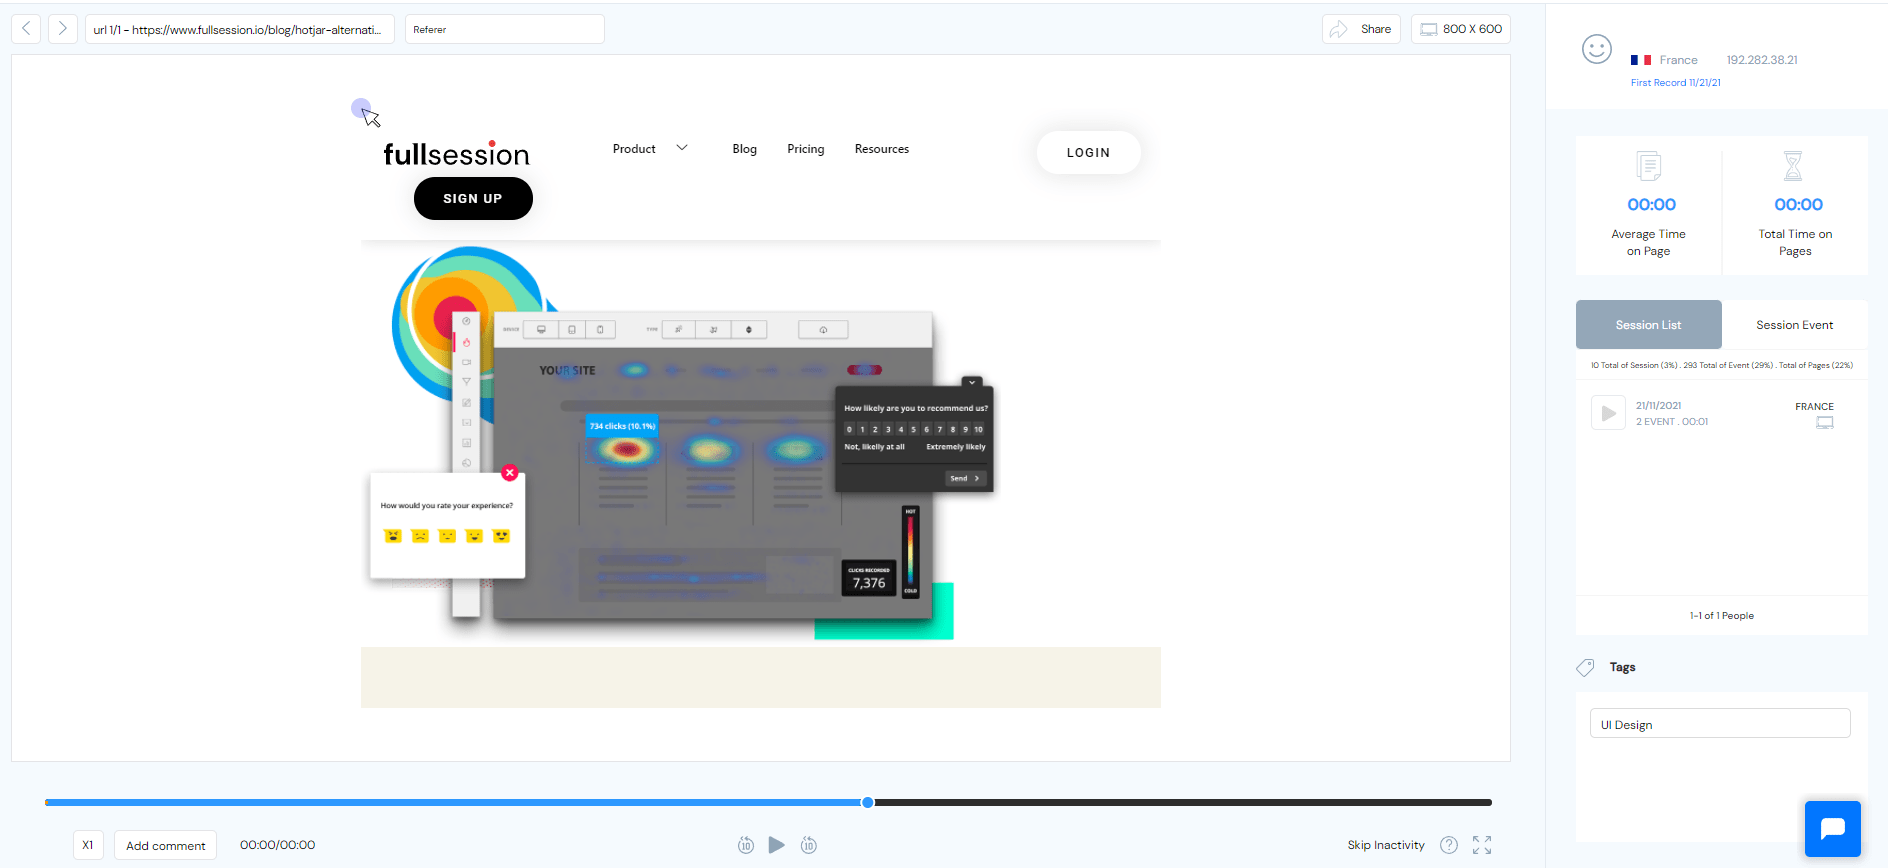
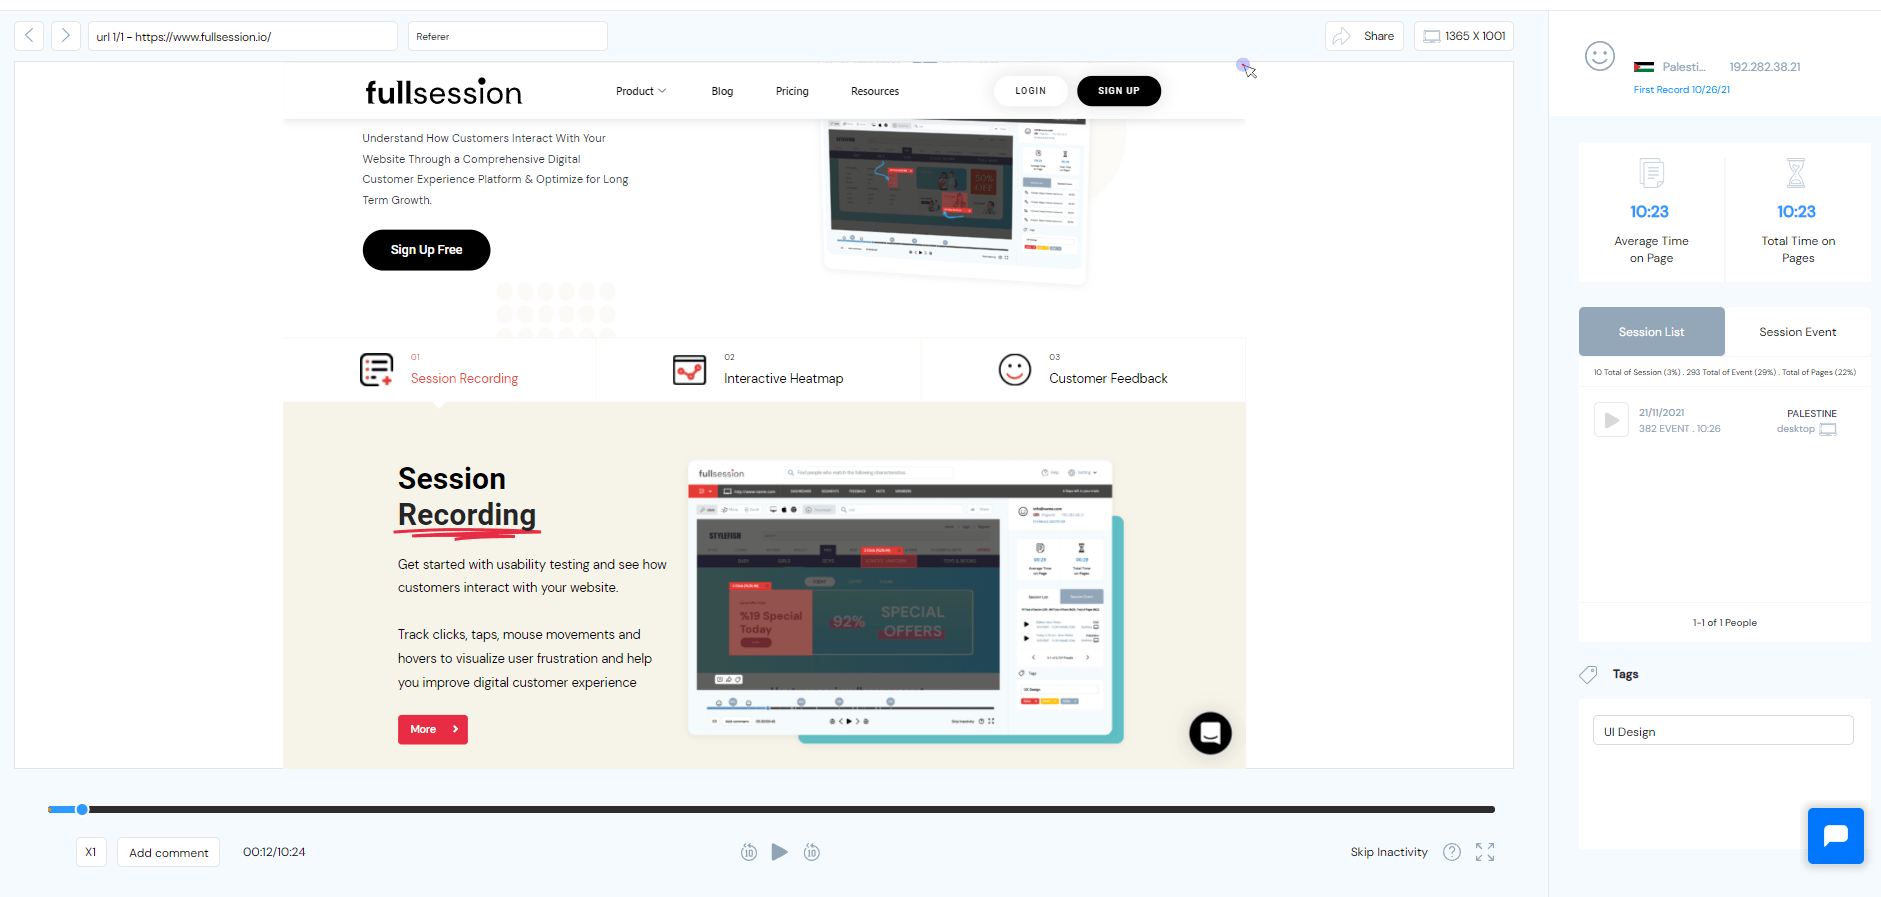
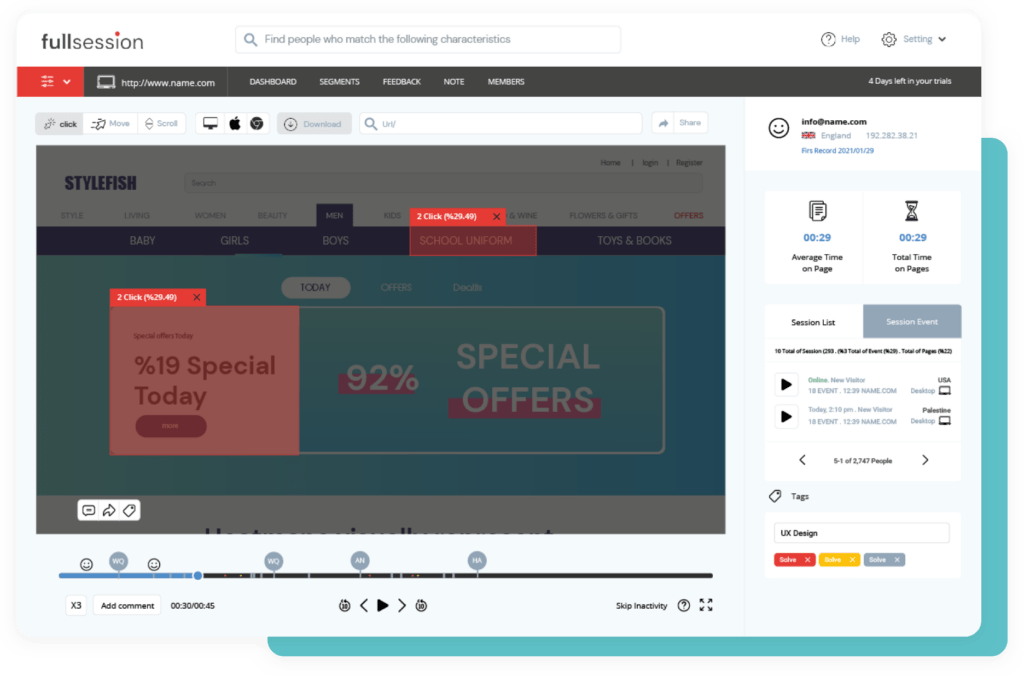
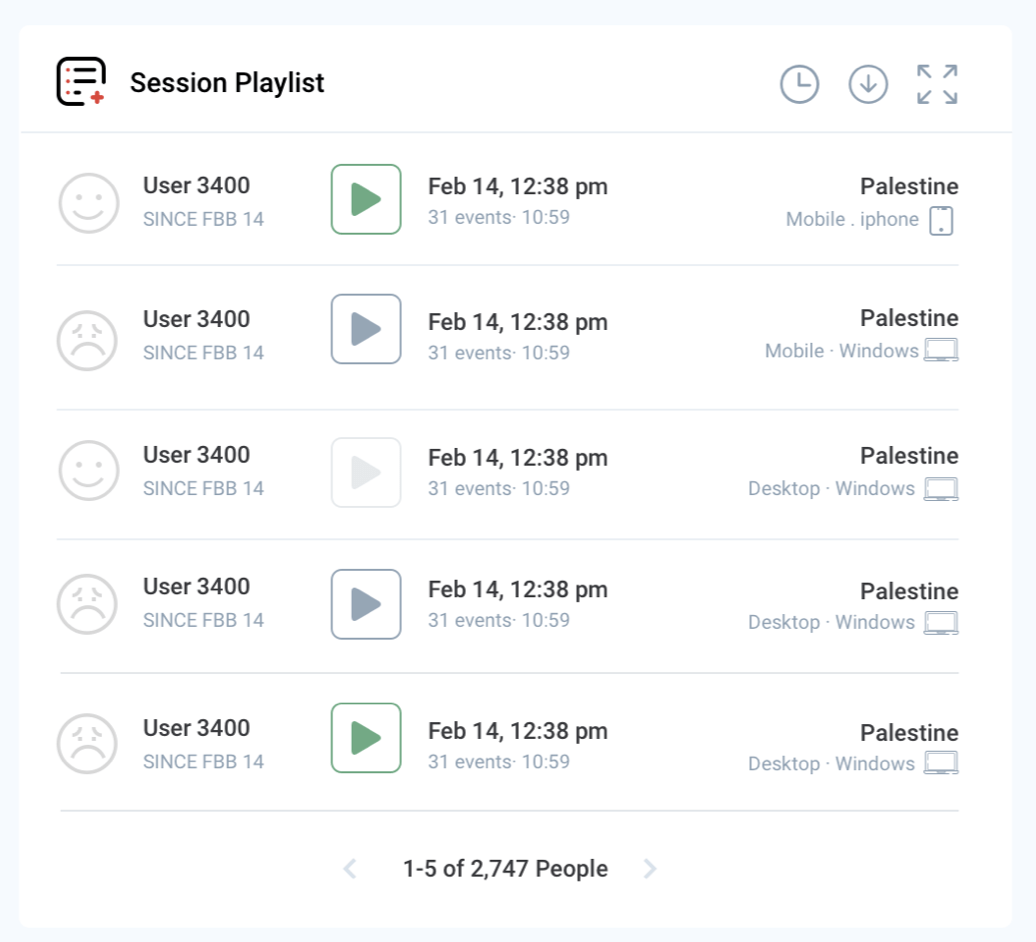
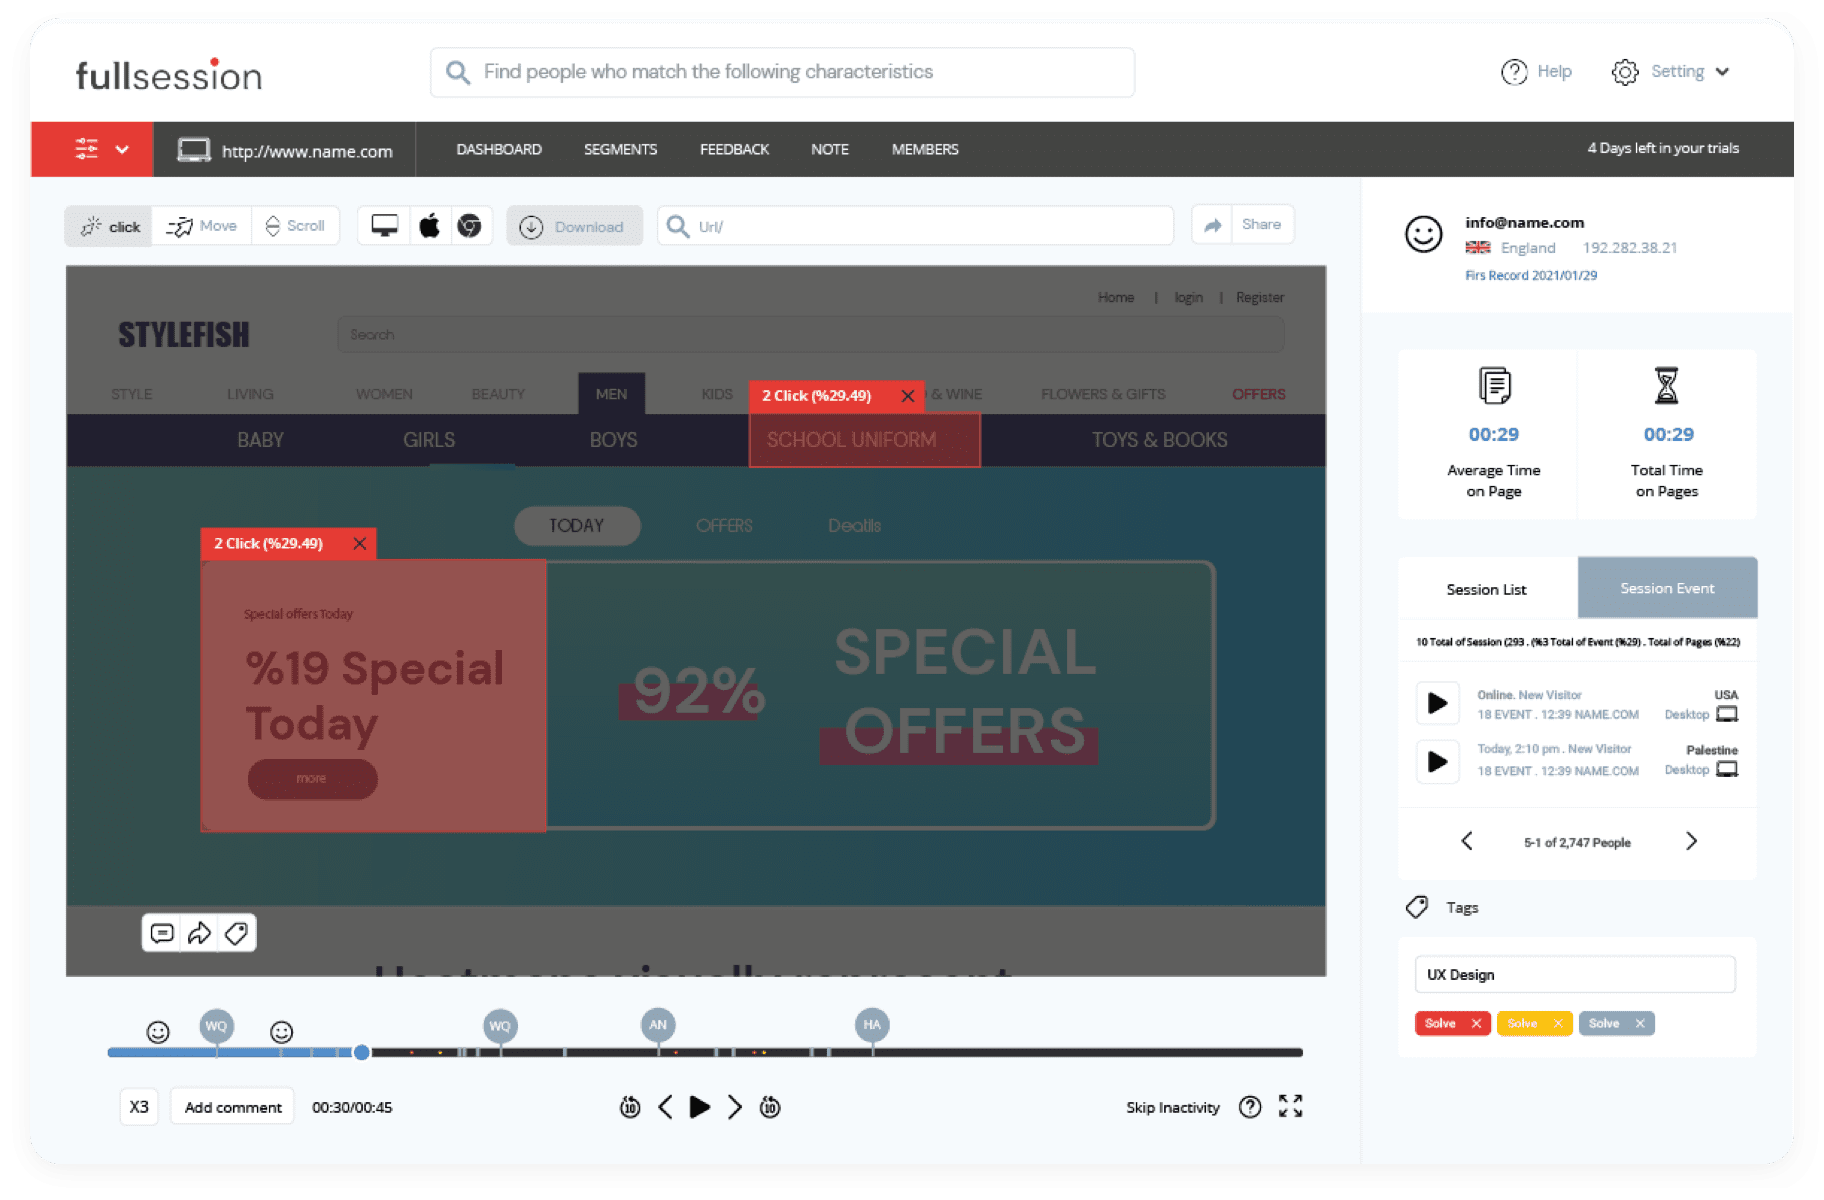
Session recording and replay
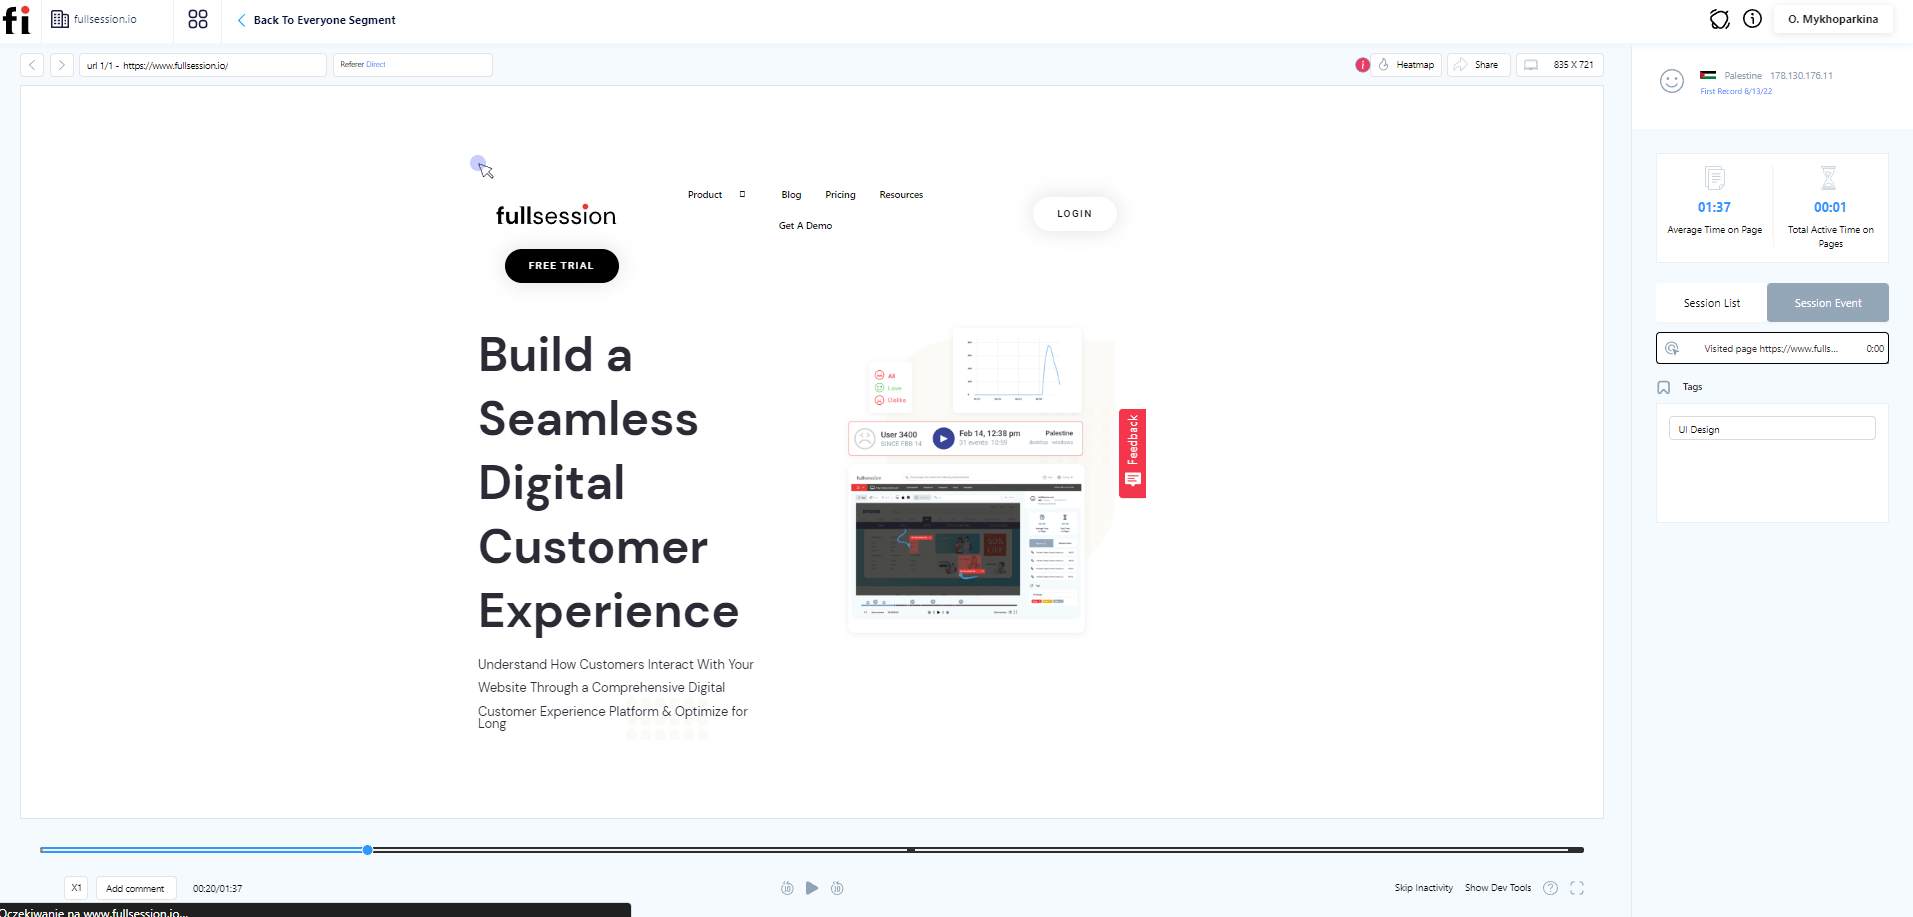
With this feature, you can watch recordings of real people interacting with your product. You observe what causes them problems and can draw conclusions on how to improve things. You can skip periods of inactivity or pause, fast forward, and rewind session replay.
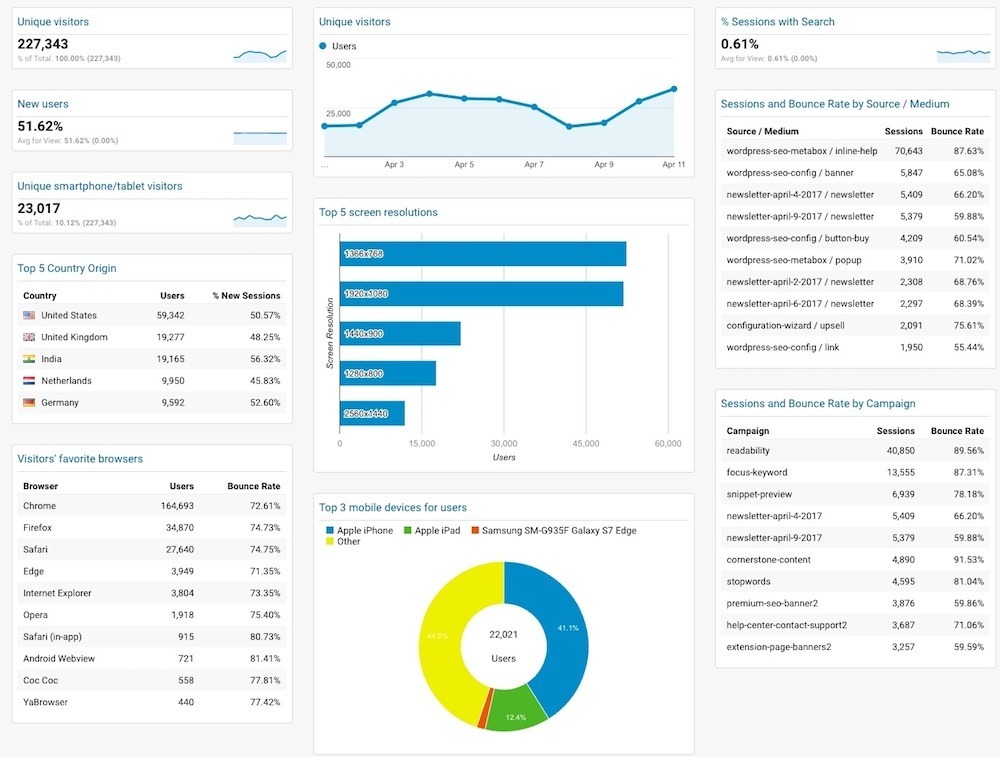
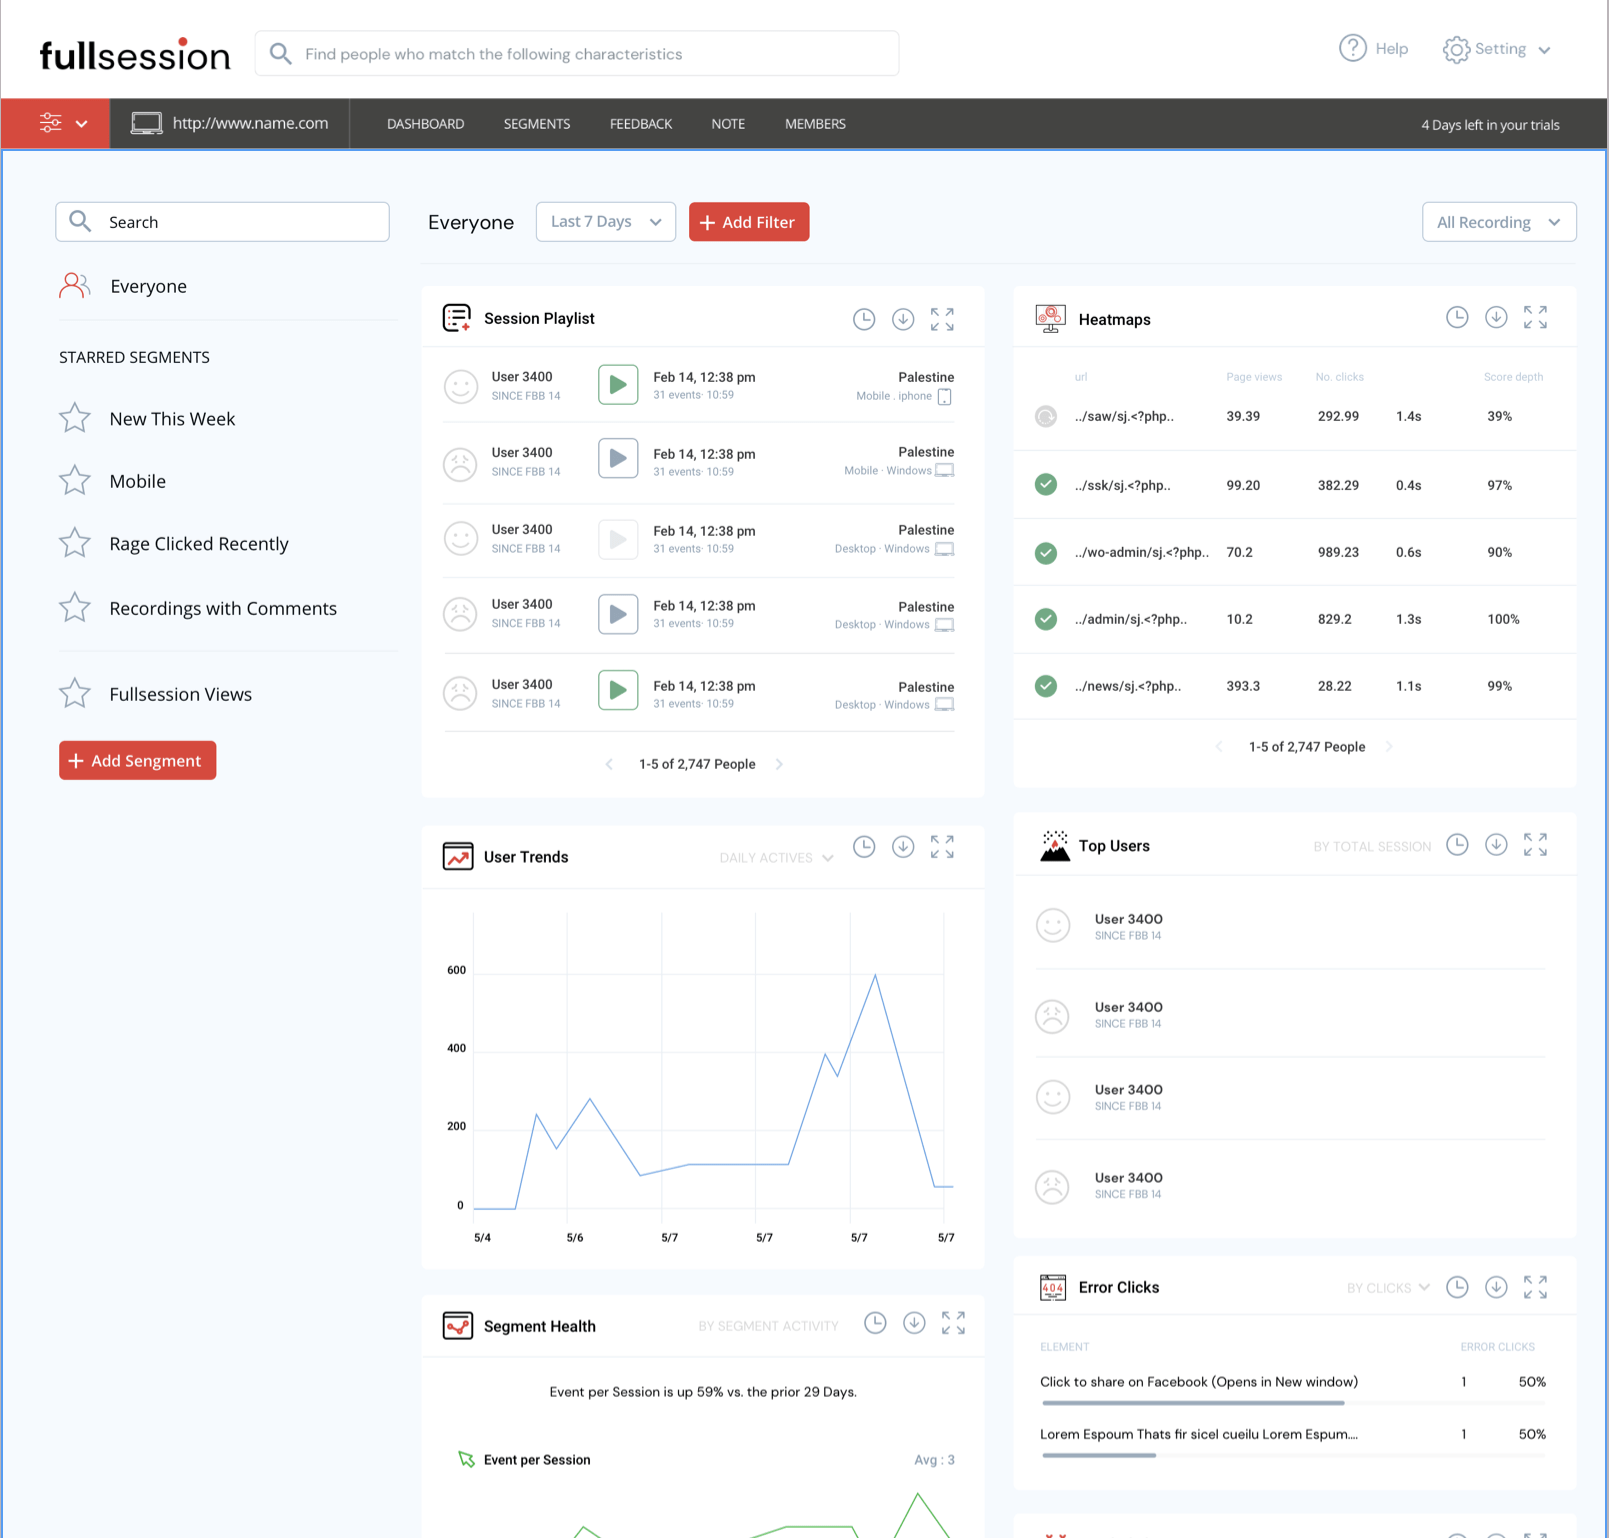
FullSession session recording and replay data
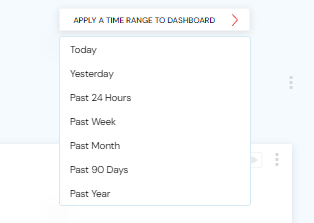
You can use FullSession to monitor different periods – years, months, weeks, or days. Here is the data you can track using these features. Highlighted entries directly correlate with some of the product metrics mentioned in this article.
- The country and IP address of users
- Screen resolutions
- Average time on page
- Total time spent on pages
- Visit source
- Pages/URLs users visited
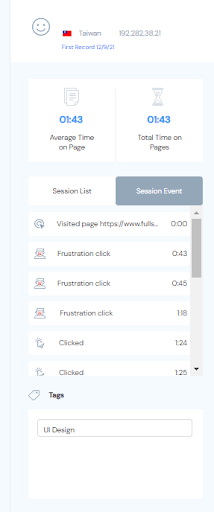
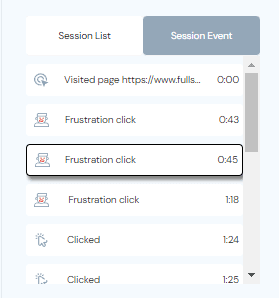
- Session list
- The session event data
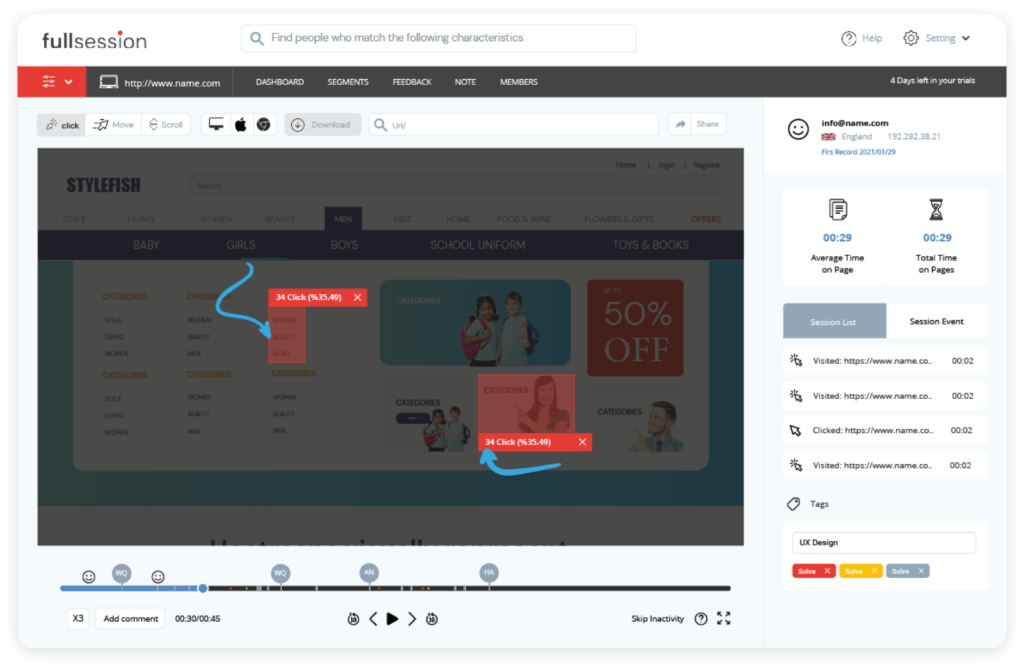
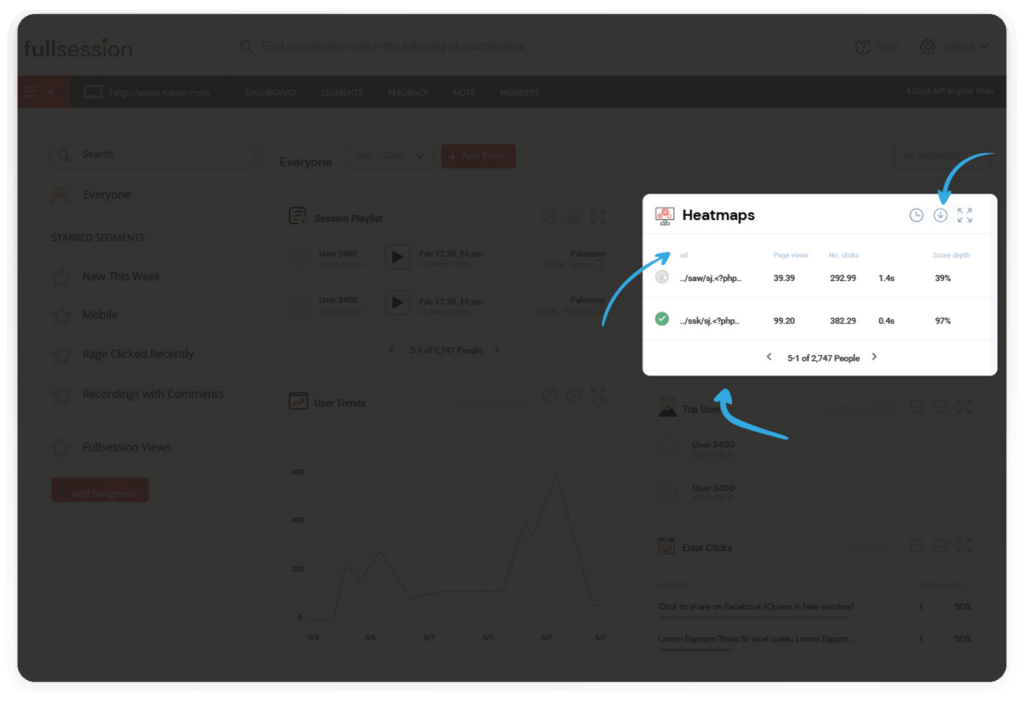
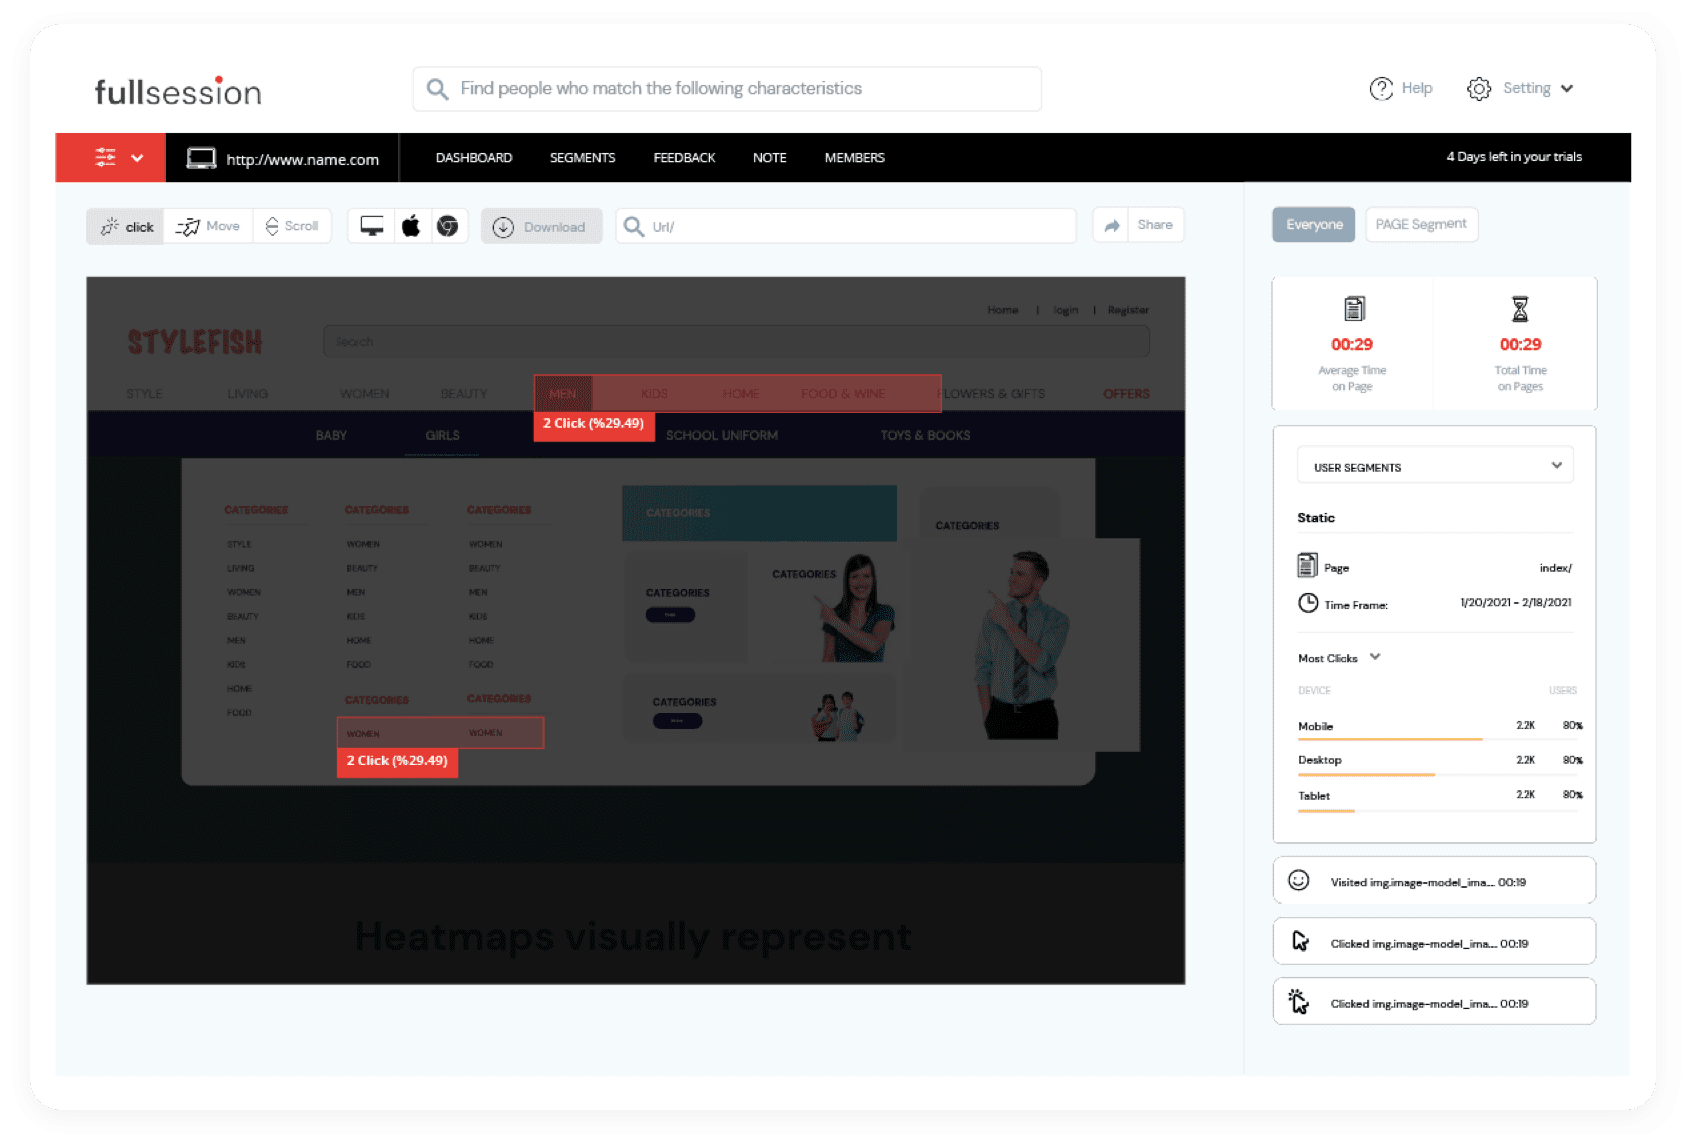
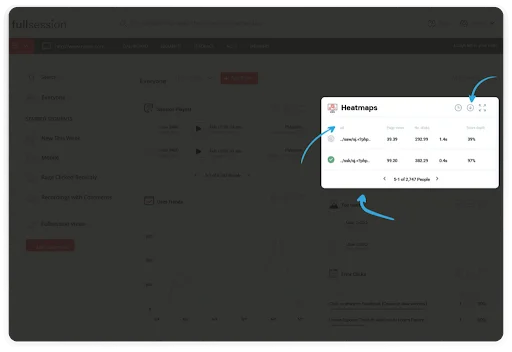
Interactive heatmaps
You can use website heatmap tools to track users’ actions – you will see them in the form of graphic reports. Heatmap lets you notice issues that make people leave prematurely and helps you boost conversion rates.
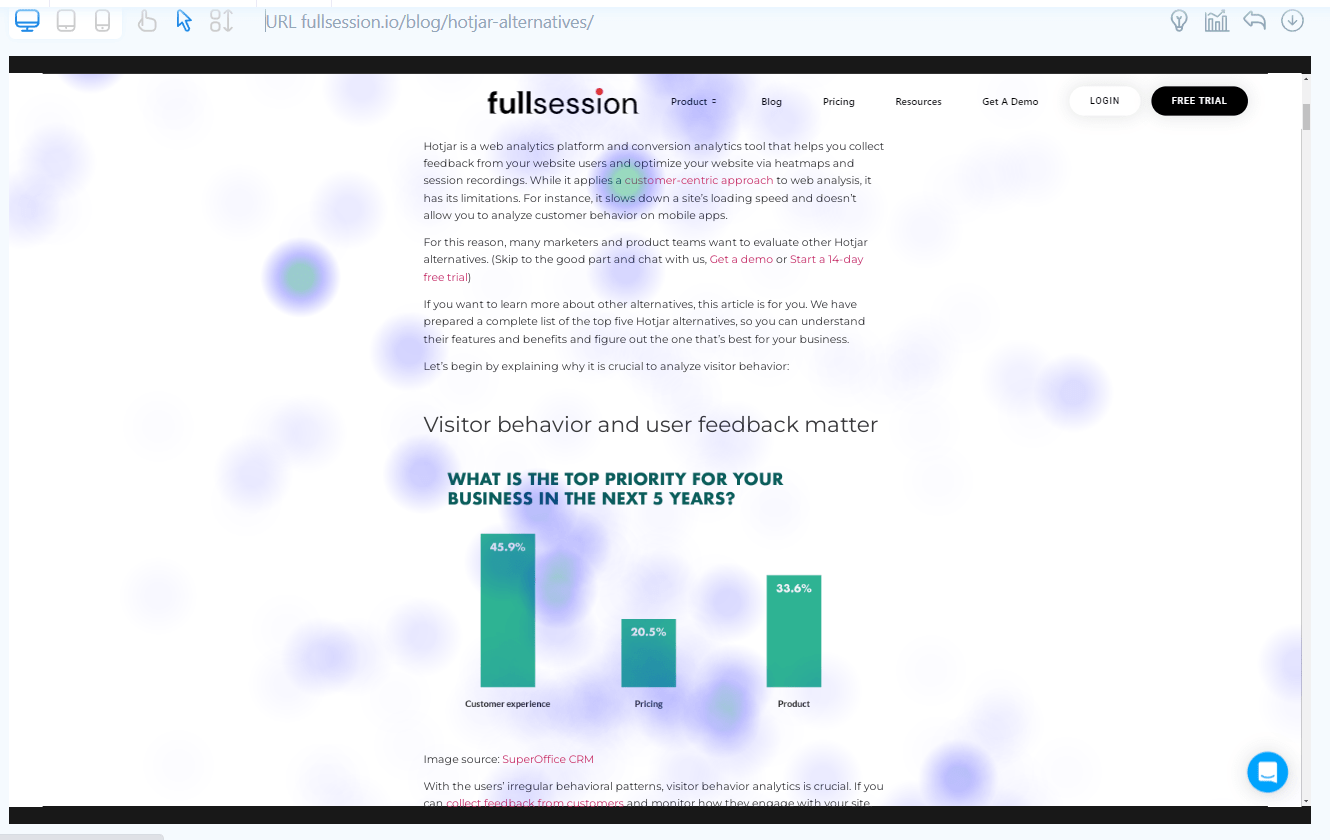
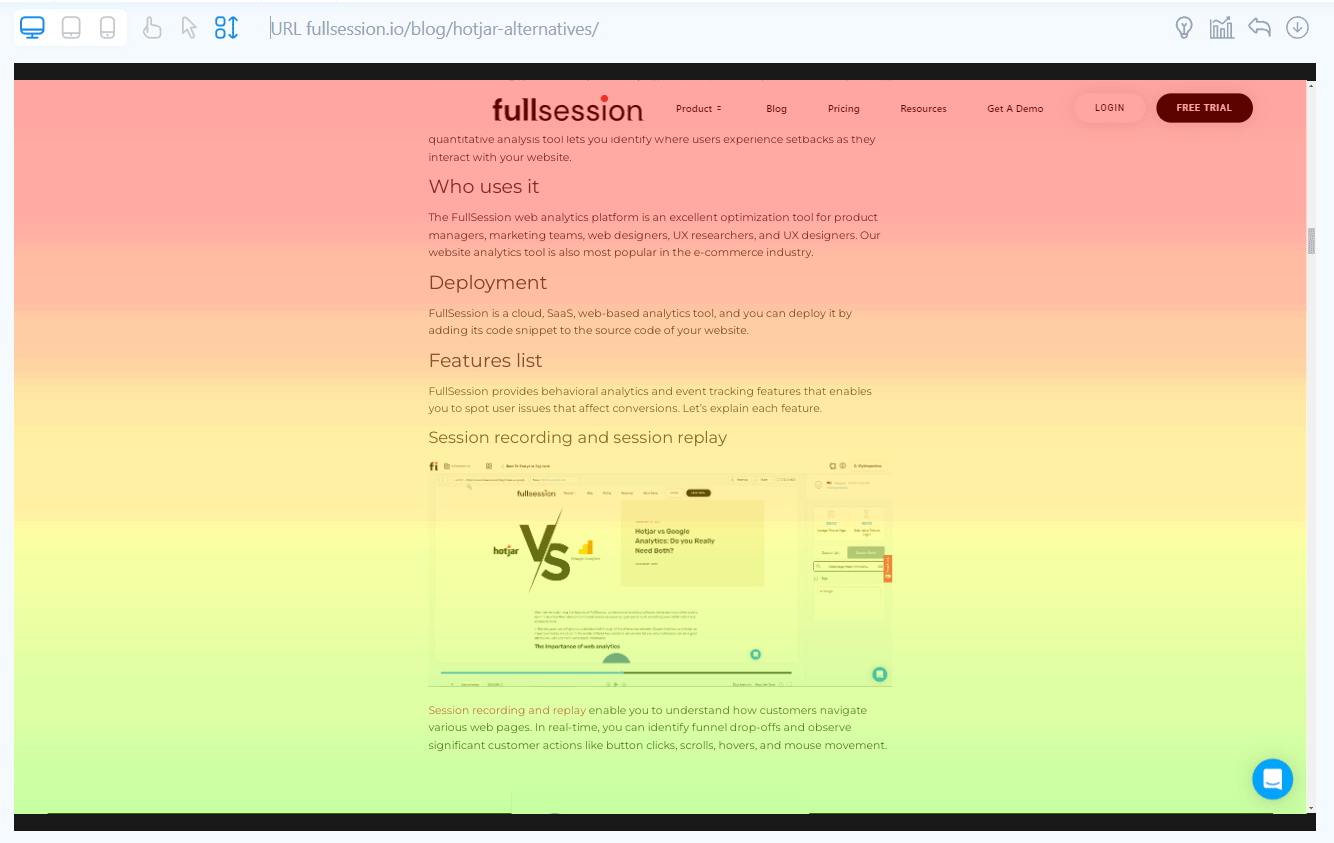
FullSession provides three types of heatmaps: movement maps, scroll maps and click maps. We have a detailed guide that’ll show you how to read a heatmap if you’re interested in this subject.
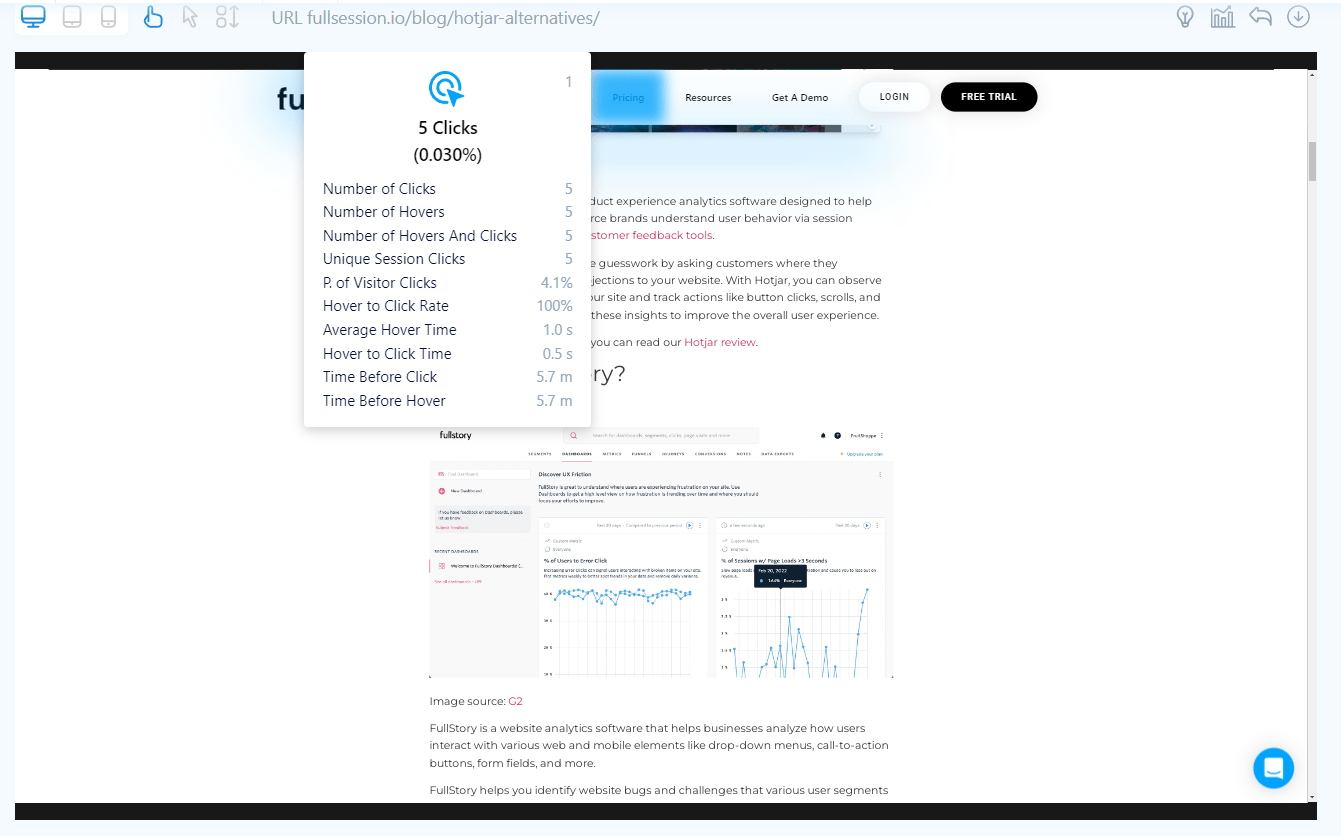
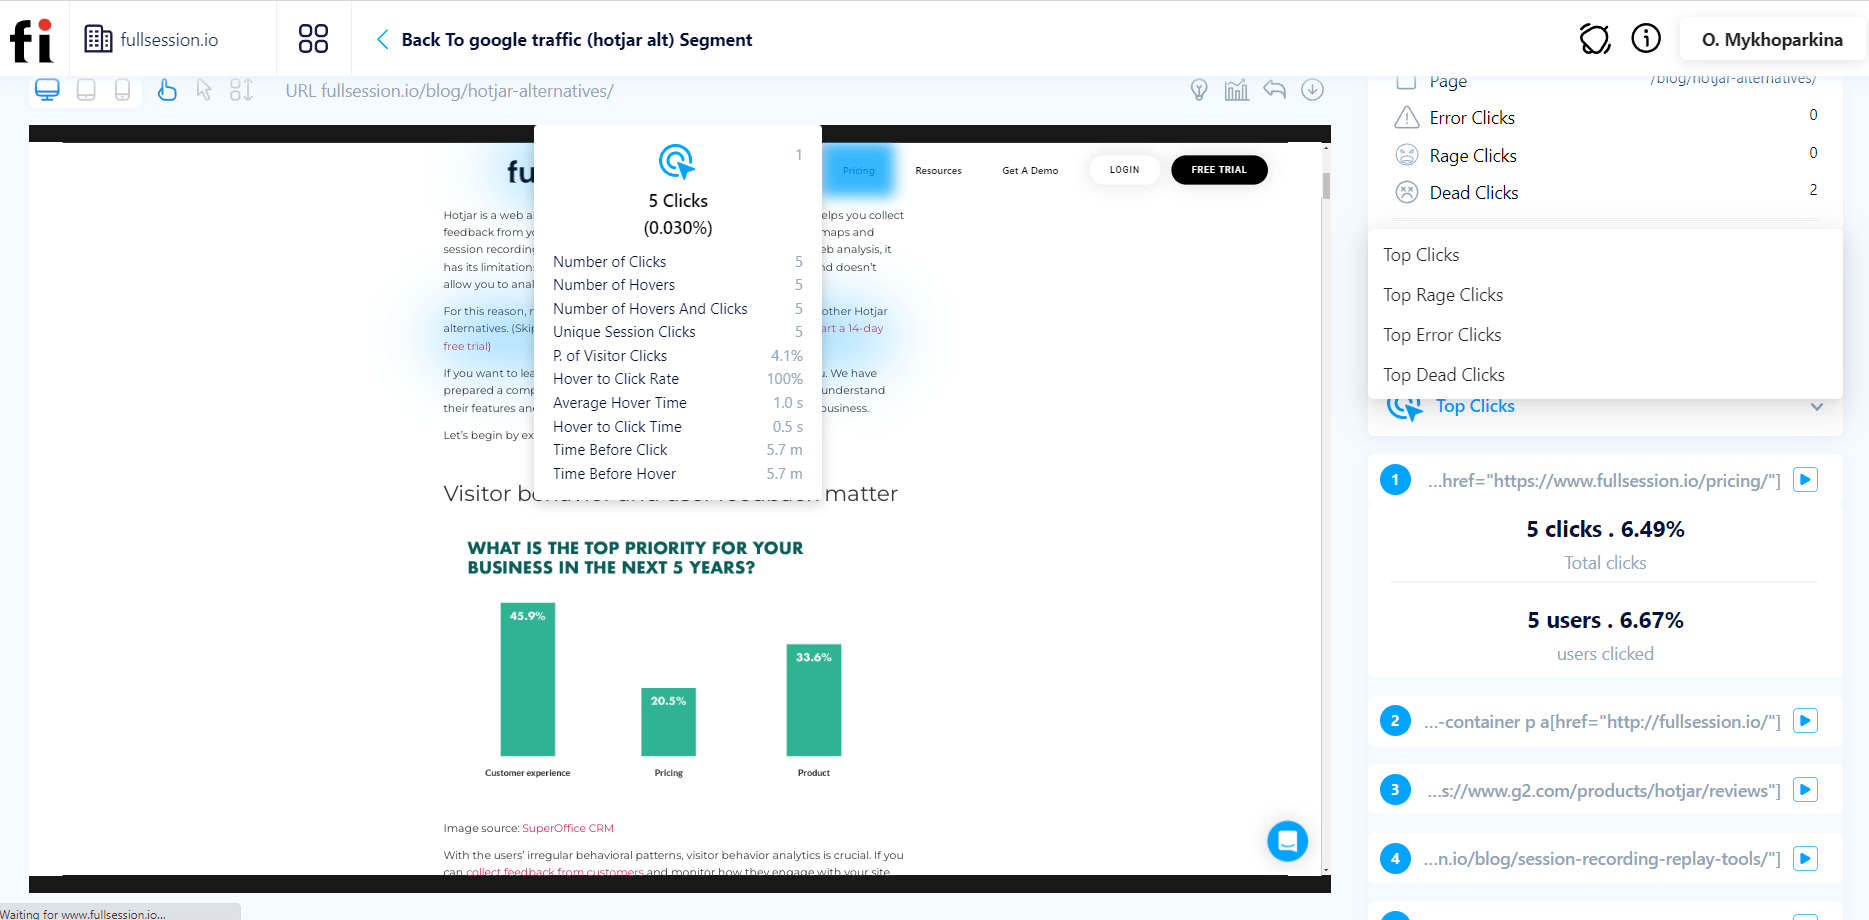
Clicks maps
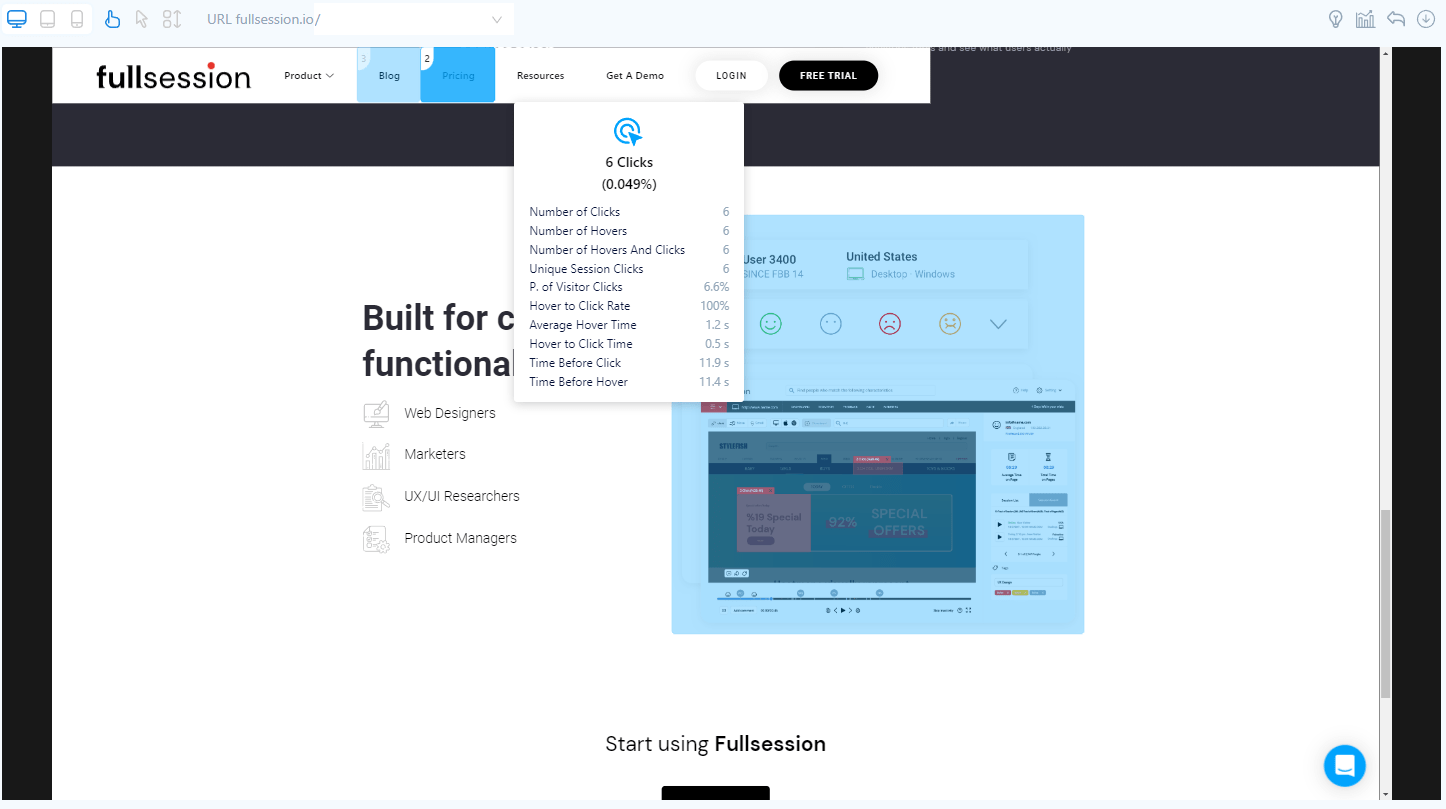
Click tracking lets you see what areas of the page – buttons, headers, CTAs – users clicked.
Movement heatmaps
With movement heatmaps, you can observe the user’s cursor movement. You can use them to track customer journey on the website and check what causes people problems.
Scroll maps
You use scroll maps to check how far users scroll down on the page. It can be helpful when you want to decide where to place an ad or CTA (Call to Action).
FullSession heatmap data
Here are the types of data you can collect thanks to the FullSession interactive heatmaps feature. Once again, we’ve highlighted points correlated with product metrics.
- The visited URL
- User engagement data
- The number of visitors
- Total views count
- The total number of clicks
- The average page load time
- The average time on page
- Error data
- The number of dead clicks
- The number of rage clicks
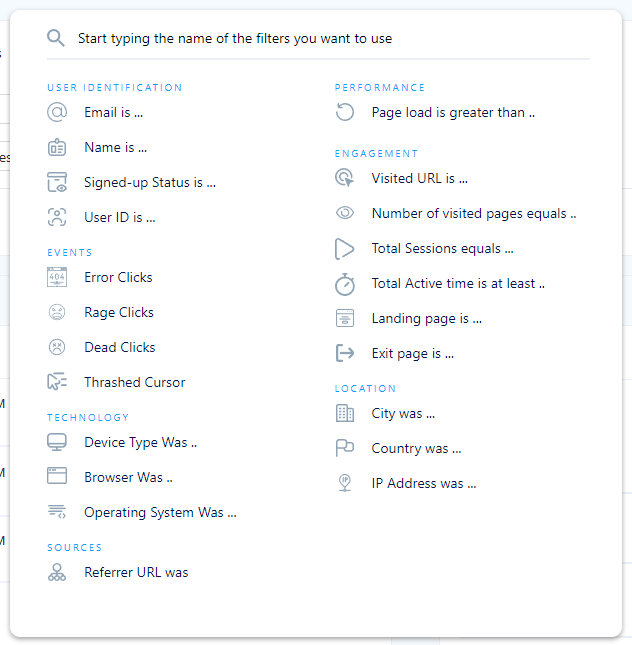
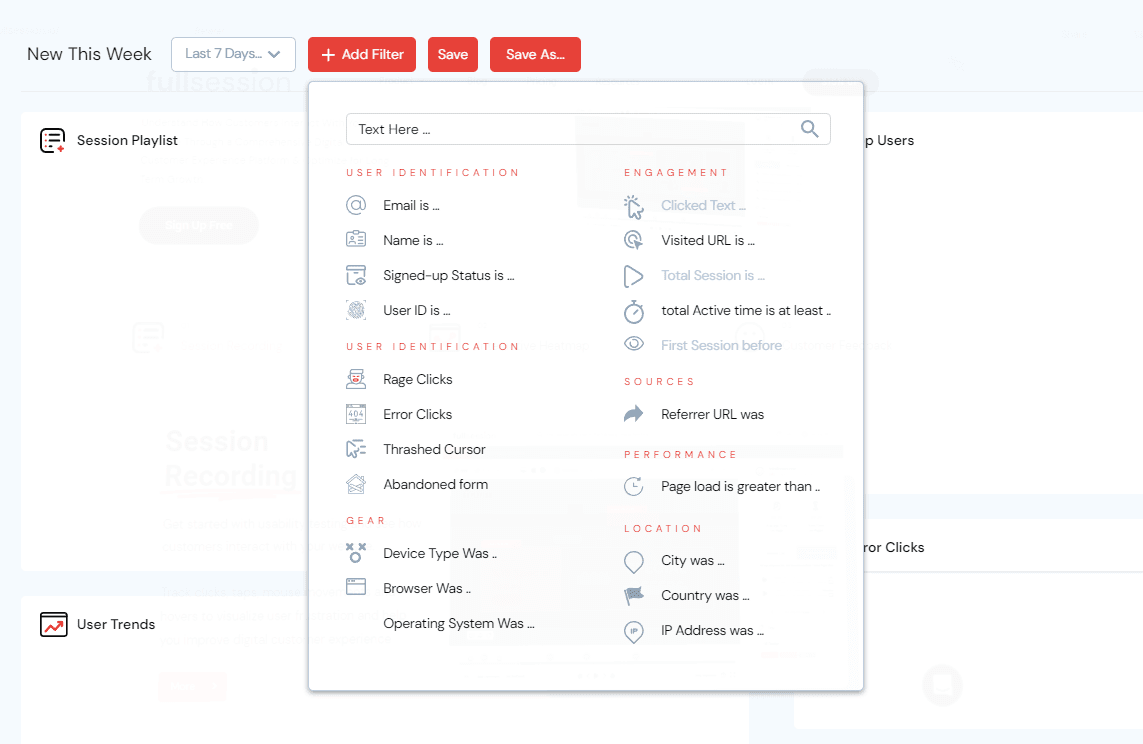
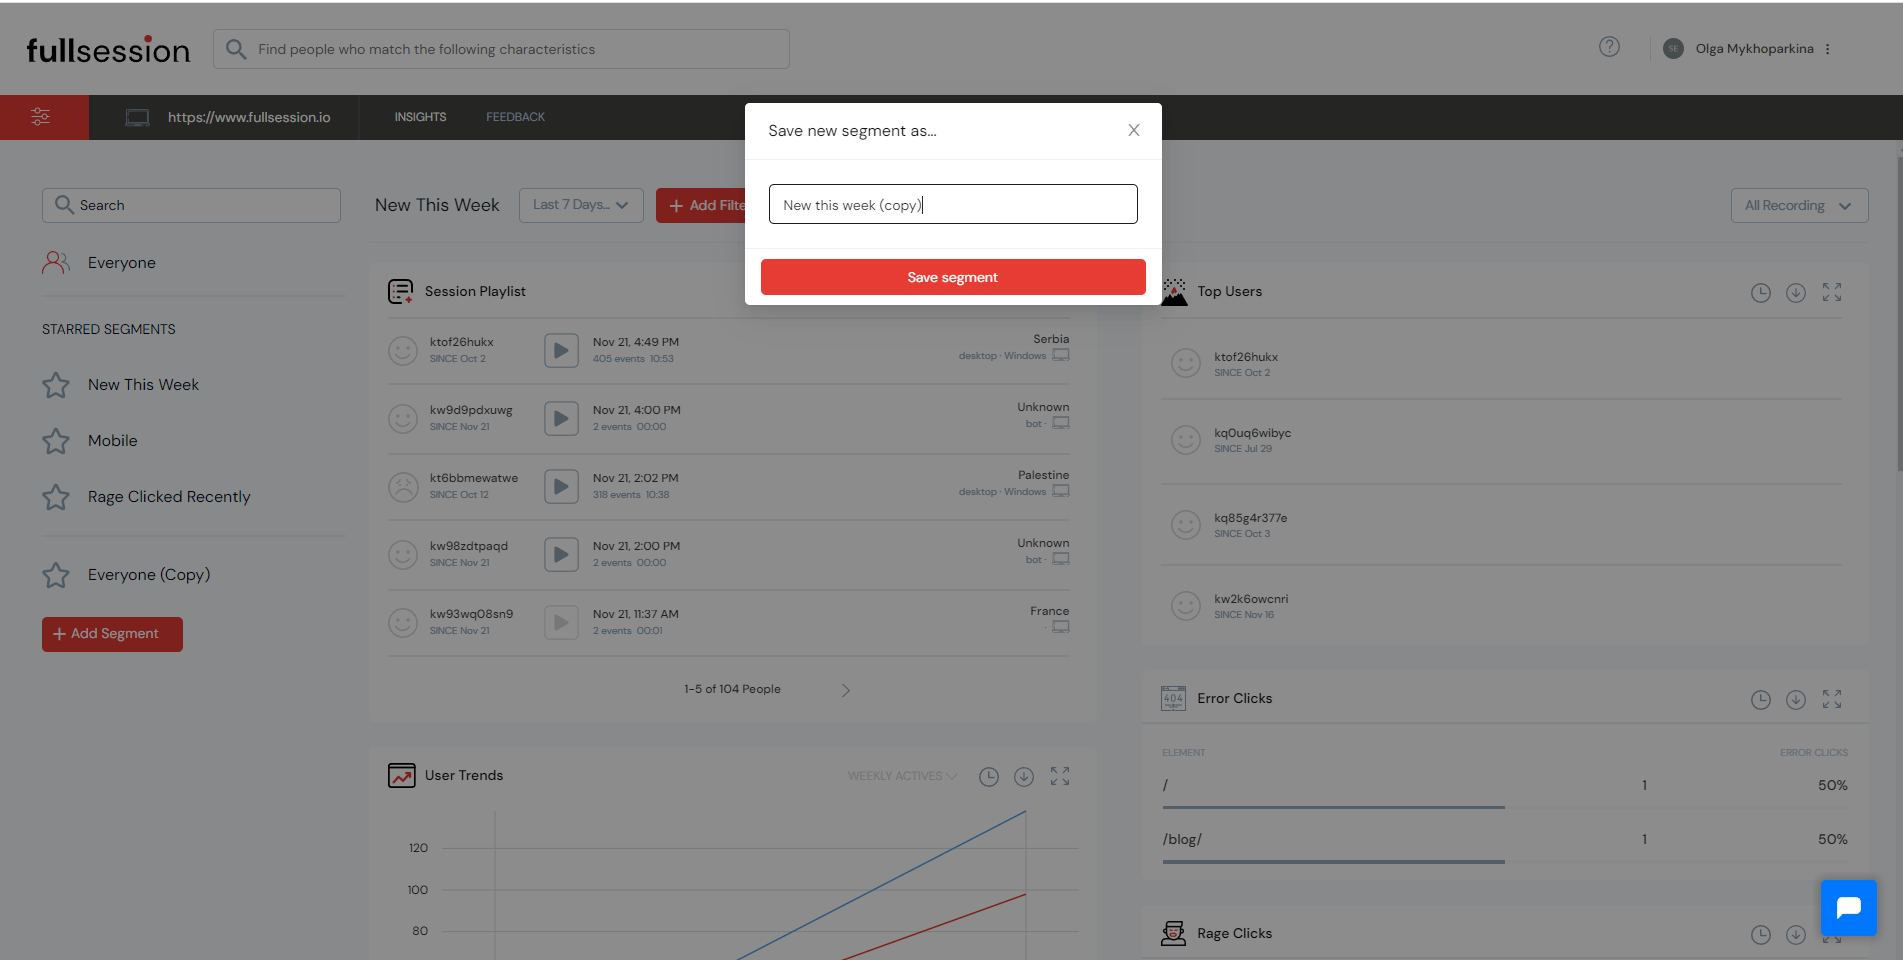
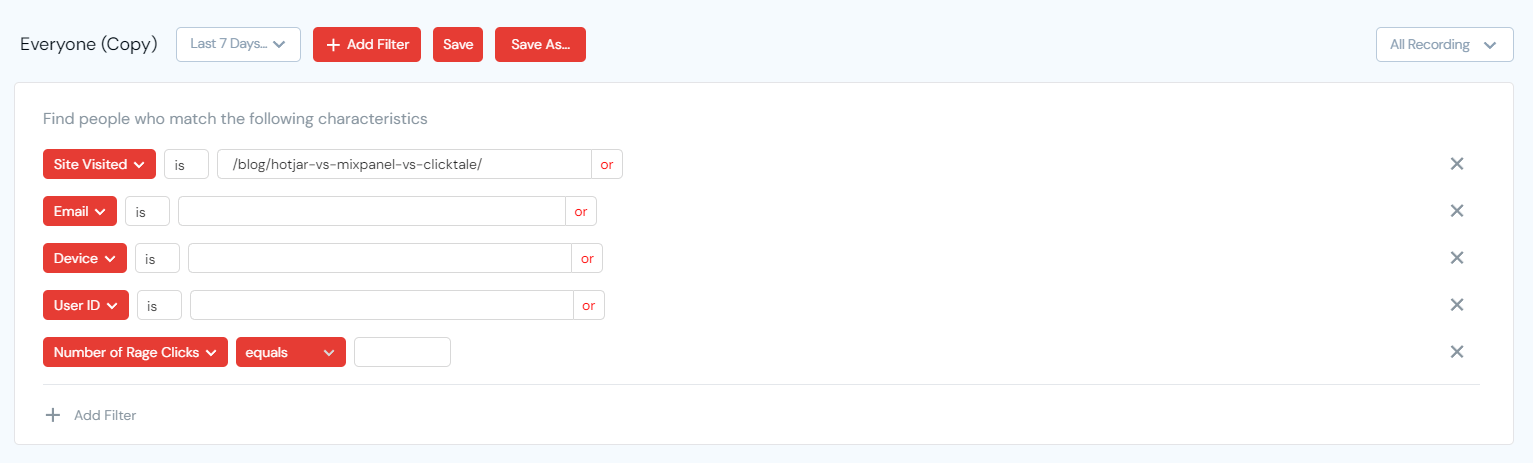
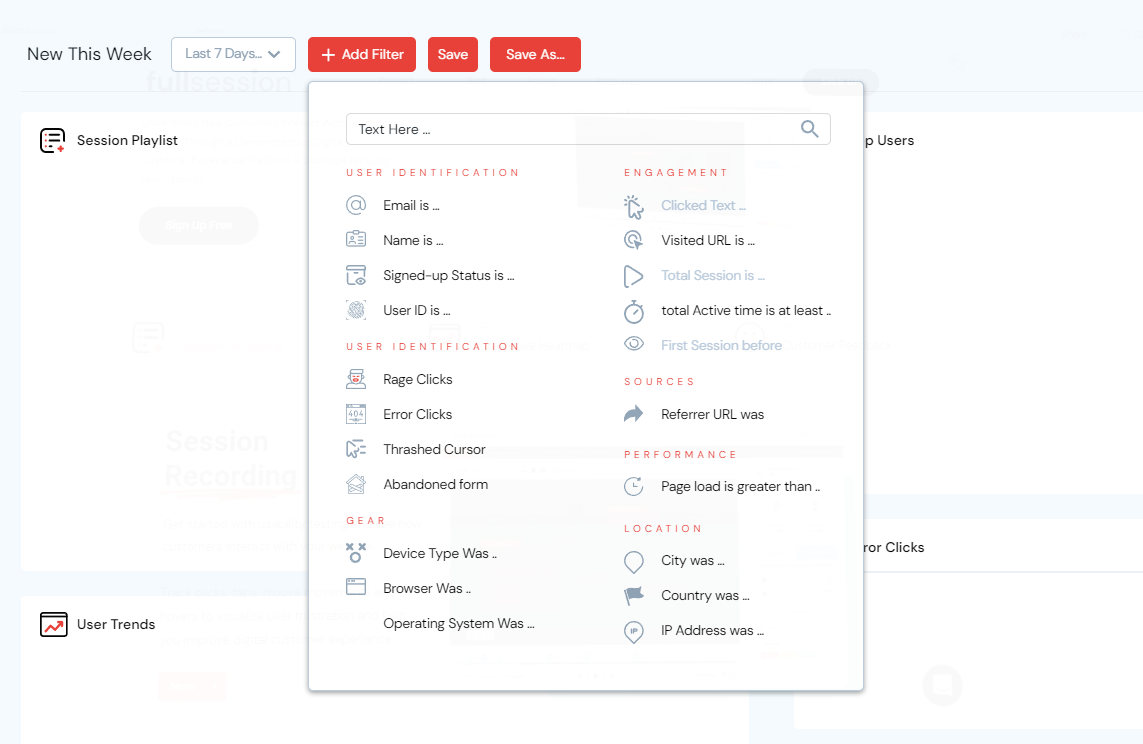
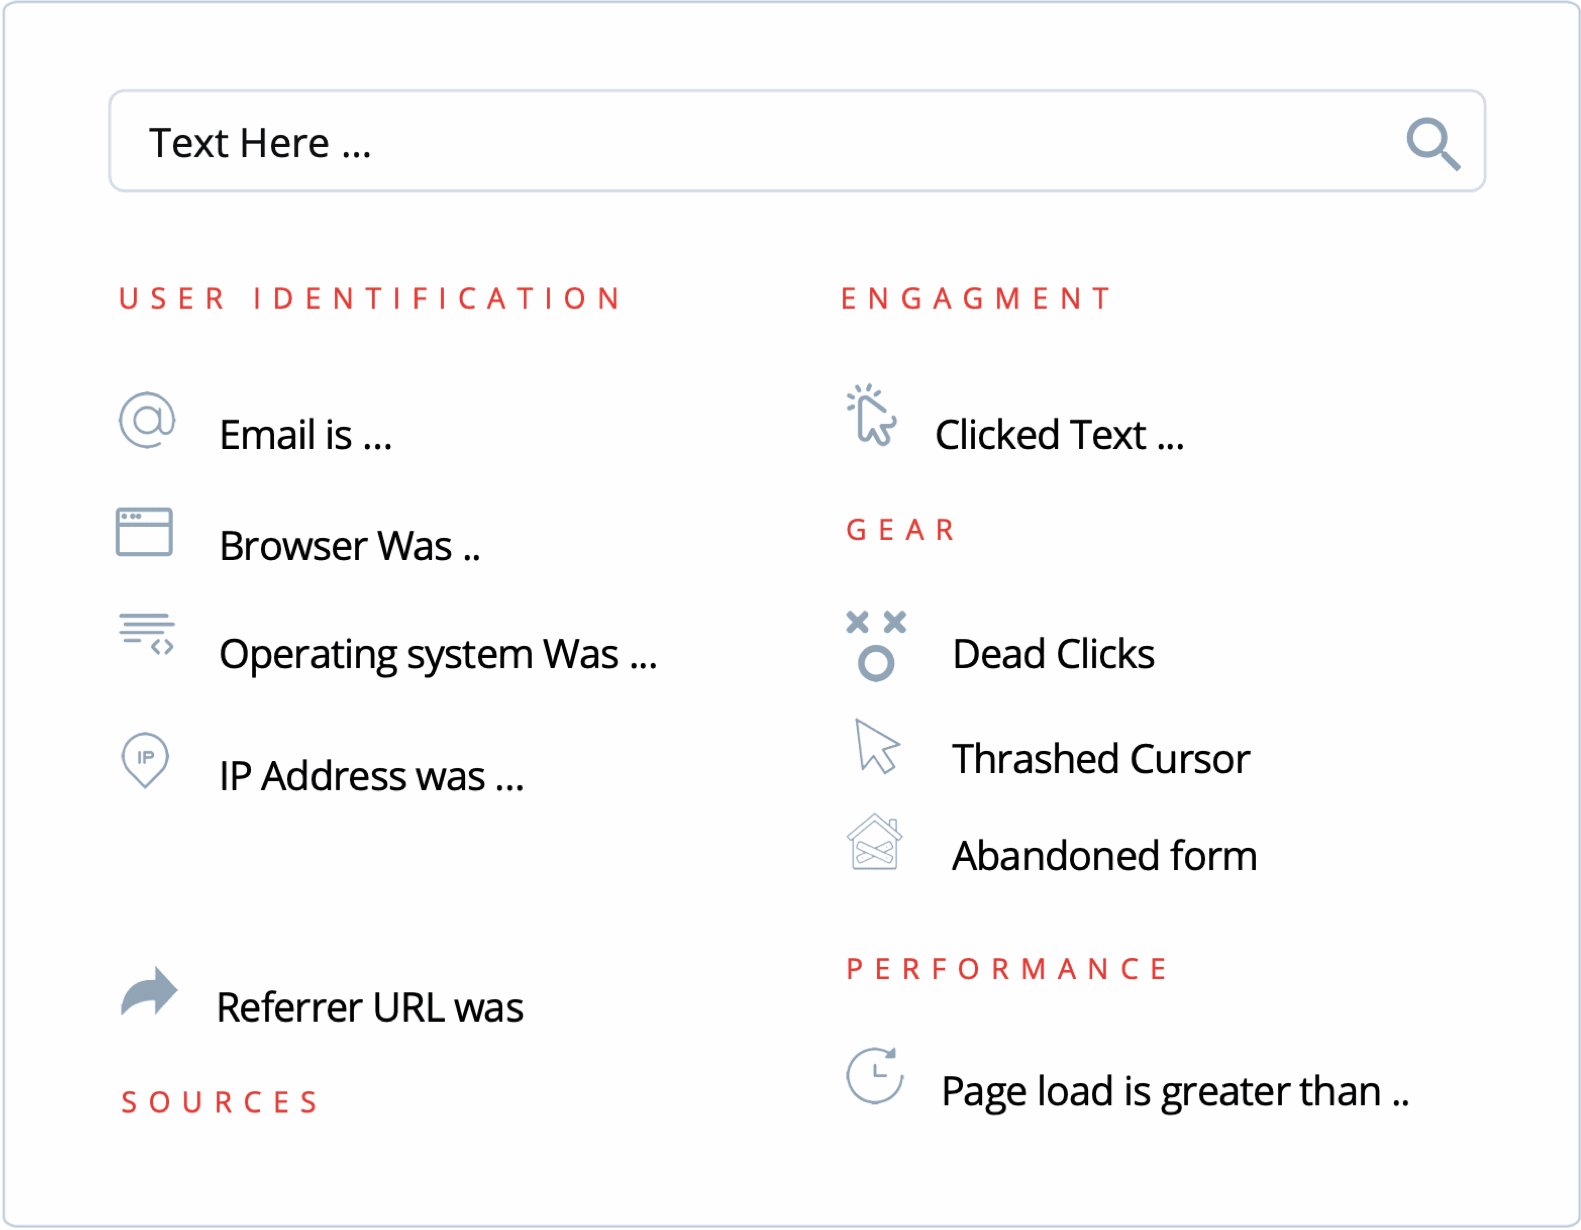
Advanced filtering and segmentation
Our advanced filtering feature helps you find specific events during sessions that may interest you. You don’t have to waste time watching entire recordings – you can focus on fragments that matter. It’s an excellent way to save time, especially when cooperating with other team members.
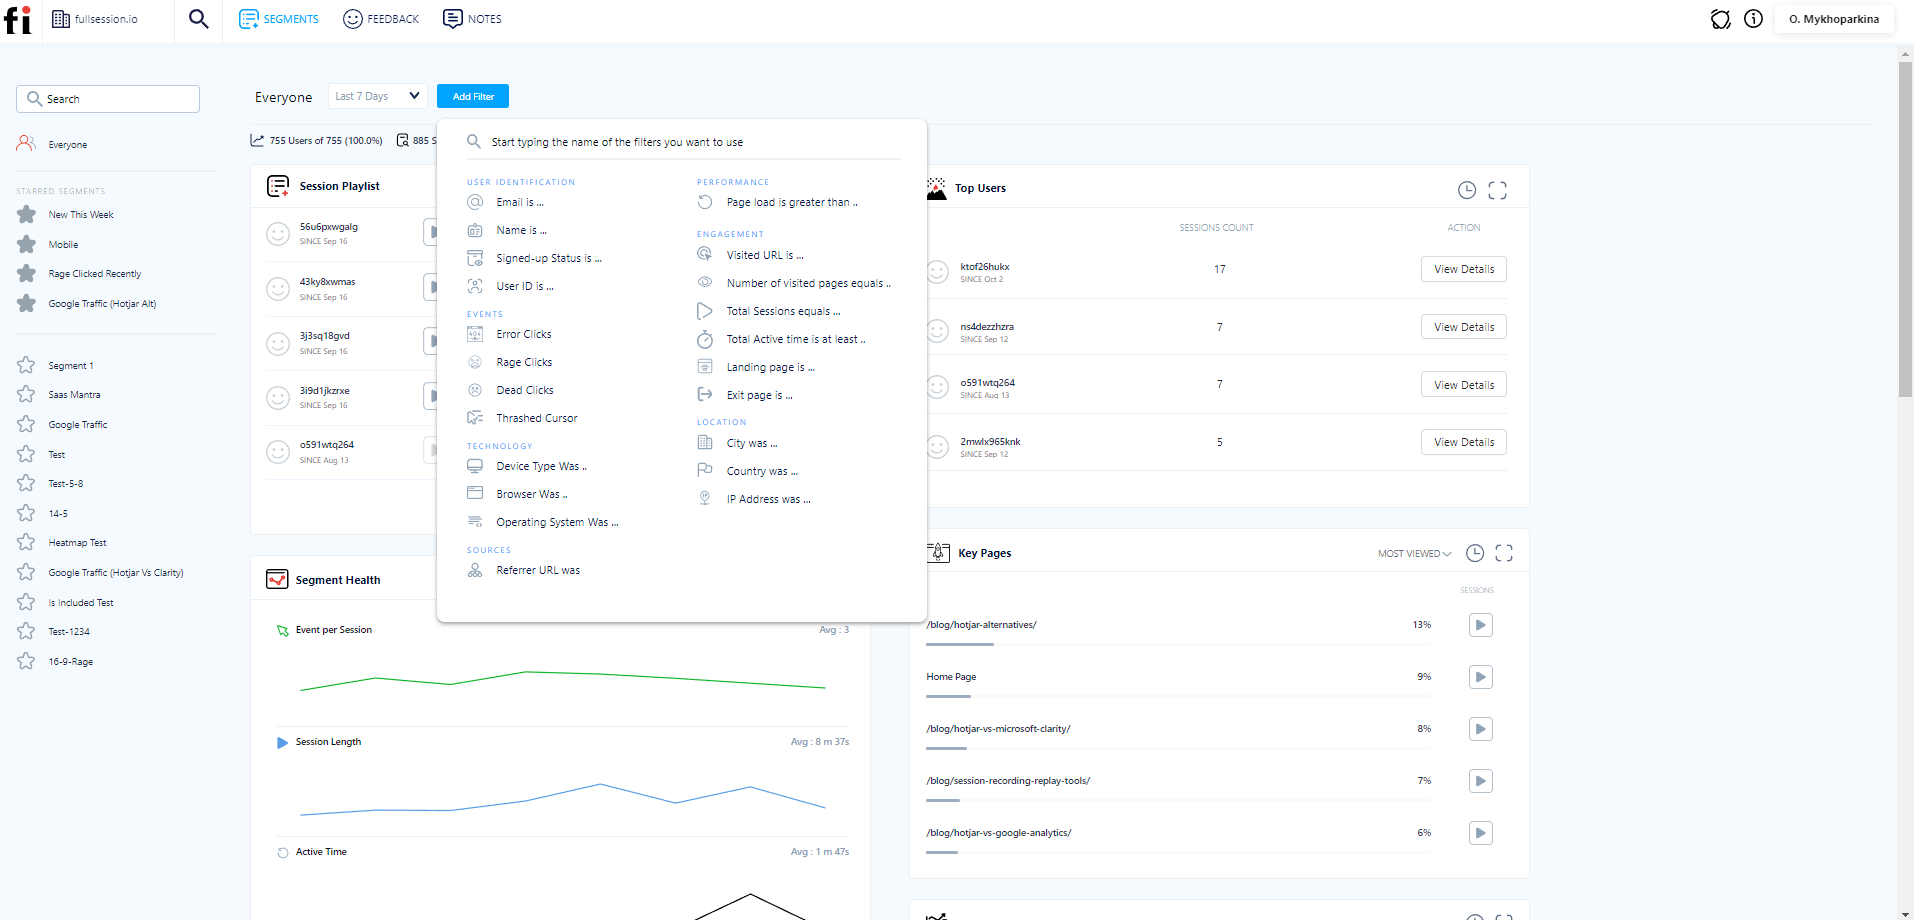
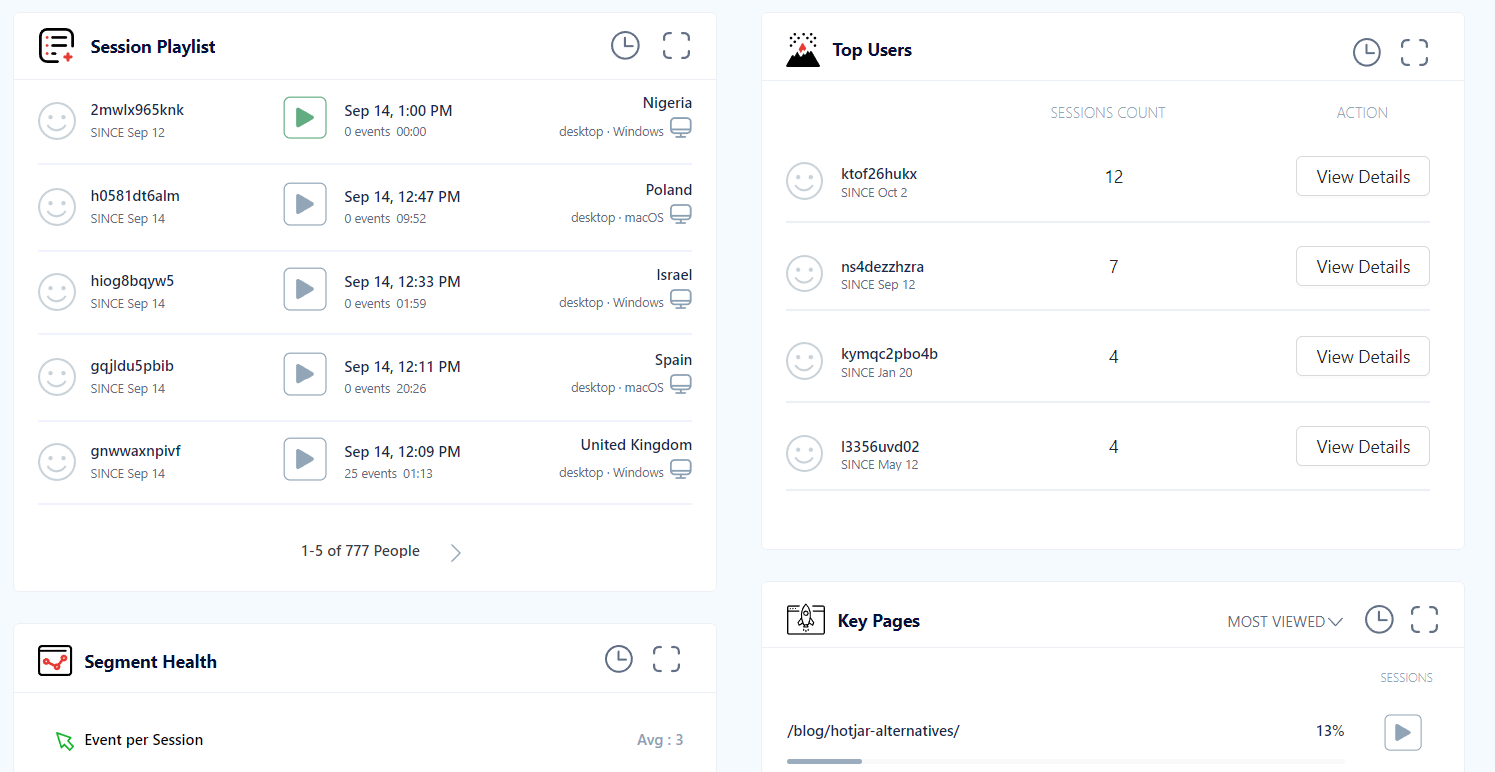
Advanced analytics
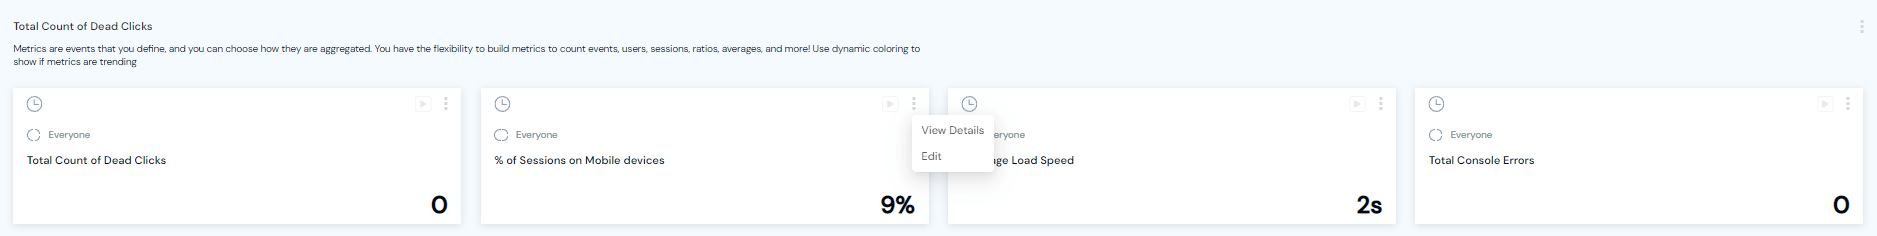
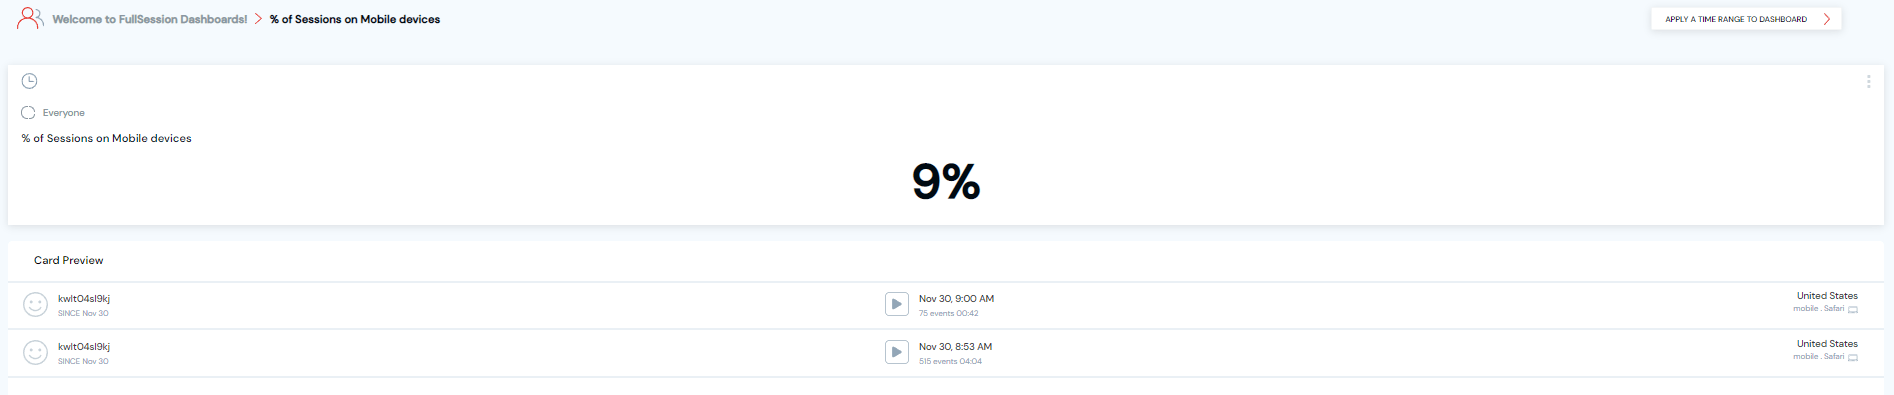
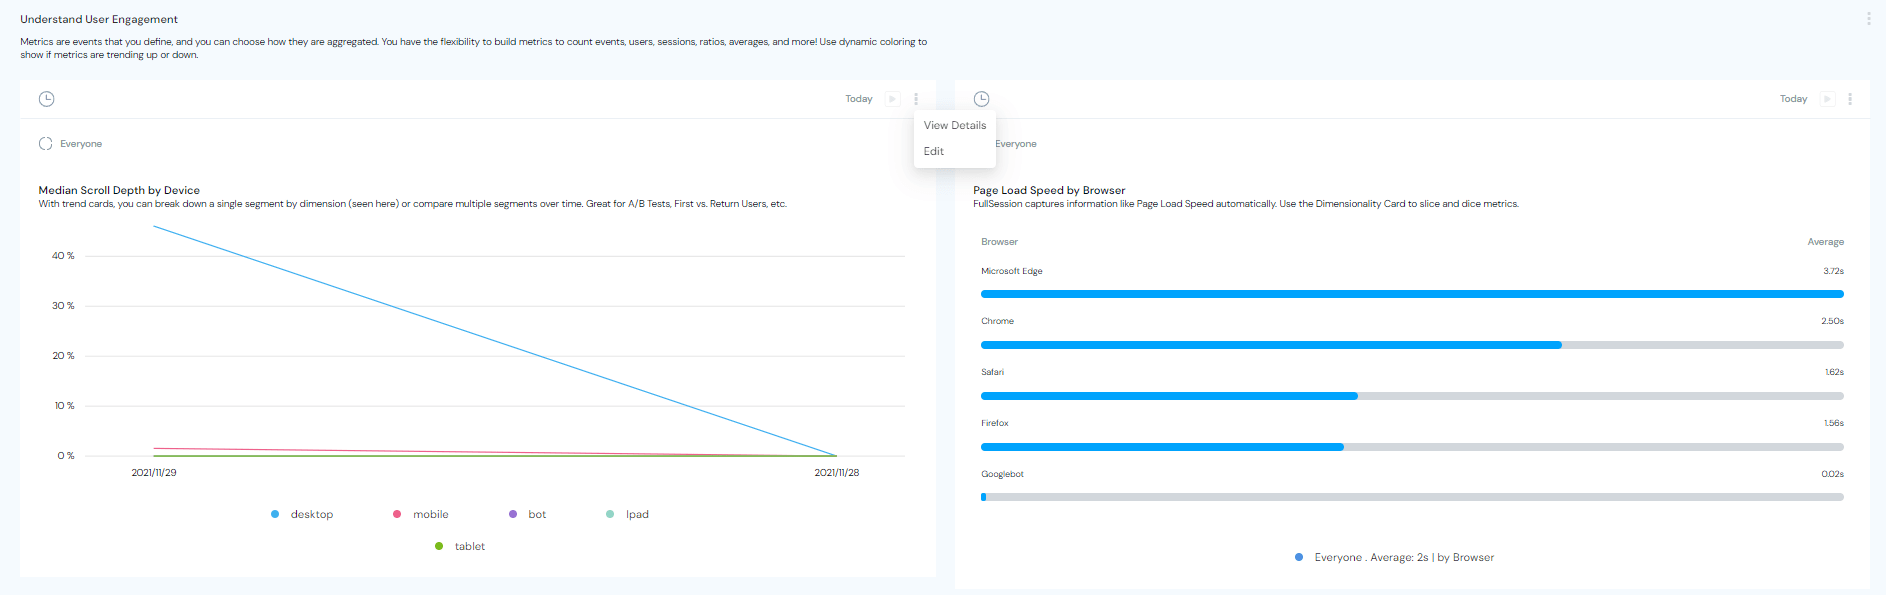
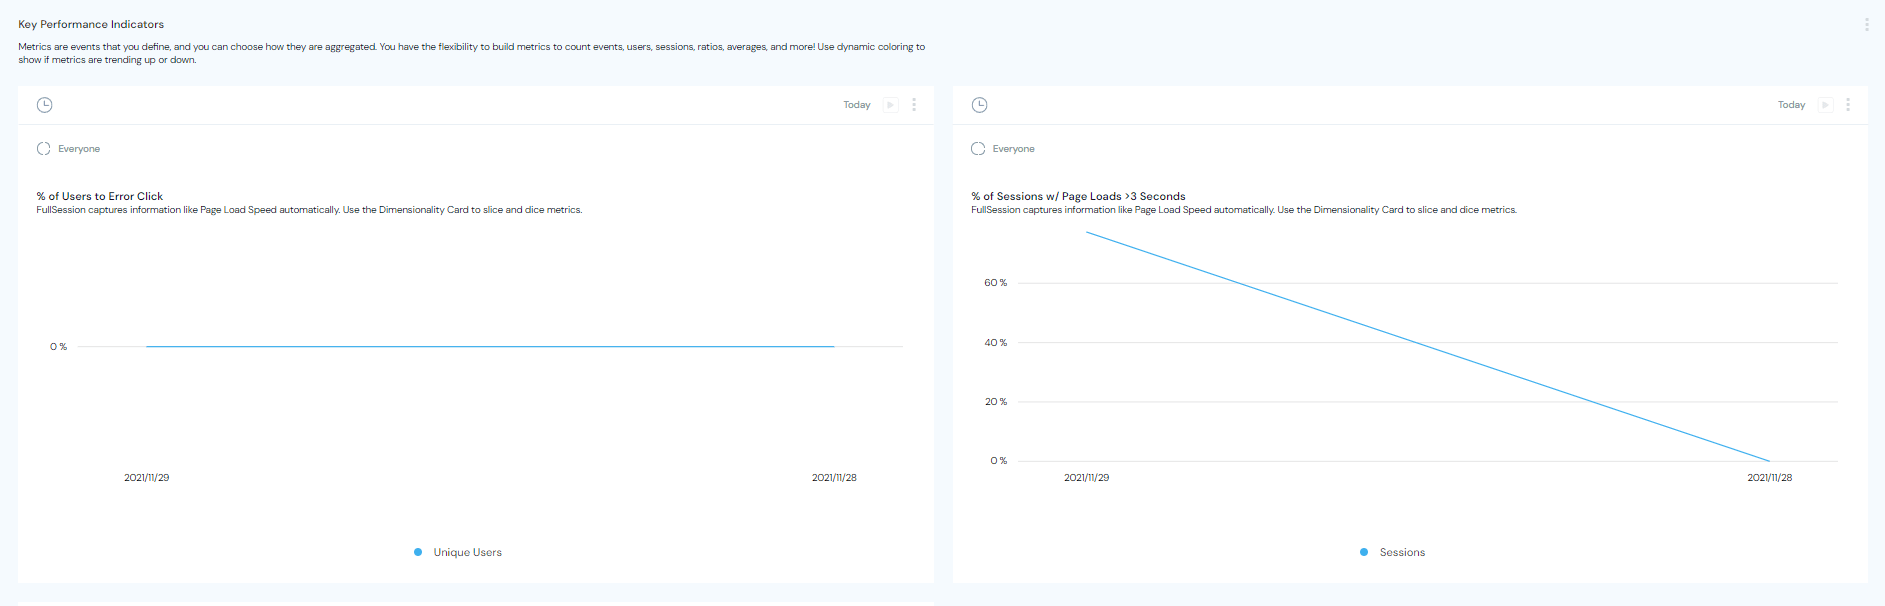
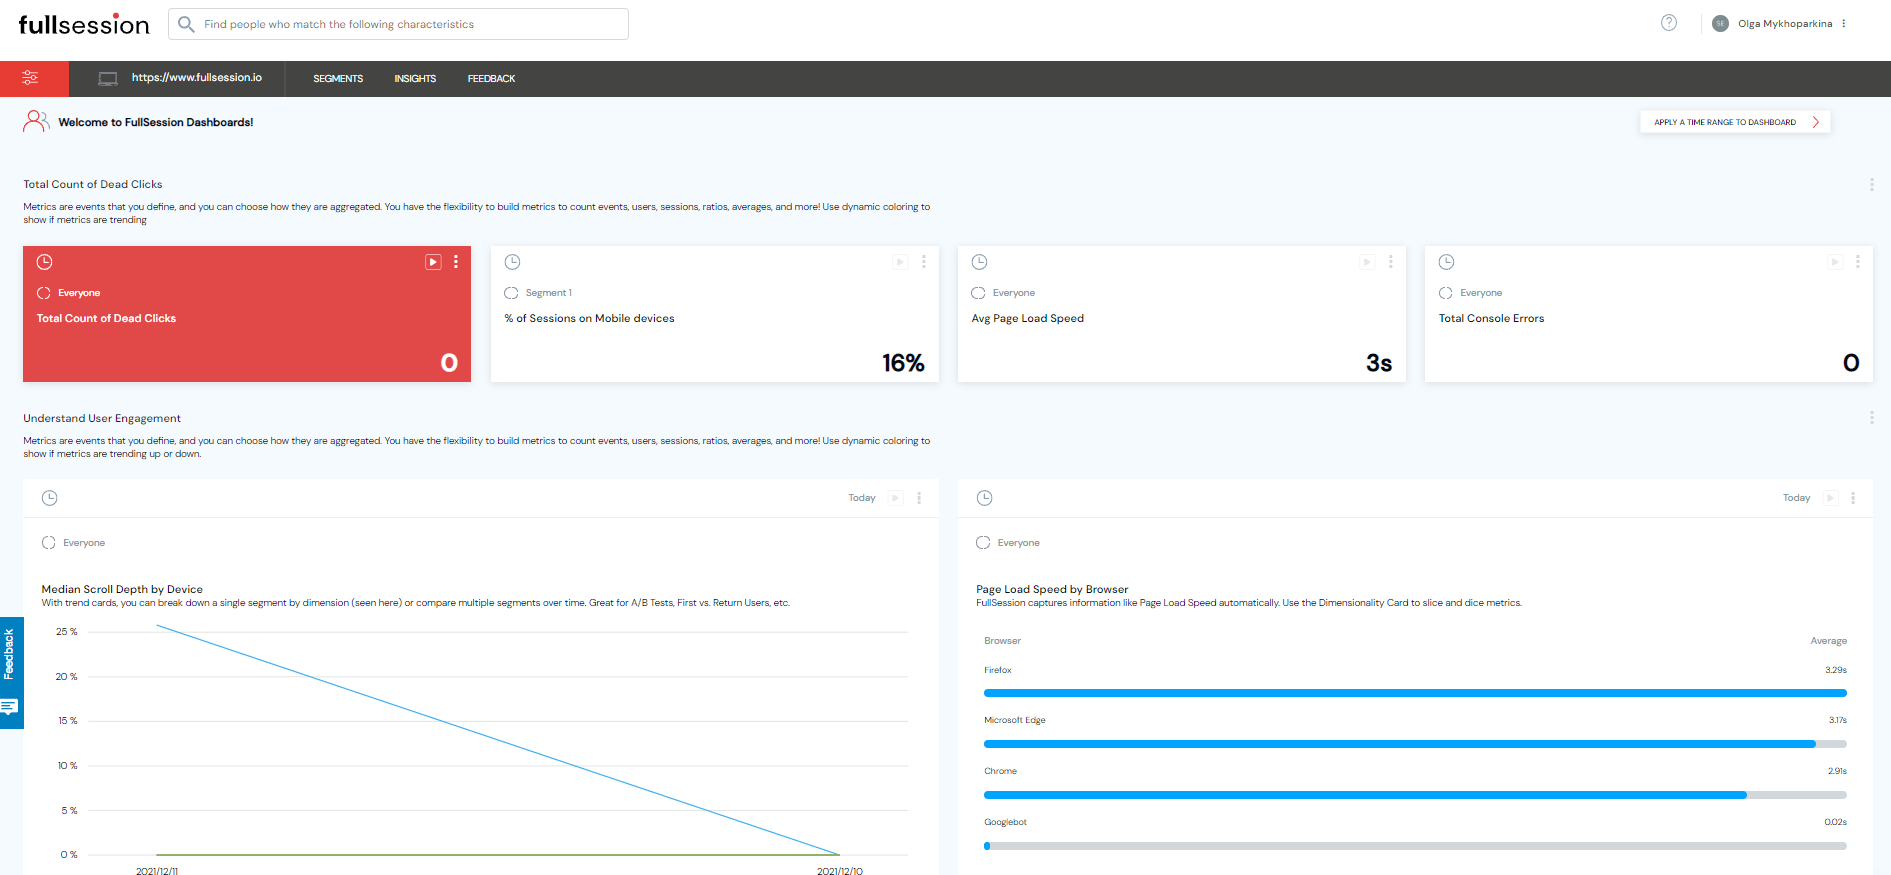
Our metrics page gives you easy access to all the crucial information. It makes noticing correlations between different data points easier.

FullSession analytics data
Here’s what you can find on the metrics page:
- Average load speeds
- Page load data
- Median scroll depth
- The number of dead clicks
- Console errors
- The number of error clicks
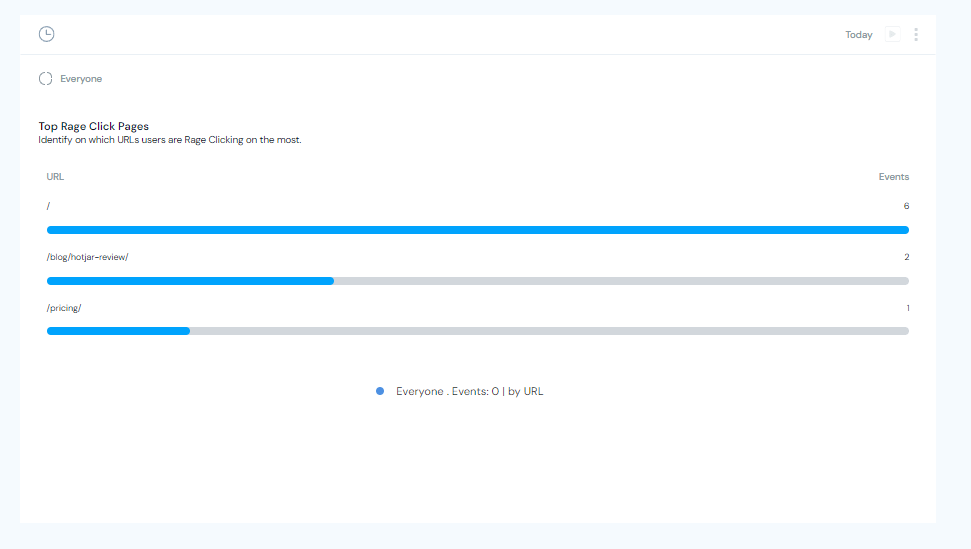
- The number of rage clicks
- Resolutions used
- Percentage of sessions on mobile devices
Again, we’ve highlighted some entries to emphasize their importance, but you can use all of the data to track some aspects of your digital product.
Customer feedback forms
You can get customer feedback to improve your understanding of users’ needs. FullSession provides almost the same feature as specialized NPS software. You can use the collected feedback to pinpoint customers’ issues when using your product.
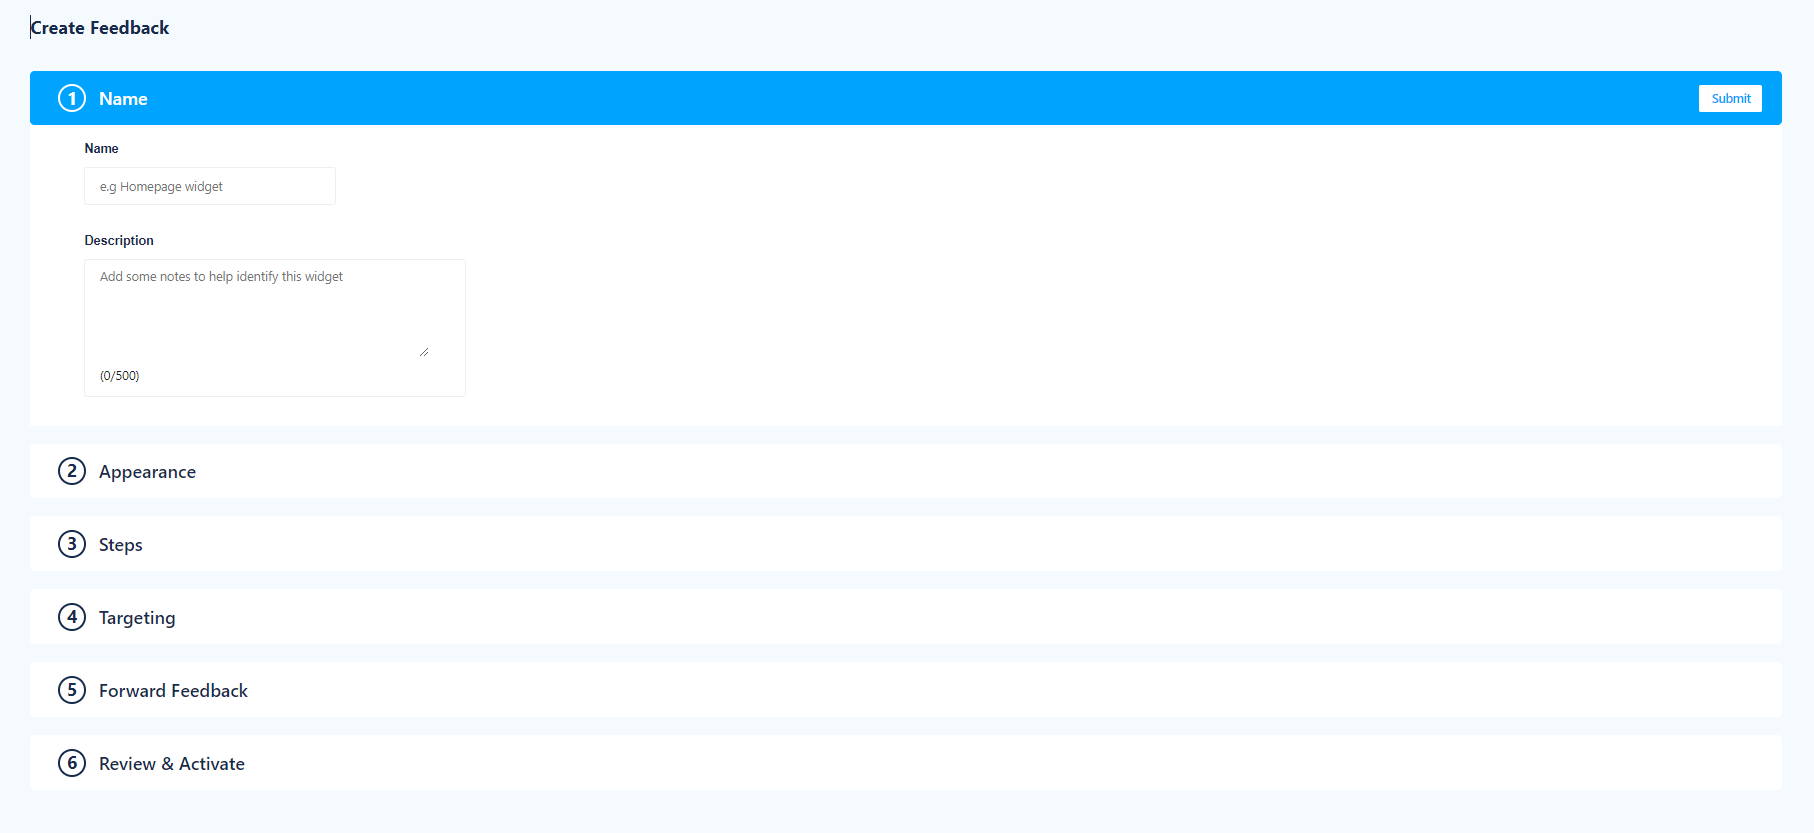
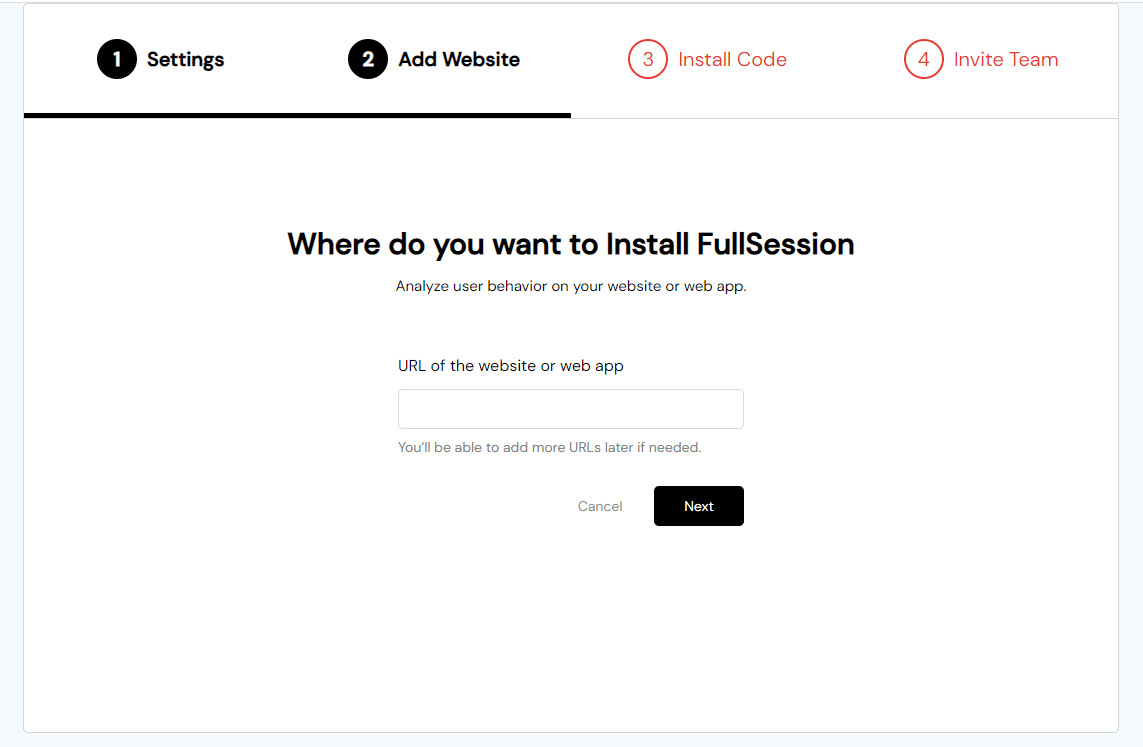
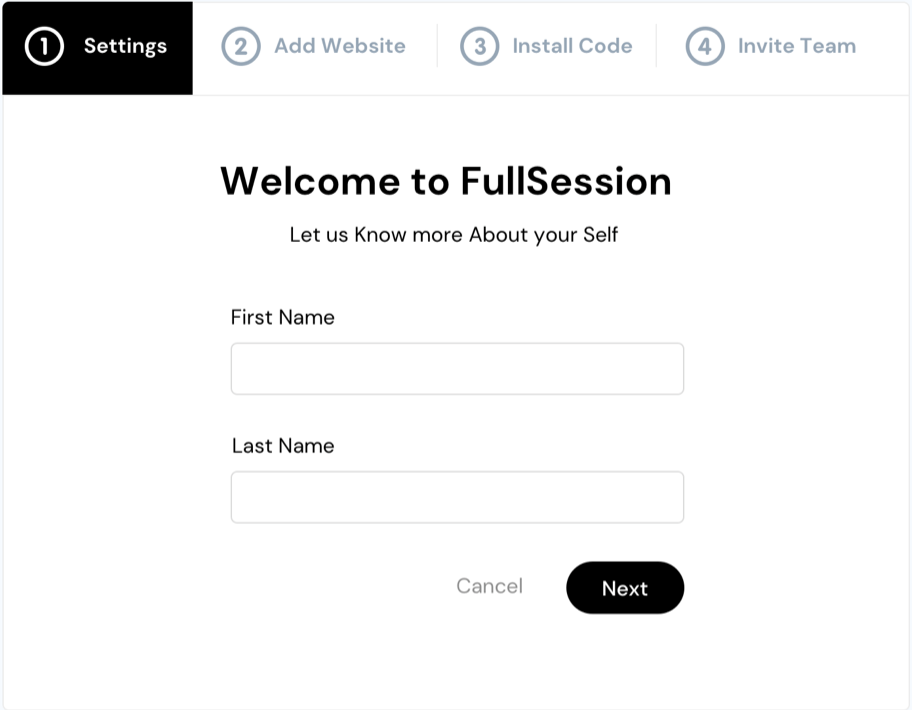
Creating a customer feedback form with FullSession is easy:
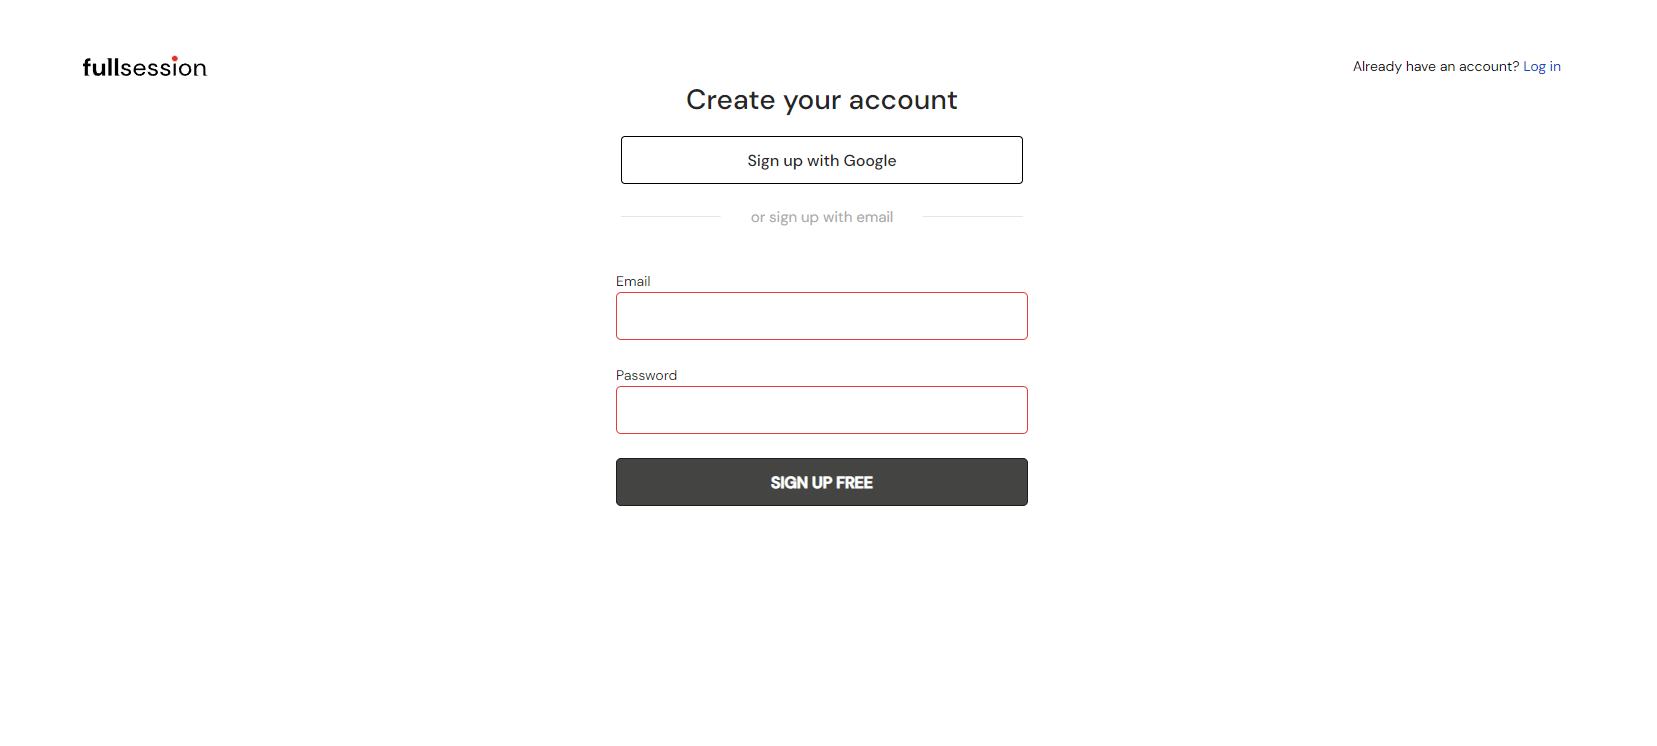
- Start a free trial
- Log in to your account
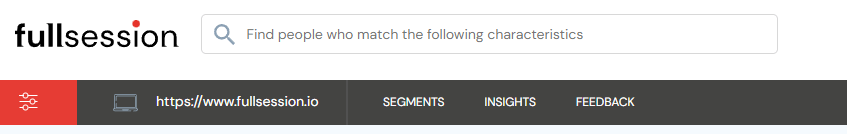
- Click the Feedback tab on the topmost bar
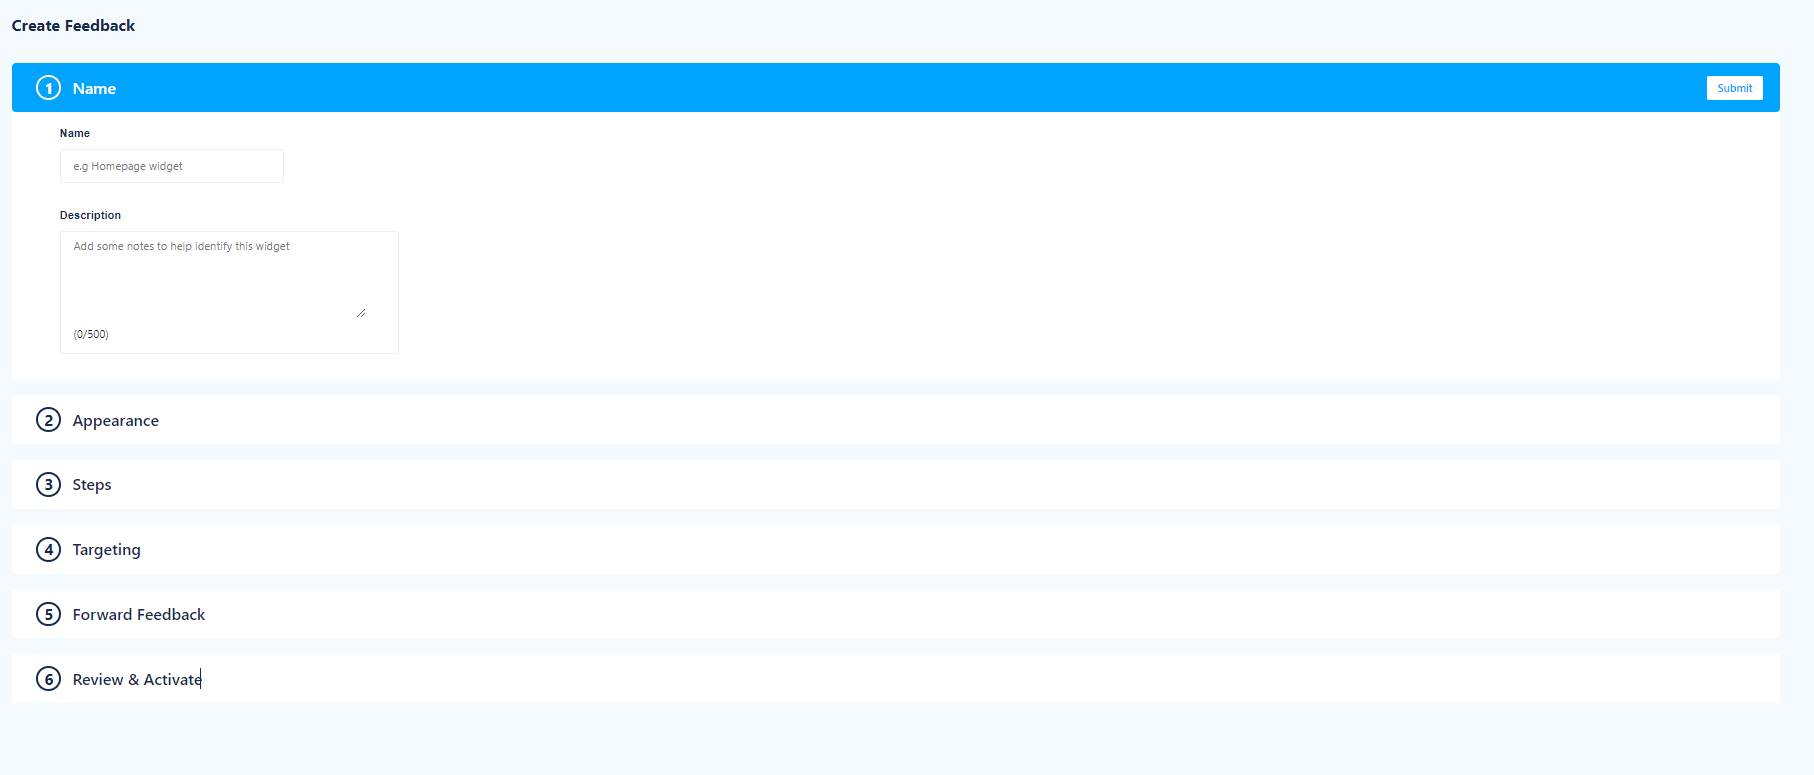
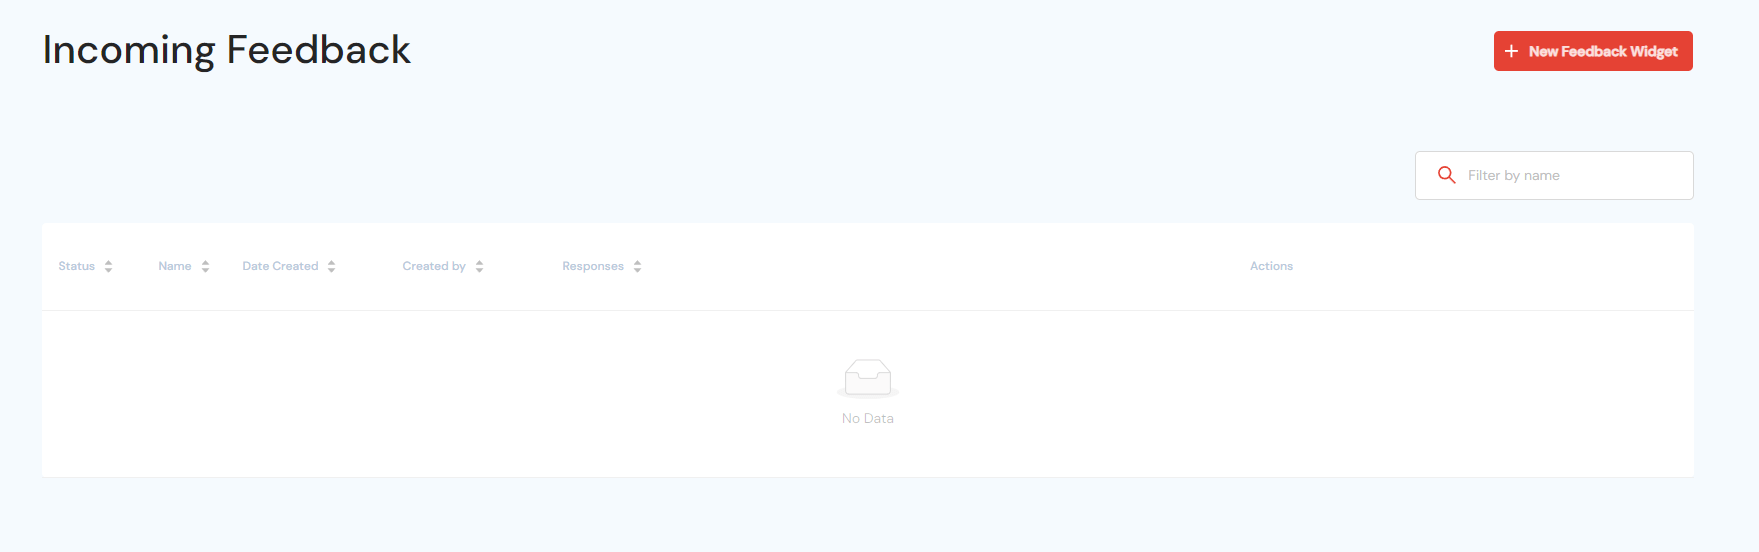
- Click the + New Feedback Widget button
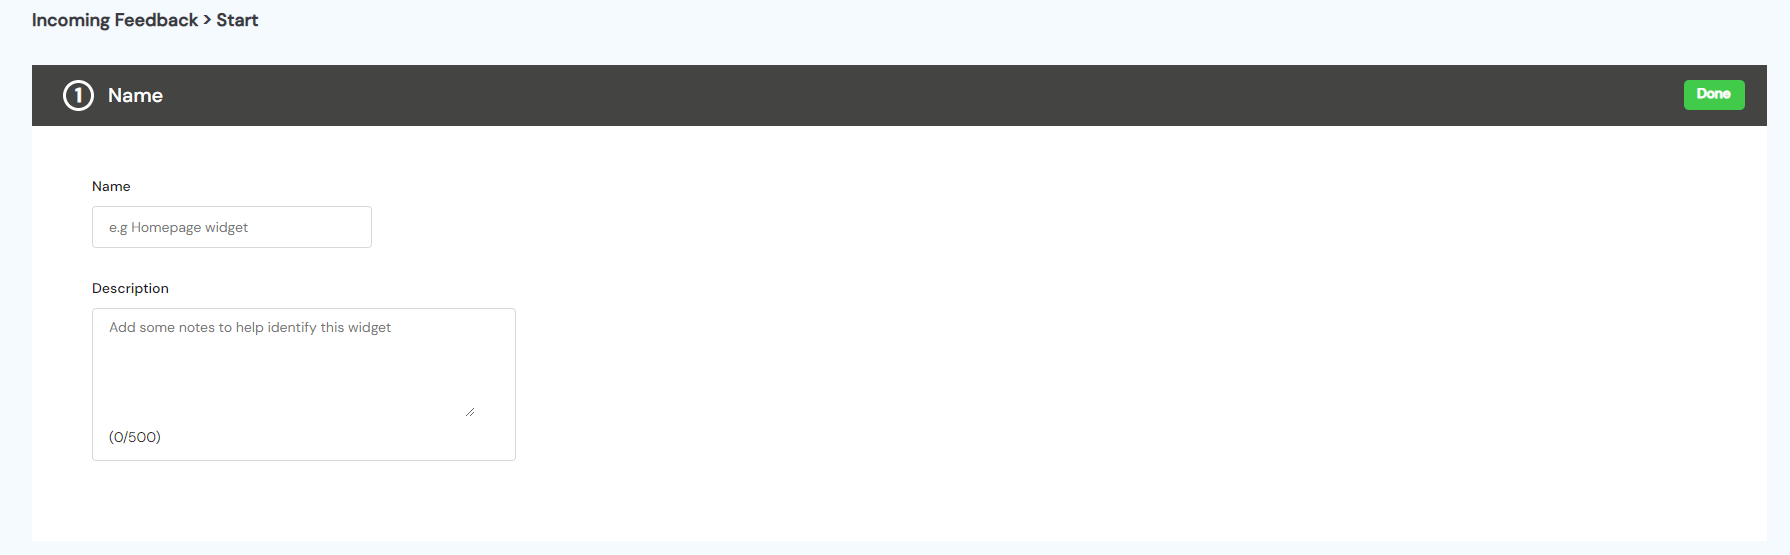
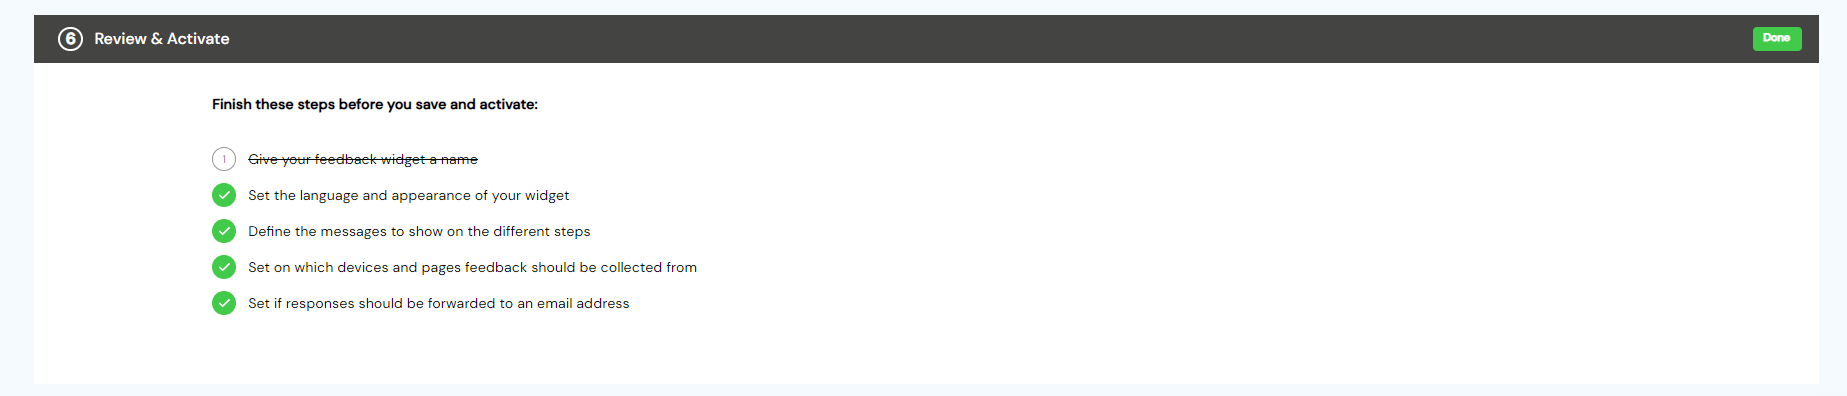
- Enter all the required information.
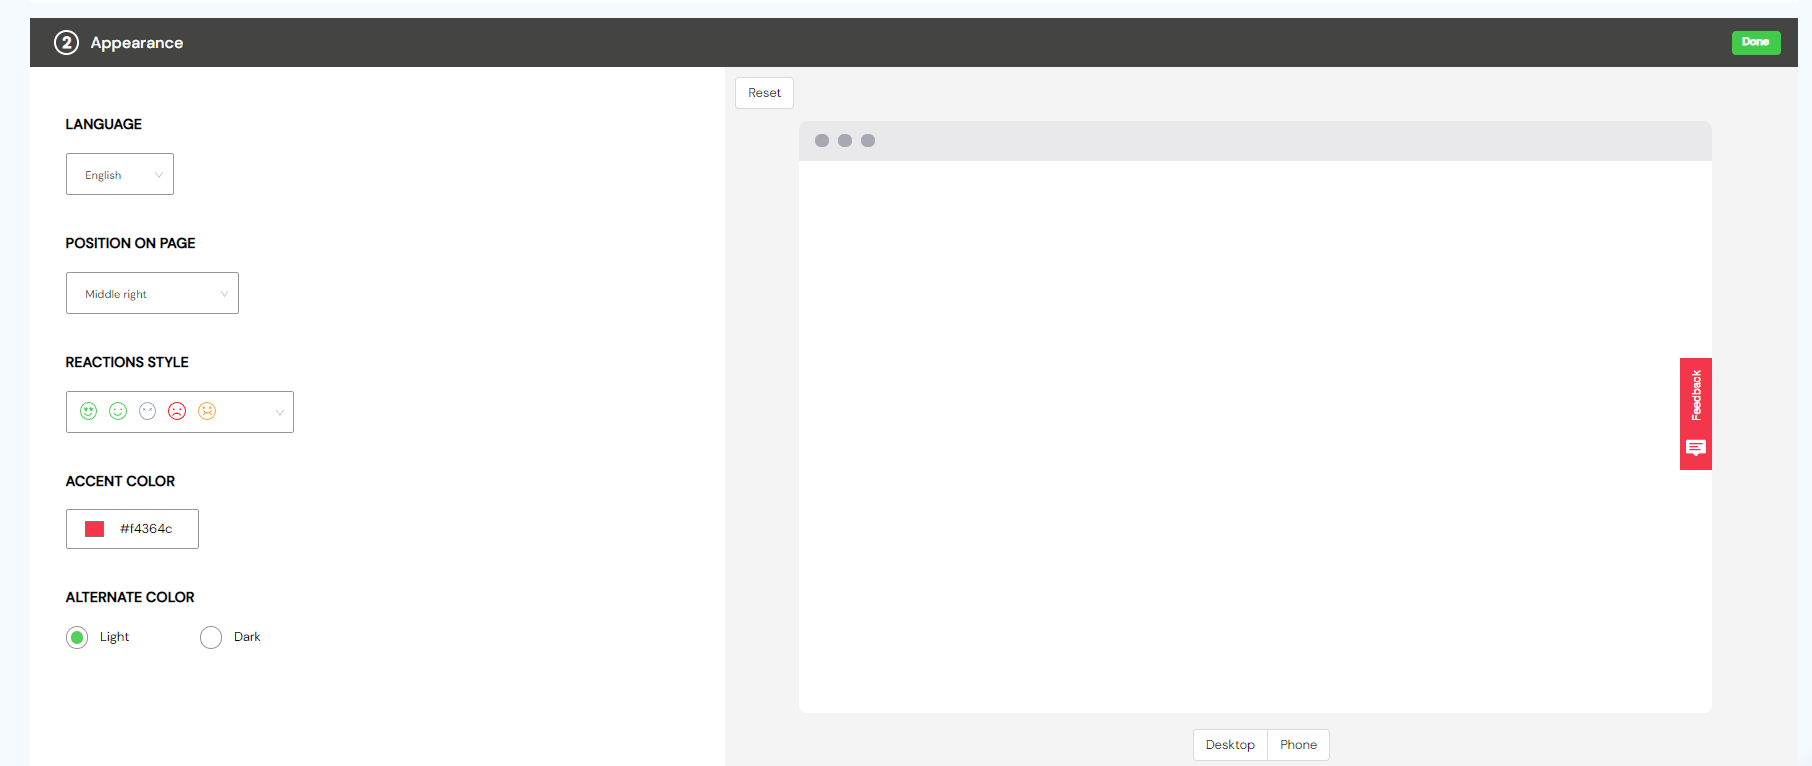
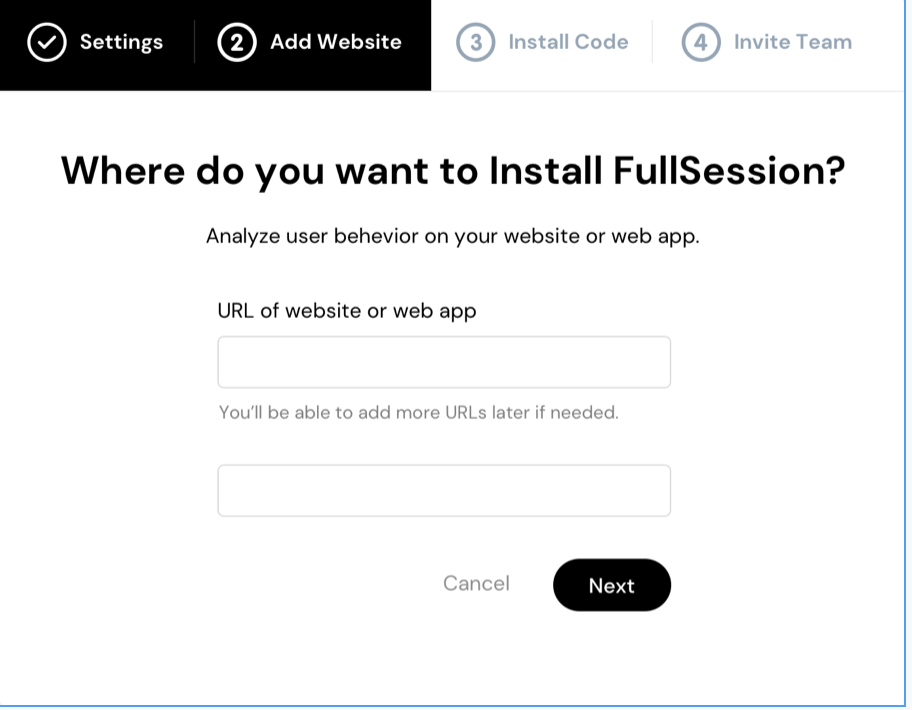
- Choose the appearance
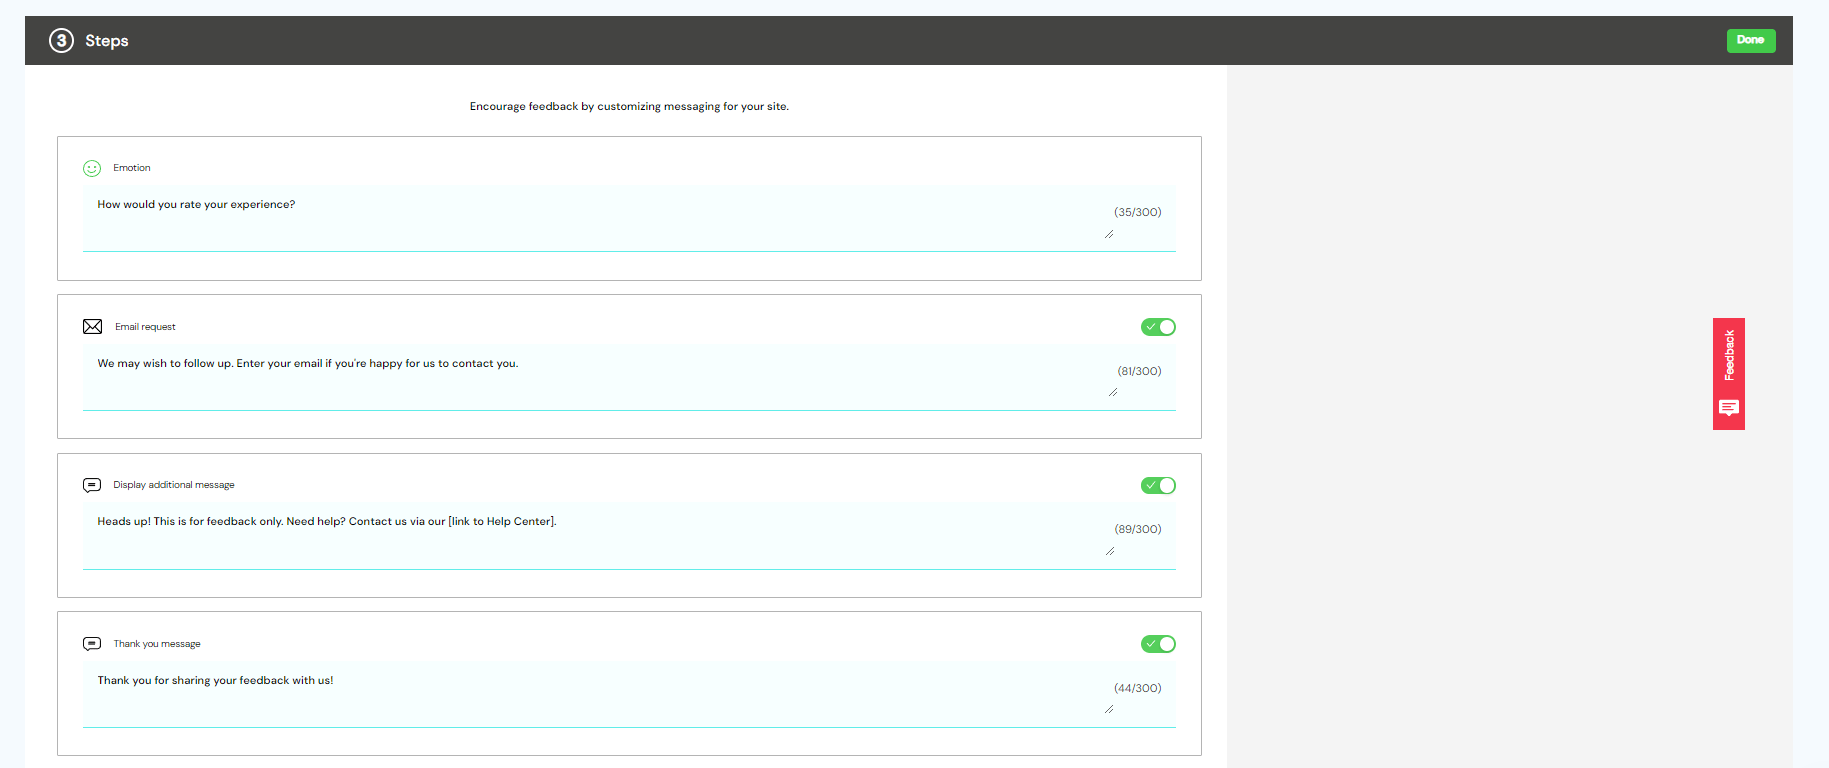
- Define the steps of the feedback process
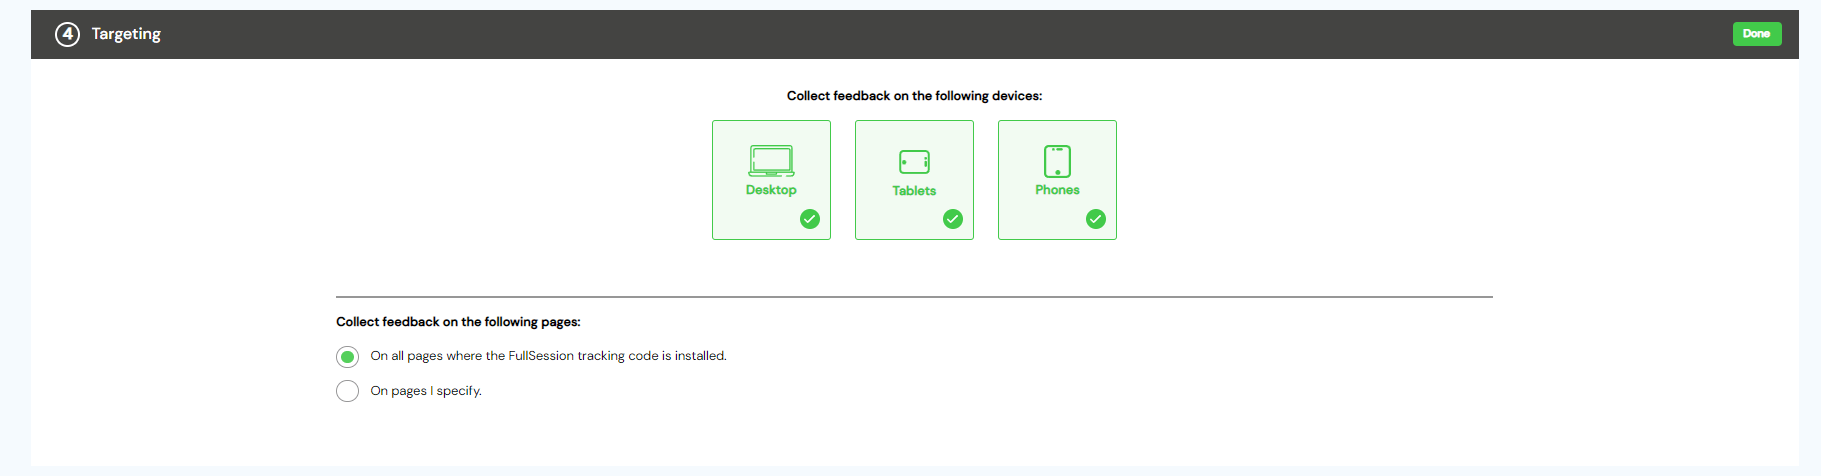
- Specify the website pages you want to display the forms
- Select devices to show website feedback forms
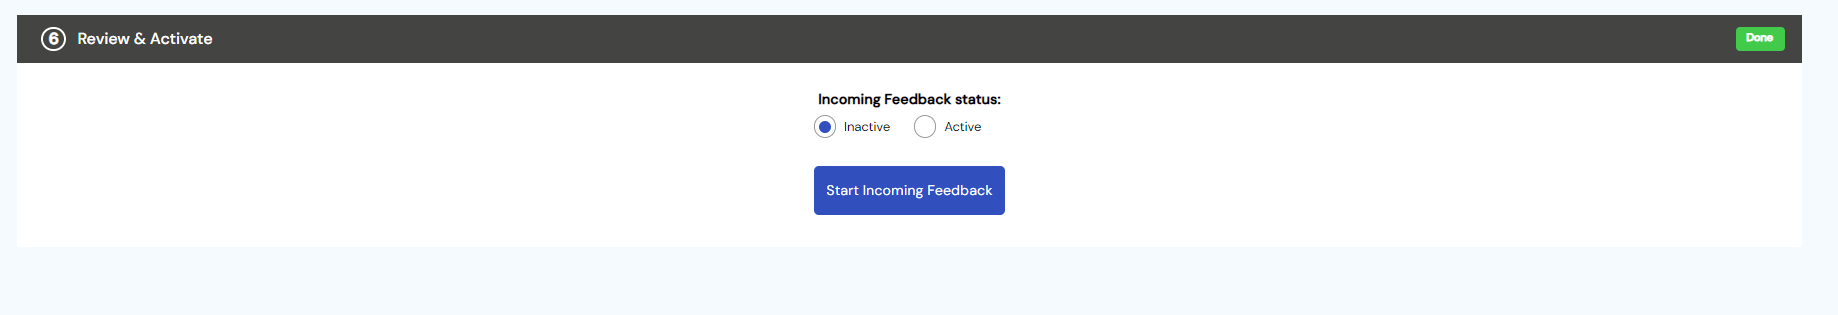
That’s it. Users should now see your feedback form. You can also send data directly to your e-mail.

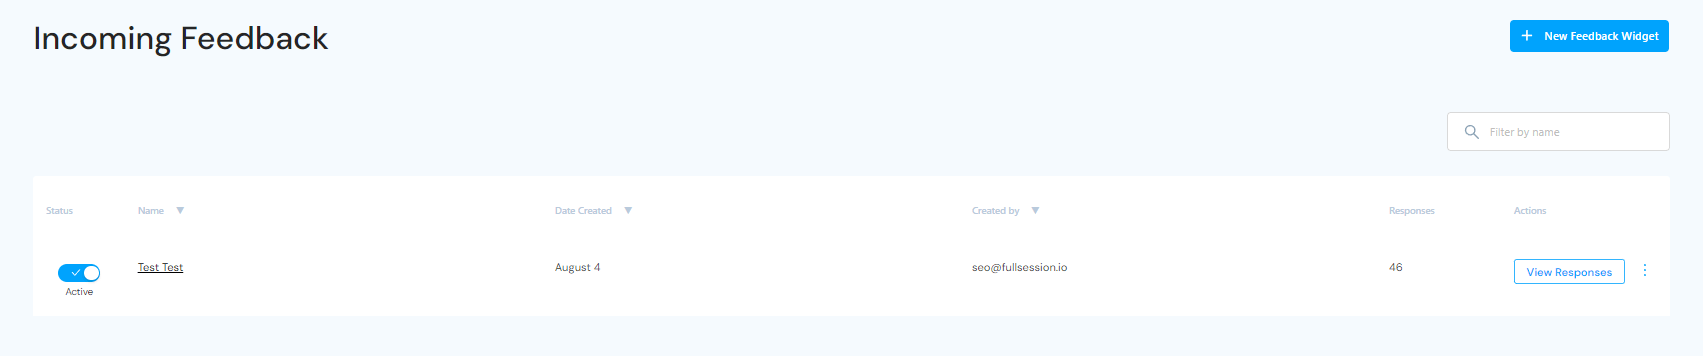
The Feedback tab on our dashboard provides information regarding each entry, such as name, author, date of creation, number of responses, and activity status.
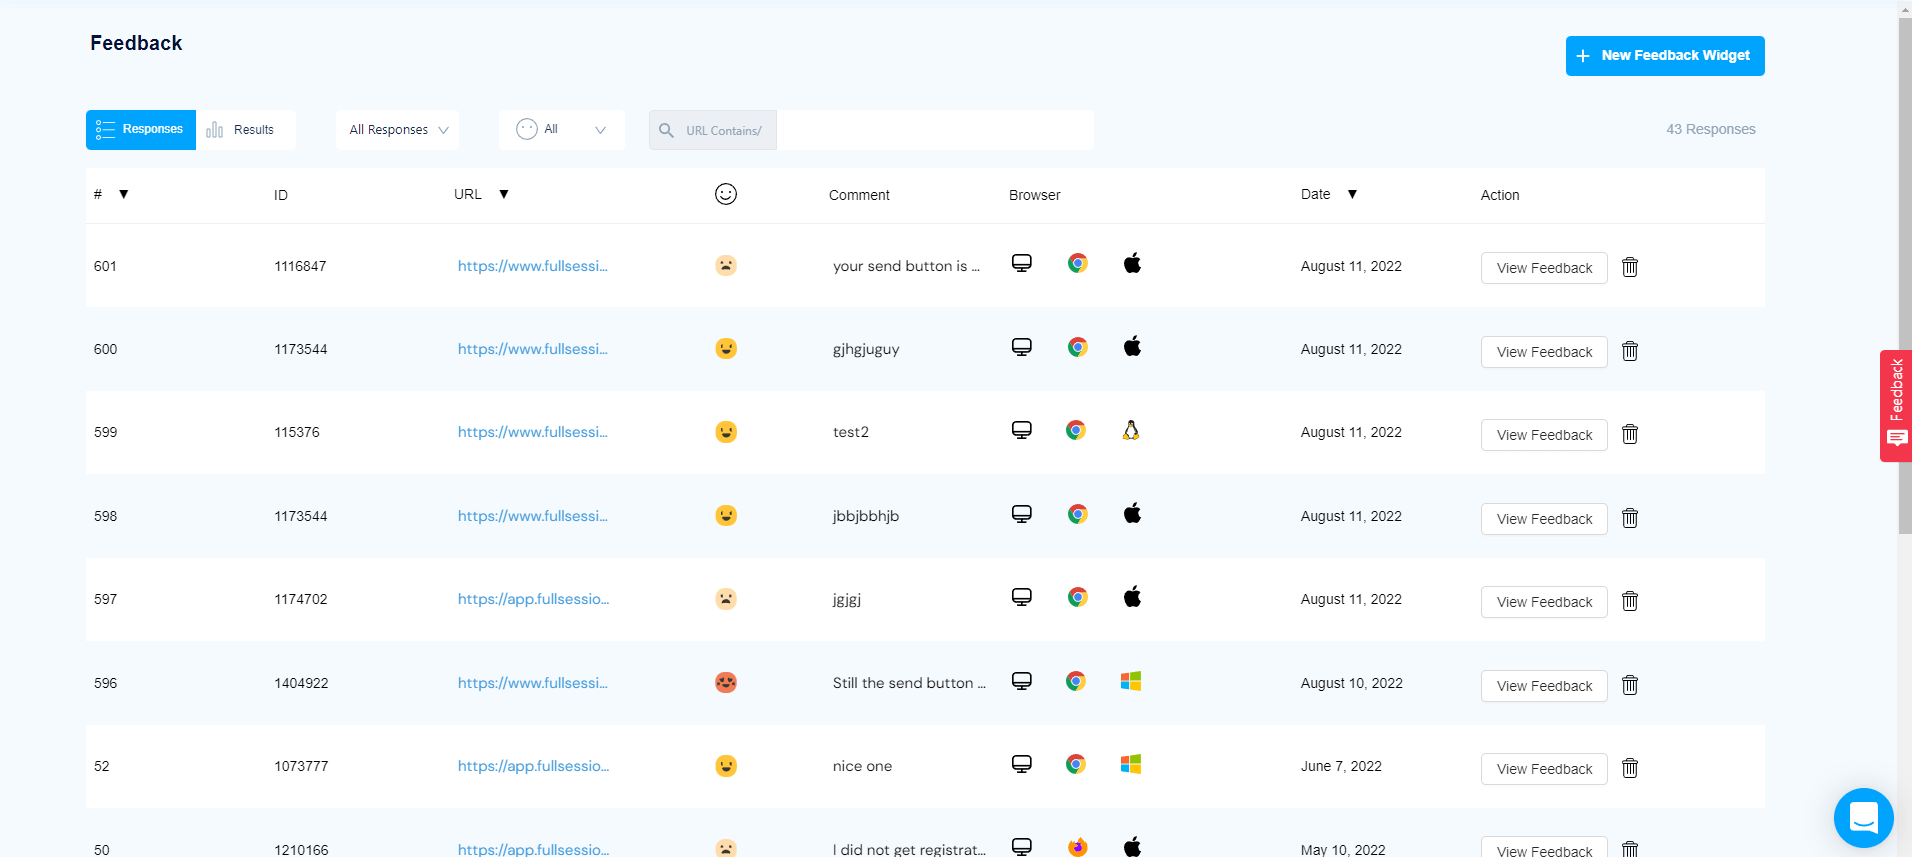
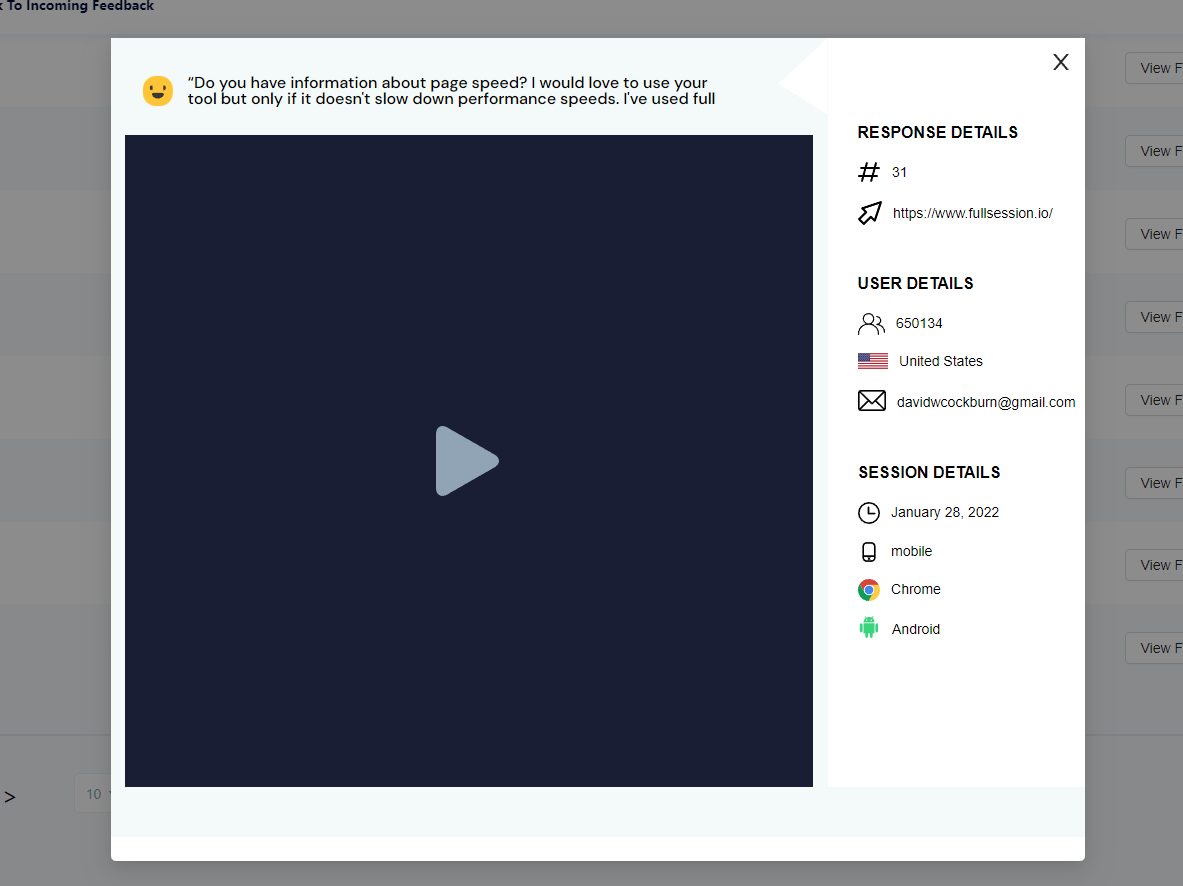
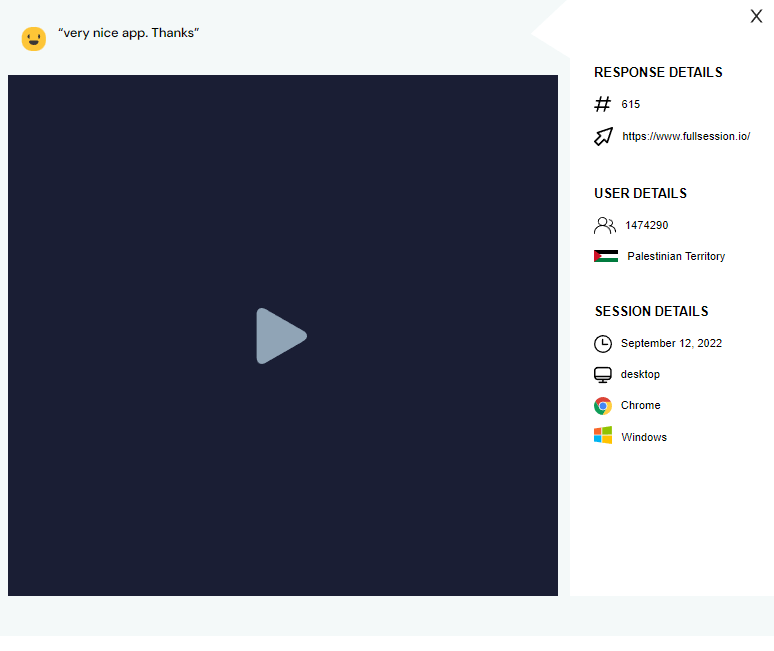
On the rightmost tab, Actions, you can click a link to view each response. When you follow it, you’ll also get more details about these entries:
- The page URL
- Date
- The browser used by the person
- Form’s ID
- User sentiment (rating)
- User comments
Website feedback forms and session recordings
The customer feedback tools offered by FullSession provide additional context for session recordings. Users describe their problems, which helps you understand what you see on the screen when you watch a video. You can find recordings directly on the Feedback tab, so everything is easy to follow.
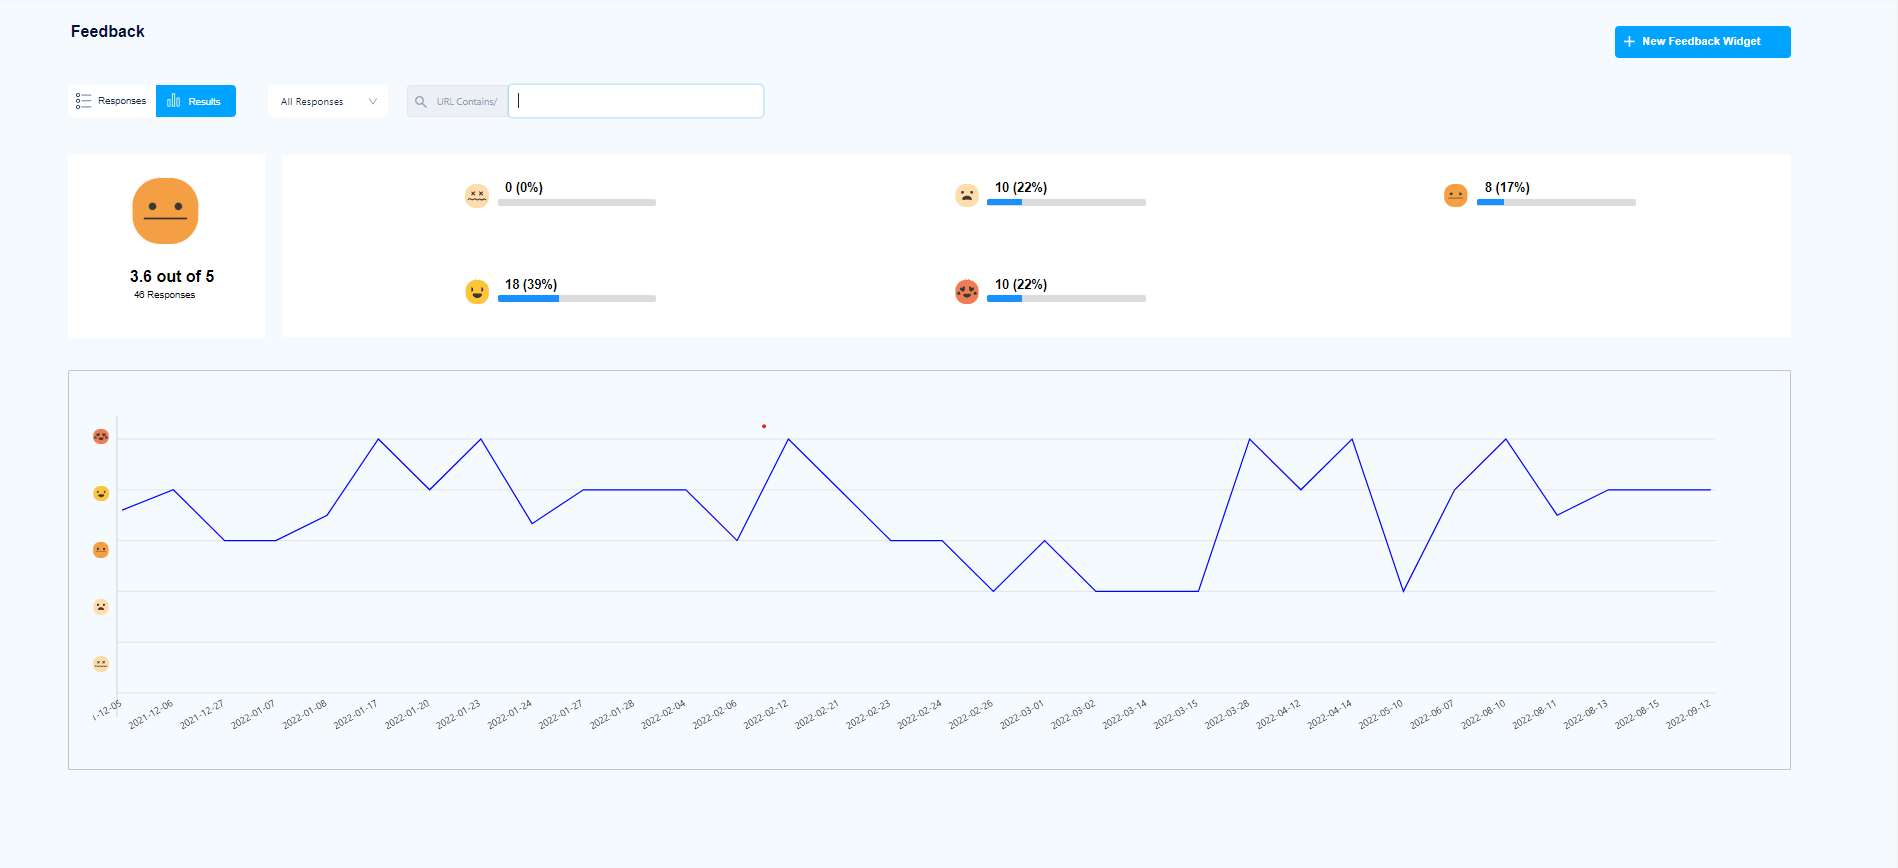
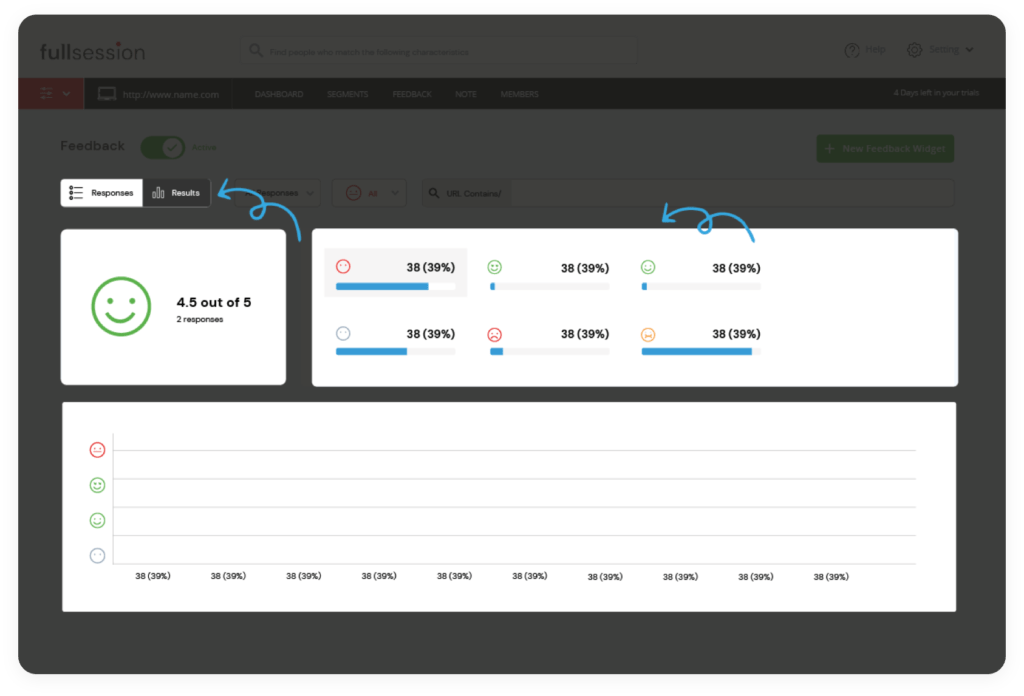
Customer feedback reports
Our Results tab provides an overview of all customer feedback entries. You can specify the time and view any customer feedback report you want. The graph shows the results you got on specific dates, along with ratings.

Notes
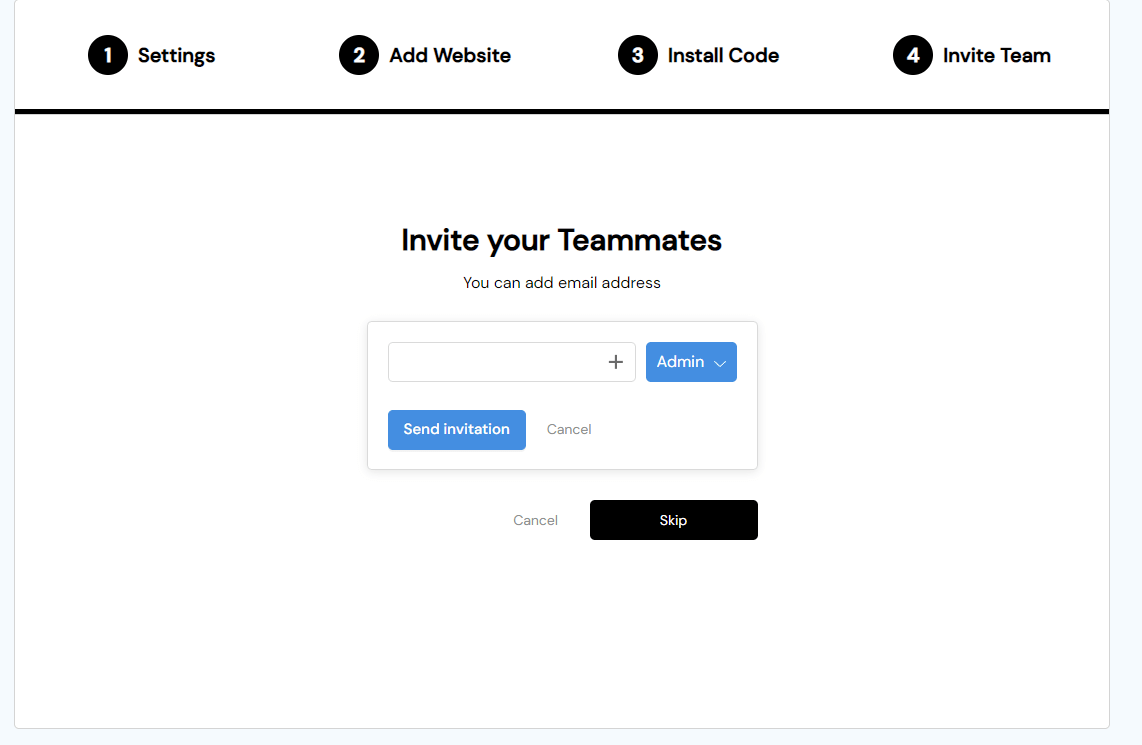
We created FullSession for cross-functional teams. Various specialists can use FullSession, so sharing insights is essential. We’ve made it easy by giving you the option to create notes that different groups and individuals can see. It’s a handy way to share your findings and considerably improves team cooperation.
Conversions
You can use FullSession to track conversion rates through statistics such as time to convert or the percentage of converted users.
As you can see, our platform can be immensely helpful when you have a digital product and are interested in tracking various metrics.
Product metrics: Summing up
Just as there are different ways to track your business success, there are numerous ways to track your product performance.
You can choose among many metrics. You can track retention rates, churn rates, and use a web analytics platform that helps you better understand your product performance, growth, or trends.
Regardless of what type of product, service, or company you’re in, it’s essential to have an effective tracking system in place, and our FullSession can help you with that. You can use it to view session recordings and analyze interactive heatmaps to see what drives users to your product and pushes them away. You can also measure many aspects of your business by connecting directly with your users through customer feedback forms.
Our platform will help you identify issues and provide the data you need to improve customer satisfaction. If you want to check FullSession out, you can create an account and start a 14-day free trial. You can also contact us right now to get a demo.
Product metrics: FAQ
Here are answers to some questions regarding product metrics you can find on the Internet.
What are the product metrics?
Product metrics are data points that help you optimize your product. They allow you to understand how your product is performing and whether it is meeting the needs of your users. You can use them to evaluate different aspects of your product, including sales volume, conversion rates, engagement, and retention.
What are the 5 most important metrics for the performance of the product?
Here are five metrics that are incredibly important for digital products:
- Bounce rate
- Retention rate
- Net promoter score
- Customer satisfaction score
- Recurring revenue
What are the 4 types of metrics?
You can divide product metrics into the following categories:
- Sales metrics
- Conversion metrics
- Engagement metrics
- Retention metrics
How do you find product metrics?
The best way is to use specialized web analytics or product analytics platform such as our FullSession – it gives you easy access to valuable data. To use FullSession, start your 14-day free trial.