.svg)
.svg)

Time to Value (SaaS): How to Measure and Shorten TTV


The moment a customer starts using your SaaS product, the clock starts ticking. Every hour without a real result is an hour closer to cancellation, and that window is one of the most underestimated levers in your retention strategy.
Time to value (TTV) in SaaS is the elapsed time between a user’s first product interaction and the moment they reach their first meaningful outcome: the specific in-product result that proves the product does what they signed up for.
Get it right and you activate new customers faster, reduce early churn, and build loyalty that compounds. Get it wrong and you lose users before your customer success team notices the problem.
This guide covers what TTV means, how to calculate it, which metrics to track, and how to use FullSession’s behavioral data to find and fix the friction blocking your users from reaching value.To see exactly where your users stall, book a FullSession demo and we’ll show you.
Key Takeaway
- Time to value SaaS (TTV) measures the gap between sign-up and the moment a user gets a result they actually care about. The shorter it is, the higher your retention.
- Mapping your customer journey to first value before making any changes ensures you fix the right steps, not just the most visible ones.
- Visual behavioral data (session replay, heatmaps, and funnel analysis) tells you why users drop off, not just where. Numbers alone can’t give you that.
- The 30-60-90 plan gives SaaS teams a structured, evidence-based way to diagnose friction, test one fix at a time, and scale what works.
- Faster TTV doesn’t just improve activation. It compounds across retention, word-of-mouth, and trial-to-paid conversion, making it one of the highest-leverage metrics in your entire growth stack.
Most SaaS teams know their TTV is too long but can’t pinpoint why. FullSession closes that gap by combining session replay, visual heatmaps, funnel tracking, error analysis, and contextual feedback in one platform.
It gives you the exact behavioral evidence you need to find friction, prioritize fixes by revenue impact with Lift AI, and confirm improvements hold across cohorts. It’s the diagnostic layer that turns TTV from a number you track into a metric you can actually move.
What Time to Value Means for SaaS

Understanding time to value (SaaS) starts with a precise definition and a formula you can actually track.
Time to value (TTV) measures the gap between two events: the moment a user starts using your product and the moment they get a result they actually care about.
TTV = Date of First Value Moment − Date of Sign-Up
Defining “first value moment” is where most teams trip up. It’s not logging in. It’s not finishing the onboarding checklist. It’s the specific outcome that proves the product works: sharing the first workflow for a project management tool, or generating the first report that changes a decision for an analytics platform.
Your users don’t care about your features. They care about their outcomes. TTV is the distance between those two things.
Types of TTV in SaaS
TTV Type |
When It Applies |
SaaS Example |
|---|---|---|
Immediate Time to Value (ITTV) |
Users get instant value in their first session or before sign-up |
An interactive demo that lets prospects try the core feature before creating an account |
Time to Basic Value / First Value |
Users get the most fundamental benefit quickly, even if full value comes later |
A reporting tool where a user generates their first data visualization in session one |
Long TTV |
Complex products with complex integrations where full value requires significant setup |
An ERP system that delivers measurable ROI weeks after implementation |
Three TTV types matter for SaaS teams:
For most SaaS businesses, immediate time to value is the goal. When product complexity rules that out, the strategy shifts to quick wins early and a carefully managed journey through to full value.l. The funnel is where unit economics are won or lost.
Map the Customer Journey to First Value
Mapping the customer journey before optimizing means you fix the right steps, not just the most obvious ones.
Start by defining your value event: the single in-product action most strongly correlated with long-term retention. Then trace every step a new user must complete to reach it.
A standard first-value journey
- Sign-up and email verification
- Profile or account setup (name, company, role)
- Core configuration step (connecting an integration, importing data, or inviting a teammate)
- First key action (the step that directly produces the value event)
- Value confirmation (the user sees or receives the outcome)
Segment it after you’ve mapped it. A solo founder and a five-person product team use the same tool very differently. Tailor onboarding experiences to each segment and customers reach their first value faster than any generic flow allows.
The step with the highest drop-off rate is your biggest TTV opportunity. Use onboarding funnel analysis to make that step visible before guessing at the fix.
Assign a Customer Success Manager for High-Touch Accounts
For enterprise accounts and complex products, a dedicated customer success manager removes blockers before they become churn signals.
The CSM’s job in the first 30 days isn’t to check in. It’s to understand the customer’s specific value goal and clear every obstacle between sign-up and achieving it. A good CSM confirms what “value” means to each account, finds quick wins early, and catches technical blockers before customers get frustrated.
Most SaaS businesses can’t assign a CSM to every account. The practical approach is to use behavioral data to identify which new clients are stalling, then trigger high-touch intervention for those accounts only.
Your customer success team spends time where it matters most, and customers reach meaningful value without unnecessary delays.y.
Measure Time to Value TTV
Measuring TTV starts with defining two events: when a user begins and when they first succeed.
Once those events are defined, measuring TTV is straightforward. The diagnostic work happens between those two points.
Calculate time and calculate TTV
- Define your start event. This is typically the sign-up timestamp or the first login, depending on whether your onboarding process begins before or after account creation.
- Define your value event. Choose the specific in-product action most predictive of long-term retention. If you’re unsure, run a cohort analysis: which users who performed action X in week one showed the highest 90-day retention?
- Measure the gap. TTV = Date of Value Event − Date of Start Event. Calculate this for every user and average across cohorts.
- Track changes over time. After each onboarding improvement, measure the delta in average TTV. A drop means the change worked.
Metrics and dashboards to track TTV
Your TTV dashboard should track these SaaS metrics:
- Average TTV and median TTV by user segment and acquisition channel
- Onboarding funnel drop-off rate at each step
- Activation rate: the percentage of new users who reach the value event within a defined window
- Early churn rate: users who cancel within 30 days of sign-up
- Time to first login and time to first key action
FullSession, our behavioral analytics platform for SaaS teams, maps these metrics directly onto session and funnel data.
The funnel tracking and conversion analysis feature shows conversion rates at each onboarding step, the exact drop-off points, and cohort-level TTV trends without manual aggregation.
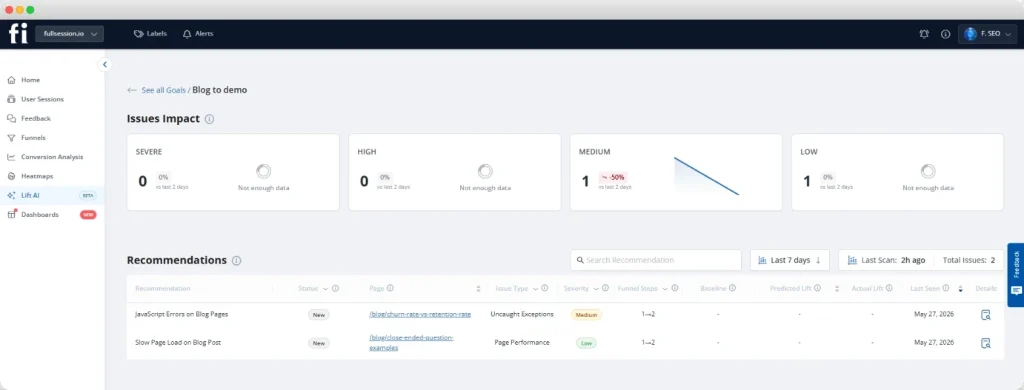
The Lift AI prioritization engine scans all session and funnel data and ranks friction points by predicted revenue impact, so your team knows which fixes will move the needle most.
Once you ship a change, Lift AI also lets you validate the actual impact against the prediction, closing the loop between diagnosis and result.
See It All on a Live Demo
Watch how FullSession shows onboarding friction, ranks fixes by revenue impact, and shows you exactly where users stall.
Use Session Replay, Heatmaps and Funnels to Cut TTV
Numbers tell you where users drop off. Visual behavioral data tells you why.
FullSession’s TTV diagnostic stack combines five tools: session replay, visual heatmaps, funnels, error analysis, and contextual feedback. Together, they give your team the evidence to find and fix onboarding friction without guessing.
Actionable session replay

FullSession’s session replay lets you watch exact user sessions from the critical first login. Filter for new users and watch for patterns numbers can’t show: cursor hesitation before a key button, repeated clicks on a non-interactive element, a form field abandoned mid-entry.
Watching the first five to ten sessions reveals friction fast. You’ll know within an hour which step is causing confusion and what the user was actually trying to do.
Visual heatmaps
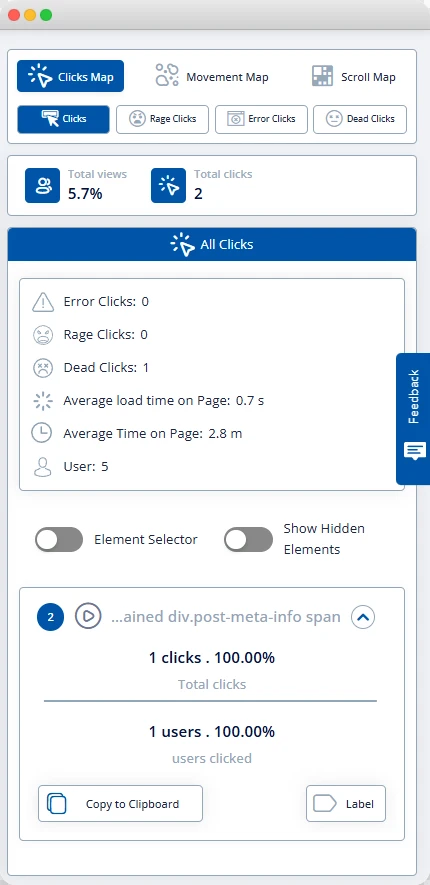
Visual heatmaps filtered to new users show whether your core features and value-driving buttons are getting the attention you designed them for. If the primary onboarding action button shows low click density, the layout is slowing users down.
For SaaS teams using heatmaps to improve SaaS activation, the fix is almost always a layout adjustment, not a product overhaul.
Funnels and error analysis
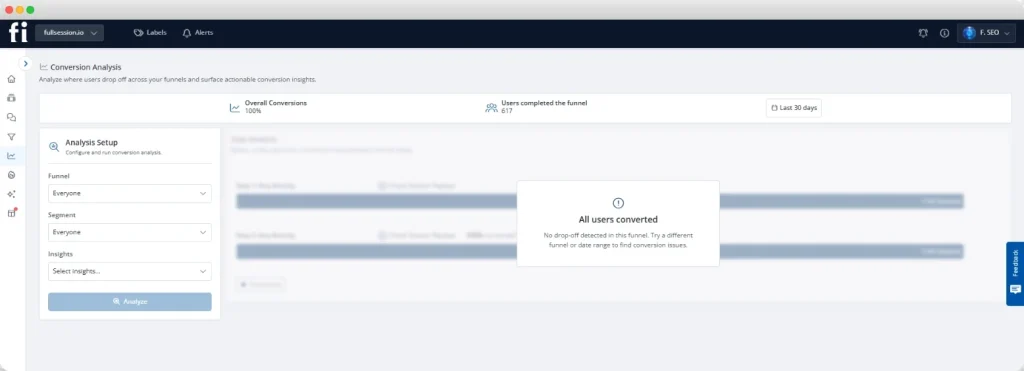
Build an onboarding funnel that maps every step from sign-up to your value event. The step with the steepest drop-off is your priority.
Error and alert monitoring shows JavaScript errors and broken flows that block users silently, including bugs that never generate a support ticket because users give up and leave.
Contextual feedback

FullSession’s in-app feedback surveys deploy at the exact moment a user pauses or stalls. One well-timed question, “What stopped you from completing this step?”, gives direct answers no replay can provide. The answers cut diagnostic time from weeks to days.
Start Diagnosing Your Onboarding Friction Today
Connect your onboarding flow in minutes and start watching real user sessions. No credit card required.
Improve Product Usability to Shorten Time to Value
Product usability problems are the leading cause of long TTV, and most are fixable without a full product rebuild.
Users don’t struggle because they lack intelligence. They struggle because the path to value wasn’t designed with their mental model in mind.
Four changes move the needle fastest:
- Remove Day 1 friction. Complex integrations, billing setup, and team configurations don’t need to happen in the first session. Strip the onboarding process to the minimum required to reach first value. Every extra step increases TTV and drop-off risk.
- Use progressive disclosure. Show users only what they need to reach basic value in session one. Show new features after the aha moment. Users who aren’t overwhelmed early are far more likely to explore deeper functionality later.
- Add in-app checklists. Users expect a clear path, not an empty interface. A visible checklist of steps to first value reduces cognitive load and creates a sense of progress, so customers reach their expected value faster.
- Design quick wins. Build one action into the first session that delivers instant value. This gives users a concrete reason to return before they’ve decided whether the product is worth keeping.
Diagnose mobile usability gaps with FullSession
Mobile SaaS products face the same usability challenges, but they’re harder to spot with desktop-only analytics. Taps, swipes, and screen transitions behave differently from mouse interactions, and standard funnels don’t capture what happens between steps.
FullSession’s mobile session replay reconstructs real user sessions inside your mobile app: every tap, swipe, screen change, and error state.
Filter by new users, watch sessions where someone stalled before a key action, and identify the exact screen blocking first value.
It’s the same diagnostic workflow as desktop, applied to the mobile onboarding experience where product improvements often carry the largest untapped TTV impact.
How Faster TTV Drives Customer Retention
Shorter TTV directly predicts retention. Users who reach value quickly stay. Users who don’t are already drifting toward churn.
Here’s what the data shows and why each signal matters for your business.
Signal |
What It Means for TTV |
|---|---|
Over 20% of voluntary SaaS churn is linked to poor onboarding (SERPsculpt) |
Most of that churn is preventable if customers reach meaningful value in session one |
43% of SMB SaaS losses happen in the first 90 days (Focus Digital) |
The onboarding window is where retention is won or lost for SMB accounts |
Users who reach value fast feel confident in their choice |
Customer satisfaction correlates directly with how quickly users experience expected value |
Users who struggle develop doubt |
Doubt formed in the first week is very hard to reverse, even with strong support |
Reducing TTV by even a day or two shifts trial-to-paid conversion rates, helps increase customer satisfaction, and lowers customer frustration during the period when customer expectations are highest.
For SaaS teams that rely on product-led marketing strategies, shorter TTV is also the most direct path to word-of-mouth growth: users who reach value fast become advocates.
How many users are you losing before they ever reach value? FullSession’s user onboarding analytics solution makes that number visible and specific.
Use Experimentation Playbook to Reduce TTV
TTV improvement is a repeatable loop that compounds over time.
Here’s the six-step cycle that SaaS teams use to reduce SaaS TTV systematically and build a library of product improvements that hold across cohorts:
- Baseline measurement. Calculate your current average TTV across all new users. Segment by user type, company size, and acquisition channel. Different user segments have different aha moments.
- Identify the highest drop-off step. Find the step with the largest gap between users entering and users proceeding. That’s your first target.
- Form a hypothesis. For example: “Removing the billing setup step from the first session will reduce TTV by 20% for SMB accounts.” Keep it specific and measurable.
- Run the change. Apply the fix and capture session replays and funnel data for the new cohort alongside the control group.
- Measure the delta. Compare average TTV for the test cohort against the baseline. If it drops, ship the change. If it doesn’t, use the replays to identify patterns and form the next hypothesis.
- Document and iterate. Real-world examples of what reduced TTV for your product become the foundation of every future onboarding improvement.
Session replay’s main role in this cycle is evidence: replacing assumptions with observed behavior at each step of the loop.
Start a 30-60-90 Plan to Shrink Time to Value
New to measuring TTV? This three-phase sprint gives your team a structured starting point.
Phase |
Days |
Focus |
FullSession Action |
Success Signal |
|---|---|---|---|---|
Diagnose |
1-30 |
Measure current average TTV, map the journey to first value, watch 20 first-session replays, build the onboarding funnel |
Session Replay + Funnels |
TTV baseline established, top 3 friction points documented |
Fix |
31-60 |
Address the single highest drop-off step, add contextual feedback at the stall point, A/B test the change |
Error Analysis + Feedback + Heatmaps |
Average TTV drops by a measurable amount |
Scale |
61-90 |
Prioritise remaining friction, segment TTV by user type, document the playbook, report results to leadership |
Lift AI + Funnels |
Scaled onboarding improvements, TTV tracked in dashboard |
The 30-day phase is diagnostic only. Don’t change anything until you know what to change. The 60-day phase targets one problem at a time, because changing multiple steps simultaneously makes it impossible to know what worked.
By day 90, you have a documented, evidence-based playbook that applies to every new onboarding flow you ship.
Your Onboarding Playbook Starts With One Demo
See how FullSession’s session replay, heatmaps, and funnel analysis give you the diagnostic data to run every phase of this plan.
Report and Scale TTV Improvements
Measuring TTV once isn’t enough. Sustained shorter TTV comes from building measurement into your regular reporting rhythm.
Track it weekly. Add average TTV and median TTV to your team dashboard alongside MRR and churn. When TTV regresses after a product update, you catch it fast.
Find patterns in cohorts. Which acquisition channels show consistently longer TTV? Did a recent product change slow down the configuration step? Cohort analysis at the session level turns the TTV metric from a number into a diagnostic tool. Measuring TTV across cohorts over time also helps you identify patterns early, before they show up in churn data.
Make the evidence visible. Share session replay findings with your product team when prioritising the roadmap. Showing a product manager five replays of users failing at the same step is more persuasive than a drop-off percentage alone. Visual evidence drives product improvements faster than any spreadsheet.
Validate improvements hold. Use the heatmaps vs session replay combination to confirm that onboarding changes are holding across new user batches, not just the initial test cohort.
Connect TTV to revenue. Link your average TTV trend to trial-to-paid conversion rates and early churn reduction. Those are the numbers that shift roadmap priorities and justify investment in new software for onboarding analytics.
Conclusion About Time to Value (SaaS)
TTV isn’t just a metric for new software teams to track. It’s the clearest signal of whether your product is keeping its promise to new customers.
Shorter TTV means more paying customers who stick around, a stronger customer experience from day one, and a feedback loop that continuously improves how you provide customers with value.
The SaaS companies that consistently hit lower TTV share one practice: they watch their users. They don’t rely on aggregate numbers. They look at real sessions, real friction, and real evidence.
FullSession, the behavioral analytics platform for SaaS teams, gives you session replay, heatmaps, funnels, error tracking, and contextual feedback in one place. Everything you need to find what’s blocking first value and fix it before it becomes churn.
Start Diagnosing Your Onboarding Friction Today
Connect your onboarding flow in minutes and start watching real user sessions. No credit card required.
FAQs About Time to Value (SaaS)
Time to value in SaaS is the elapsed time between a user’s first product interaction and their first meaningful outcome: the specific in-product result that proves the product delivers on its promise.
TTV = Date of First Value Moment − Date of Sign-Up.
Activation means a user completed a defined setup action. TTV measures when they actually felt the product’s benefit.
Remove non-essential steps from the onboarding process, add in-app checklists that guide users to the value event, watch session replays to find where new users stall, and fix the funnel step with the highest drop-off rate.
Immediate time to value (ITTV) is a sub-type of TTV where users experience value during their first session or before they sign up, for example through a free version or interactive demo.
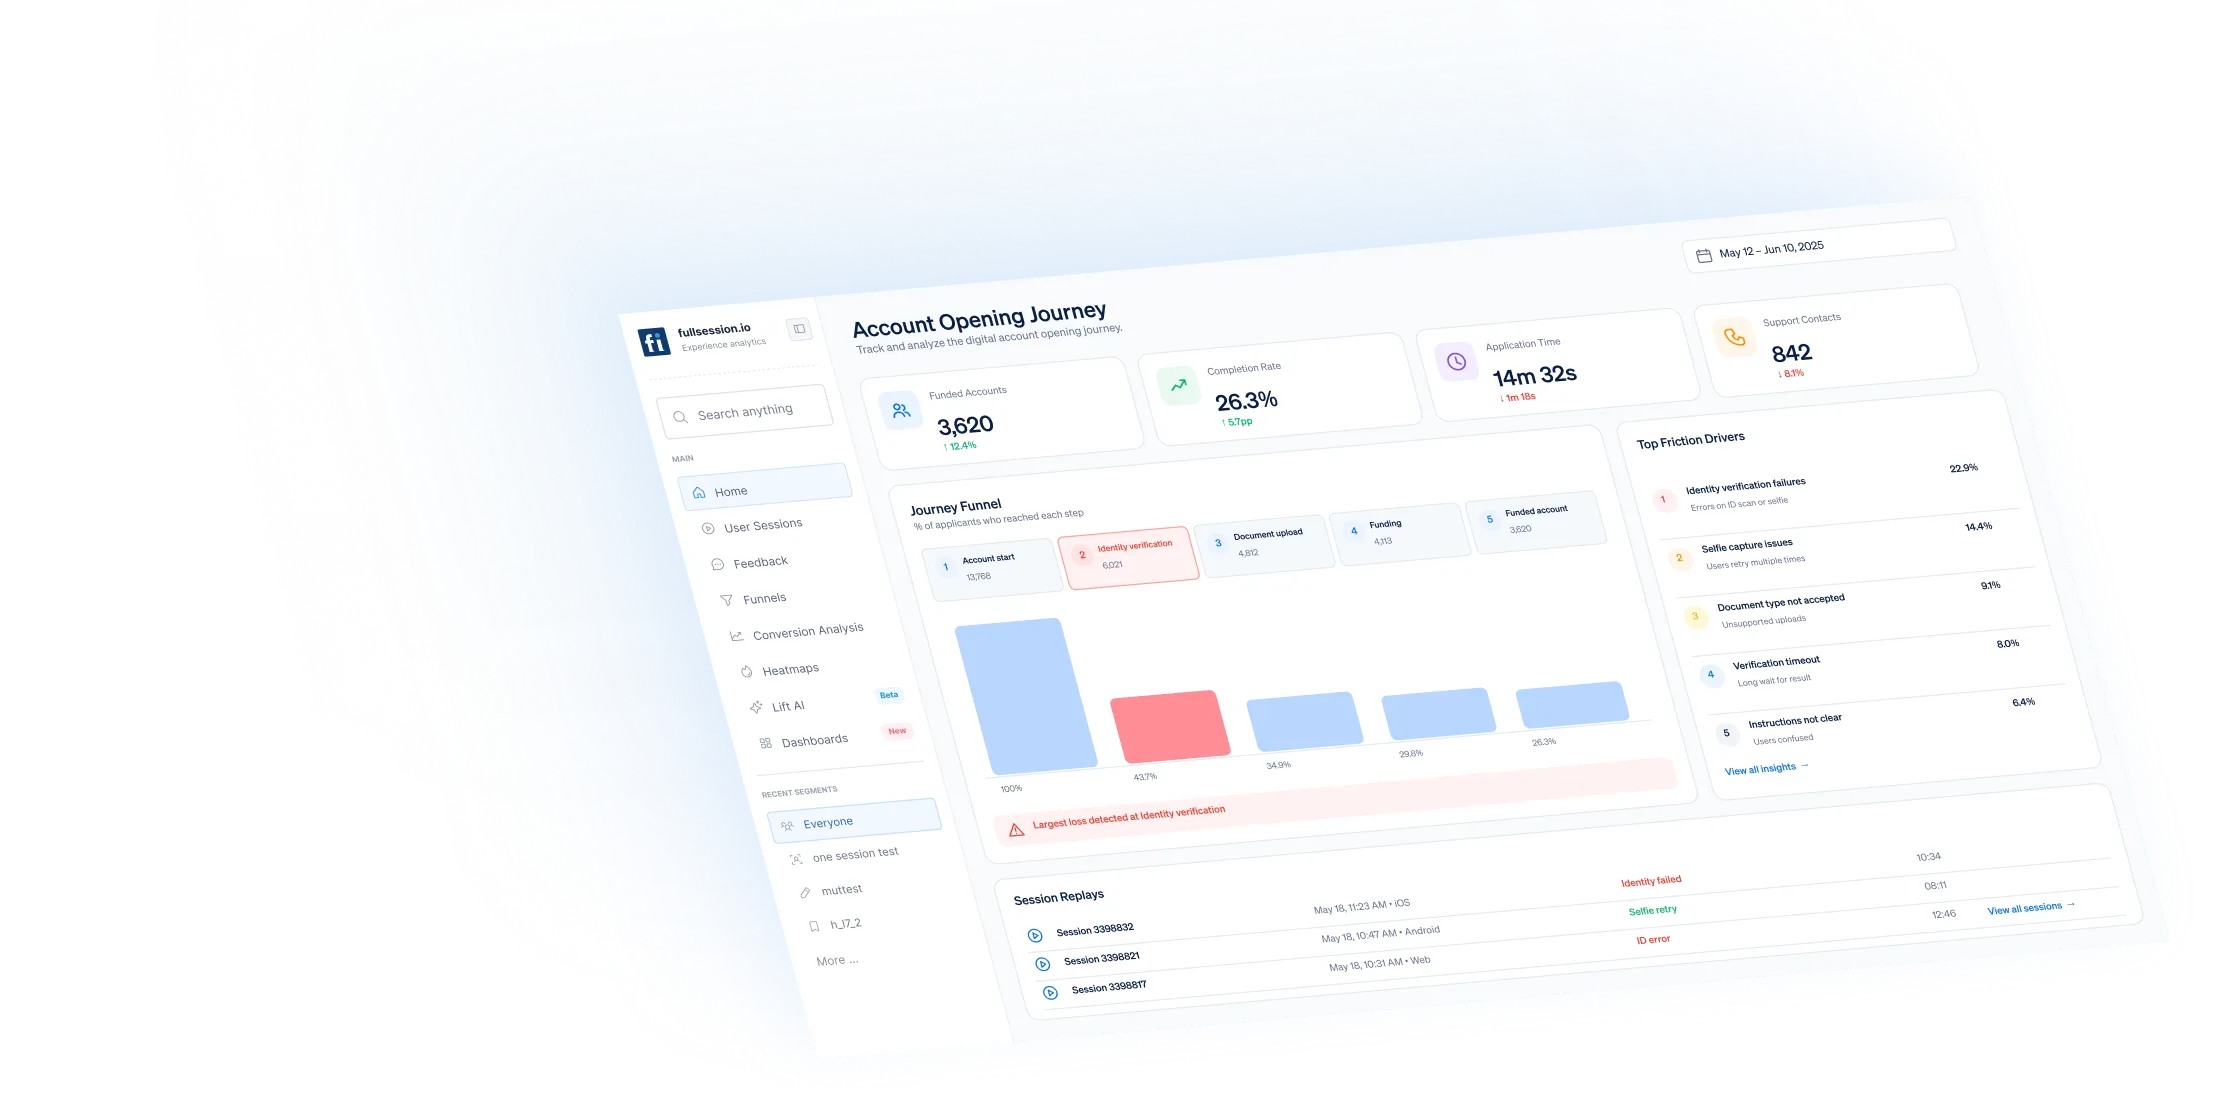
See what’s costing you, and prove whats fixing it is worth
Watch the real journey, rank every issue by revenue impact, and validate the result against baseline.




.svg)



All systems operational.