Solution · Product Management
Product analytics tools to boost Week-1 activation
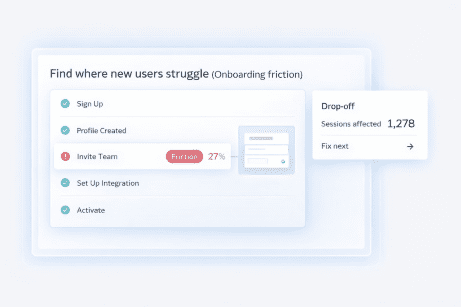
See exactly where new users get stuck in onboarding, understand which actions define activation, and fix Week-1 friction without waiting on heavy analytics setup.

Watch real onboarding sessions to see where users hesitate, rage-click, or abandon.
Understand which actions and features correlate with Week-1 activation and early retention.
Give PMs fast answers to activation questions without a long instrumentation backlog.
See Week-1 onboarding funnels and real user sessions in one place.


OUTCOMES
Understand Week-1 behavior, not just Week-1 metrics
FullSession helps product teams see why new users fail to activate — and what to change first.
Higher Week-1 activation
Identify the exact steps where new users stall in onboarding and make targeted improvements that help more of them reach their first value moment.
Faster time-to-aha
See which actions truly define activation in your product so you can guide users to them sooner with better flows and in-product prompts.
Less early churn
Catch friction and confusion in the first few sessions and fix them quickly, instead of discovering the problem after users churn.
First 7 days Product Management Playbook
Day 1: Pick one “Week-1 activation” question (e.g., why users don’t reach first value) and define the success action.
Day 2: Create a Week-1 funnel from signup → onboarding → first value; baseline by cohort/source/plan.
Day 3: Pull the top 2 drop-off steps; watch sessions to identify the most common UX/flow breakdown.
Day 4: Create a small, testable fix list (max 3) tied to the breakdown patterns you observed.
Day 5: Ship 1 fix; document “before vs after” session evidence for internal alignment.
Day 6: Verify the fix reduced the specific friction pattern (sessions + error signals) and document what changed so the team can repeat the process.
Day 7: Re-check activation + time-to-aha; decide ship/iterate/roll back and queue fix #2.
TEAMS
Built for product teams who own Week-1 activation
Give PMs, product analysts, and growth leaders the behavior insights they need to design, measure, and improve the first week of the product journey.
Product managers
See where onboarding flows succeed or fail, understand which actions define activation, and ship changes that move the metric you actually own.
Heads of Product
Get a clear view of Week-1 activation across products and segments so you can align teams around the same activation and retention goals.
Product analytics leaders
Combine quantitative product metrics with replays, heatmaps, and funnels so you can answer deeper questions without instrumenting every field.
Growth product managers
Use real behavior patterns to design and prioritize activation experiments instead of guessing which changes might work.
How do product analytics tools support Week-1 activation?
Product analytics tools help you track how users move through your product—what they click, which features they use, and whether they complete key actions like onboarding and activation.
FullSession focuses on pairing those metrics with rich behavior insights. Instead of only seeing an activation rate, you can watch how users actually experience onboarding and understand why many of them never reach the ‘aha’ moment.
HOW IT WORKS
See why new users stall in Week 1
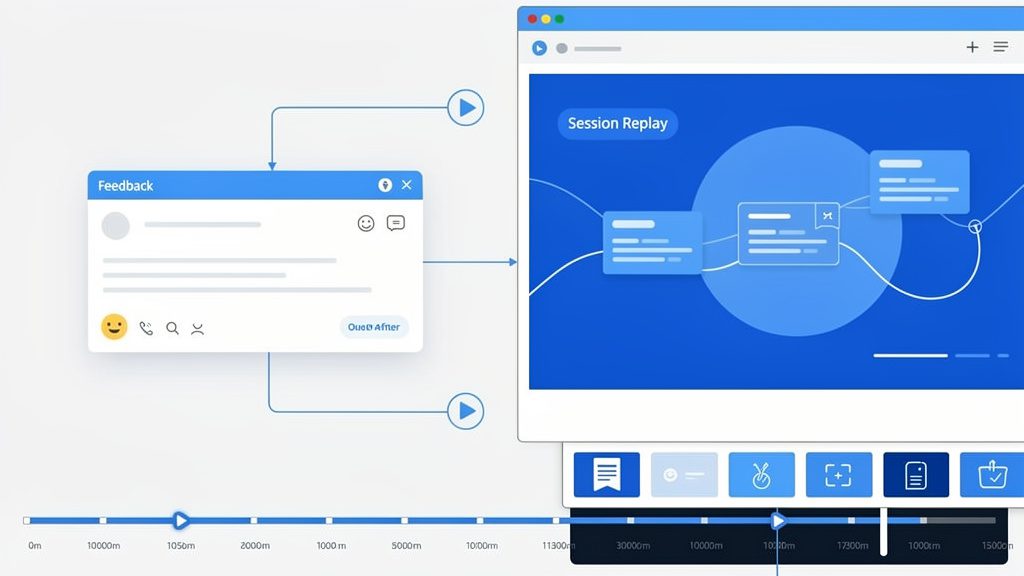
Combine replays, heatmaps, and feedback to pinpoint onboarding friction and improve activation with confidence.
Watch real onboarding sessions
Use session replay to see how new users explore your product: where they pause, which tooltips or steps they ignore, and where they drop off entirely.

Visualize hesitation and confusion
Use heatmaps to see where new users click, hover, and scroll on key onboarding screens, revealing elements that attract attention but don’t drive activation.
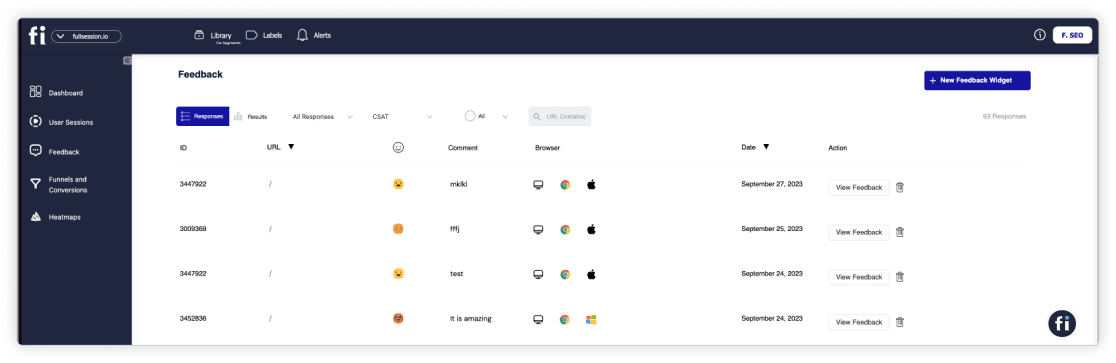
Capture feedback when it matters most
Collect feedback and micro-surveys directly from onboarding flows so you can combine qualitative input with behavior and funnel metrics.
ACTIVATION ANALYSIS
Find the steps that separate activation from churn
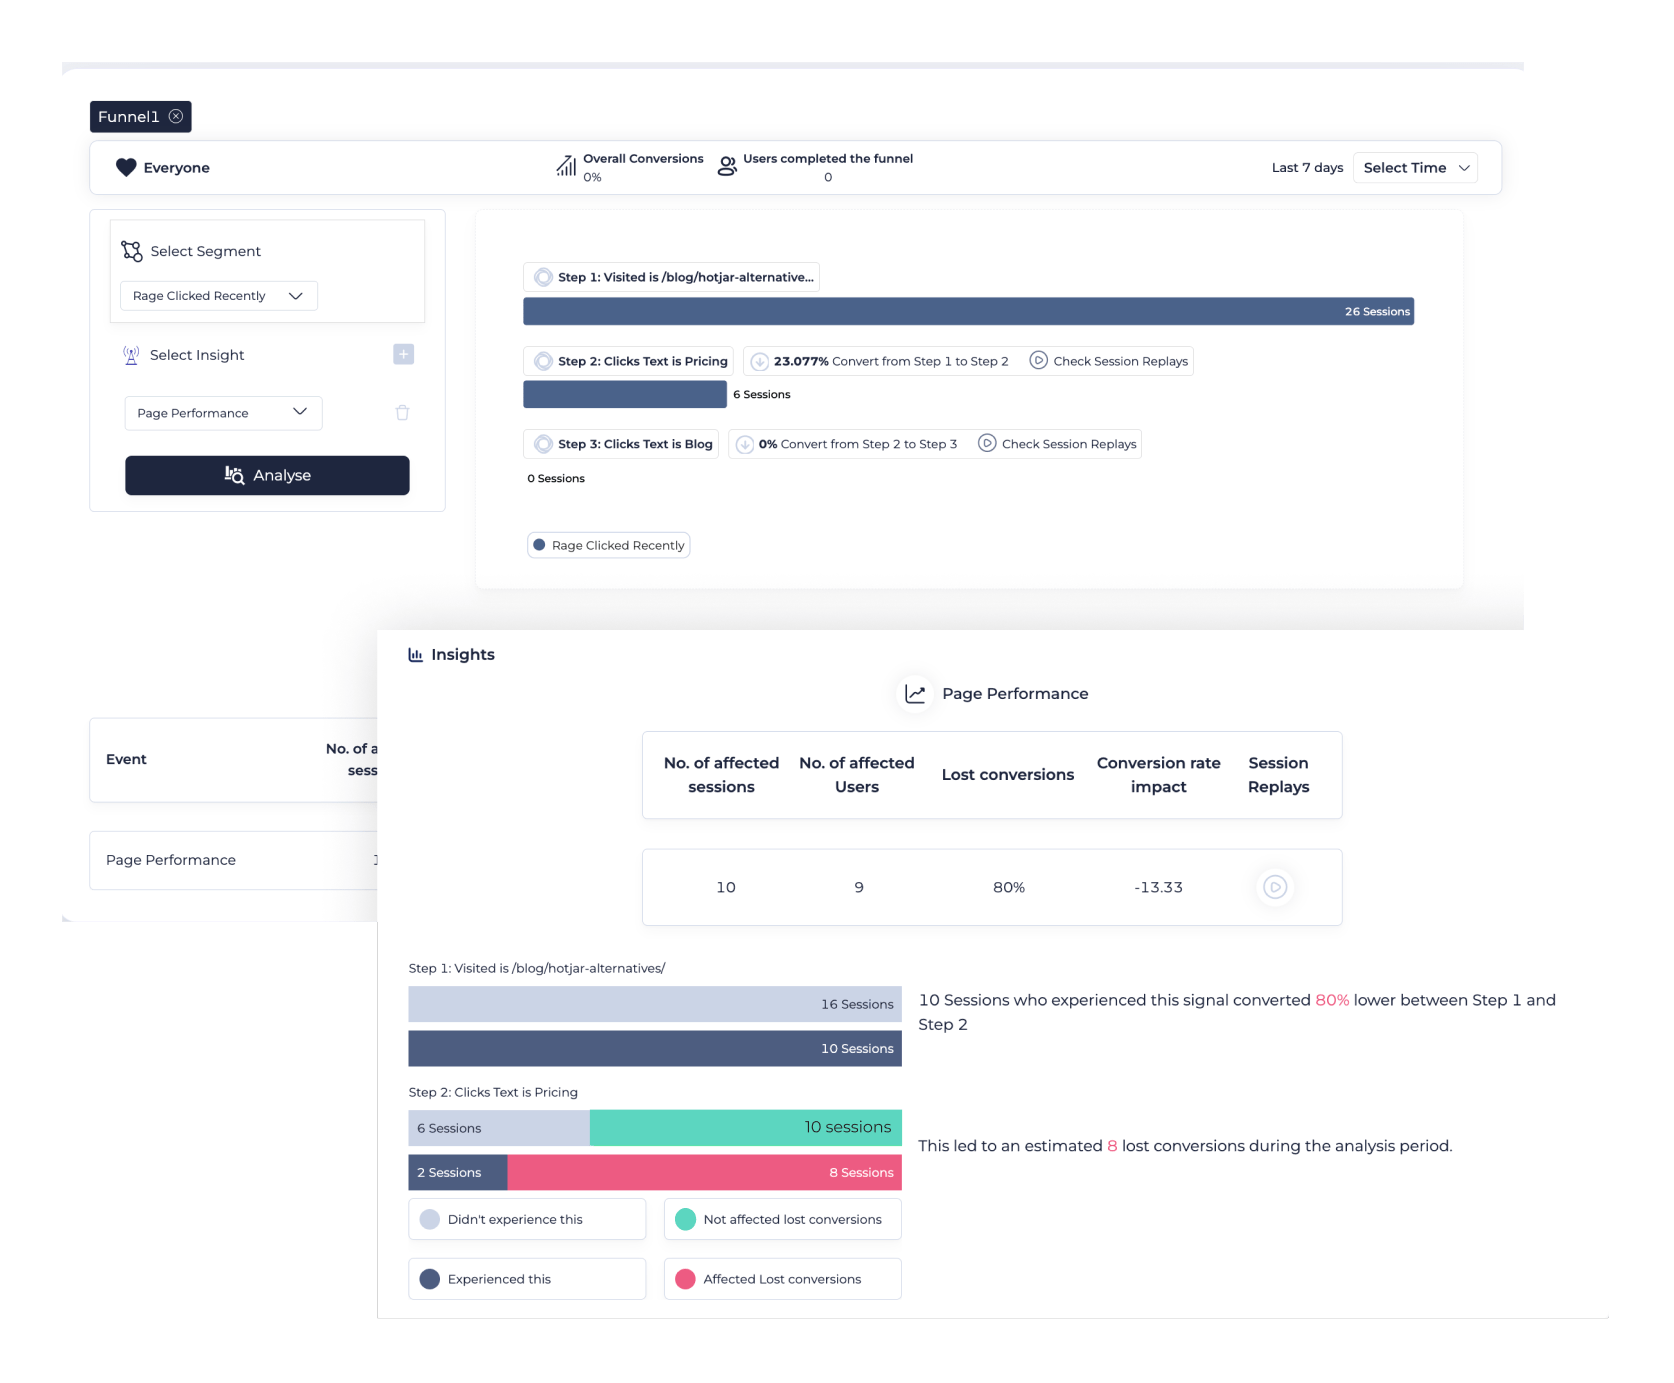
Map your Week 1 funnel, compare activated vs non-activated paths, and prioritize fixes that move the metric.
Map your activation funnel
Define the steps that matter for Week-1 activation—from account creation to onboarding milestones and first key actions—and see where users fall off.

Compare activated vs non-activated paths
Contrast the paths of successfully activated users with those who churn early to understand which steps or actions make the biggest difference.
FEATURE ADOPTION
See which features define activation in the first 7 days
Identify your ‘aha’ actions
Find the key actions that almost all retained users complete in their first week, then make sure new users discover and complete them.
Spot ignored or misunderstood features
See which features new users rarely touch, even though they’re important, and use behavior insights to improve their discoverability.
Optimize tours and checklists
Watch how users interact with onboarding tours and checklists to see which steps help them move forward and which ones they skip.
Experiment with activation paths
Use behavior insights to shape activation experiments, then validate which paths and prompts drive better Week-1 outcomes.
Reduce Week-1 churn with experience-level insight
Early churn often comes from frustration that never shows up in simple metrics—confusing copy, broken steps, slow pages, or flows that don’t match user expectations.
FullSession helps you compare churner journeys with the paths of retained users, so you can pinpoint where frustration starts and fix it before it becomes a pattern.
WHY FULLSESSION
Why product managers choose FullSession
Go beyond dashboards and get a complete picture of how new users experience your product from Day 1.
Activation-focused analytics
See onboarding, activation, and early feature use together instead of digging through generic product dashboards.
Behavior + metrics in one place
Combine funnels, feature usage, and activation rates with replays, heatmaps, and feedback without juggling multiple tools.
Fast answers without heavy setup
Answer new activation questions quickly, without waiting for engineering to define every event upfront.
Designed for PLG and self-serve journeys
Answer new activation questions quickly, without waiting for engineering to define every event upfront.
CUSTOMER INSIGHT
“We knew our activation rate wasn’t where it needed to be, but we couldn’t see why. FullSession let us watch real onboarding sessions and spot exactly where new users dropped off. It changed how we plan and prioritize activation work.”
Boost activation and reduce churn from Day 1
Give your product team a clear view of Week-1 behavior so you can fix onboarding friction, guide users to value, and support long-term retention.
Product analytics and activation FAQ
Answers to common questions about using FullSession to improve Week-1 activation and early retention.
What is product analytics?
Product analytics turns in-app events and user journeys into insights. It helps teams understand what users do, where they struggle, which features create value, and what changes improve activation, engagement, retention, and revenue.
What do product analytics tools measure?
Product analytics tools measure user actions and outcomes in a product, such as events (clicks, views), funnels (sign-up to key action), retention, feature adoption, cohorts, paths, and key metrics like activation rate, conversion rate, and churn.
What are product analytics tools and how do they help product managers?
Product analytics tools show how users move through your product—what they click, which features they use, and whether they complete key actions. FullSession adds behavior insights like replays, heatmaps, and funnels so you can understand why users behave that way and what needs to change.
How do you measure activation?
Measure activation by defining an “aha” moment (a key action that shows a user got value) and calculating: Activation rate = users who complete the activation event ÷ new sign-ups (in a set time window, like 7 days).
How do product analytics help improve Week-1 activation?
By focusing analytics on Week-1 journeys, you can see where new users get stuck in onboarding and which actions correlate with long-term retention. FullSession helps you identify those moments and test improvements that move more users to activation.
What metrics matter most for Week-1 activation and early retention?
Common metrics include activation rate, time-to-activation, onboarding completion, and use of key features in the first 7 days. FullSession helps you see these metrics in context, alongside the real experiences that drive them.
What is user behavior analytics in SaaS?
User behavior analytics in SaaS analyzes how customers interact with your app—what they click, which features they use, and where they drop off so you can improve onboarding, reduce churn, and increase adoption and expansion.
What is feature adoption analytics and how does it relate to activation?
Feature adoption analytics focuses on which features users actually use and how quickly they start using them. For many products, a few key actions or features define activation. By understanding adoption patterns, you can design onboarding and prompts that guide users to those actions sooner.
How can product managers reduce Week-1 churn using behavior and product analytics together?
Pairing funnels and product metrics with behavior insights helps you see where churners struggle or give up. That makes it easier to fix confusing flows, address errors, and adjust onboarding content, all of which can reduce Week-1 churn and improve early retention.