.svg)

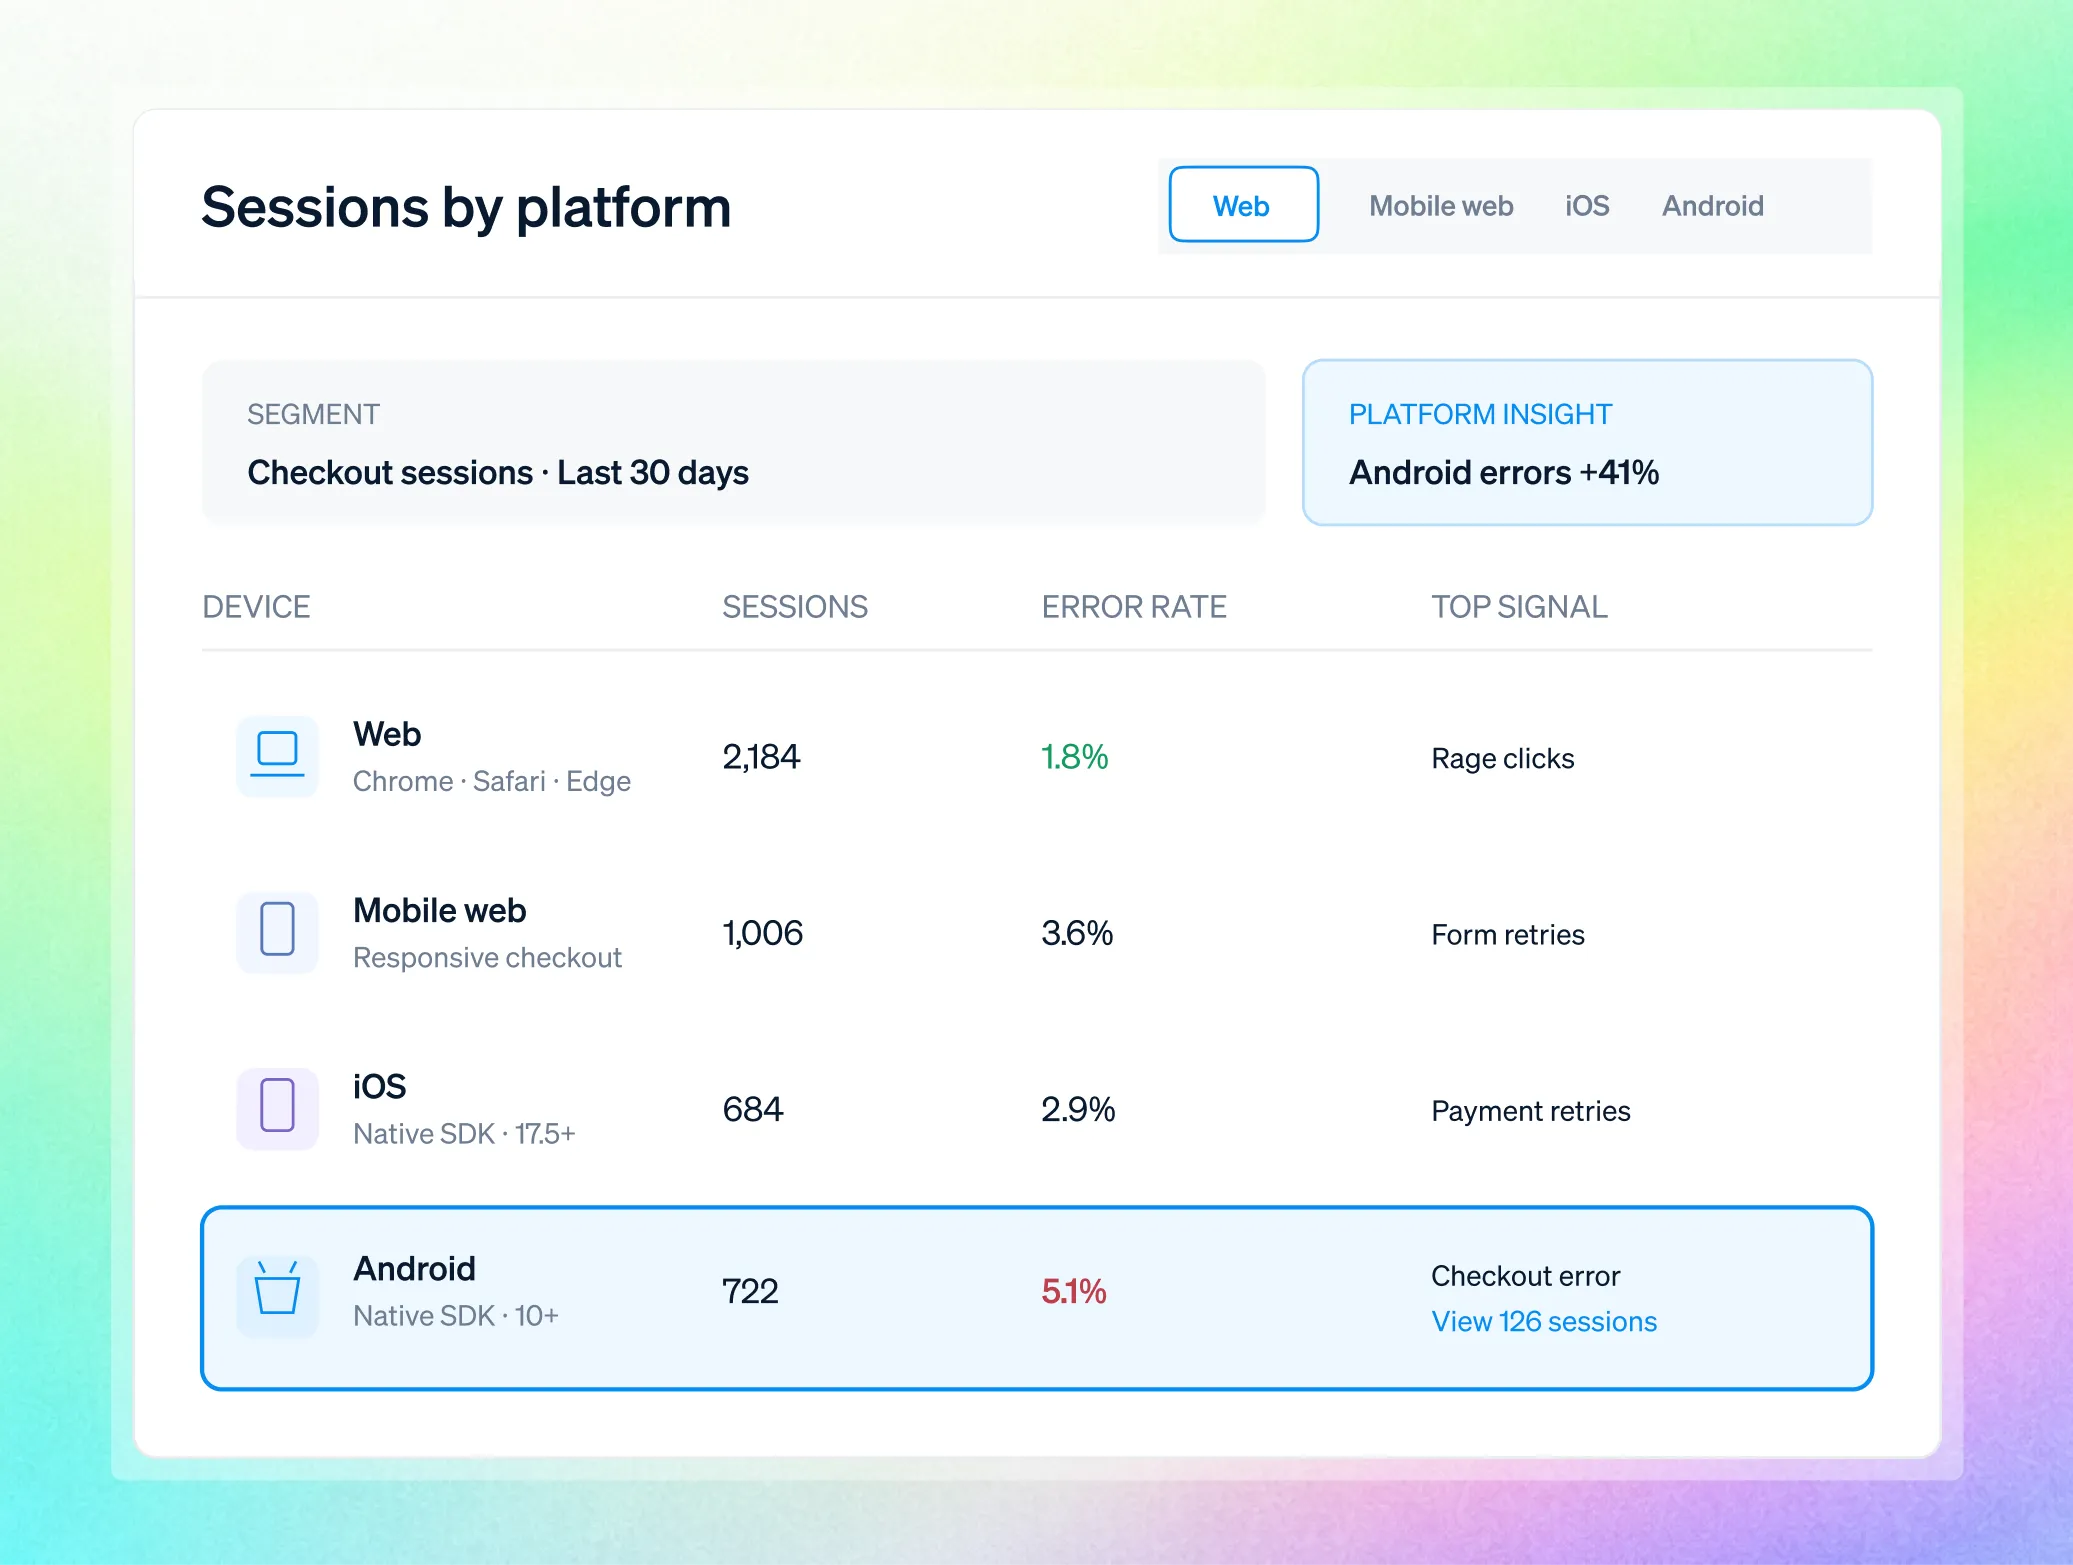
Web analytics with the campaign on one side, the recorded session & ranked fixes on the other.
Sources, campaigns and devices, connected to the recorded sessions behind every count. See what stops conversion, then let Lift AI rank what to fix by revenue.






.svg)

Website analytics tools in one view: sources, campaigns, devices and the goal, each one a click from the sessions behind it.
The reports a website owner reads every Monday, built on the tracker that recorded every visit. A row in a breakdown is never the end of the question here; it is where the recording starts.
Illustrative dashboard: KPI values and predicted lift are examples, not customer results.
Filter and break sessions down by referrer, including the AI assistants that now send visitors, and by the page they landed on and left from.
Break any funnel down by UTM source, medium or campaign, and save the campaign as a segment to use everywhere else.
Every breakdown runs by device type, browser and version, operating system, screen size, country, region and city.
Funnel conversion per breakdown, compared to the previous period or across three segments, and per element on a conversion heatmap.
Follow a campaign into checkout and find what it is costing.
Traffic reports show the visit. Conversion evidence explains what happened next. In this illustrative example, a spring campaign lands 1,800 visitors and converts at a third of the site average; this is how FullSession answers why.
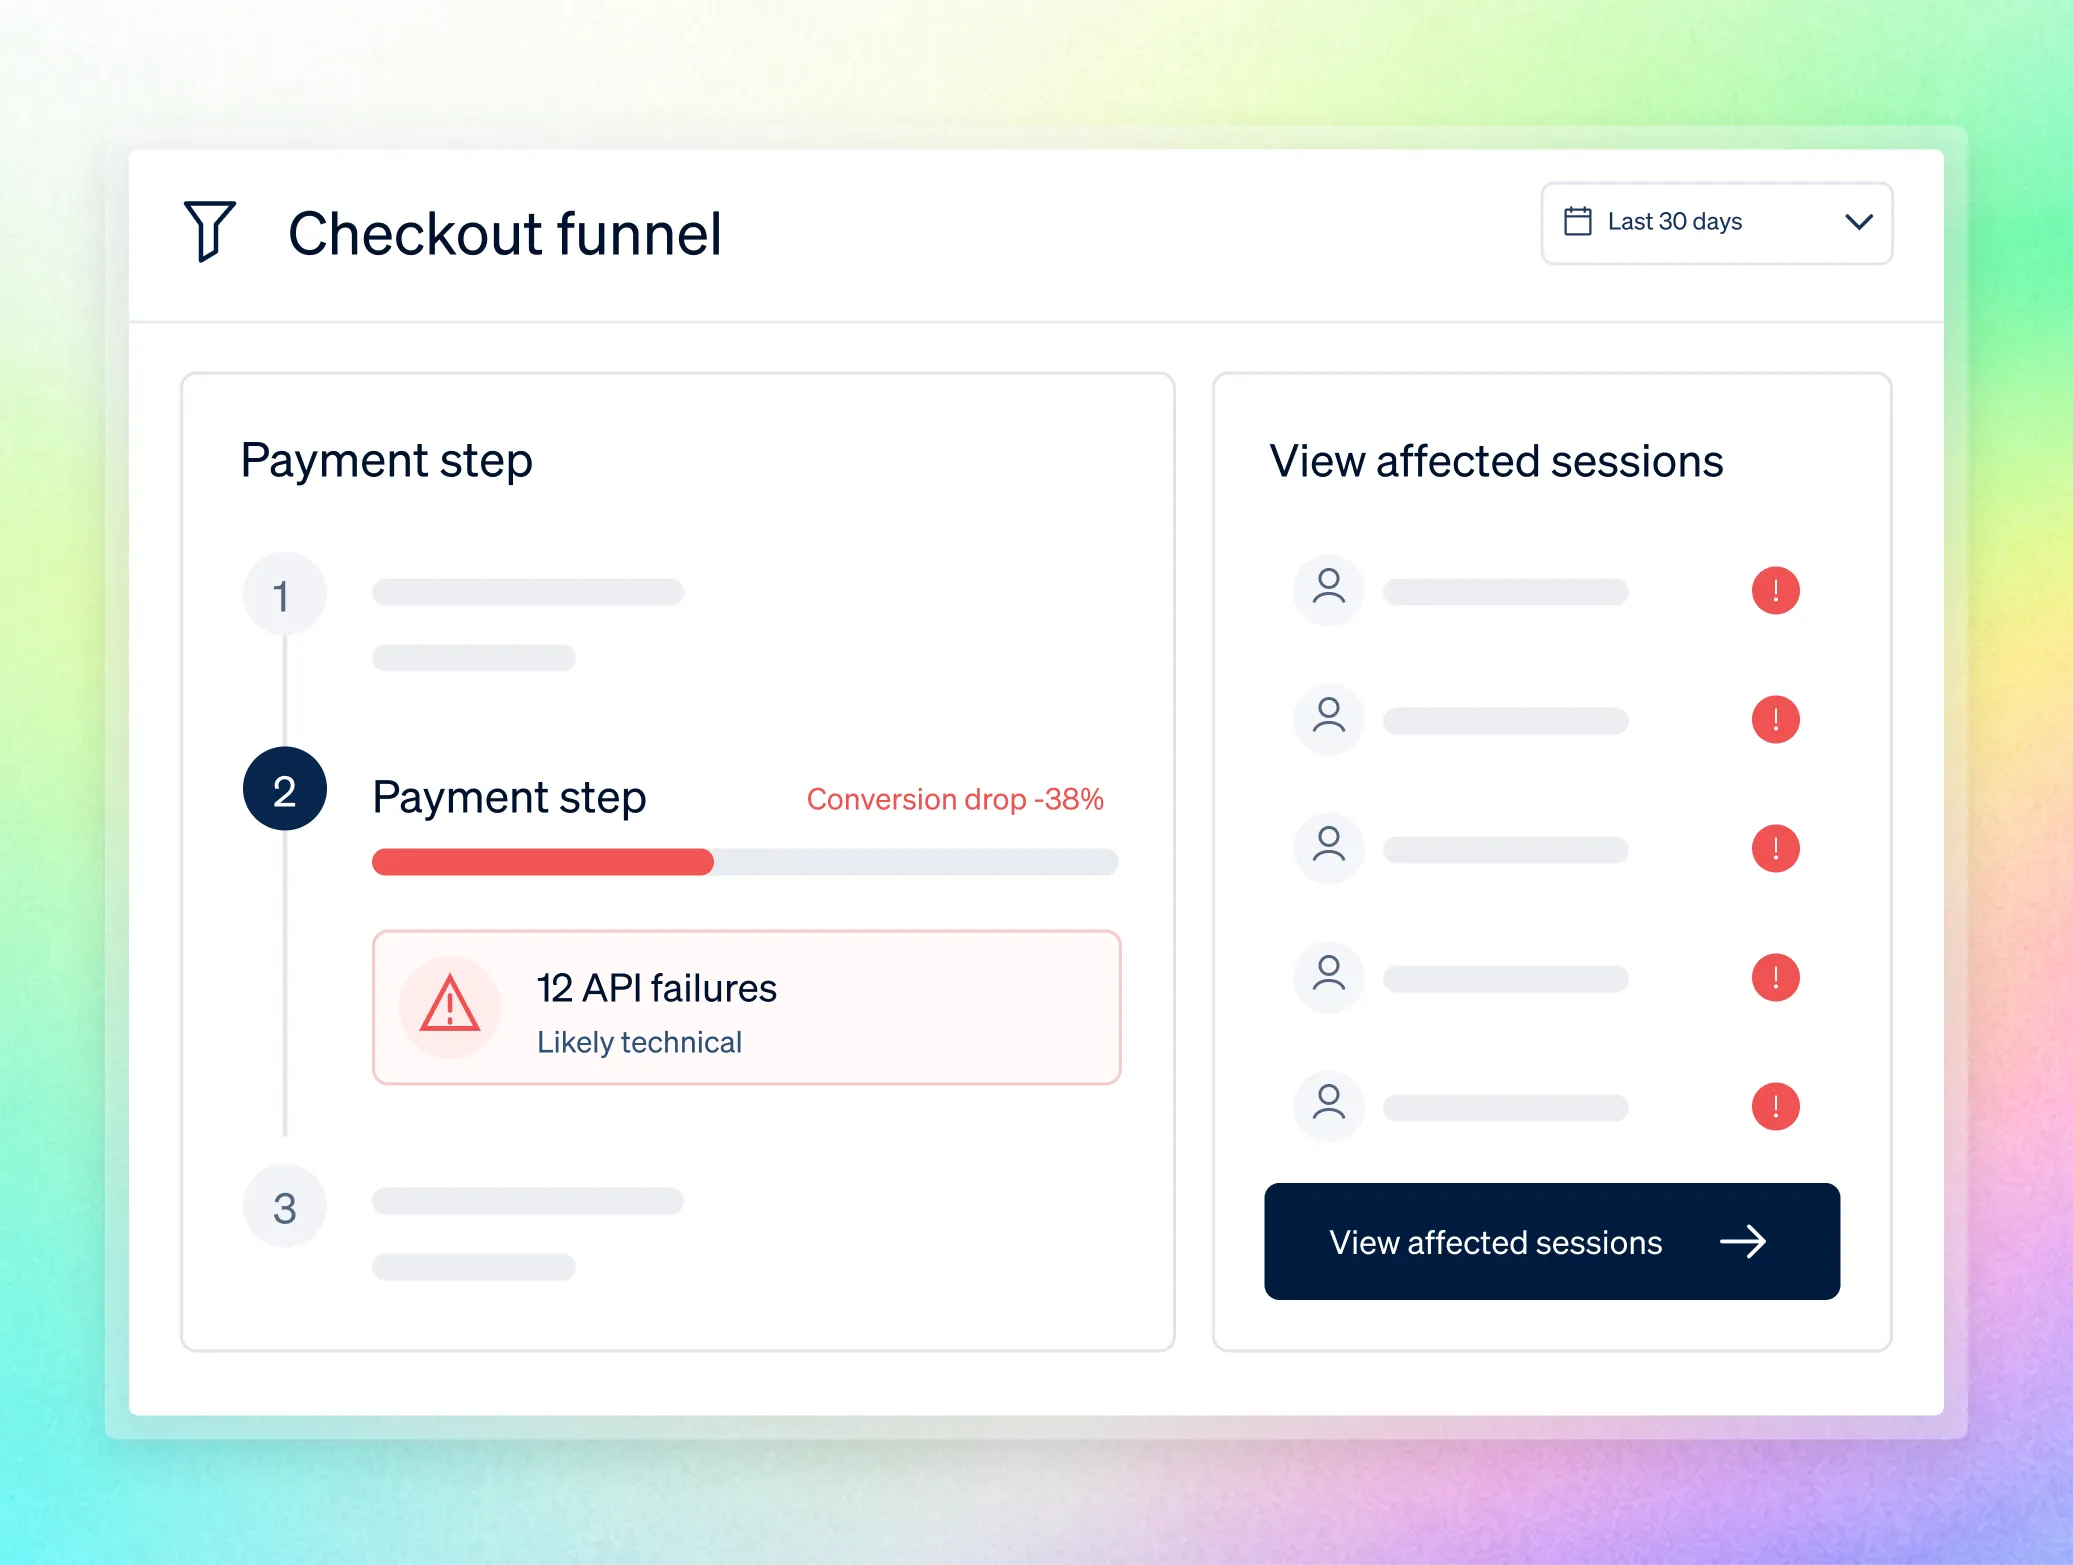
UTM campaign equals spring, saved once, applied to sessions, funnels, heatmaps and dashboards.
The campaign converts like everyone else on desktop. On mobile it loses two thirds of its visitors at the payment step.
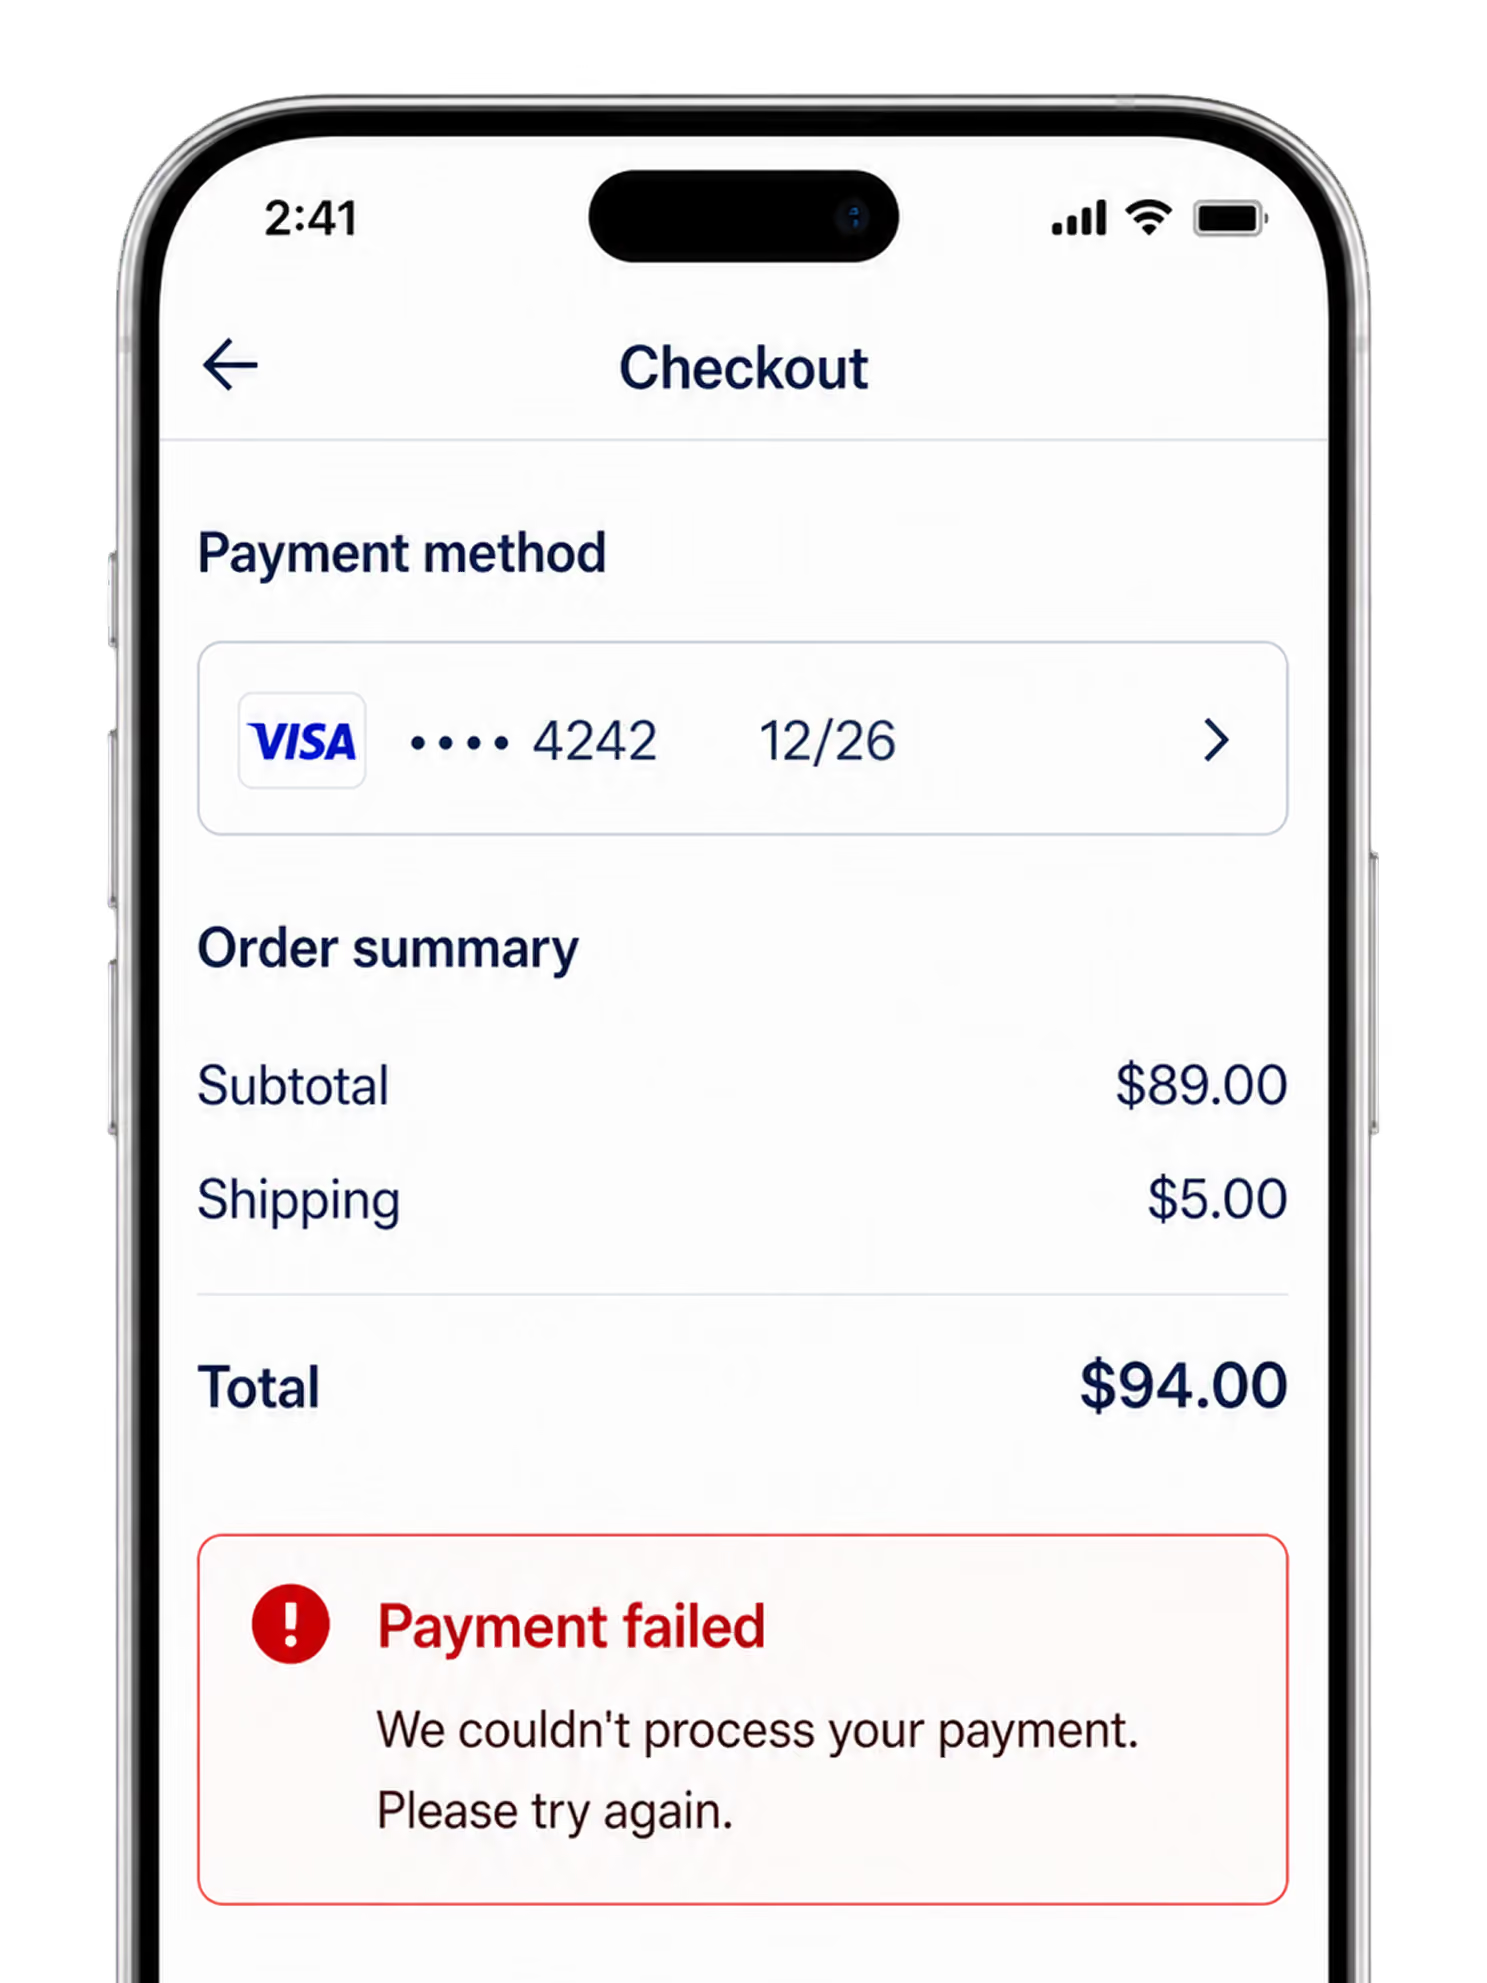
The recording shows the wallet button that never responds and the network error behind it, with the console and the timeline attached, on the devices that ad budget sent.
Lift AI already has the payment error ranked on the checkout goal, with revenue at risk, a predicted completion lift and a confidence score. Ship the fix, mark it live, and it reports the measured lift against the baseline. How Lift AI works
"Why does the spring campaign convert worse on mobile?" Daleel runs the breakdown, pulls the sessions and the error, and hands back the finding with the fix, carried out as far as you allow.
The same path works for the application, quote and enrollment forms your campaigns send visitors to. High-stakes forms
One tracker on web and mobile, beside whatever analytics you keep.
Web analytics is part of FullSession Core CX / UX. One tracker records the visit, counts the source and runs the funnel on your website, your mobile web and your native iOS and Android apps. It runs alongside the analytics you already report from, and it is where the numbers turn into fixes.
One snippet, masking in the browser.
Install the tracker once. Choose which pages record, mask or exclude fields and elements at capture so protected values never leave the visitor's browser, and add the mobile SDKs for native apps.
Safety & securityPriced by sessions a month, from free with 1,000 sessions. Paid plans from $49 a month with unlimited seats and domains, so every site and every marketer is covered by one plan.
Plans and sessionsCore CX / UX, on the FullSession platform.
Session replay, heatmaps, funnels, errors, feedback, web and product analytics, with Daleel and Lift AI inside, and an MCP server your own AI agents can read and act through.
Core CX / UXWeb analytics is the measurement of where website visitors come from and what they do: sessions by source, referrer, campaign, device, browser and country, the pages they land on and leave from, and whether they reach the goal. FullSession connects every one of those counts to the recorded sessions behind it and ranks what to fix by revenue.
Session filters and dashboard breakdowns by referrer, landing page, exit page, device type, browser, operating system, screen size, country, region and city; funnel breakdowns by UTM source, medium and campaign; saved segments reused across sessions, funnels, heatmaps and dashboards; comparison to the previous period or across three segments; conversion heatmaps per element; and dashboards with role templates and custom cards.
FullSession runs alongside whatever analytics you keep, on its own tracker. It is where a traffic number becomes a recorded session, a ranked fix and a measured result: the spring campaign that converts badly on mobile is a watched payment error, a predicted lift and a measured result after the fix in FullSession.
By sessions a month, as part of FullSession Core CX / UX. The free plan includes 1,000 sessions a month. Paid plans start at $49 a month with unlimited seats and domains, and the full plan table is on the pricing page.
See the campaign. Open the session. Find the fix.
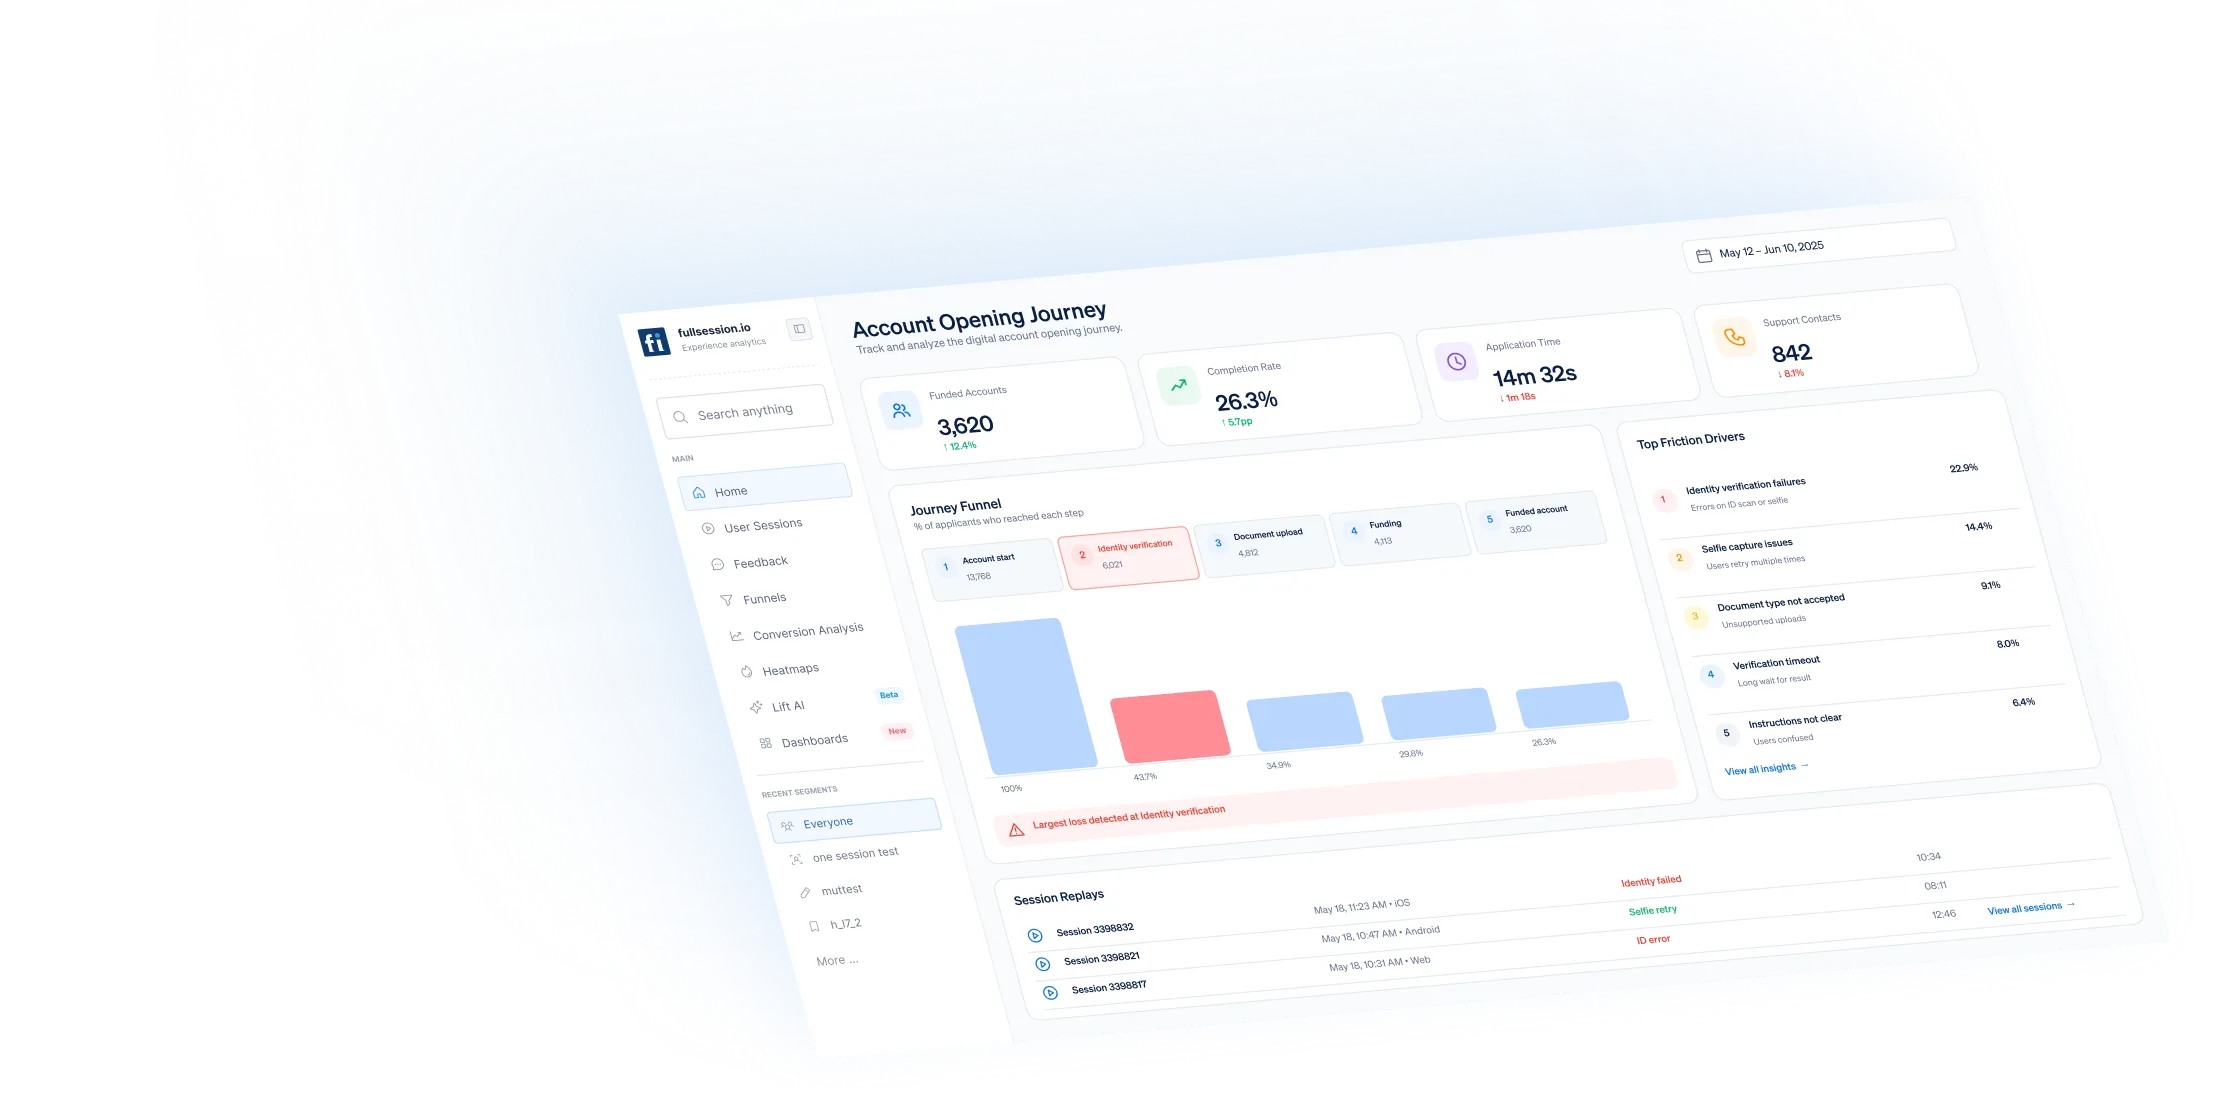
Sources, campaigns, devices and session evidence, together in FullSession.


.svg)
.svg)
212 E Stone Path St Derby, KS 67037 Phone: +1 415-649-4222



All systems operational.