.svg)

Qualitative vs Quantitative Data: Key Differences & Examples


Your analytics dashboard says conversions dropped by 12% last week. It doesn’t explain why.
That gap lies at the heart of the qualitative vs. quantitative data question. Quantitative data tells you what happened and how often, while qualitative data tells you why.
Quantitative data is anything you can count or measure, such as session length or bounce rate. Qualitative data reveals the meaning behind those numbers through interviews, open-ended responses, and observed behavior.
This guide covers what each data type means, how to collect and analyze both, where each falls short, and how FullSession, our behavioral analytics platform, brings qualitative and quantitative data together in one place.
Key Takeaway
- Quantitative data measures (numbers, rates, percentages); qualitative data describes (words, observations, meaning). One tells you what happened, the other tells you why.
- Use quantitative methods (surveys, experiments, funnel data) when you need to generalize to a larger population. Use qualitative methods (interviews, open text, session replay) when you need to understand the motivation behind a specific behavior.
- Sample size expectations differ sharply: qualitative research can surface most findings with a handful of participants, while quantitative research needs a much larger sample to reach real statistical significance.
- Each method has a blind spot on its own. Quantitative data can miss the reasons behind a number, and qualitative data can be skewed by researcher bias or by a sample that is too small to generalize from.
- The strongest research doesn’t pick a side. It starts with quantitative data to find where a problem exists, then uses qualitative data to explain why, and reports both together instead of as separate stories.
FullSession is built around that last point. It puts quantitative signals (funnels, heatmaps, error rates) and qualitative context (session replay, mobile replay) in the same dashboard, so a drop in the numbers and the reason behind it are never more than a click apart.
Lift AI and the MCP server take that pairing further, ranking friction points by revenue impact and letting you ask plain-language questions that pull from both the trend and the session behind it, which is exactly the mixed-methods workflow the rest of this guide describes.
What Is Qualitative Data?
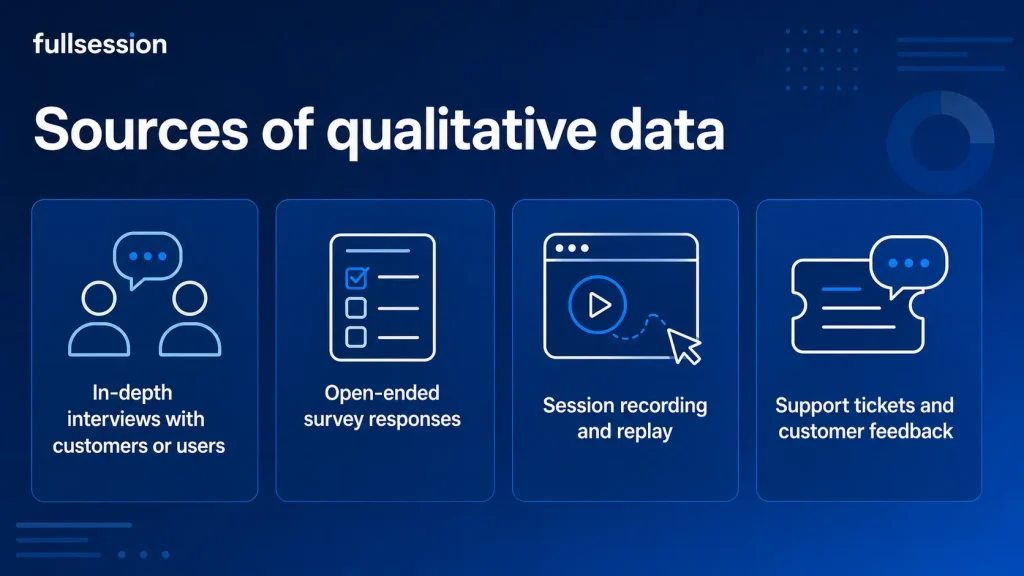
Qualitative data describes something in words instead of numbers. It’s non-numerical by nature, which is exactly why it resists easy counting and captures opinions, observations, and experiences that explain why people behave the way they do.
Common sources of qualitative data include:
- In-depth interviews with customers or users
- Open-ended survey responses
- Session replay footage that shows how a real visitor moves through a page
- Support tickets and customer feedback in the visitor’s own words
A comment like “the checkout felt confusing” is qualitative data, and so is a support ticket explaining why someone gave up on a signup form.
Two researchers can read the same transcript and land on different recurring themes, since this kind of data doesn’t answer questions the way a number does.
Read our full guide on how to collect qualitative data for interview scripts and coding frameworks you can use right away.
What Is Quantitative Data?
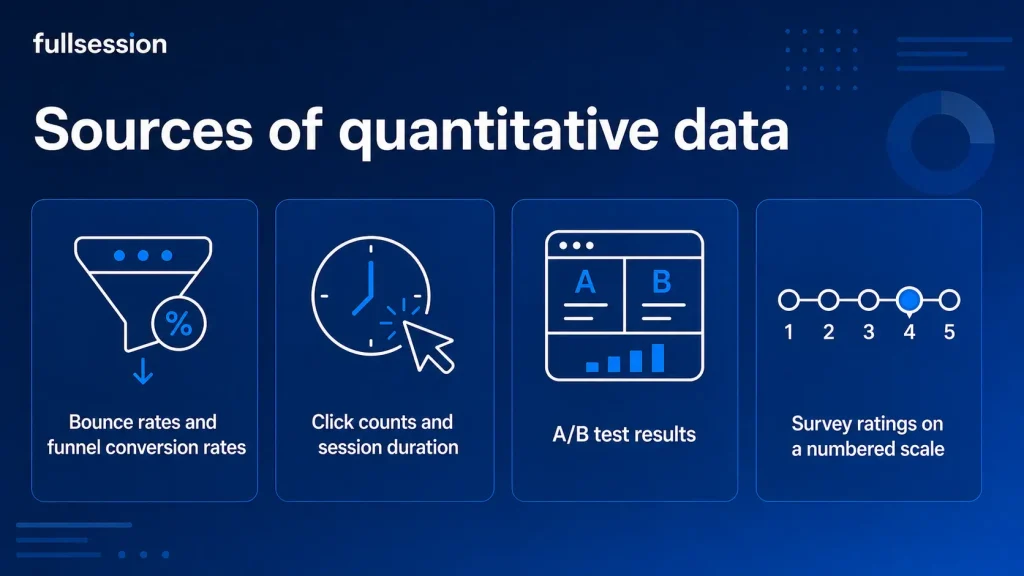
Quantitative data is numerical data you can count or measure. If it produces a number, percentage, or rate, it’s quantitative.
Common examples of quantitative data include:
- Bounce rates and funnel conversion rates
- Click counts and session duration
- A/B test results
- Survey ratings on a numbered scale
These examples all reduce user behavior to numerical values you can compare side by side.
Because it is numerical, quantitative data can be analyzed statistically, from simple averages to significance tests that confirm whether a pattern is real. That precision is exactly why quantitative research methods dominate reporting to stakeholders who want proof, not impressions.
Qualitative vs Quantitative Data: Key Differences
The key difference between qualitative and quantitative data comes down to one question: are you measuring something or describing it?
Quantitative data measures. Qualitative data describes. That single distinction shapes how you collect each type, how you analyze it, and what kind of research question it can actually answer.
Some teams call the same comparison quantitative and qualitative data, and the distinction holds either way you order the words.
Qualitative methods lean on interviews, focus groups, and observation to build a nuanced understanding of behavior. Quantitative research leans on surveys and experiments, then applies statistical methods to turn responses into numbers you can defend in a boardroom.
Neither approach is more rigorous than the other.
Qualitative and quantitative research, or quantitative and qualitative research if you prefer the reverse order, answer different questions, which is why most strong research projects use both for real decision-making.
Data Collection: Qualitative vs Quantitative Approaches
Collecting data the right way calls for two different sets of methods, and mixing up qualitative and quantitative methods produces weak results.
Qualitative data collection
Qualitative data collection depends on getting people to talk or watching what they actually do. The most common methods are:
- In-depth interviews, where a skilled interviewer can turn a 20-minute conversation into an hour once they know how to follow a stray comment.
- Focus groups, which work the same way in a group setting, though they trade individual depth for shared discussion.
- Open-ended survey questions that let respondents answer in their own words.
- Session replay footage, allowing researchers to capture behavior they’d otherwise miss.
Researcher bias creeps in easily when conducting research this way. An interviewer’s own assumptions can shape which follow-up questions get asked, so most teams pair this method with something more structured.
Quantitative data collection
Quantitative methods rely on structure, since every respondent needs to answer in the same way for the numbers to mean anything.
A typical quantitative research project uses one or more of these methods, usually in this order:
- Closed-ended surveys, where closed-ended survey questions restrict answers to a fixed set of choices.
- Structured experiments, like A/B tests that isolate one variable at a time.
- Existing analytics data, pulled from tools already tracking bounce rates and funnel performance.
- Larger-scale polls, used when a research question needs input from a sample large enough to generalize to larger populations.
Each method, whether it produces test scores, click counts, or survey ratings, generates data collected in a consistent format, which is what makes statistical analysis possible in the first place.
Analyzing Qualitative vs Quantitative Data
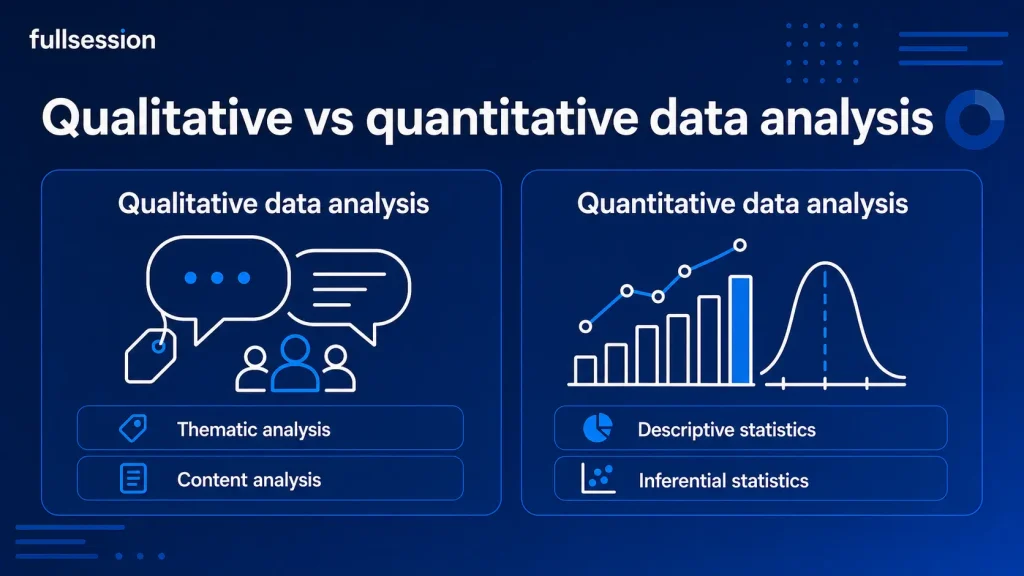
Qualitative and quantitative data need entirely different data analysis methods because one produces words and the other produces numbers.
Qualitative data analysis
Qualitative data analysis works by grouping information into categories. A researcher reads through interview transcripts or open-text responses and starts to identify patterns: the same complaint showing up five different ways or a theme that keeps surfacing across unrelated conversations.
This kind of interpretation depends on judgment, not calculation. The two most common approaches are:
- Thematic analysis, which groups responses around recurring ideas
- Content analysis, which codes and counts specific words or concepts
Both ask the same underlying question: what recurring themes show up across all these individual responses?
Quantitative data analysis
Quantitative data analysis works differently. It starts with descriptive statistics and descriptive data, like averages and distributions, to summarize what the data collected actually shows.
- Descriptive statistics summarize what the sample shows right now.
- Inferential statistics let a team generalize findings from a sample to larger populations, which is how a 500-person survey can say something meaningful about millions of customers.
Testing hypotheses sits at the center of quantitative analysis. You start with a guess about what’s true, then compare quantitative variables from your sample using numerical values to confirm or reject it.
Qualitative vs Quantitative Data: Biases and Limitations
Every research method carries its own bias, and qualitative and quantitative data fail in different ways.
Qualitative research bias
- Researcher bias is the biggest risk. The person conducting in-depth interviews can unintentionally steer a conversation toward the answer they expect.
- Small sample sizes make it hard to know if a theme is common or just loud.
- Subjectivity in coding means two researchers can read the same transcript and land on different conclusions.
Quantitative research limitations
- Quantitative data has its own blind spot: it can miss the underlying reasons behind a number entirely.
- A 30% drop in signups tells you nothing about why people left.
- Treating a single statistic as the full story is a common mistake.
Sample size matters more than most teams assume. According to Typeform’s 2026 research on qualitative sample sizes, a qualitative study can reach reliable saturation with 15 to 20 well-chosen interviews, since the goal is depth, not statistical representation.
A quantitative study runs on entirely different math: to survey a population of 500,000 people at a 95% confidence level with a 5% margin of error, you’d need roughly 384 respondents, since the goal is a number that holds up across the whole population.
FullSession: Bridging Qualitative and Quantitative Data
FullSession, our behavioral analytics platform that pairs qualitative and quantitative data in one dashboard, closes the gap between the two data types instead of forcing you to choose one.
Each feature below leans toward one side of the qualitative vs. quantitative data line or connects the two directly.
Session replay: the qualitative layer
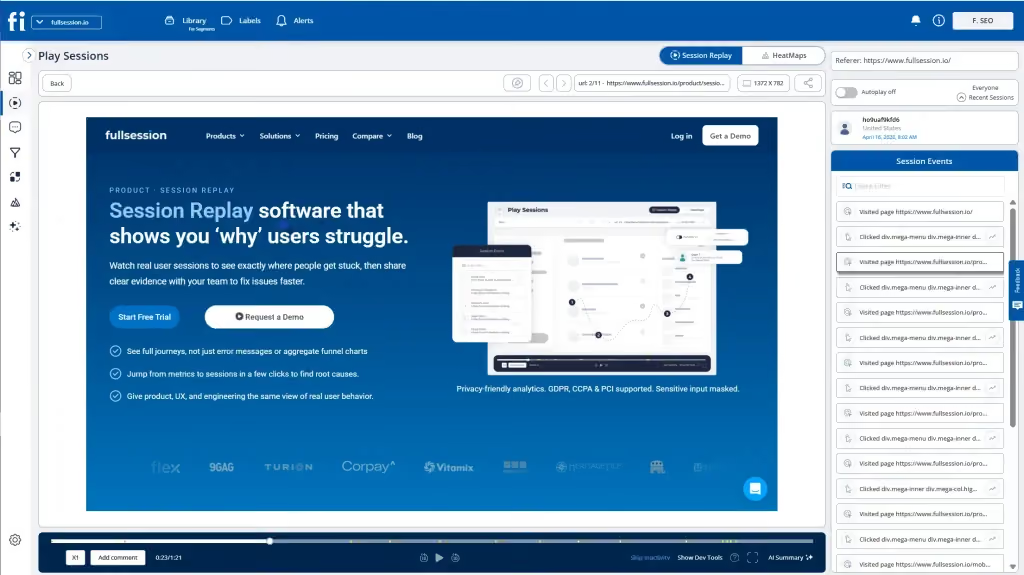
Session replay is qualitative data in its purest form. You watch real visitors move through your site and see exactly where someone hesitated, misclicked, or gave up.
On its own, session replay doesn’t scale to answer “how many.” That’s where the platform’s quantitative features come in.
Heatmaps: quantitative data you can see
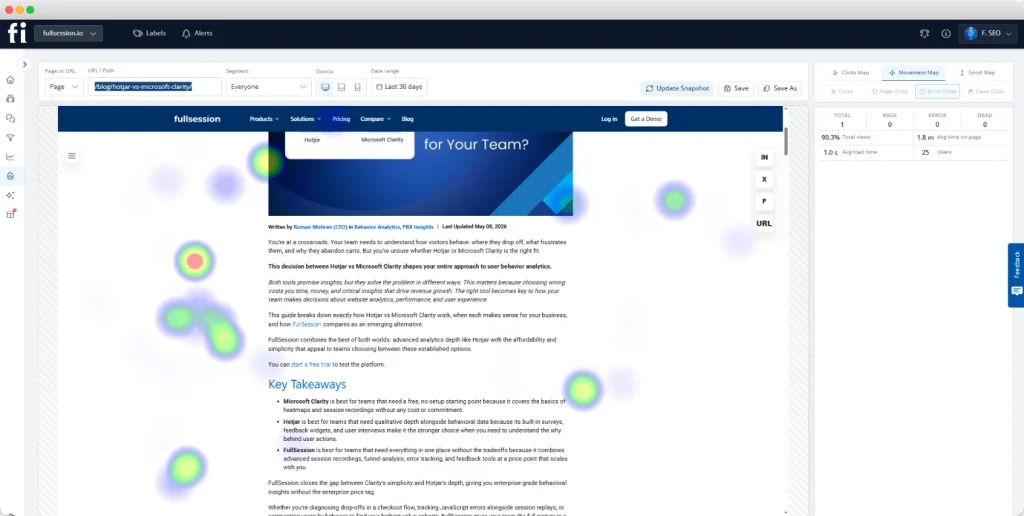
Heatmaps sit between the two. A heatmap looks visual, but it’s built from aggregated quantitative data: thousands of individual clicks and scroll depths compressed into one pattern that makes trends easy to spot in seconds.
That combination turns raw behavior into quantitative insights you can act on without reading a single transcript.
Funnel tracking: the quantitative backbone
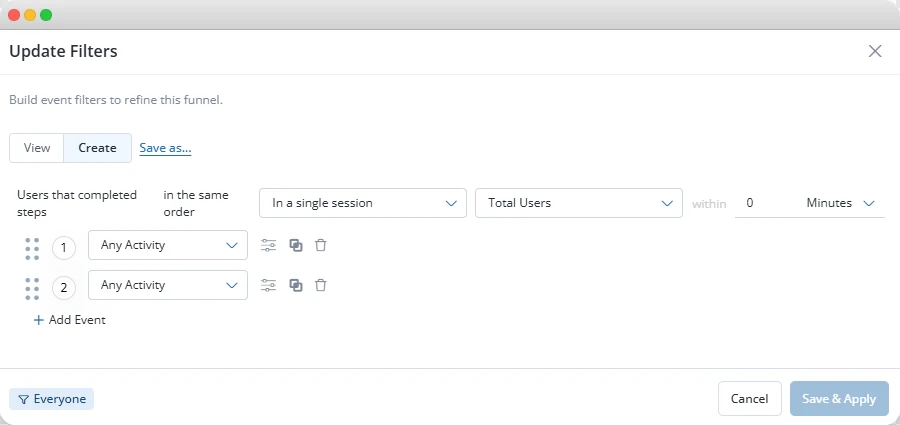
Funnel tracking gives you quantitative outcomes. You define the steps in a journey, like landing page, signup, and checkout, and the tool counts how many visitors make it from one step to the next.
That count turns into a conversion rate at each step, plus a drop-off rate showing exactly where people leave. It’s quantitative in the strictest sense: every visitor either advances or doesn’t, and the numbers hold no ambiguity about where the leak is.
What funnel data can’t do is explain the leak. A 40% drop between step two and step three tells you the step, not the reason. Session replay tells you which step is confusing and why.
FullSession provides both.
Error tracking: quantitative alerts, qualitative context
Error tracking starts as a quantitative signal: an alert fires when JavaScript errors or rage clicks spike on a page.
From there, it turns qualitative fast, since every alert links straight to the session behind it. One broken form field can quietly deflate your quantitative outcomes for weeks before anyone notices, and error tracking catches it before that happens.
Mobile replay: qualitative data on the go
Mobile replay is the qualitative layer for native iOS, Android, and React Native apps. It captures screens, taps, gestures, and logs so you can watch the same kind of behavior you’d see on desktop.
For teams whose drop-off happens on a phone, this matters most, since quantitative funnel data alone often can’t explain a thumb missing a small tap target.
Lift AI: turning behavior into priorities
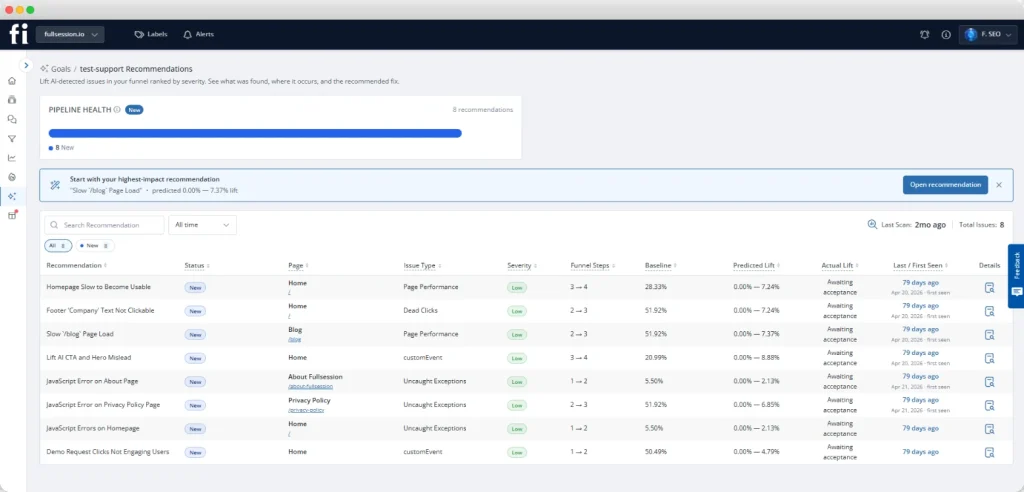
Lift AI is where qualitative and quantitative data work together directly.
It scans quantitative behavioral signals across every session, ranks friction points by expected revenue impact, then hands you the qualitative session evidence behind each recommendation.
That means your team doesn’t have to guess where to look first, and you don’t have to choose between the number and the story.
Safety and security: protecting both data types
Safety and security controls apply equally to qualitative and quantitative data. Masking rules hide sensitive fields in session replay, while role-based access, SSO, and audit logs govern who can see aggregated quantitative reports and individual sessions alike.
This matters if you’re recording anything close to a payment form or a healthcare intake flow.
MCP server: ask your data in plain language
The MCP server lets an AI assistant query your FullSession data on your behalf, and it naturally splits along the same qualitative vs quantitative line.
- Aggregate queries return quantitative trends: session counts, error rates, and frustration signals grouped by city, device, or page.
- Search and session-inspection queries return qualitative detail: the moment-by-moment timeline of one visitor’s struggle.
Ask a plain-language question, and the assistant picks the right tool for whichever kind of answer you need.
Combining Qualitative and Quantitative Data for Decision-Making
Combining qualitative and quantitative data starts with the numbers and then moves to the story behind them. The pattern usually runs in three steps:
- Start with quantitative data to find where a problem exists. A funnel report showing a 40% drop at step three tells you exactly which page is losing people, even if it can’t tell you why on its own.
- Bring in qualitative data to understand motivations. Watch a handful of session replays from users who dropped off at that exact step, and the reason often becomes obvious within minutes.
- Decide and act, whether that means fixing a confusing label or a form field that won’t validate.
This pattern repeats across almost every real research project: quantitative data narrows the search, and qualitative data explains the finding. The same logic applies beyond UX.
When teams look at how to calculate customer acquisition cost, the raw number only says whether the cost is rising, not why, and pairing it with qualitative customer feedback closes that gap too.
From Insights to Action: What to Fix First
Prioritizing what to fix first is the hardest part of combining qualitative and quantitative data, since both sources produce more findings than any team can act on at once. A few rules help:
- Rank findings by revenue or conversion impact, not by how many people mentioned a problem.
- Weigh a single quantitative outcome, like a 25% drop in checkout completion, against a dozen minor qualitative complaints about button color. The quantitative outcome usually wins.
- Let FullSession’s Lift AI do this ranking automatically. It scans behavioral signals across every session and then surfaces the friction points most likely to be costing you money.
Once you know what to fix, the next question is how to explain that decision to people who weren’t in the room.
Reporting and Communication: Qualitative and Quantitative Together
Reporting findings well means pairing every number with a story, not presenting them in two separate decks. A report that works usually includes:
- A specific quantitative outcome, stated in one sentence: “34% drop-off at checkout.”
- A short qualitative example that explains it, like a 20-second replay clip of a real user missing the submit button.
- One recommendation, not five, so stakeholders know exactly what to decide.
Avoid building one deck for qualitative findings and another for quantitative outcomes. Stakeholders shouldn’t have to reconcile two stories themselves; that work belongs to whoever presents the research question and its answer.
Short, specific examples travel further than averages. A number like the 17% of shoppers who, according to Baymard Institute’s 2025 checkout research, abandoned an order over a “too long or complicated checkout process” means little without the story attached, and one named account that abandoned checkout twice in a week says more than a paragraph of statistics ever will.
Your Rollout Checklist: Deploying Mixed Methods with FullSession
Deploying mixed methods research with FullSession, the behavioral analytics platform that pairs qualitative and quantitative data in one dashboard, takes seven steps, from defining your research question through reporting what you found.
- Write down the research question you’re actually trying to answer.
- Pull quantitative data first: funnel reports, bounce rates, and conversion numbers tied to that question.
- Identify the specific step or page where the numbers show a problem.
- Watch qualitative data at that exact point, using session replay or open-ended feedback.
- Identify themes across multiple sessions instead of drawing conclusions from just one.
- Rank findings by revenue impact using a tool like Lift AI, then pick your first fix.
- Report the finding as one story: the number, the explanation, and the fix.
Repeat this loop every sprint, and mixed methods research stops feeling like a special project. It starts feeling like the way your team already works.
Qualitative and Quantitative Data Work Better Together
Qualitative data explains why something happened. Quantitative data shows the extent to which it happened. Treat them as separate disciplines, and you’ll always be missing half the picture.
The examples throughout this guide follow the same pattern: a funnel report flags where users drop off, then a session replay shows what actually went wrong at that step. A report built around one statistic gets challenged. A report built around a statistic and a real example gets acted on.
FullSession puts both halves of that picture in one dashboard instead of two disconnected tools. You don’t export a funnel report from one platform and jump into a separate session-replay tool to explain it. The numbers and the story sit side by side, so you can go from what happened to why it happened without switching tabs.
FAQs About Qualitative vs Quantitative Data
A customer writing, “The checkout felt confusing, and I gave up,” is a clear example of qualitative data. So is a support ticket describing frustration with a broken feature or interview notes about why someone chose a competitor. Each captures meaning in words rather than a number.
Quantitative data is commonly classified as discrete or continuous. It can also be described by its level of measurement, including interval and ratio data. Discrete data counts whole units, like the number of signups. Continuous data measures on a scale, like session duration. Interval and ratio data add fixed spacing between values, with ratio data including a true zero point.
Quantitative data is generally faster to analyze at scale, since statistical software can process thousands of numerical values in seconds. Qualitative data takes longer because a person has to read, code, and interpret meaning by hand. Neither is strictly easier; the right choice depends on your research question and timeline.
Yes, this approach is called mixed methods research, and it’s common in UX and product research. A typical study starts with quantitative data to find where a problem exists, then uses qualitative interviews or session replay to understand why. Combining both produces stronger, more practical findings than either one alone.
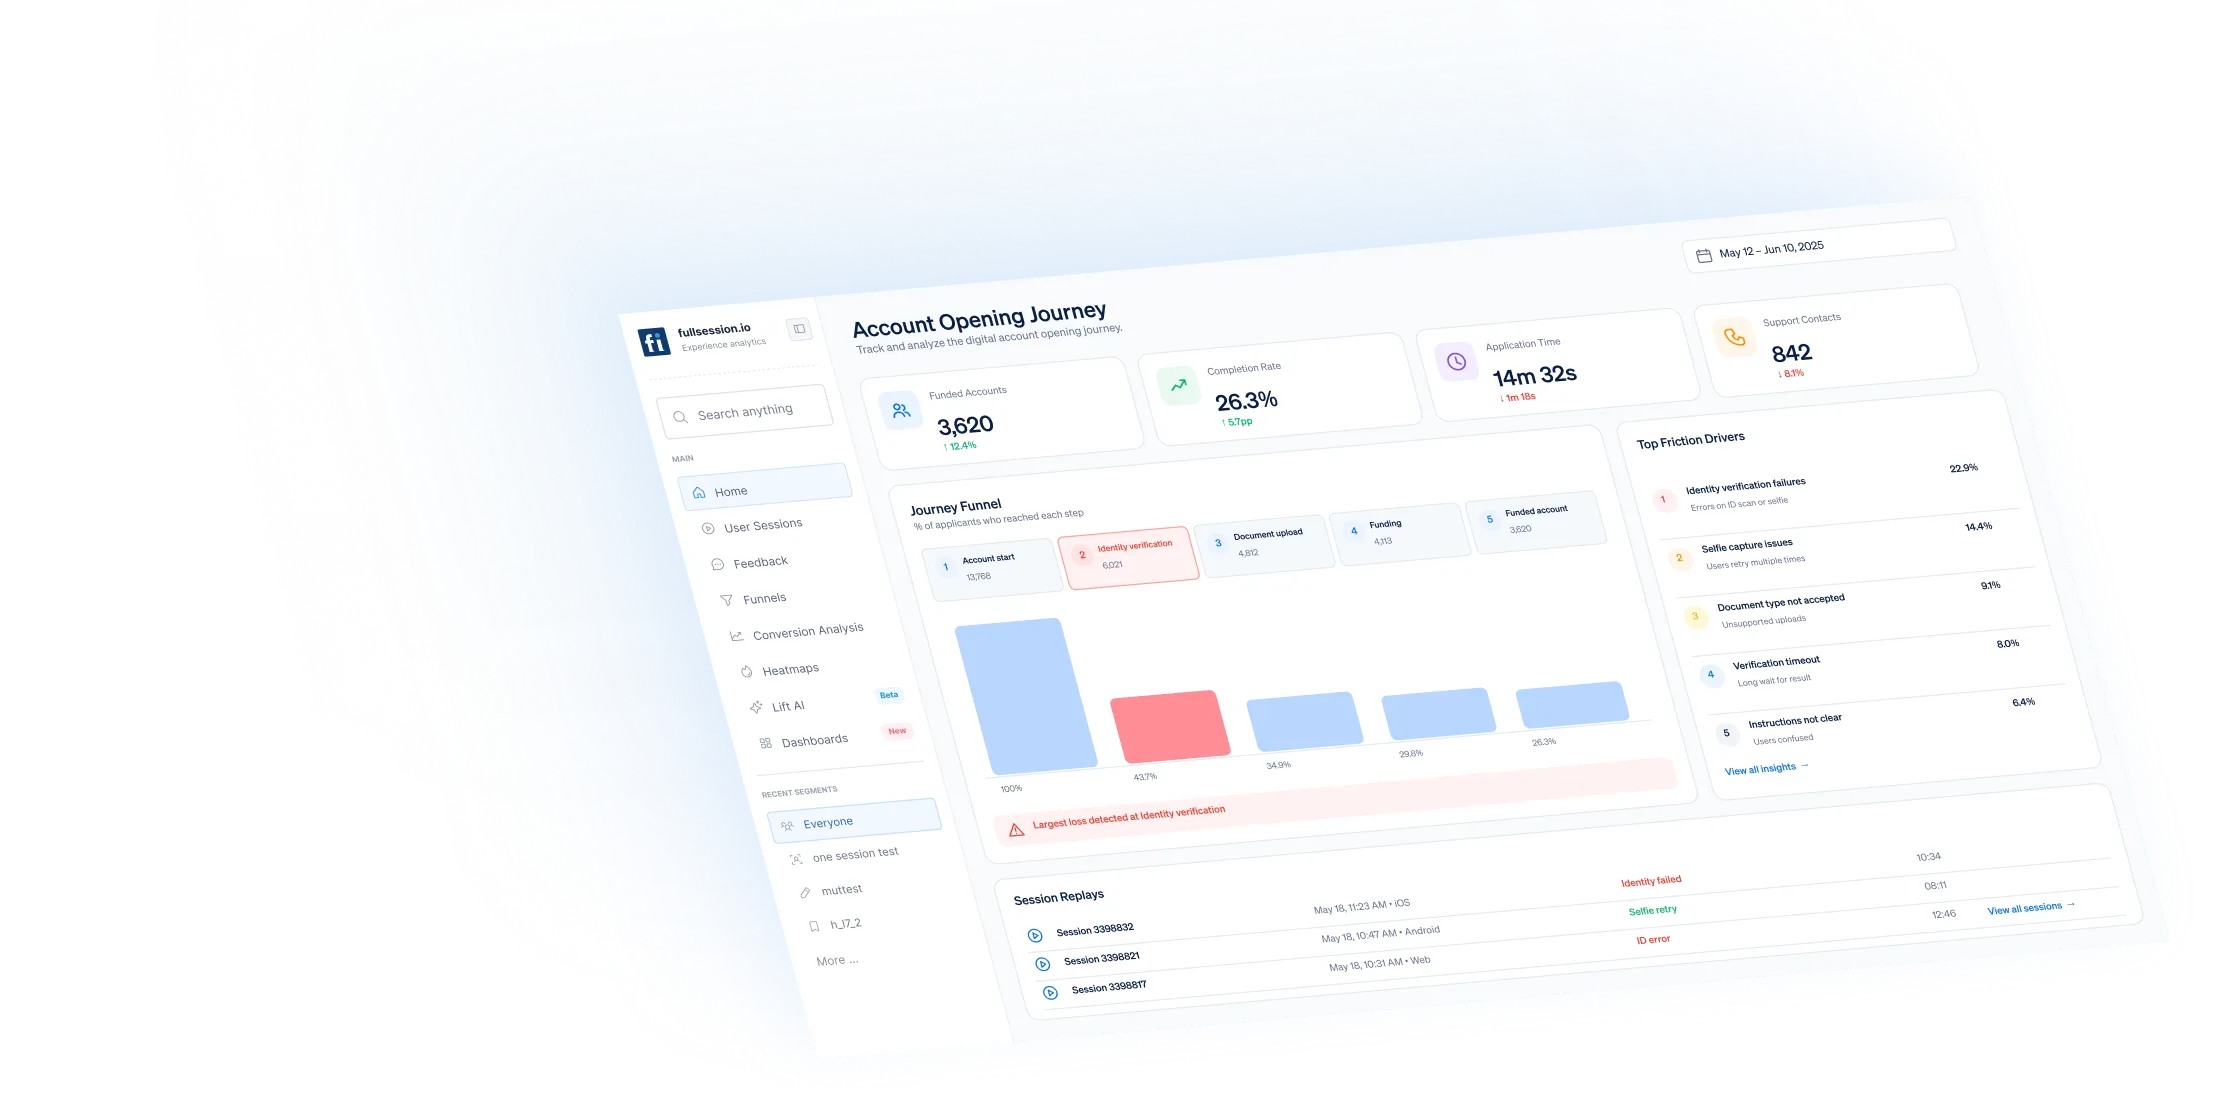
See what’s costing you, and prove whats fixing it is worth
Watch the real journey, rank every issue by revenue impact, and validate the result against baseline.




.svg)
.svg)
212 E Stone Path St Derby, KS 67037 Phone: +1 415-649-4222



All systems operational.