
A closed-ended question is a survey question that limits respondents to a fixed set of predefined answer choices, such as yes/no, multiple-choice, or a rating scale.
If you’re staring at a blank survey builder and the wording won’t come out right, our list of closed-ended question examples solves that blank-page problem fast: pick a format, adapt the phrasing, move on.
This guide explains how closed-ended questions compare with open-ended ones, provides formats to use and walks you through how to read the data once responses come in.
Below you’ll find 40 examples across customer satisfaction, onboarding, checkout, product feedback, demographics, and mobile surveys.
Once you know which questions to ask, the next move is putting them in front of real users.
Key Takeaway
- A close-ended question limits respondents to a fixed set of predefined answer choices, which produces structured data that’s fast to analyze at scale.
- Closed-ended questions and open-ended questions serve different goals: use closed formats to collect quantitative data and open formats to capture qualitative data and unexpected insights.
- The four core formats, dichotomous, multiple choice, rating scale, and ranking, cover nearly every research objective a UX or market research team runs into.
- Mobile devices need their own formatting rules: single-column layouts and short questions protect your completion rate on small screens.
- Reading closed-ended survey findings well takes more than a spreadsheet. Frequencies, cross-tabs, and visualizations turn raw responses into measurable data you can actually act on.
Writing strong questions gets you halfway there. FullSession, our all-in-one user behavior analytics platform, closes the other half. It shows you when and where to ask each one, then links every answer back to the real session behind it.
.
What Is a Close-Ended Question?
A close-ended question is a survey question that restricts respondents to a limited set of predefined answer choices instead of a free-form response. Reach for this format whenever you need a particular answer rather than an open-ended reflection.
Open-ended questions work the opposite way: they let respondents answer freely in their own words, which produces qualitative data instead of a fixed set of options. Most strong research programs use a mix of open-ended and closed questions rather than relying on just one format.
Here’s a simple example:
Do you find our website easy to navigate?
- Yes
- No
That single-word answer is easy to count, chart, and compare across thousands of respondents.
Why Use Close Ended Questions in Market Research
Closed-ended questions turn opinions into numbers you can measure, compare, and track over time. That’s why teams reach for them first when the goal is to collect quantitative data at scale.
They make comparable data possible
Standardized answer choices make it possible to calculate frequencies, percentages, and averages across large groups.
This is the foundation of the statistical analysis techniques applied to most survey data, and it’s what makes comparable data possible across time periods, segments, or markets.
Speed matters at large scale
Respondents answer faster when they can tap an option instead of typing a paragraph, which is exactly why closed formats dominate large scale surveys.
According to Survicate’s 2025 survey benchmark report, which analyzed more than 7,600 surveys from over 1,000 companies, surveys with no open-text questions have a median completion time of just 41 seconds.
Add a single open-text question and that jumps to 72 seconds, climbing to 404 seconds once a survey includes 6 to 10 of them.
Closed formats keep respondents moving, so fewer people abandon the survey before you get usable data.
One real limitation still applies
Closed questions only capture what you anticipated when you wrote the answer choices. If a respondent’s real answer doesn’t fit any option, you lose that nuance and any unexpected insights that come with it.
Pair a rating scale with an open follow-up whenever you need the “why” behind a score, not just the number. That combination is what separates a shallow survey findings report from one with deeper insights your team can act on.
Common Close Ended Question Formats
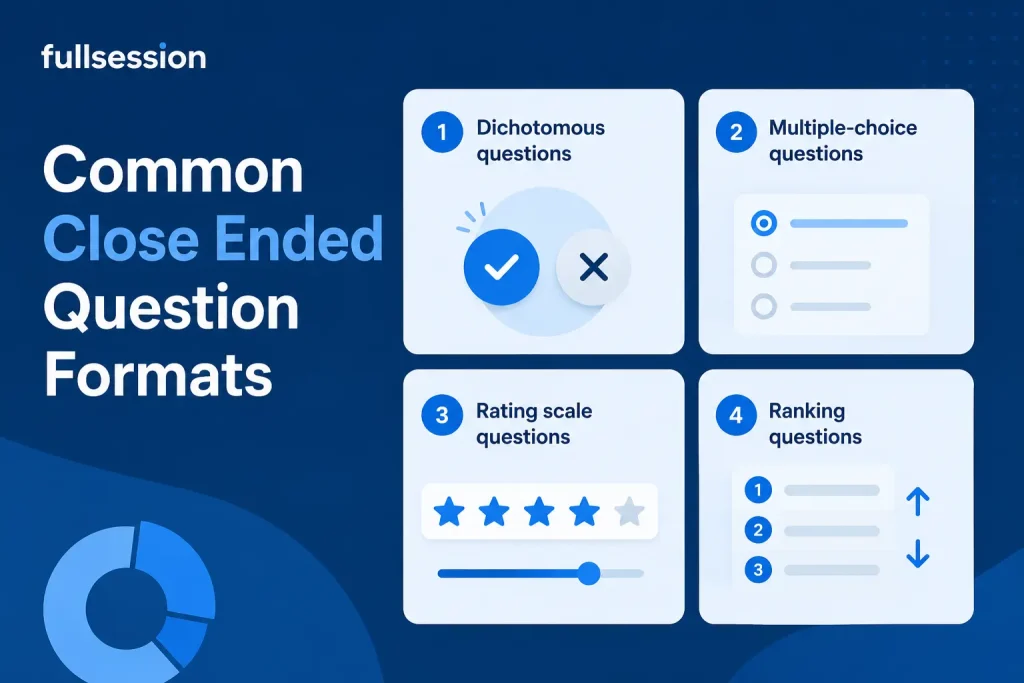
Four common formats cover most survey needs: dichotomous, multiple choice questions, rating, and ranking. Which one you pick depends on the following factors: how many options you need, whether order matters, and how much precision the scale requires.
- Dichotomous questions offer exactly two choices, usually yes/no or true/false, for a clean binary split like confirming whether someone has purchased from you before.
- Multiple-choice questions present three or more predefined options. They’re highly versatile and work well for capturing categories, like a customer’s primary reason for choosing your product.
- Rating scale questions require respondents to score something on a numeric or worded scale, from 1 to 5 or 1 to 10.
- Ranking questions ask respondents to order a list of items by preference or importance, which reveals priorities a single rating can’t.
A Likert scale, which runs from strongly disagree to strongly agree, works best for capturing attitudes. A numeric scale, like the 0 to 10 range used in Net Promoter Score (NPS), works better for measuring intensity or likelihood.
Two alternative formats round out the toolkit: image choice questions for testing logos or packaging, and slider questions, which add granularity a five-point scale can’t capture.
Closed-Ended Questions vs. Open-Ended Questions
The key difference comes down to structure: closed-ended questions limit respondents to fixed responses, while open-ended questions let them answer freely in their own words.
The table below pairs six common survey topics so you can see the contrast side by side.
| Topic | Closed-ended version | Open-ended version |
| Satisfaction | How satisfied are you with our service? (1 to 5) | What made this experience satisfying or frustrating? |
| Ease of use | Was our website easy to navigate? (Yes/No) | What made our website easy or hard to navigate? |
| Likelihood to recommend | How likely are you to recommend us? (0 to 10) | Why did you give us that score? |
| Feature preference | Which feature do you use most? (Select one) | What would you change about this feature? |
| Purchase reason | What is your primary reason for buying? (Select one) | What almost stopped you from buying today? |
| Support experience | Rate your support experience: 1 (poor) to 5 (excellent), plus an optional comment box for detail | Describe your support experience in your own words |
That last row is worth calling out on its own. Pairing a rating scale with a comment box gives you comparable data for the dashboard and detailed feedback for the “why” behind it, all in one question.
Open text questions capture the qualitative data a fixed answer choice can’t, which is why the hybrid row works so well. If you’d rather browse the open-ended questions format in isolation, that guide covers wording and use cases in full.
When to Use Closed Ended Questions
Reach for closed-ended questions whenever you need structured, comparable data fast. They’re a staple of user research and market research alike, and they shine in four scenarios:
- Large-scale surveys where response time affects your completion rate
- Benchmarking studies that repeat over time and need consistent, comparable data
- Screening questions at the start of a survey, to route respondents correctly
- Any research objective that requires directly comparing answers across segments
If your goal doesn’t fit one of these, an open-ended question probably serves you better. The open-ended vs. closed-ended decision usually comes down to whether you need a number or a story, and well-placed follow up questions often give you both.
Not sure whether you need a full questionnaire vs. survey structure for your research objectives? That comparison breaks down which format fits which goal.
How to Write Effective Close-Ended Questions
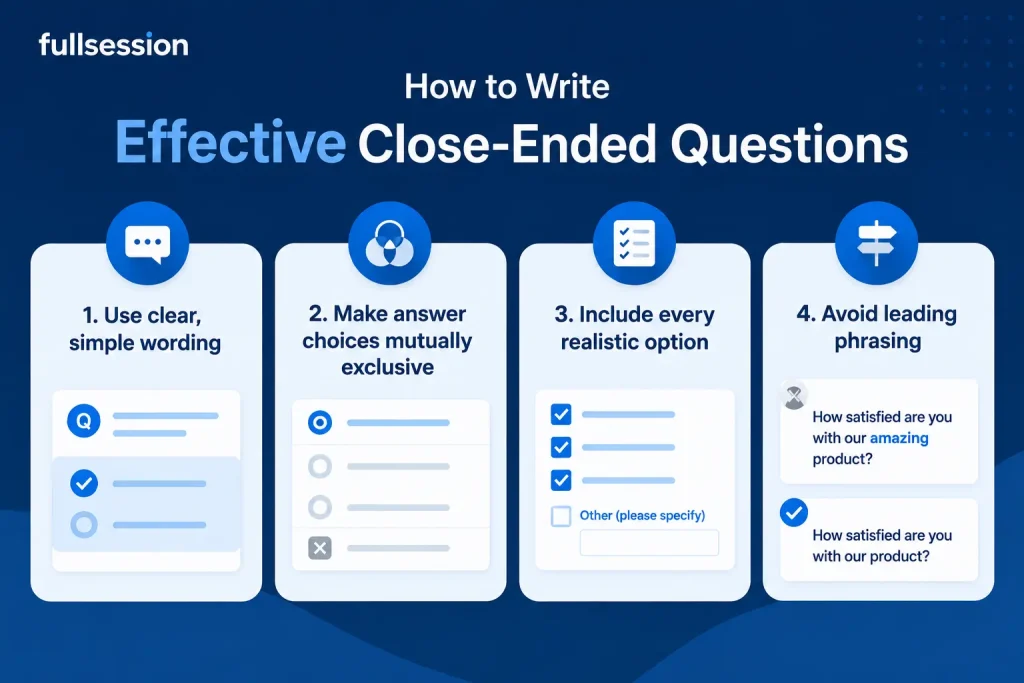
Good closed-ended questions follow four rules. Skip any one and your data gets noisier.
- Use clear, simple wording. Avoid jargon or phrasing that could be read two different ways.
- Make answer choices mutually exclusive. Overlapping ranges force respondents to guess which option applies to them.
- Include every realistic option. Missing a common answer choice from your list of possible answers pushes respondents toward the closest fit instead of their true perspective.
- Avoid leading phrasing. A question that hints at the “right” answer skews your results before a single response comes in.
Keep your rating scales balanced too, with equal room on the positive and negative side, or the quantifiable data you collect will always look better than reality.
Our guide to survey questions covers 90 examples spanning both closed and open formats if you want a broader library while you create surveys.
Advantages and Disadvantages of Using Closed-Ended Questions
Closed-ended questions trade depth for speed and consistency. Knowing both sides helps you decide when they’re the right tool.
Advantages:
- Survey responses are easy to quantify and analyze at scale
- Respondents answer faster, which improves completion rates
- Standardized answer options create structured data you can compare across segments
- Fixed responses reduce ambiguity, since there’s no interpretation required on your end
Disadvantages:
- Predefined answer choices limit the depth of insight you can collect
- Poorly worded options can push respondents toward an answer that doesn’t reflect their true perspective
- Complex topics can get oversimplified into a fixed set of choices that miss nuance
- A closed format alone can’t show new ideas your team hadn’t already considered
Neither list is a reason to avoid closed-ended questions. Pair them with open text questions wherever the “why” matters as much as the “what,” and keep building new skills around survey design as your program grows.
Close Ended Survey Questions by Use Case
Different survey goals call for different questions. Below you’ll find close-ended survey questions organized by the six scenarios most product and marketing teams run into.
Customer satisfaction
- How satisfied are you with your recent purchase? (1 to 5)
- Did our product meet your expectations? (Yes/No)
- How would you rate the quality of our customer support? (1 to 5)
- How likely are you to recommend us to a friend or colleague? (0 to 10)
- Rate your agreement: “The product meets my needs.” (Strongly disagree to strongly agree)
- How would you rate the value for money of this product? (Poor to excellent)
- Was your issue resolved on your first contact with support? (Yes/No)
- How satisfied are you with our response time? (Very dissatisfied to very satisfied)
Onboarding and activation
- Did you complete account setup without help? (Yes/No)
- How easy was it to get started with the product? (1 to 5)
- Which onboarding step took the longest? (Select one)
- Did you understand what to do next after signing up? (Yes/No)
- How confident do you feel using the core features? (Not confident to very confident)
- Did you complete the setup checklist? (Yes/No)
- Which resource helped you the most during onboarding? (Select one)
- How many days did it take you to reach your first meaningful result? (Select a range)
Checkout and conversion
- Did you find the checkout process easy to complete? (Yes/No)
- What almost stopped you from completing your purchase? (Select one)
- Rate the checkout process from difficult to easy. (1 to 5)
- Did you experience any errors during checkout? (Yes/No)
- Which payment method did you use? (Select one)
- How likely are you to purchase from us again? (0 to 10)
Product feedback and feature priority
- Which feature do you use most often? (Select one)
- How important is this feature to your workflow? (Not important to very important)
- Rank these features in order of importance to you. (Ranking)
- Have you used our mobile app in the last 30 days? (Yes/No)
- How would you rate the reliability of this feature? (1 to 5)
- Which feature would you like us to improve first? (Select one)
Demographic and segmentation
Need a longer list of demographic questions for surveys? That guide has more options for age, income, and household breakdowns.
- What is your age group? (Under 25, 25 to 34, 35 to 44, 45 and above)
- What is your employment status? (Full-time, part-time, self-employed, unemployed, student)
- What is your primary industry? (Select one)
- How many people work at your company? (Select a range)
- What is your job role? (Select one)
- Which region are you based in? (Select one)
Mobile-specific
- Did the app load quickly on your device? (Yes/No)
- How would you rate the mobile checkout experience? (1 to 5)
- Did you experience any issues using the app on your phone? (Yes/No)
- Which mobile device are you using? (iOS, Android, other)
- How easy was it to complete this survey on your phone? (1 to 5)
- Would you use our mobile app again? (Yes/No)
You now have a broader library to pull from than a single question type would give you.
See Which Questions Your Visitors Actually Answer
Sign up for FullSession and drop one of these questions into your product this week.
No credit card required.
Close Ended Question Examples for Mobile Devices
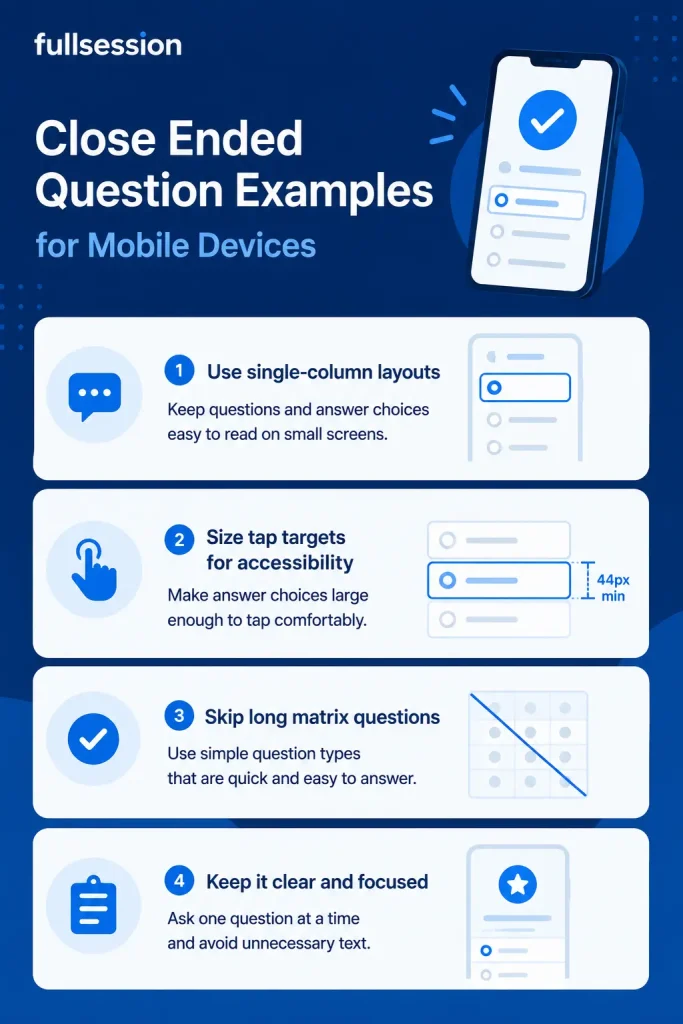
Mobile surveys need different formatting rules than desktop ones. A layout that works fine on a laptop screen can quietly kill your completion rate on a phone.
Use single-column layouts
Stick to single-column radio buttons instead of dropdowns or multi-column layouts. According to Nielsen Norman Group, a user experience research firm, single-column layouts outperform multicolumn designs because they give respondents a single, predictable path down the screen.
Skip long matrix questions
A grid of ten rating items that’s readable on desktop turns into a cramped, easy-to-mistap mess on a five-inch screen. That layout invites respondents to just pick the same answer down the whole column instead of giving you their true perspective.
Size tap targets for accessibility
Make sure every tap target meets accessibility sizing standards. A button that’s too small to hit accurately adds friction you don’t need, especially in an in-app survey.
A few other mobile-specific habits help too:
- Keep each question to one screen; scrolling within a single question adds drop-off.
- Use short, one word answer options where possible instead of long labels that wrap awkwardly.
- Test your survey on an actual phone, not just a resized browser window, before you launch.
Integrating Closed Questions with FullSession
Writing the right question is only half the job. You still need a way to put it in front of real users without waiting on the engineering team.
In-app feedback widget
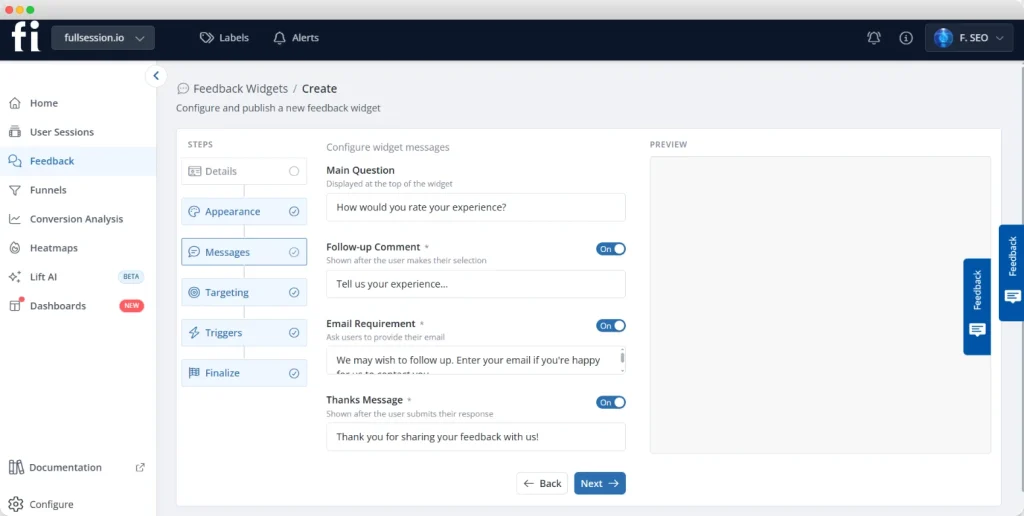
FullSession, our all-in-one user behavior analytics platform, is built around this exact problem. Its feedback widgets, forms, and surveys are the features most directly tied to everything covered in this guide.
Add a widget to any page without heavy development work, then drop in any of the close-ended question examples above.
You choose exactly where and when each question appears, whether that’s a single-question popup after checkout or a short multi-question flow at the end of onboarding.
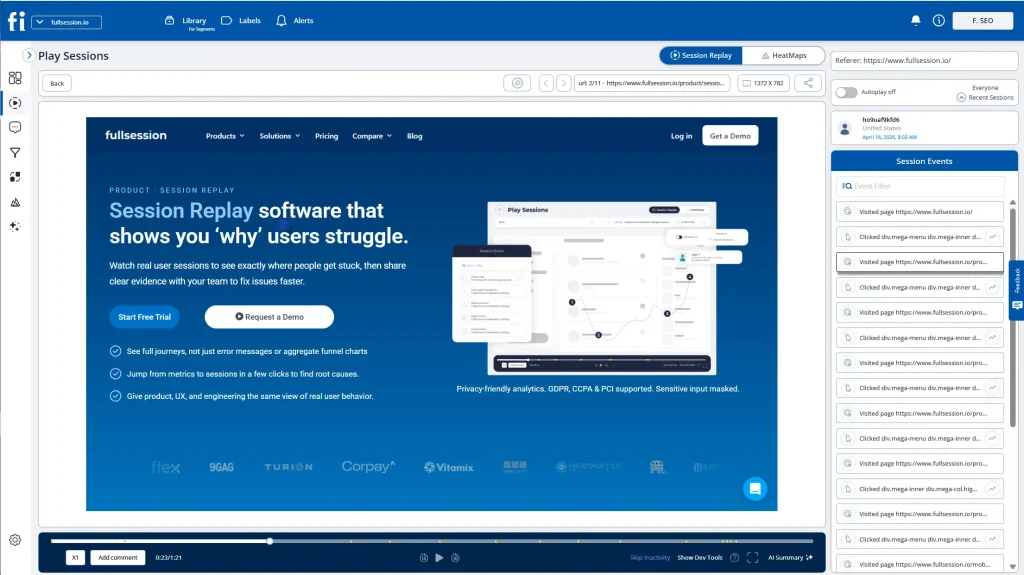
Every response can link directly to the session behind it, so you see the answer and the behavior that led to it in one place.
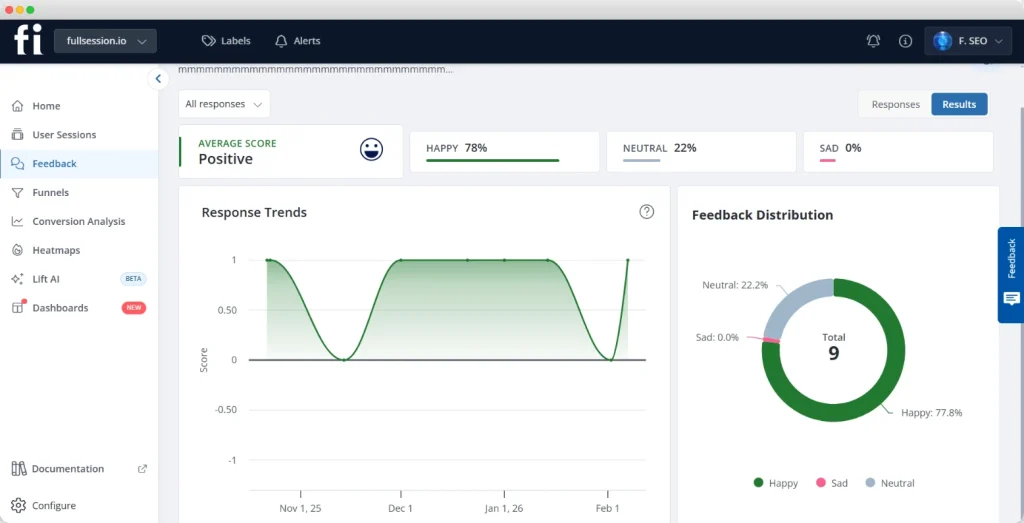
Responses land in your dashboard as structured data, giving you direct insight into what’s working without waiting on a manual export.
Supporting features
Other FullSession features add context around the widget’s responses and help you collect feedback more reliably.
- Session replay and heatmaps show you what a respondent did right before answering, so you can validate timing and trigger placement.
- Funnel analysis segments responses by whether someone completed or abandoned the flow
- Safety and security practices keep consent and data handling compliant throughout.
For teams that outgrow the basics, FullSession offers the following features too.
- Lift AI prioritizes friction points by impact, and errors and alerts flag the bugs behind a low score.
- Mobile session replay covers iOS and Android
- MCP server exports survey data into other workflows.
See How Feedback Widgets Work in Practice
Reach out and we’ll walk you through setting up your first closed-ended survey.
Avoiding Leading Questions and Bias
Use these tips to avoid leading phrasing before it reaches a live survey:
- Read every question aloud. If it sounds like you’re hoping for a specific answer, rewrite it.
- Remove loaded adjectives. Words like “amazing,” “frustrating,” or “easy” plant an opinion before the respondent forms their own.
- Use the funnel technique. Ask a general question first, then narrow to something specific. Starting broad reduces priming.
- Balance every scale. An uneven number of positive and negative options quietly pushes respondents toward one side.
- Pilot test with a small group. A handful of test respondents will usually catch phrasing you missed on your own.
Analyzing Closed-Ended Data and Reporting
Once responses start coming in, these steps turn raw answers into something you can act on. This is where statistical analysis earns its keep.
- Calculate frequencies and percentages for each answer option. This is the same first step used when testing product-market fit with survey data.
- Cross-tabulate results by key segments, like plan tier, device type, or region. A satisfaction score that looks flat overall might be masking a real problem in one segment.
- Visualize the results with bar charts and trend lines when you report to stakeholders. A chart communicates a shift in customer research findings faster than a table of raw numbers.
- Link your survey segments back to session replay recordings. When a group rates checkout poorly, watching their actual sessions shows you the friction behind the number.
- Compare results against past waves if you run the same closed-ended question on a recurring basis. Trend lines catch a slow decline in measuring satisfaction before a single low score would.
Conclusion About Close-Ended Question Examples
Close-ended questions give you fast, comparable data. Open-ended follow-ups tell you why that data looks the way it does, and the right tool shows you the behavior behind both.
You now have several examples for every major use case, the formatting rules that keep response options clean, and the analysis steps that turn answers into a real report.
If you’ve been collecting customer feedback without a clear system for reporting it, start with the questions above.
Ready to Put These Questions in Front of Real Users?
Launch your first survey today, no credit card required.
FAQs About Close-Ended Question Examples
What are 5 closed-ended questions?
Five examples include: “Did you find what you were looking for?” (Yes/No), “How satisfied are you with our service?” (1 to 5), “How often do you use our product?” (Daily, weekly, monthly, rarely, never), “Which device do you use most?” (Mobile, desktop, tablet), and “Would you recommend us?” (Yes/No).
What are closed-ended questions?
Closed-ended questions are survey questions that give respondents a fixed set of answer choices, such as yes/no, multiple choice, or rating scale options. They produce structured, quantitative data that’s easy to measure and compare, which is why they’re common in customer feedback and market research.
What is a simple closed question?
A simple closed question is a dichotomous, or two-option, question like “Do you own a smartphone?” with Yes or No as the only choices. It requires no interpretation and takes a respondent only a second or two to answer, which makes it ideal for screening questions at the start of a survey.
What are five examples of open-ended questions?
Five examples include: “What could we do to improve your experience?”, “Why did you choose our product over a competitor’s?”, “What almost stopped you from completing your purchase?”, “How would you describe your support experience?”, and “What feature would make the biggest difference for you?”

Roman Mohren is CEO of FullSession, a privacy-first UX analytics platform offering session replay, interactive heatmaps, conversion funnels, error insights, and in-app feedback. He directly leads Product, Sales, and Customer Success, owning the full customer journey from first touch to long-term outcomes. With 25+ years in B2B SaaS, spanning venture- and PE-backed startups, public software companies, and his own ventures, Roman has built and scaled revenue teams, designed go-to-market systems, and led organizations through every growth stage from first dollar to eight-figure ARR. He writes from hands-on operator experience about UX diagnosis, conversion optimization, user onboarding, and turning behavioral data into measurable business impact.