Amplitude is a solid product analytics platform, but teams regularly hit the same walls.
The learning curve is steep. Every new feature relies on manual event tagging. Engineering support becomes a constant dependency just to keep data flowing. Pricing scales faster than the value it delivers.
These problems usually show up at the wrong time. A product manager needs an answer before a launch, and finds out the event was never tracked. A growth team wants to test a hypothesis and waits a week for engineering to ship the tracking. A marketing lead opens a dashboard and sees numbers that don’t match what the rest of the team is reporting. The tool meant to speed decisions starts slowing them down.
If any of that sounds familiar, you’re not alone. You’re also not short on options. This guide covers seven Amplitude alternatives evaluated across feature depth, pricing transparency, qualitative data coverage, ease of use, and accessibility for non-technical users.
These factors matter because the best Amplitude alternatives should not only track user behavior but also help teams understand it without creating extra technical work. A strong option should balance product analytics, behavioral analytics, pricing clarity, and practical usability for product and marketing teams.
Whether you need a like-for-like replacement for quantitative analytics or a tool that adds the qualitative context Amplitude can’t give you, one of these fits your situation.
Key Takeaways
According to Mordor Intelligence, the product analytics market was valued at $11.39 billion in 2025 and is expected to reach $25.73 billion by 2031, growing at a 14.55% CAGR. The category is growing fast, and the number of credible Amplitude competitors is only expanding.
The tools below each address a different analytics need, whether that is cleaner event tracking, automatic data capture, session replay, web analytics, or enterprise reporting.
This matters because not every team needs the same type of analytics platform. Some teams need deeper event data and cohort analysis, while others need real user sessions, qualitative data, or clearer website analytics.
Here’s the short version of where each one fits.
- FullSession: The strongest pick when you need to see what users actually experienced, with session replay, heatmaps, error tracking, in-app feedback, funnel analysis, and Lift AI prioritization in one platform.
- Mixpanel: A suitable product analytics platform for teams that want deep event tracking, cohort analysis, and path analysis without heavy engineering setup.
- Heap: A practical choice when manual event tagging is slowing your team down, thanks to autocapture and retroactive event definition.
- PostHog: A good fit for engineering-led teams that want an all-in-one stack with self-hosting, transparent pricing, and an active user community.
- FullStory: Built for enterprise UX teams that need pixel-perfect session capture, frustration signals, and strict compliance controls.
- Google Analytics: Commonly used by marketing teams tracking detailed web acquisition metrics, traffic sources, and conversions at no cost.
- Adobe Analytics: The enterprise pick when you’re already running inside the Adobe Experience Cloud and need advanced segmentation and customer journey analytics.
If you’re weighing the list and want a single starting point, FullSession is the most practical place to begin. It fills the gap most teams discover only after they’ve already invested in a quantitative analytics tool: the inability to clearly identify the exact reasons users are dropping off.
Book a demo and see how FullSession analyzes real user sessions.
How We Evaluated Amplitude Competitors
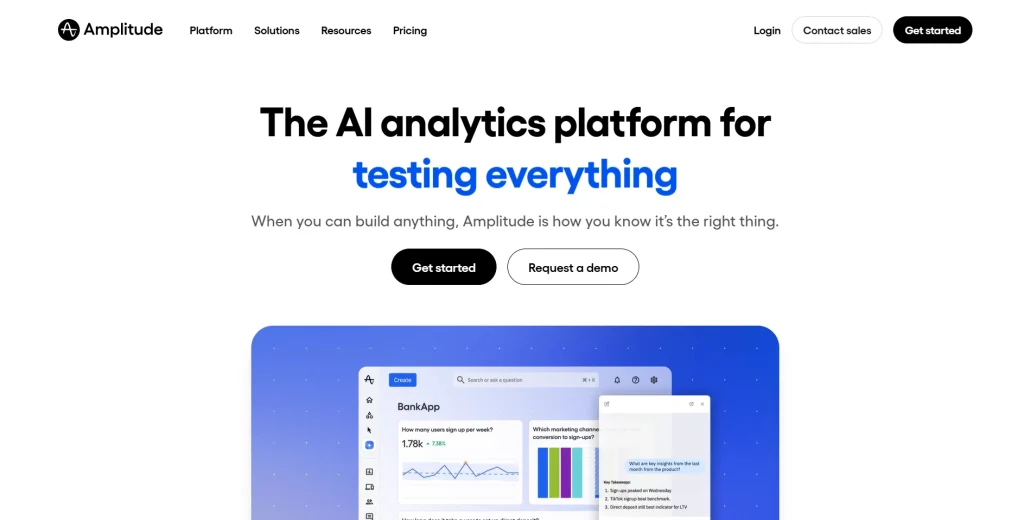
We assessed every tool in this list against six criteria covering the key capabilities teams actually depend on. No tool earned a spot here based on brand recognition alone.
- Feature depth: Does the tool cover the analytics workflows product and marketing teams actually need, including funnels, cohort analysis, path analysis, and user retention? Or is it limited to surface-level reporting?
- Ease of use: Can non-technical users set up dashboards and explore behavioral data without filing an engineering ticket every time?
- Pricing transparency: Is pricing visible without a sales call? Does the model scale predictably as data volume grows?
- Qualitative data coverage: Does the tool only show aggregate numbers like funnel drop-offs and event counts, or can your team watch real user sessions to understand what happened before users got stuck, left, or failed to convert?
- Integrations: Does it connect to the rest of a typical SaaS stack, including data warehouse tools, CRMs, and messaging platforms?
- Ease of use and accessibility: Can product managers, growth teams, and other non-technical users set up dashboards, explore behavioral data, and build custom reports independently, or do they need engineering support for every change?
These criteria make it easier to compare each analytics tool based on real workflow needs, not just feature lists. The goal is to understand which platform fits different teams, data volume, and user behavior analysis requirements.
Best Amplitude Alternatives at a Glance
The table below gives you the high-level view. Each tool is covered in detail in the sections that follow.
| Tool | G2 Rating | Best For | Top Feature | Starting Price |
| FullSession | 5.0 | Product teams needing session context and funnel data | Session Replay with Lift AI | Free trial; paid from $23/mo (billed annually) |
| Mixpanel | 4.5 | Product managers needing event-based retention analysis | Cohort analysis with path analysis | Free tier; custom pricing |
| Heap | 4.4 | Teams that want zero manual event setup | Autocapture | Free tier; custom pricing |
| PostHog | 4.5 | Engineering-led startups wanting an all-in-one stack | Open-source, self-hostable | Pay-as-you-go |
| FullStory | 4.5 | Enterprise UX teams needing pixel-perfect session data | DX Data with session replay | Not publicly available |
| Google Analytics | 4.5 | Marketing teams tracking web acquisition | Traffic and conversion reporting | Free |
| Adobe Analytics | 4.2 | Enterprise data science and marketing operations | Advanced segmentation with CJA | Custom pricing; contact sales |
7 Amplitude Alternatives You Should Consider in 2026
The list below covers the main use cases, from product analytics platforms with deep event tracking to behavioral analytics tools with session replay, heatmaps, and user behavior insights, so you can choose the right fit based on your team size, data needs, and budget.
1. FullSession
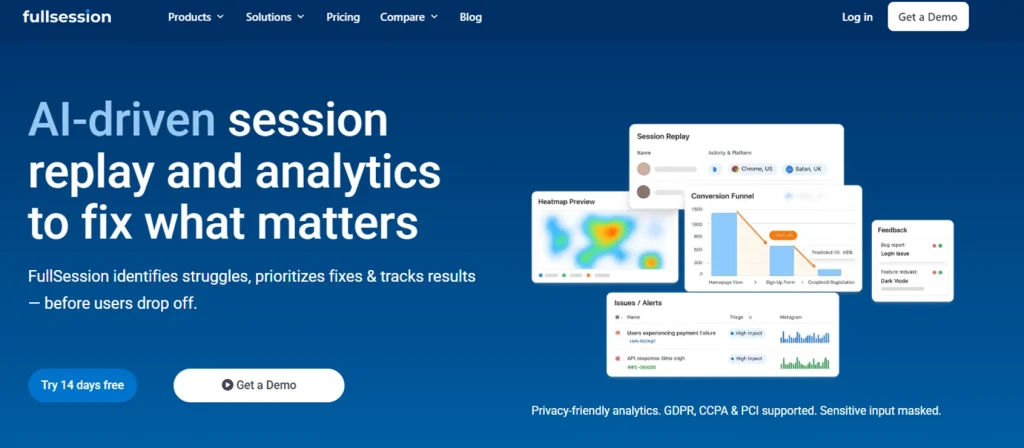
FullSession is a behavioral analytics platform built for ecommerce, product and marketing teams who need to understand not just what users do, but why they do it. Pure product analytics tools deliver aggregate counts and funnel drop-off percentages.
That gap matters when teams need to diagnose user behavior, feature usage, and conversion issues with real evidence. FullSession adds qualitative data through actual user sessions, helping teams see the user journey behind the numbers.
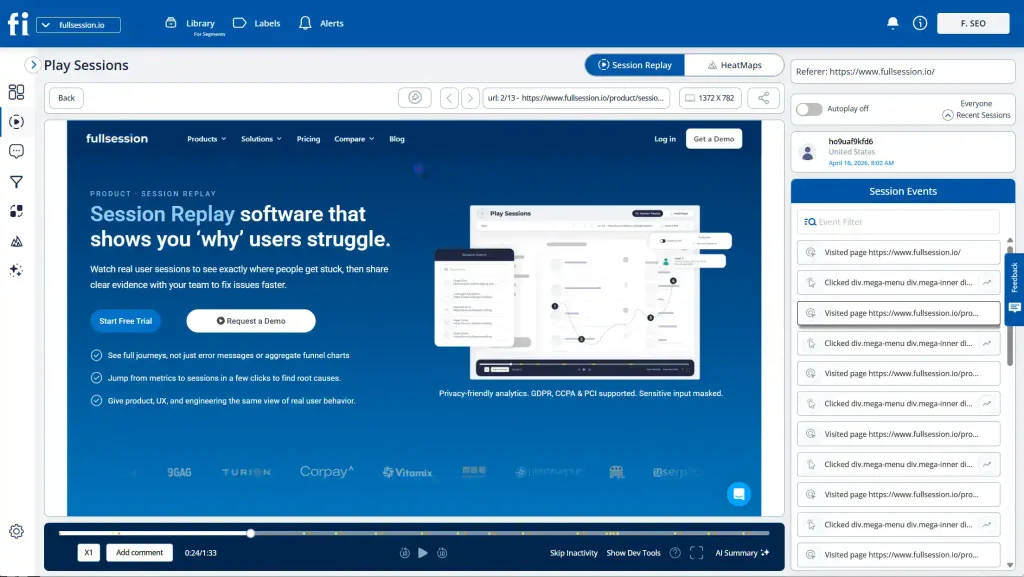
FullSession captures real user sessions across the entire user journey.
That means teams can watch exactly what happened in the product before a user dropped, churned, or converted. The platform combines session replay, heatmaps, funnel and conversion tracking, in-app messaging and feedback widgets, and error and alert tracking in a single interface.
Lift AI automatically scans recorded sessions and shows which usability issues are likely to have the biggest impact on conversions. After fixes are made, it also helps validate the results, so teams can see whether their changes actually improved the user experience and conversion flow.
This helps product and marketing teams move from manual review to prioritized action. Instead of watching random user sessions, teams can focus on the real user sessions most likely to explain friction, user behavior, and conversion problems.
Teams do not have to manually review hundreds of recordings to find the problems worth fixing.
Best for
E-commerce, product teams and CRO specialists who need to connect quantitative funnel data to real user sessions and qualitative insights, without stitching together several tools.
Key features
- Session replay: Shows real user sessions, including clicks, scrolls, mouse movement, and rage clicks, so teams can see how users interact with the product.
- Heatmaps: Shows where users click, scroll, and spend attention, helping teams find weak CTAs, ignored sections, and layout issues.
- Funnels and conversions: Tracks where users drop in signup, onboarding, checkout, or conversion flows, then connects that drop-off to actual user sessions.
- Feedback widgets: Collect in-app messaging responses, user surveys, and page feedback to explain why users are stuck or leaving.
- Errors and alerts: Flag JavaScript errors, broken flows, and technical issues that affect user behavior and conversions.
- Lift AI: Finds important friction points in session data and helps teams decide what to fix first.
- Mobile session replay: Records user sessions on mobile apps and mobile web to show how mobile users experience the product.
- Privacy controls: Masks sensitive customer data, supports PCI-compatible masking, and helps teams meet privacy standards such as GDPR and CCPA while reviewing usage data safely.
Pricing
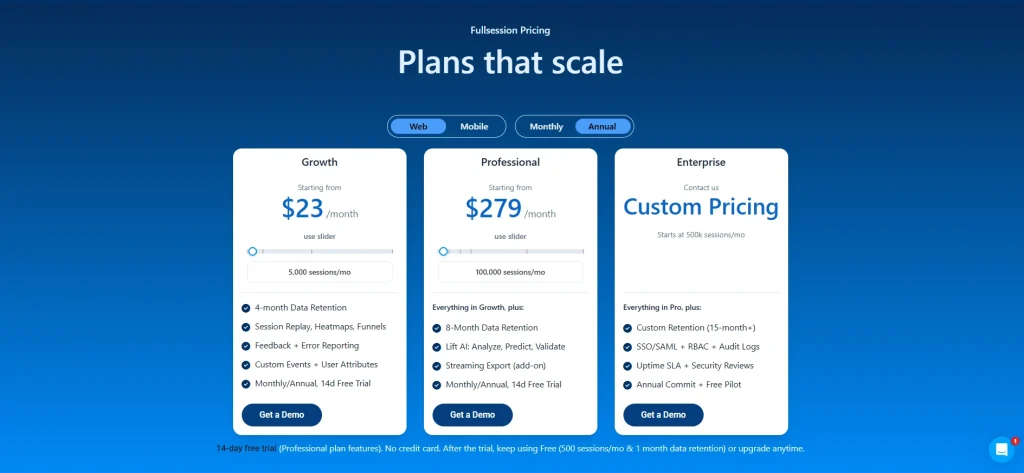
FullSession offers a 14-day free trial that includes 500 sessions/month & 1 month data retention. FullSession web plans start at $23/month on annual billing for the Growth plan, with 5,000 sessions/month and 4-month data retention.
Growth includes session replay, heatmaps, funnels, feedback, error reporting, custom events, and user attributes.
The Professional plan starts at $279/month for 100,000 sessions/month and adds 8-month data retention, Lift AI, and streaming export as an add-on. Enterprise uses custom pricing and starts at 500K sessions/month.
Check the FullSession pricing page for current plan details.
Start a free trial to see how FullSession works on real user sessions. No credit card required, and setup takes under five minutes.
2. Mixpanel
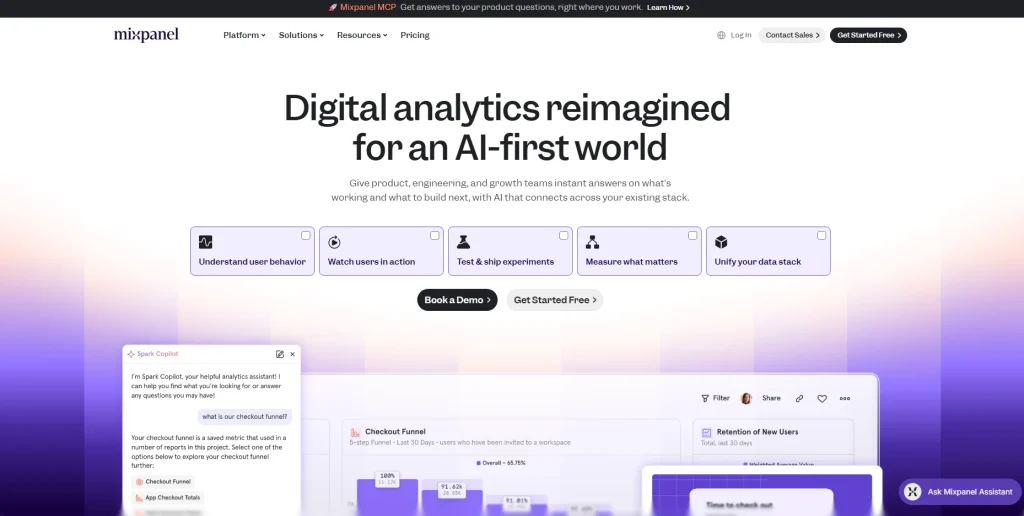
Mixpanel is an event-based product analytics platform focused on user engagement, user retention, and funnel performance. Its core strength is the depth of its event data model.
Teams can track user behavior at a granular level, run cohort and path analysis, and conduct A/B testing without exporting data to a separate warehouse. Mixpanel also supports session recordings through its session replay feature.
It’s a quantitative analytics tool that answers what happened, not what it looked like when it happened.
- Learn more about Mixpanel alternatives
- See Mixpanel vs Amplitude comparison
- Compare Mixpanel vs Google Analytics
- See how Hotjar, Mixpanel, and Contentsquare compare
Best for
Product managers and data analysts at B2B and B2C SaaS companies who need detailed event tracking, retention reporting, and the ability to build custom reports without heavy engineering support.
Key features
- Event tracking: Captures every user interaction as a discrete event with user attributes and properties attached.
- Funnel analysis: Builds multi-step funnels with conversion rates, time-to-convert, and drop-off analysis.
- Cohort analysis: Groups users by shared behaviors or attributes and tracks performance over time.
- Path analysis: Maps the actual paths users take through a product before or after a key action.
- A/B testing: Runs built-in experiments to test product changes against user segments.
- Session replay (beta): Records user sessions through a limited beta feature.
- Custom dashboards: Builds drag-and-drop dashboards for sharing key metrics with product and marketing teams.
Pricing
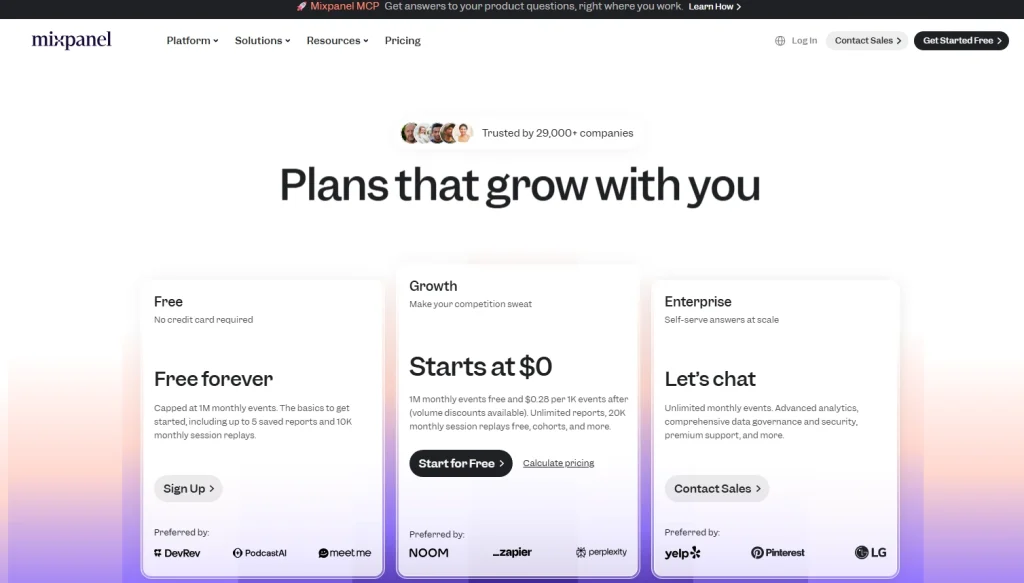
Mixpanel has a free plan with up to 1M monthly events, limited saved reports, and session replay allowance. Paid usage is based on monthly event volume.
For larger teams or higher data volume, Growth and Enterprise plans add more advanced features, data warehouse options, and support.
3. Heap
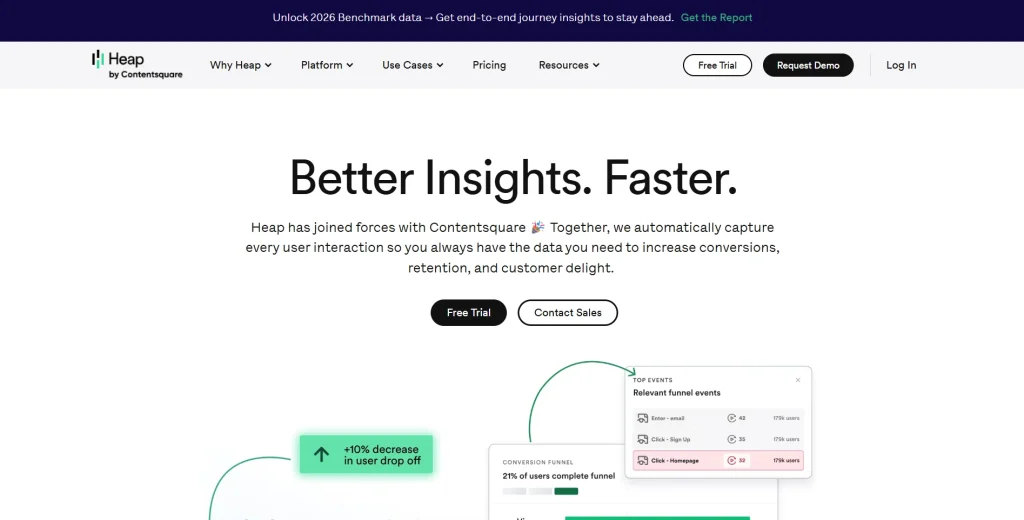
Heap is a product analytics platform built around autocapture. The moment the tracking code is installed, Heap begins recording all user interactions automatically, without requiring manual event tagging for each action.
Teams can retroactively define events after the data has already been collected. If a product team forgot to tag a feature launch, Heap already has the data. They just need to name it.
That’s the defining advantage over tools like Amplitude or Mixpanel.
Learn more about Heap alternatives
Best for
Product teams that want complete event data without ongoing engineering involvement for event setup and maintenance.
Key features
- Autocapture: Records all clicks, form submissions, page views, and user interactions from day one without manual tracking.
- Retroactive event definition: Defines and names events after the fact using data that was already captured.
- Funnel analysis: Builds multi-step funnels on top of autocaptured data.
- Cohort analysis: Groups users into behavioral cohorts based on any combination of captured events.
- Session replay: Ties session recordings directly to event data so teams can jump from an aggregate funnel view to individual sessions in one click.
- Data governance: Manages and organizes the event taxonomy as the product scales.
- Heap Connect (data export): Exports data directly to warehouses including Snowflake, BigQuery, and Redshift.
Pricing
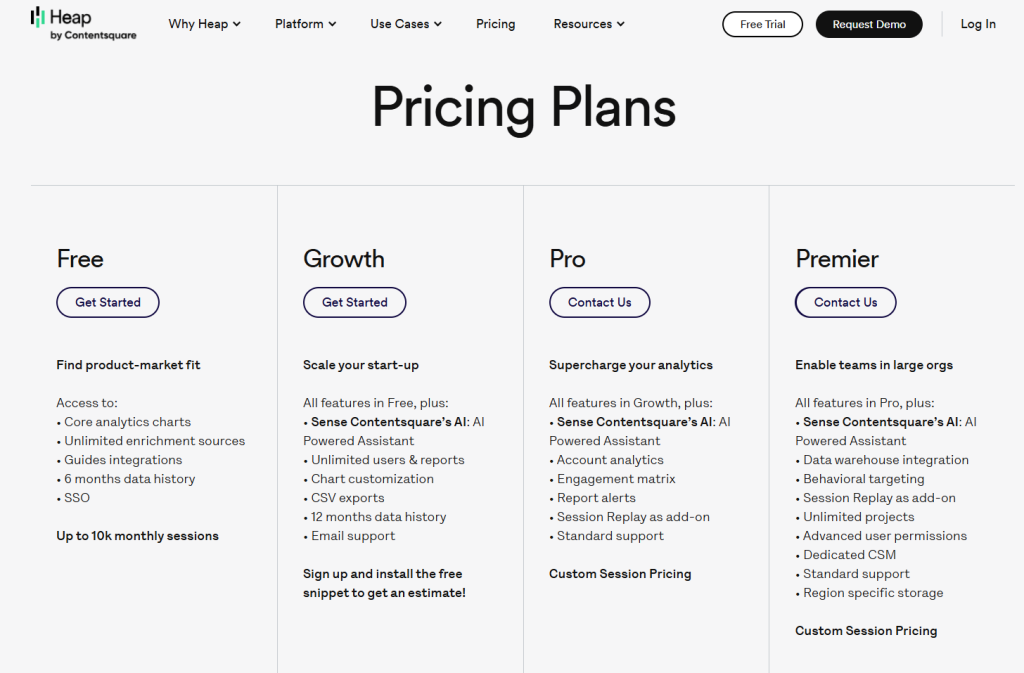
Heap offers a free plan with up to 10K monthly sessions, core analytics charts, enrichment sources, SSO, and 6 months of data history.
Growth adds unlimited users and reports, CSV exports, email support, and 12 months of data history. Pro and Premier use custom session pricing, with session replay, heatmaps, and error analysis available as add-ons.
4. PostHog
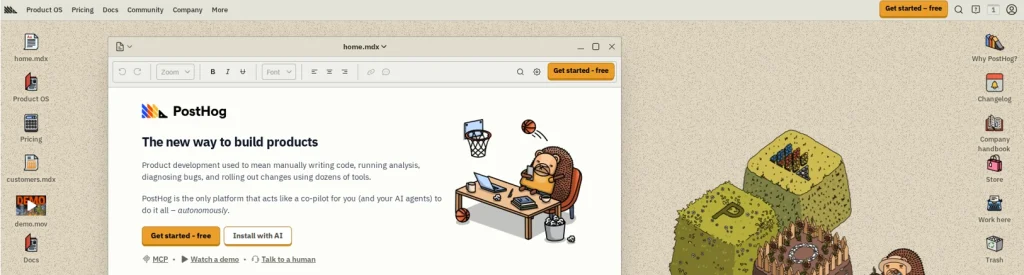
PostHog is an open-source, all-in-one analytics platform that combines product analytics, session replay, feature flags, A/B testing, user surveys, error tracking, and group analytics in a single self-hostable product.
This makes it useful for engineering-led teams that want product analytics, behavioral data, and experimentation tools in one place. Teams can track feature usage, analyze user segments, and connect event data with session replay without relying on multiple separate data tools.
For teams with full data ownership requirements, PostHog is the only tool on this list that can run entirely on the team’s own infrastructure.
The platform suits engineering-led organizations that want to consolidate their analytics, experimentation, and feature rollout tooling in one place. Its open-source model means there’s an active user community and a transparent public roadmap.
Learn more about PostHog alternatives.
Best for
Engineering-led startups and scale-ups that want an all-in-one analytics and experimentation stack with transparent pricing, self-hosting capability, and open-source flexibility.
Key features
- Product analytics: Delivers full event-based analytics with funnels, retention, paths, and custom dashboards.
- Session replay: Captures real user sessions with filters tied directly to analytics events.
- Feature flags: Rolls out features gradually and targets releases by user segments.
- A/B testing: Runs experiments inside the same analytics platform so results tie directly to behavioral data.
- User surveys: Collects in-app survey responses for qualitative data alongside quantitative metrics.
- Error tracking: Surfaces JavaScript errors and exceptions tied to specific user sessions.
- Group analytics: Tracks behavior at the account or organization level rather than only at the individual user level.
Pricing
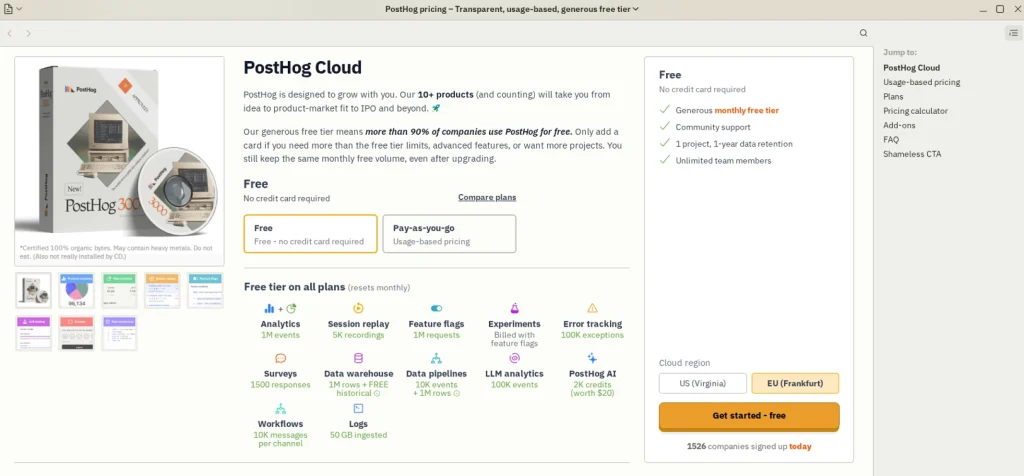
PostHog has a free tier with 1M analytics events, 5K session replay recordings, 1M feature flag requests, and 1-year data retention.
Beyond the free tier, pricing is usage-based by product, including product analytics, session replay, feature flags, surveys, error tracking, and data warehouse usage. Teams can set billing limits to control spend.
5. FullStory
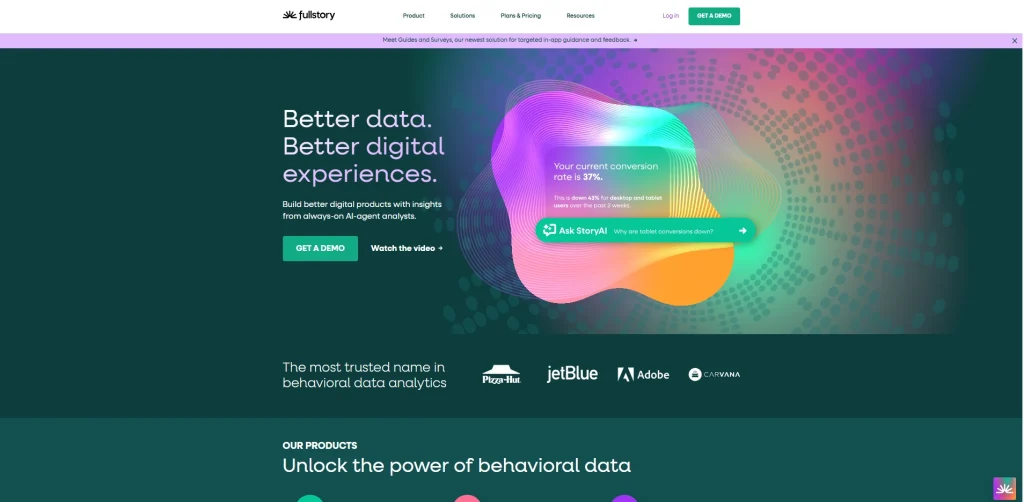
FullStory is a digital experience intelligence platform that captures and replays user sessions in detail. Its DX Data model, a structured representation of every digital interaction, powers both its session replay and its product analytics capabilities.
FullStory is known for the depth of its session capture. It also offers compliance controls for enterprise customers who need to handle usage data carefully under GDPR, CCPA, or HIPAA requirements.
For a broader comparison of session recording and replay tools in this category, including how FullStory compares to lighter-weight options, the FullSession blog covers the field in depth.
- Learn more about FullStory competitors
- See our FullSession vs FullStory guide
- Compare Hotjar vs FullStory
- See how Hotjar, Crazy Egg, Mouseflow, and FullStory compare
Best for
Enterprise product and UX teams that need deep session replay with advanced analytics, frustration signal detection, and strict data compliance requirements.
Key features
- Session replay: Records detailed user sessions at scale with privacy masking controls for sensitive data fields.
- DX Data: Captures every interaction as a queryable data point through FullStory’s structured behavioral data model.
- Funnel analysis: Builds conversion funnels on top of DX Data with direct links to relevant session recordings.
- Rage click and frustration signals: Surfaces moments of user frustration automatically, including rage clicks, dead clicks, and error clicks.
- User segments: Segments users by any combination of identity, behavioral data, and device attributes.
- Heatmaps: Aggregate click and scroll data into visual maps built from the same session data.
- Data export: Exports behavioral data to a data warehouse or connects via API for custom analysis.
Pricing:
Fullstory offers a free plan with 30,000 monthly sessions, 12 months of data retention, core session replay, basic analytics, and debugging tools for up to 10 users.
Paid plans require contact sales. Business, Advanced, and Enterprise plans add advanced product analytics, dashboards, heatmaps, funnels, user segmentation, data export, mobile analytics, and StoryAI options.
6. Google Analytics

Google Analytics, now primarily GA4, is the most widely used web analytics tool globally. It’s a free platform built around website analytics, tracking traffic sources, sessions, conversions, and audience behavior across web properties.
Google Analytics focuses on detailed web acquisition metrics rather than on the behavioral analytics and product instrumentation that tools like Amplitude, Mixpanel, or FullSession provide. It’s not a product analytics platform built for tracking in-app events and user journeys through a SaaS product.
- See Google Analytics vs Amplitude comparison guide
- Compare Hotjar vs Google Analytics
- Compare Mixpanel vs Google Analytics
Best for
Marketing teams and digital analysts reporting on acquisition and website performance who need detailed web acquisition metrics, traffic source reporting, and goal conversion tracking at no cost.
Key features
- Traffic source reporting: Breaks down where new users come from, including organic search, paid, social, referral, and direct traffic.
- Goal and conversion tracking: Tracks custom conversion events tied to specific user actions on a website.
- Audience segmentation: Builds user segments based on demographic data, behavior, and acquisition source.
- Custom reports: Creates exploration reports and dashboards for non-standard views of website analytics data.
- BigQuery integration: Exports raw event data to Google BigQuery for analysis in a data warehouse environment.
- Real-time data: Shows a live view of active users on the site and which pages they’re viewing.
- Exploration reports: Runs funnel exploration, path exploration, and cohort analysis for web-focused teams.
Pricing
Google Analytics is free for standard website analytics and app performance tracking. It helps marketing teams monitor traffic sources, events, conversions, user behavior, and web analytics data.
For enterprise teams, Google Analytics 360 is the paid version. It adds higher data limits, advanced reporting, BigQuery export, service-level support, and deeper integration with the Google Marketing Platform. Pricing is quote-based.
7. Adobe Analytics
Adobe Analytics is an enterprise-grade analytics platform within the Adobe Experience Cloud environment. It’s built for large organizations that need advanced segmentation, customer journey analytics, real-time data streams, and deep integration with Adobe’s marketing and advertising tools.
Unlike every other analytics tool on this list, Adobe Analytics isn’t designed for self-serve use by product managers or growth teams. It requires heavy setup work, dedicated engineering support, and a formal onboarding process.
The marketing analytics capabilities it provides are thorough, but they come with a corresponding investment in time and cost.
Best for
Enterprise marketing and data science teams running large-scale digital operations that need advanced analytics tightly integrated into the Adobe Experience Cloud.
Key features
- Advanced segmentation: Multi-dimensional segment builder with real-time segment qualification across large data volumes.
- Customer journey analytics: Cross-channel customer journey analytics that stitch together behavioral data across web, mobile apps, and offline sources.
- Predictive analytics: Built-in machine learning features for anomaly detection, contribution analysis, and predictive scoring.
- Real-time Data Streams: Live data processing with sub-second latency for time-sensitive marketing decisions.
- Data Warehouse Integration: Direct integration with enterprise data warehouse environments for historical data analysis at scale.
- Custom Attribution: Multi-touch attribution models built on top of granular data and ad spend.
- Marketing Analytics: Full integration with Adobe Advertising, Target, and Experience Manager for closed-loop marketing analytics across the Adobe stack.
Pricing
Adobe Analytics does not list public starting prices. Pricing is quote-based and depends on the selected package, such as Select, Prime, or Ultimate.
How to Choose the Right Amplitude Alternative
The right tool depends on which gap you’re actually filling. Work through these five questions before making a decision.
Do you need quantitative event data, qualitative session context, or both?
Tools like Mixpanel, Heap, and PostHog cover the quantitative side well. They handle funnels, cohort analysis, user retention, and event tracking at scale.
That makes them useful for teams that rely on event data and cohort analysis to measure user retention. The trade-off is that quantitative product analytics alone may not explain the user behavior behind each drop-off.
If your team has looked at a funnel and asked “Why are users dropping here?” without a good answer, you need qualitative data alongside the numbers.
This context is important because users drop for different reasons, such as confusion, technical errors, weak messaging, or poor user experience. Qualitative data helps teams move beyond the number and understand what actually happened before the user left.
Session replay and heatmap tools like FullSession fill that gap by showing you the actual user sessions behind the drop-off.
For a deeper look at evaluating this category, see our guide on how to pick a session replay tool.
How much engineering bandwidth do you have for setup and maintenance?
Manual event tagging requires ongoing engineering involvement. Every new feature, every renamed button, every updated flow needs someone to update the tracking.
This creates a real risk for teams that rely on accurate event data. If tracking is delayed or missed, product managers and growth teams may lose visibility into feature usage, user interaction, and the wider user journey.
Heap’s autocapture removes that dependency almost entirely. PostHog and FullSession both offer simpler setup paths than Amplitude for teams that lack a dedicated data engineering function.
That difference matters for non-technical users who need to pull data, build custom dashboards, or review behavioral analytics without waiting on engineering support for every small change.
If your team has lost data because a product release outpaced your event tracking, this question should drive your decision.
What is your data volume, and how does it map to pricing models?
Amplitude’s pricing scales with monthly tracked users, which creates unpredictable costs as a product grows. Mixpanel uses a similar model.
This makes pricing an important comparison point, especially for teams with growing data volume, new users, or expanding product usage across web and mobile.
PostHog charges per event beyond the free tier. Data retention policies also vary. Some tools limit how far back you can query historical data on lower-tier plans, which matters if your team needs to compare behavior across quarters.
FullSession and FullStory price on sessions rather than events, which can be more predictable for products with consistent traffic patterns. Adobe Analytics and Heap both require contact sales, which adds friction but also means pricing can be negotiated.
For a fair comparison, teams should check how each analytics platform handles data retention, usage data, advanced features, and data export before choosing a plan.
Do you need session replay and heatmaps alongside analytics?
If your team’s workflow involves investigating conversion problems, diagnosing UX issues, or validating design changes with real evidence rather than aggregate metrics, you need session recordings combined with behavioral analytics.
This is where qualitative data becomes important. Session replay and heatmaps help teams connect user behavior, user interaction, and actual user sessions to the numbers they see in funnels or dashboards.
FullSession, PostHog, and FullStory all offer session replay. Mixpanel has a beta session replay feature. Heap has replay tied to its event data. Google Analytics and Adobe Analytics don’t offer session replay.
Do you have compliance requirements (GDPR, CCPA, HIPAA)?
Enterprise tools like FullStory and Adobe Analytics have the most mature compliance frameworks. FullSession offers GDPR and CCPA compliance with PCI-compatible data masking. PostHog’s self-hosted option gives teams full control over where user data lives and how it’s processed.
This matters because analytics tools often collect behavioral data, user sessions, user attributes, and customer data. Teams should review masking controls, data retention, data export, and compliance documentation before tracking sensitive usage data.
If data residency or regulatory compliance is a hard requirement, confirm the tool’s specific certifications before committing.
Which Option Should You Pick?
| Team Type | Recommended Tool(s) | Explanation |
| Product-led SaaS team | FullSession or Mixpanel | FullSession covers the qualitative gap (real user sessions, heatmaps); Mixpanel covers event-based retention and cohort analysis. Together, they address the full picture. |
| Marketing team | Google Analytics | Detailed web acquisition metrics at no cost; sufficient for traffic, conversion, and audience reporting without requiring product instrumentation. For teams also wanting session insight, consider FullSession alongside it. |
| Engineering-led startup | PostHog | All-in-one stack (analytics, replays, feature flags, A/B testing) with self-hosting option, transparent pricing, and an active user community. |
| Enterprise | FullStory or Adobe Analytics | FullStory for enterprise teams whose core need is digital experience data and deep session replay. Adobe Analytics for organizations running inside the Adobe Experience Cloud environment with advanced marketing analytics needs. |
| Budget-constrained startup | FullSession (free plan) or PostHog (free plan) | Both offer free plans that do not require contact sales to get started. FullSession includes 500 monthly sessions on its free plan, while PostHog includes 1M analytics events and 5K session replay recordings per month. Teams needing session replay for e-commerce or SaaS workflows may find FullSession practical. |
Why Choose FullSession
Teams looking for alternatives to Amplitude usually arrive at FullSession when they realize the gap they’re trying to fill isn’t about more event coverage. It’s about understanding why users behave the way they do.
Amplitude and its category peers, including Mixpanel, Heap, and PostHog, answer the “what” well. They’ll tell you that 40% of users drop off at step three of a funnel. What they can’t show you is what those users were experiencing when they left.
What did they click on? What error did they encounter? What form field confused them? What happened right before they closed the tab?
FullSession fills that gap. Here’s how it compares to the rest of the category.
Consolidated tooling in one platform
Most teams trying to answer the “why” pay for three or four separate tools. FullSession covers session replay, interactive heatmaps, conversion funnels, error and alert monitoring, in-app feedback, and mobile session replay for iOS and Android in a single subscription.
This gives teams one place to review behavioral analytics, user sessions, feature usage, and qualitative data without switching between separate tools.
Everything connects on the same dashboard from day one.
How Lift AI prioritizes fixes
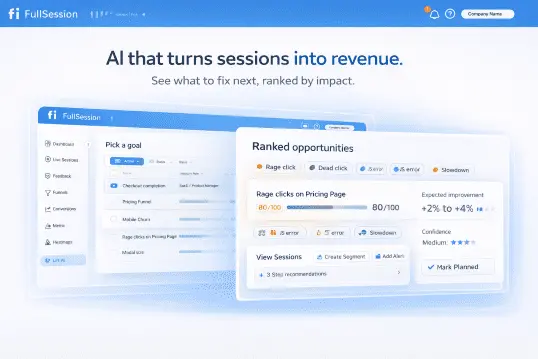
The harder problem in analytics isn’t collecting data. It’s deciding which problem to fix first. Lift AI scans recorded sessions, ranks friction points by expected revenue impact, and links each priority to the specific session replays where the issue occurs.
This helps teams connect user behavior, actual user sessions, and conversion problems to the fixes most likely to matter. It also reduces the time spent manually reviewing recordings without a clear priority.
When a fix ships, Lift AI checks whether the change actually moved the metric.
Accessibility for non-technical users
FullSession’s interface is built so that product managers, marketers, and customer success teams can navigate it without engineering support.
This makes it easier for non-technical users to review user behavior, find useful insights, and understand user sessions without waiting for a data or engineering team.
Filters, session search, and heatmap views surface answers in a few clicks, avoiding the steep learning curve that tools like Amplitude are known for.
Proactive issue detection
Rage clicks, dead clicks, and JavaScript errors are flagged in real time. Teams see broken flows before they reach a support ticket, rather than waiting for customers to report them.
SDK performance
FullSession’s SDK runs asynchronously on a separate thread, which leaves Core Web Vitals untouched. Teams get full behavioral coverage across web and mobile apps without the performance penalty that heavier SDKs introduce.
Transparent pricing
The free plan covers 500 sessions per month. Paid plans start at $23/month, billed annually, with the Growth tier including 5,000 sessions, heatmaps, funnels, feedback, error reporting, custom events, and user attributes.
Professional starts at $279/month and adds higher session limits, longer data retention, Lift AI, and streaming export as an add-on.
Every tier is published publicly, which is a lower entry point than enterprise-only alternatives such as FullStory and Adobe Analytics.
Privacy and compliance
Sensitive form inputs are masked by default. GDPR, CCPA, and PCI DSS compliance are built in, with no additional privacy modules or custom configuration required.
Customer support
FullSession’s support team responds personally rather than through queue-based auto-replies, and the product team tracks customer feature requests and ships them on a regular cadence.
Where FullSession adds clear value
- Investigating why users drop off on a specific onboarding step and identifying the exact friction in the recording.
- Using heatmaps to improve SaaS activation to find which parts of a new feature users are ignoring.
- Running funnel analysis to find drop-off, then using Lift AI to prioritize which recordings to watch first.
Want to explore FullSession at your own pace?
Use the free trial to review real user sessions, session replay, heatmaps, and funnel data in your own workflow before choosing a paid plan.
Start a free trial. No sales call required to get started.
Conclusion About Amplitude Alternatives
The seven tools covered here represent the main directions teams take when they leave Amplitude or evaluate it alongside other analytics tools. These are established data tools with real differences in how they collect, process, and surface behavioral information.
- Mixpanel and Heap are the closest feature competitors, with different positions on the manual-versus-automatic event tracking trade-off.
- PostHog suits engineering-led teams that want a unified analytics and experimentation stack.
- FullStory and Adobe Analytics serve enterprise teams with specific compliance and platform-environment requirements.
- Google Analytics remains the right choice for marketing teams whose primary need is website analytics and acquisition reporting.
- FullSession occupies a distinct position. It’s the tool that fills the qualitative gap the others leave open.
If your team can see where users drop but can’t see why, session replay and heatmaps alongside your existing product analytics platform will give you what the numbers alone can’t.
The right tool is the one that matches your team’s actual workflow, your data volume, and the specific question you’re trying to answer.
Start a free trial and see how FullSession works on a real user session. No credit card required. Setup takes under five minutes.
FAQ’s About Amplitude Competitors
Who competes with Amplitude?
Amplitude’s main competitors are Mixpanel, Heap, PostHog, FullStory, and FullSession. Mixpanel competes directly in event-based product analytics, Heap differentiates with autocapture, and PostHog adds experimentation and self-hosting. FullStory and FullSession focus on session replay and behavioral analytics, covering the qualitative gap that pure product analytics tools leave open.
What is better than Amplitude?
No tool is universally better than Amplitude. The right choice depends on your team’s needs. Heap removes manual event tagging through autocapture. PostHog bundles analytics, session replay, feature flags, and A/B testing in one platform. FullSession adds session replay and qualitative context that Amplitude doesn’t offer on its own.
What is the alternative to Amplitude?
The closest alternatives are Mixpanel and Heap, which offer comparable event-based analytics with different setup models. PostHog suits engineering-led teams that want an open-source, all-in-one platform. FullSession works for teams that need session replay and qualitative behavioral data alongside their product analytics. Google Analytics covers web acquisition but doesn’t replace in-product analytics.
Is Amplitude like Google Analytics?
No. Google Analytics focuses on web acquisition metrics, including traffic sources, sessions, and goal conversions on a website. Amplitude is a product analytics platform built for tracking how users interact with a product after signing up, covering event tracking, funnels, cohorts, and retention. Teams often use them together, but they aren’t interchangeable.
What are Amplitude’s main competitors?
Amplitude’s main competitors are Mixpanel, Heap, PostHog, FullStory, and FullSession. Mixpanel is the most direct, with a similar event-based model. Heap challenges Amplitude with autocapture. PostHog adds experimentation. FullStory and FullSession bring session replay into the category. Adobe Analytics and Google Analytics sit at the edges, covering enterprise marketing and website analytics, respectively.
Which is better, Mixpanel or Amplitude?
Both are closely matched on core capabilities. Amplitude is stronger on behavioral and predictive analytics. Mixpanel is preferred for its simpler data model, more accessible pricing, and lower engineering overhead. For teams without a dedicated analyst, Mixpanel is easier to maintain. For teams needing deep behavioral analytics with setup capacity, Amplitude offers more out of the box.

Roman Mohren is CEO of FullSession, a privacy-first UX analytics platform offering session replay, interactive heatmaps, conversion funnels, error insights, and in-app feedback. He directly leads Product, Sales, and Customer Success, owning the full customer journey from first touch to long-term outcomes. With 25+ years in B2B SaaS, spanning venture- and PE-backed startups, public software companies, and his own ventures, Roman has built and scaled revenue teams, designed go-to-market systems, and led organizations through every growth stage from first dollar to eight-figure ARR. He writes from hands-on operator experience about UX diagnosis, conversion optimization, user onboarding, and turning behavioral data into measurable business impact.