Author: Mohamed Sehwail
-
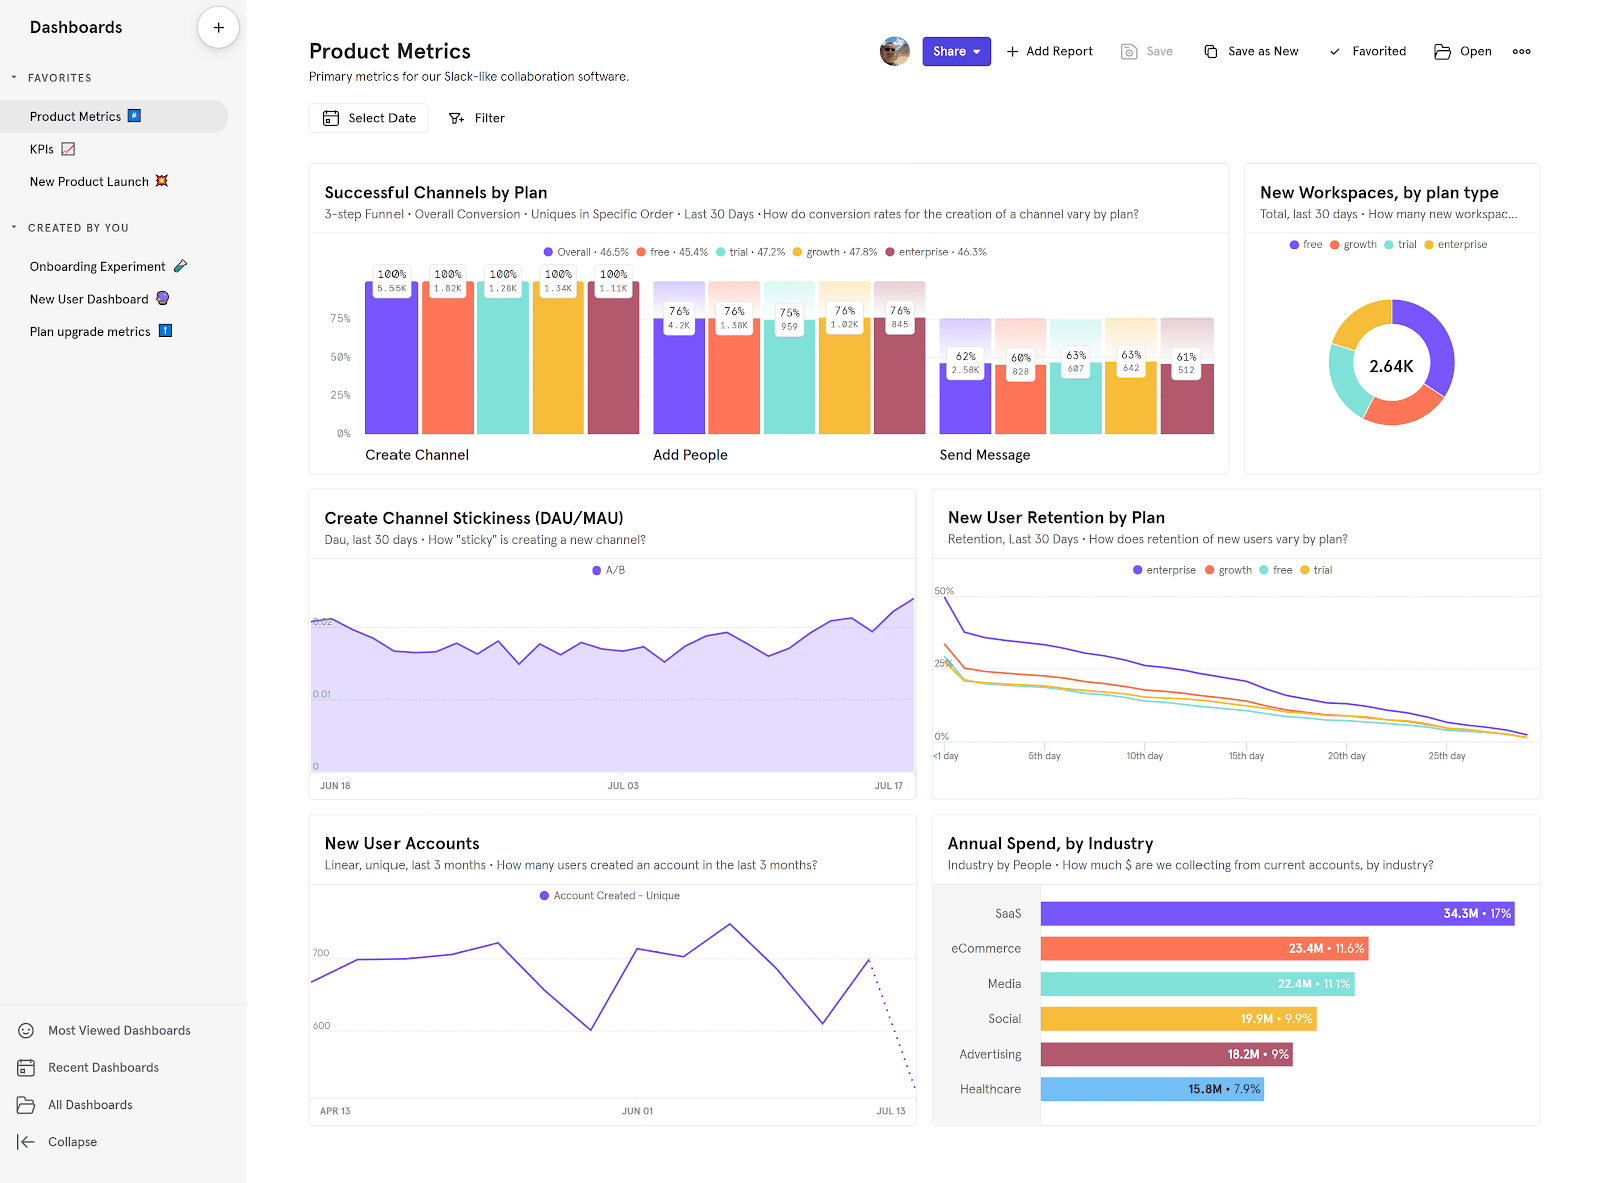
We Tried 5 Mixpanel Alternatives: Here’s Our Feedback
With so much web analytics software available today, finding one that best suits your business needs can be challenging. Mixpanel is a helpful tool for gaining actionable insights into your products and users. It offers various features for monitoring user activities, collecting customer data, and analyzing user behavior. However, flaws like a steep learning curve…
-
We Tried Hotjar vs Mixpanel vs Clicktale: Here’s Our Feedback
Selecting the right web analytics software can take time and effort, especially when comparing Hotjar vs Mixpanel vs Clicktale. At this point, you may wonder which of these web analytics tools provides the best features before you invest your hard-earned money. NEXT STEPS Apply this to your product Compare: FullSession vs Hotjar Heatmaps (see friction…
-
We Tried Hotjar vs Inspectlet: Here’s Our Feedback
Choosing the right user behavior platform is crucial for understanding how your website visitors interact with your site and making improvements to boost your results. Today, we’ll explore two popular options: Hotjar vs Inspectlet. Product teams favor both solutions, but each has its advantages and drawbacks. For example, Hotjar can sometimes slow down your website…
-
11 Best Ways To Use UX Analytics Tool For Your Website
Providing a relevant and meaningful user experience is essential for any website, but defining what makes up a good user experience can be challenging. Luckily, UX analytics tools can help you better understand user behavior so you can know exactly what kind of UX to offer your users. We created FullSession after thorough research of…
-
How to Read a Heatmap and What You Can Learn From It
It takes 0.05 seconds for a user to form an opinion about a web page. So, how do you make sure your visitors get the best user journey possible? You must stay ahead of your competitors and use all available tools to learn more about your customers and how they interact with your website. And…
-

Top 9 User Behavior Tools in 2025
You’ve probably heard of user behavior tools before. You can use them to monitor user behavior, measure user engagement on websites and mobile apps, track user activity, monitor user flows, heat maps, scroll maps, and clickstreams on your web pages. These tools provide many benefits, such as improved conversion rates, increased sales, improved customer experience,…
-
The Customer Feedback Report: What You Need to Know
There are nearly two billion websites nowadays and around five billion active internet users around the globe. If you have an online business, people worldwide visit your website 24/7. It’s not easy to stand out from the crowd in such a vast ocean of easily accessible information. Anonymous raw data collection is no longer enough…
-
Click Maps 101: How to Make the Most of Your User Data
The first step in optimizing your web presence is understanding website visitors’ click patterns. You can view click maps to learn how many people clicked on each section of your website and if they found what they were looking for. Click map data will help you understand your audience and allow your company to make…
-
23 Best CRO Tools of 2025
Success in conversion optimization isn’t guaranteed, regardless of your experience. Since every user has unique needs, testing various CRO strategies is crucial for addressing your target audience’s preferences. CRO tools offer valuable insights to improve your conversion rates. To help you find the right solution, we’ve created this list that reviews top options and their…
-
We Tried LogRocket Competitors: Here’s Our Feedback
Usability testing is critical for online businesses. If your website is complex, poorly structured, or malfunctioning, users may leave before engaging with your products or services. Studies reveal that 61% of users will abandon a site if they can’t find what they need within about five seconds. You must use web analytics tools to evaluate…