A customer feedback report turns scattered comments, survey scores, and support tickets into a structured document. It tells your team exactly what to fix first.
Most companies collect plenty of customer feedback. Few turn it into a report that anyone actually acts on.
This guide covers how to source feedback, measure it with the right metrics, and analyze it without losing weeks to manual tagging. You’ll also see how pairing feedback with real user behavior closes the gap most reports leave open.
Key Takeaway
- A customer feedback report only earns its place if it answers what customers are saying, whether sentiment is trending up or down, which issues show up most often, and what the team should do about it in priority order.
- CSAT, CES, and NPS each answer a different question, so tracking only one leaves blind spots that let churn build quietly.
- Feedback comments explain the symptom, not the root cause; pairing them with session data turns a vague complaint into a specific, fixable issue.
- Prioritization should weigh frequency, severity, and expected revenue impact, not just how often an issue is mentioned.
- Closing the loop by telling customers what changed is what keeps future feedback coming in, and what most reports skip entirely.
FullSession brings feedback, session replay, heatmaps, and Lift AI’s revenue-based prioritization together on the same session data, so a comment turns into a specific fix your team can trust instead of another line in a spreadsheet.
What Is a Customer Feedback Report

Image source: Pixabay
A customer feedback report is a structured summary of customer feedback analysis. It shows what customers are saying, how they feel, and which issues matter most to fix.
It pulls from surveys, support conversations, reviews, and in-app comments, then organizes that input into themes, sentiment, and priorities your team can act on.
A working customer feedback strategy treats the report as a recurring artifact, not a one-off document. Product managers use it to decide what ships next; support leads use it to spot friction before it becomes churn.
Marketing uses it to see how customers describe the product in their own words. Good customer feedback management means every team trusts the same numbers, whether they collect customer feedback through surveys or support tickets.
Every report should answer four questions:
- What are customers saying, in their own words?
- Is sentiment trending positive or negative, and where?
- Which issues show up most often, and for which customers?
- What should the team do about it, in priority order?
If a report can’t answer all four, it’s a data dump, not a report.
Why Customer Feedback Reports Matter for Business Growth
Customer experience now decides who wins a customer, not just who keeps one.
- According to Gartner, roughly 80% of organizations expect to compete mainly on the basis of customer experience rather than price or features.
- According to PwC, 73% of customers say their experience with a company is a top factor in their purchase decisions.
That shift changes what a feedback report is for. It’s no longer a support-team artifact; it’s a business growth input.
A structured report supports the business directly:
- Customer retention improves when a team catches customer dissatisfaction before it shows up as canceled accounts.
- Customer loyalty grows when customers see feedback shape the product or service they use.
- Marketing strategies get sharper when messaging reflects how loyal customers actually talk about the product.
- Long term business success depends on treating customer perception as a metric worth tracking over time.
Improve customer satisfaction consistently, and the report becomes proof the work is paying off, not just a list of complaints.
Customer Feedback Sources and Collection Methods

Image source: Pixabay
You can’t build a report from one channel. Customers leave signals in different places, whether through dedicated customer feedback tools or simpler customer feedback collection tools built into your existing stack.
| Source | Best Use Case |
| In-app surveys | Capturing reaction to a specific feature or flow, right when it happens |
| Customer support tickets | Showing recurring friction points and unresolved bugs |
| Customer support chats and live chat | Catching real-time frustration in the customer’s own words |
| Reviews (positive reviews and negative reviews) | Understanding public perception and competitive positioning |
| Social media monitoring | Spotting issues customers won’t put in a formal survey |
To collect customer feedback consistently, combine active and passive channels.
- Active channels, like a customer feedback survey or a post-interaction customer satisfaction surveys prompt, ask directly.
- Passive channels, like customer service conversations and support tickets, capture feedback customers give without being asked.
A few practical notes on collection:
- Keep every customer feedback survey short. Long surveys lower response rates and skew results.
- Treat customer support interactions as a feedback source, not just a resolution channel.
- Don’t rely on reviews alone to gather feedback, and don’t limit yourself to one method to collect feedback either. The quiet middle rarely posts on review sites.
- Use survey data as a baseline, but layer in unprompted comments to catch what structured questions miss.
Collect Feedback Without Stitching Together Five Separate Tools
With FullSession, you can set up your first feedback widget in minutes. No credit card required.
Types of Customer Feedback Data
Not all customer feedback data looks the same. Treating it all the same way is where most reports go wrong.
Quantitative data is anything you can count: a 1-to-5 satisfaction score, an NPS rating, a percentage of respondents who chose a given answer. It’s fast to analyze but tells you what happened, not why.
Qualitative data is open-ended: a comment, a support transcript, a review. It’s slower to process, but it carries the context quantitative scores miss.
Feedback data also splits by sentiment:
- Positive customer feedback validates what’s working and should stay unchanged.
- Negative feedback flags what to fix, and usually carries the most urgency.
- Positive or negative feedback that’s mixed or neutral often hides the most useful detail, since customers explaining a middling experience tend to be specific.
A report that only tracks scores and ignores qualitative feedback will tell you satisfaction dropped 8 points. It won’t tell you why. Reviewing qualitative vs. quantitative data side by side helps you decide which channel to invest in next.
Customer Satisfaction Metrics: CSAT, CES, and NPS
Three metrics carry most of the weight in a customer feedback report, each answering a different question.
| Metric | Scale | Best Use Case | Limitation |
| CSAT (customer satisfaction score) | Usually 1 to 5 | Measuring reaction to a specific interaction or feature | Doesn’t predict loyalty or future behavior |
| CES (customer effort score) | Usually 1 to 7 | Measuring how easy a process or task was to complete | Narrow scope, since it only reflects effort, not overall sentiment |
| NPS (net promoter score) | -100 to +100 | Measures customer loyalty and likelihood to recommend | A single-question score offers little diagnostic detail on its own |
CSAT asks a simple question right after an interaction: “How satisfied were you with X?” It’s fast to collect, but one bad support ticket can drag a score down without reflecting the broader relationship.
CES measures friction, not happiness. A customer can be satisfied with a task’s outcome while rating the effort as high, a gap that’s one of the most reliable early signals of churn risk.
NPS asks whether a customer would recommend the product to someone else. It’s useful for tracking loyalty trends over time, but a single score without qualitative follow-up tells a team almost nothing about what to fix.
If you’re comparing options, this roundup of the best NPS software breaks down what to look for.
Here’s the watch-out with all three: satisfied customers on one metric can still churn if another metric is quietly declining. Track all three, not just the one that’s easiest to report.
Customer Feedback Analysis Methods
Once feedback is collected, customer feedback analysis turns raw input into findings.
- Categorization: tag each piece of feedback by topic, like billing or onboarding, so volume by category becomes visible.
- Sentiment analysis: score each comment as positive, negative, or neutral to track shifts over time.
- Thematic analysis: group tagged feedback into recurring themes, not just individual tickets.
- Trend analysis: compare themes and sentiment across time periods.
Teams can analyze customer feedback manually with spreadsheets, and for low volume, that’s often good enough. Manual analysis breaks down once volume grows past a few hundred responses a month, since tagging gets inconsistent between reviewers and the time cost stops being worth it.
Customer feedback analysis tools with built-in sentiment scoring and auto-tagging solve the volume problem, though the output is only as useful as the categories behind it.
However you categorize feedback, the categories need to map to decisions your team can actually make, which a periodic customer satisfaction analysis helps confirm.
Combining Customer Feedback with User Behavior Data
A comment that says “the checkout was confusing” tells a team something happened, but not which step, button, or customer hit the problem. That gap is where most feedback reports stall.
User behavior data closes that gap.
Pairing feedback with the session it came from turns “this was confusing” into a specific rage click, or a point where customer interactions with a form dropped off. Customer behavior context doesn’t replace the comment; it explains it.
This is the layer most feedback tools skip. Feedback tools capture words, analytics tools capture clicks, and the two rarely live in the same place, which is exactly what behavior analytics is built to solve.
Using FullSession for In-App Feedback Collection and Reporting
FullSession is an AI-powered user behavior analytics software that helps product, customer success, QA, and marketing teams optimize their website and applications.
Its in-app feedback tool adds widgets, forms, and surveys directly onto a website, so customers can report friction the moment they feel it, not days later in a support ticket.
Here’s what makes it work, and how it connects to the rest of the platform.
How the feedback widget works
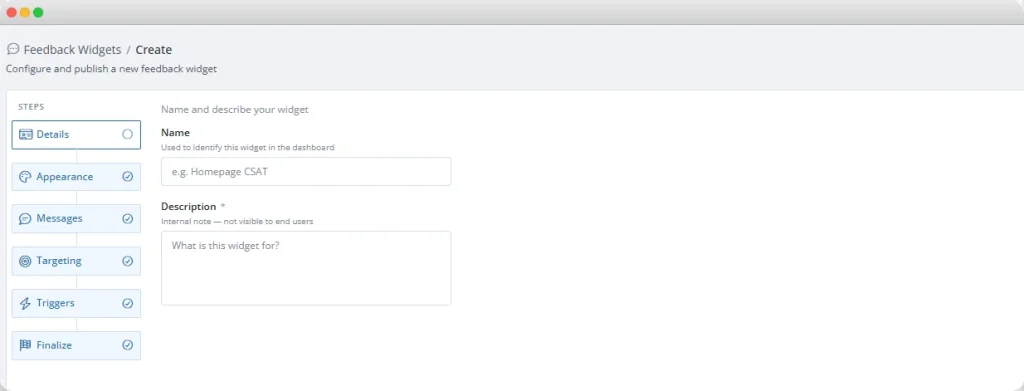
Setup takes minutes, not a dev sprint:
- Choose the trigger. Show the widget after signup, mid-checkout, on exit intent, or on a high-drop-off page.
- Choose the question. Ask something simple, like “Was this page helpful?”, or open-ended, like “What stopped you from finishing?”
- Choose the placement. Target specific pages or segments instead of surveying every visitor.
The script loads asynchronously. Adding a feedback form doesn’t slow the page down or hurt Core Web Vitals.
Where feedback connects to session replay and heatmaps
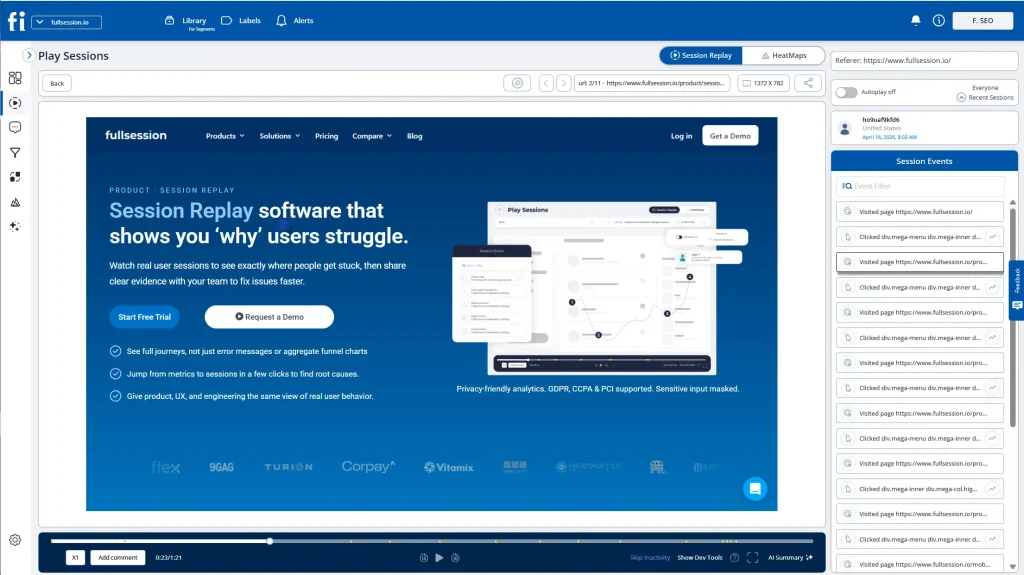
This is the part most standalone survey tools can’t do. Every submission in FullSession can link directly to the session recording it came from, so a comment like “the checkout was confusing” isn’t just text.
A teammate can open the exact session replay and watch what the customer did: where they hesitated, which field they rage-clicked, where they gave up.
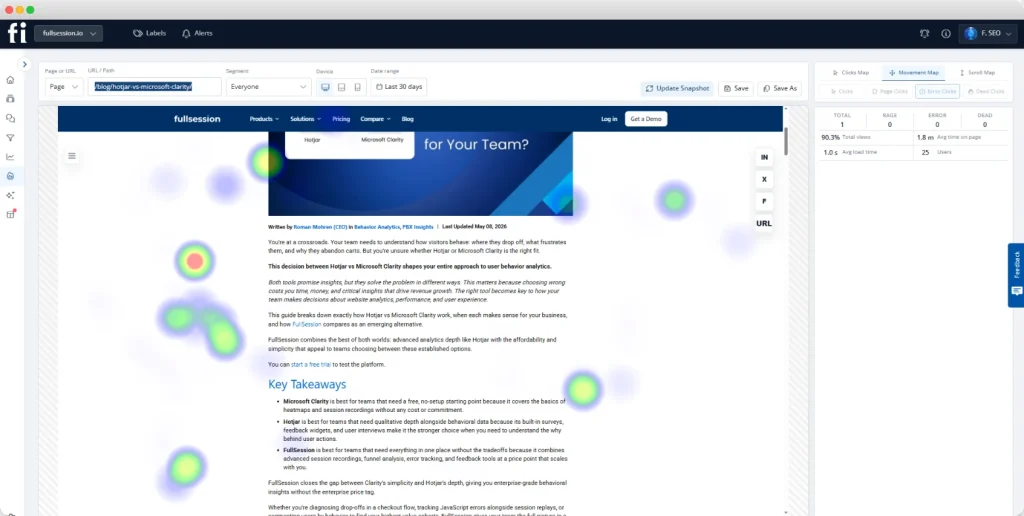
Pair that with FullSession’s interactive heatmaps, and a pattern across many sessions becomes visible at a glance. It’s not just one customer’s frustration; it’s where on the page frustration clusters across dozens of them.
Feedback channels stop being a separate data source and become one more layer on top of the session data your team already reviews for bugs and drop-offs.
That same session data is also queryable in plain language through the FullSession MCP server, which lets your AI assistant pull up the sessions behind a feedback theme on request, such as “find frustrated checkout sessions that mentioned payment issues this week,” instead of someone filtering dashboards by hand.
Analyzing feedback at scale
Once volume grows past a handful of comments, the report view groups submissions by category and shows a sentiment breakdown, so a team can scan user feedback for patterns instead of reading every response line by line.
That view sits next to session and journey data, so teams get actionable insights faster than piecing together a spreadsheet by hand. FullSession also sits alongside tools like GA4, adding the “why” behind numbers your analytics already show.
Feedback runs through the same privacy controls as the rest of the platform, so sensitive fields can be masked and retention adjusted to match your own compliance requirements.
One watch-out: don’t over-survey. Triggering customer surveys on every page trains customers to ignore them, so target moments where feedback is genuinely useful, after a friction point, not after every click.
See Feedback and Behavior in the Same View
See how FullSession connects what customers say to what they actually did on the page.
Identifying Trends and Patterns in Customer Feedback
A single comment is an anecdote. A pattern across dozens of comments is worth acting on.
To identify trends, look for:
- Recurring phrases: the same complaint or praise showing up in different customers’ words.
- Spikes in negative sentiment: tied to a specific release, page, or time period.
- Seasonal patterns: feedback volume or theme shifts tied to usage cycles, not product changes.
Trends matter more when segmented. Break feedback down by different customer segments, such as plan tier, account age, or use case: a complaint from 5% of free-tier users reads differently than the same complaint from 40% of enterprise accounts.
Before drawing a conclusion, check how many customers generated the pattern, and how many users were exposed to the flow. Five vocal customers out of five thousand isn’t the same signal as five out of fifty.
Root Cause Analysis and Feedback Prioritization
Identifying a pattern isn’t the same as knowing what to fix first. Root cause analysis closes that gap with four steps.
- Tag granularly. “Checkout issue” is too broad to act on. “Checkout: payment field validation error” routes to the right team.
- Map to customer journey stage. The same complaint means something different at onboarding than for an established customer. Customer priorities shift at each stage.
- Weigh by frequency and severity. A rare but severe issue, like data loss, often outranks a common but minor one, like a slow-loading tooltip.
- Prioritize. Rank the resulting list and commit to the top few. A prioritized list of twenty issues is not a prioritized list.
Unhappy customers rarely explain the root cause on their own; they explain the symptom. Root cause analysis turns “this is confusing” into “the second form field lacks a clear label,” a version a design or engineering team can actually fix.
Prioritizing by revenue impact with Lift AI
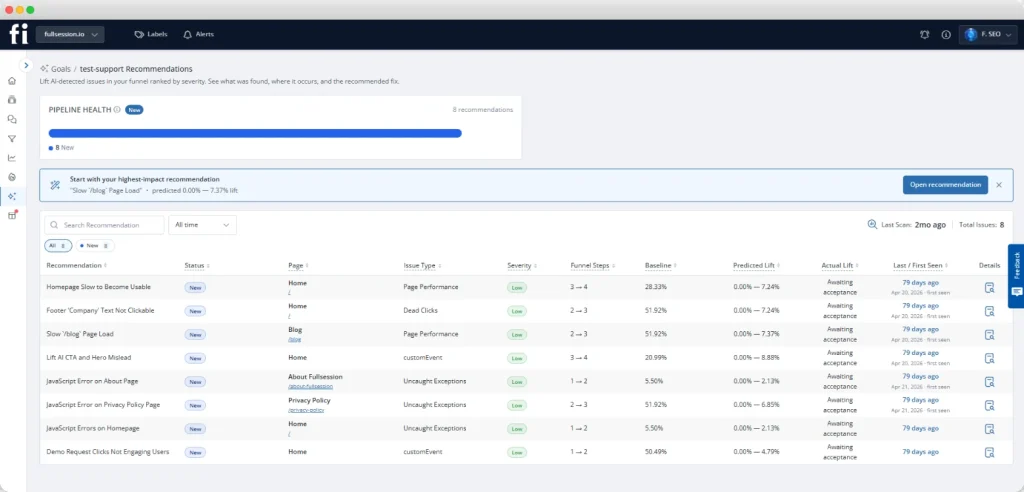
Ranking issues by frequency and severity gets you most of the way there, but it still leaves a judgment call: which fix actually moves revenue.
Lift AI, FullSession’s AI-powered prioritization layer, closes that gap by analyzing real sessions against a goal you set, like checkout completion or signup conversion, and returning a ranked list of opportunities tied to expected revenue impact, not just frequency counts.
Each recommendation comes with evidence attached, the exact step it hurts and example sessions, so a team can see why it’s ranked where it is before committing engineering time.
Once the fix ships, Lift AI doesn’t stop there: it supports measuring the before-and-after impact, so the team knows whether the fix actually moved the goal instead of assuming it did.
Start Seeing Which Fixes Actually Move Revenue
Try Lift AI on your own sessions and see fixes ranked by expected impact, not just frequency.
Visualizing Customer Feedback and Sentiment
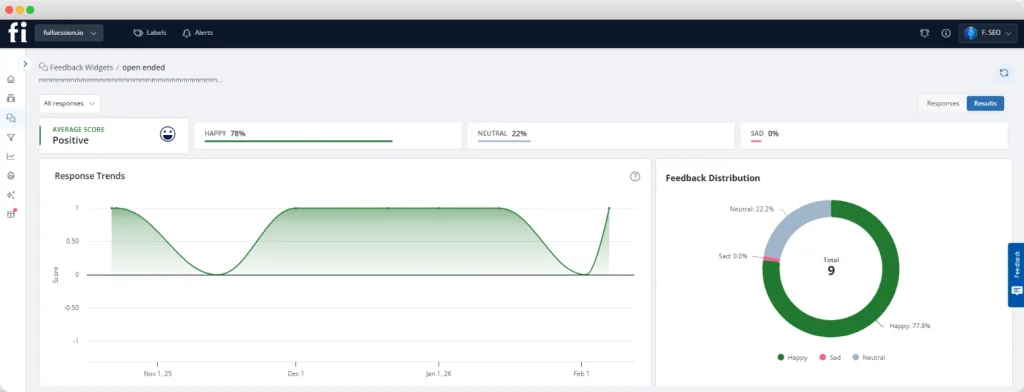
A report full of paragraphs is hard to scan. A few visualization types carry most of the weight:
- Trend line charts for sentiment or CSAT over time.
- Category breakdown charts showing volume by theme.
- Sentiment split visuals for a quick gut check on overall customer sentiment.
Visuals should support the report, not replace the data behind them. Every stat or theme shown in a chart should also exist as text in the report body.
Manual vs. behavior-linked feedback analysis
| Manual Analysis | Behavior-Linked Analysis | |
| Time to insight | Days to weeks, tagging by hand | Minutes, once feedback and sessions are connected |
| Context on “why” | Limited to what the comment says | Includes the actual session behind the comment |
| Tooling needed | Spreadsheets, manual review | A platform that links feedback to session replay |
| Confidence in prioritization | Lower, based on words alone | Higher, based on words plus observed behavior |
You can pair this table with your own website heatmap tools to decide which approach fits your team’s current volume.
Creating Actionable Customer Feedback Reports
A report earns the word “actionable” when it does more than summarize structured feedback. Structure it in six parts:
- Summary: the top three findings, in one paragraph.
- Methodology: sources used and the time period covered.
- Key findings: themes ranked by frequency and severity.
- Root cause: the underlying issue behind each finding.
- Recommendations: specific next steps, not general observations.
- Next steps: who owns each recommendation and by when.
| Report Section | What It Contains | Who Reads It |
| Summary | Top findings in plain language | Leadership, cross-functional stakeholders |
| Key findings | Ranked themes with volume and sentiment | Product, design, support leads |
| Recommendations | Specific, owned next steps | The team responsible for each fix |
To gain valuable insights instead of a wall of comments, every section should trace back to relevant data: a specific number, theme, or session, not a general impression.
A feedback analysis template with these six sections, reused every cycle, turns customer insights into data driven decisions instead of one-off observations that get discussed once and forgotten.
Closing the Customer Feedback Loop
A feedback loop that only collects and analyzes is half-finished. Closing the loop means telling customers what changed as a result of what they said, and it’s one of the most reliable ways to increase customer loyalty and drive customer loyalty over time.
Three ways to close the loop:
- Public changelog entries that reference the feedback theme, not just the fix.
- Direct follow-up to customers who left specific feedback, letting them know it was seen.
- In-app notices: a simple “you asked, we built it” message.
Customers who see their feedback lead to a real change are far more likely to give it again. Skipping this step trains future customers to stop bothering, so keep your customer feedback loops visible.
The Four Mistakes That Slow Down Every Feedback Report
Even a well-structured process runs into friction:
- Data silos: feedback lives in five different tools with no shared view. Centralize collection wherever possible.
- Low response rates: surveys that are too long or frequent get ignored. Shorten them and trigger at moments customers are already engaged.
- Subjective tagging: two reviewers categorize the same comment differently. Write clear tagging definitions before analysis begins.
- Stakeholder buy-in: teams don’t trust or use the report. Tie every finding to a number, not just a quote.
- Report fatigue: a report that looks the same every cycle stops getting read. Lead with what changed since the last report.
Most of these issues share the same root cause: feedback, sessions, and support data living in separate tools with nobody responsible for connecting them.
Centralizing collection and analysis in one platform, rather than adding another standalone survey tool, removes the silo and tagging problems at the source and makes the report easier to trust and easier to keep current.
The Bottom Line About Customer Feedback Report
A customer feedback report only earns its place on the calendar if it changes what a team does next. That means combining the right sources, the right metrics, and enough context, including what customers actually did on the page, to turn a comment into a decision.
FullSession brings that context into one place instead of leaving it scattered across a survey tool, a support inbox, and an analytics dashboard.
Feedback, session replay, heatmaps, and Lift AI’s revenue-based prioritization all sit on the same session data, so a comment turns into a specific fix your team can trust, not another line in a spreadsheet.
See What Your Customer Feedback Report Could Look Like
Book a walkthrough and see it in action before you decide if it’s right for your team.
FAQs About Customer Feedback Report
How to write a customer feedback report?
Start with a clear summary of top findings, then list key themes ranked by frequency and severity. Include the root cause behind each theme, followed by specific, owned recommendations. Close with next steps so the report leads to action, not just a record of complaints.
What are the 3 C’s of feedback?
The 3 C’s of feedback are Clear, Concise, and Constructive. Clear feedback avoids vague language and states the issue directly. Concise feedback stays focused on one point. Constructive feedback points toward a specific improvement rather than only describing a problem.
What is an example of customer feedback?
A customer feedback example: “The checkout process took too long because I couldn’t find the discount code field.” This is specific, names the exact friction point, and gives a team enough detail to investigate the checkout flow directly.
What are some examples of good feedback?
Good feedback is specific and actionable, such as “The onboarding tutorial skipped how to invite teammates, so I couldn’t finish setup.” It names the exact gap and the impact on the customer, unlike vague feedback like “onboarding was confusing.”

Roman Mohren is CEO of FullSession, a privacy-first UX analytics platform offering session replay, interactive heatmaps, conversion funnels, error insights, and in-app feedback. He directly leads Product, Sales, and Customer Success, owning the full customer journey from first touch to long-term outcomes. With 25+ years in B2B SaaS, spanning venture- and PE-backed startups, public software companies, and his own ventures, Roman has built and scaled revenue teams, designed go-to-market systems, and led organizations through every growth stage from first dollar to eight-figure ARR. He writes from hands-on operator experience about UX diagnosis, conversion optimization, user onboarding, and turning behavioral data into measurable business impact.