An element-level conversion heatmap answers which specific control on a page — which button, field or link — is associated with people completing a funnel, rather than which page or step lost them. In FullSession, that answer arrives as three columns the Top Elements report gains when a heatmap is linked to a funnel — Funnel finished, Funnel total and Funnel conversion rate — so each element carries its own completion count and conversion rate instead of one page-wide number.
FullSession’s Top Elements report ranks a page’s elements by interaction frequency and shows, per element, total clicks and the percentage of sessions that clicked it, users who clicked and the percentage of unique users, per-element rage, error and dead click counts, hover-to-click count with average hover time, and a copyable CSS selector. The funnel linkage shipped 2026-07-29, per FullSession’s What’s New changelog.
The underlying heatmap is not a screenshot. FullSession renders heatmaps on a real DOM snapshot across three viewports — 1920×1080, 768×1024 and 412×915 — which is why each element carries its own row and its own selector rather than a coordinate cluster on a picture. For the primer on how click data is captured and read, see FullSession’s guide to click maps.
Why page-level funnel data can’t tell you which element to fix
A FullSession funnel is a named set of ordered steps, each step built from one of four types — Visit page (URL is or contains), Click (CSS selector or element text), Changed input (field selector or text), or Custom event (FUS.event(...)) — and it counts either sessions or unique users at each step, switchable. What it reports is survival per step: step 3 of 5, the checkout page, loses 40% of the sessions that reach it. That is a useful number, and it is the end of what a step count can say — it cannot say which control on that checkout page did the damage.
FullSession narrows this gap two ways. First, any funnel step splits into a Dropped off list and a Converted list, both fully replayable — so you can watch the failure rather than infer it. Second, the funnel-linked Top Elements report attaches three funnel columns to each element, turning “step 3 leaks 40%” into a ranked list of controls with their own completion rates. Replay tells you what one person did; the element columns tell you what the population did. For how funnel stages get defined in the first place, see FullSession’s breakdown of the SaaS conversion funnel.
How element-level conversion data is calculated
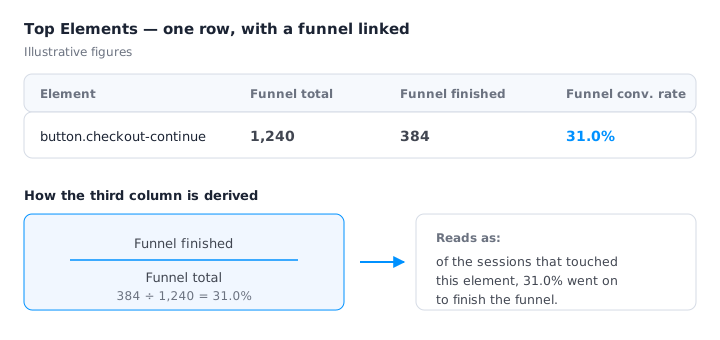
The three columns FullSession adds to the Top Elements report when a heatmap is linked to a funnel are defined precisely:
- Funnel finished — sessions that interacted with this element and went on to complete the funnel.
- Funnel total — total sessions that interacted with this element.
- Funnel conversion rate — the share of Funnel total that went on to finish the funnel.
An illustrative worked example — invented numbers, shown to demonstrate the arithmetic, not a customer result: the shipping-method selector shows Funnel total 4,000 and Funnel finished 2,600, a Funnel conversion rate of 65%. The promo-code field on the same page shows Funnel total 900 and Funnel finished 315, a rate of 35%. A finding might read: promo-code interactors complete checkout at roughly half the rate of shipping-selector interactors.
Element attribution is associative, not causal. People who touched the shipping selector may convert more because they had already decided to buy, not because the selector helped them. A low Funnel conversion rate on the promo-code field may mean the field is broken, or that discount-hunters were always the least likely cohort to buy. The Funnel conversion rate column ranks correlation; diagnosis comes from watching the Dropped off sessions for that element.
One detail matters more than it looks: FullSession funnels have no conversion window. No setting requires completion within a fixed time; median time-to-convert is reported, not enforced. That cuts both ways. A 30-day B2B consideration cycle still attributes back to the element clicked on day one — correct behaviour for long sales cycles. But an analyst who needs a strict 7-day window cannot impose one in FullSession.
Which tools offer element-level conversion data as of August 2026?
Five products document element-level conversion data as of August 2026: FullSession, FullStory, LogRocket, Microsoft Clarity and Contentsquare. The list is not exhaustive. The differences between them are in how the conversion goal is defined and which elements qualify, not in whether the capability exists.
| Product | What it outputs | How the goal is defined | Which elements are analysed | Limits stated in vendor documentation | Plan requirement | Source, checked 2026-08-12 |
|---|---|---|---|---|---|---|
| FullSession — funnel-linked Top Elements | Three columns per element: Funnel finished, Funnel total, Funnel conversion rate | Funnel selected when creating or editing the heatmap; steps are Visit page, Click, Changed input, or Custom event (FUS.event(...)) | Every element Top Elements ranks; no pre-naming required. A Label action optionally creates a Named Element for clearer reporting | No conversion window; no branching or alternative paths in funnels | All paid plans — Growth, Professional and Enterprise | docs.fullsession.io and the What’s New changelog entry dated 2026-07-29 |
| FullStory — Conversion Maps | Conversion rates tied to specific areas of a page, element-level | Goal chosen from a dropdown populated by the final steps of saved funnels | “Conversion maps only analyze elements that have been named in your account at this time” (direct quote); archived elements not displayed, unlike click maps | Funnels ending in CSS Selector clicks cannot serve as conversion goals — text clicks or named element clicks are required | Enterprise or Advanced plans | help.fullstory.com/hc/en-us/articles/16786343352983-Conversion-Maps |
| LogRocket — Conversion Rate Heat Maps | Per-element conversion rate as a colour gradient with percentage overlay, plus total clicks and conversions per element | Target page URL plus a conversion event chosen from Visited URL, Click, or Redux Actions | Not restricted by a naming requirement in the documentation | None stated in the documentation | Not stated in the documentation | docs.logrocket.com/docs/conversion-rate-heat-maps |
| Microsoft Clarity — Conversion maps | “Conversion maps show the conversion rate, representing the percentage of all sessions that resulted in a purchase when a user clicks in a selected area” (direct quote) | Purchase events that Clarity detects in the project | Elements inside a selected area of the page; no naming requirement stated | Available only on projects where Clarity detects purchase events — an e-commerce restriction | Not stated in the documentation | learn.microsoft.com/en-us/clarity/heatmaps/conversion-maps |
| Contentsquare — zone metrics | “Conversion Rate per Click — Percentage of visitors who achieved the goal after clicking on a zone” (direct quote); also Conversion Rate per Hover | A goal, referenced by the zone-metrics endpoints; goal configuration is not described on that page | Zones, as defined in Contentsquare; no naming requirement stated | None stated on the zone-metrics endpoints page | Not stated in the documentation | docs.contentsquare.com/en/api/metrics/zone-metrics-endpoints/ |
Two honest notes, both as of August 2026. LogRocket’s documentation describes a conversion event rather than a multi-step funnel; that is an absence of evidence about multi-step support, not evidence that LogRocket lacks it. The same caution applies to every “none stated” cell above — vendor silence is not a guarantee. A wider survey sits in FullSession’s comparison of UX heatmap tools.
The pre-naming problem
Among the five products above — FullSession, FullStory, LogRocket, Microsoft Clarity and Contentsquare — FullStory is the only one whose documentation requires elements to be named before they can be analysed. FullStory’s Conversion Maps documentation (help.fullstory.com/hc/en-us/articles/16786343352983-Conversion-Maps, checked 2026-08-12) states: “Conversion maps only analyze elements that have been named in your account at this time.” The same page notes that Conversion Maps do not display archived elements, unlike click maps, and that funnels ending in CSS Selector clicks cannot serve as conversion goals — text clicks or named element clicks are required.
FullStory’s named-element requirement inverts the analysis workflow: to measure an element, someone must already have named it, so the set of measurable elements is fixed before the measurement runs.
FullSession’s Top Elements report ranks every element on the page by interaction frequency with no pre-naming step. A Label action optionally creates a Named Element for clearer reporting, but labelling is cosmetic — the ranking exists before anyone labels anything. Ranking follows the selected aggregation: switching to Rage Clicks re-ranks the report so frustration-causing elements surface first.
The practical difference is discovery versus confirmation: FullStory’s Conversion Maps confirm, FullSession’s Top Elements report discovers. That reading is ours, not FullStory’s — FullStory’s documentation states only that unnamed elements are not analysed, and says nothing about how or when elements get named.
When a page-level funnel is the right tool instead
Element-level conversion data does not fit every drop-off. Use a plain page-level funnel, and skip element attribution entirely, in these cases:
- The drop-off is between pages, not inside one. If sessions reach the cart and never load checkout, no element on the cart page is the story — the navigation, the redirect or the load failure is. Element columns will just show a ranked list of controls that all look fine.
- The step is a redirect or an interstitial. A payment-processor hand-off or an SSO bounce has no meaningful element surface to rank. The step count is the whole of the available signal.
- The page has one obvious CTA. On a single-CTA landing page, ranking elements by funnel conversion rate tells you what you already knew: people who clicked the button converted more than people who did not.
- The page is heavily personalised. FullSession renders a heatmap on one representative DOM snapshot. If the page differs substantially per user — dynamic offer blocks, per-account modules — that snapshot will not match every session, and the element rows are harder to trust than the step counts.
- The journey genuinely branches. FullSession funnels have no branching or alternative paths; steps run in a single ordered sequence, and distinct paths need separate funnels. Three legitimate routes to purchase is three analyses, not one.
How to set this up in FullSession
- Define the funnel. Create a named set of ordered steps in FullSession using the four step types: Visit page (URL is or contains), Click (CSS selector or element text), Changed input (field selector or text), and Custom event (
FUS.event(...)). Choose whether the funnel counts sessions or unique users — that is switchable. - Link the funnel to the heatmap. The funnel is set when creating or editing the heatmap in FullSession, not from inside the report afterwards.
- Filter the heatmap to the population you mean. FullSession heatmaps filter by page, segment, device, date range and minimum page duration, across the 1920×1080, 768×1024 and 412×915 viewports.
- Open the Top Elements report and read the three columns. Funnel total is the denominator, Funnel finished the numerator, Funnel conversion rate the ratio.
- Sort by Funnel conversion rate, then sanity-check Funnel total. A 12% rate on a Funnel total of 30 sessions is noise. Rank by rate, act on volume.
- Copy the CSS selector from the element row. Top Elements exposes a copyable CSS selector per element, which is also a valid Click step type — so a suspect element can become its own funnel step.
- Watch the sessions on both sides. Split the funnel step into its Dropped off and Converted lists and replay both. Because element attribution is associative rather than causal, replay is where a correlation becomes a diagnosis.

See what your analytics cannot tell you
FullSession pairs session replay, heatmaps, funnels, and error tracking with Lift AI, so you can find the friction costing you revenue and prove the fix worked. No credit card needed to start.
Frequently asked questions
Which elements on my checkout page actually drive conversions?
Link a FullSession heatmap to a checkout funnel and the Top Elements report adds three columns per element: Funnel finished, Funnel total, and Funnel conversion rate. Sort by Funnel conversion rate to rank every button, field and link on the page. The relationship is associative, not causal, so confirm it in session replay.
What is an element-level conversion heatmap?
An element-level conversion heatmap shows which specific control on a page — button, field or link — is associated with completing a funnel, rather than which page or step lost people. It joins a heatmap’s per-element interaction data to a defined funnel, so each element carries its own completion count and conversion rate.
How does FullSession calculate funnel conversion rate per element?
FullSession defines three columns on the funnel-linked Top Elements report. Funnel total is the sessions that interacted with the element. Funnel finished is the subset of those sessions that completed the funnel. Funnel conversion rate is Funnel finished divided by Funnel total, expressed as a share.
Which tools offer element-level conversion data as of August 2026?
Five products document it: FullSession funnel-linked Top Elements (docs.fullsession.io), FullStory Conversion Maps (help.fullstory.com/hc/en-us/articles/16786343352983-Conversion-Maps), LogRocket Conversion Rate Heat Maps (docs.logrocket.com/docs/conversion-rate-heat-maps), Microsoft Clarity conversion maps (learn.microsoft.com/en-us/clarity/heatmaps/conversion-maps) and Contentsquare zone metrics (docs.contentsquare.com/en/api/metrics/zone-metrics-endpoints/). All checked 2026-08-12; the list is not exhaustive.
Does FullSession require naming elements before it can measure them?
No. FullSession’s Top Elements report ranks every element on the page by interaction frequency with no pre-naming step. A Label action optionally creates a Named Element for clearer reporting, but labelling is cosmetic. By comparison, FullStory’s documentation (help.fullstory.com/hc/en-us/articles/16786343352983-Conversion-Maps, checked 2026-08-12) states Conversion Maps only analyze elements already named in the account.
What is the difference between FullSession and FullStory Conversion Maps?
As of August 2026, FullStory Conversion Maps pick a goal from the final steps of saved funnels and analyze only named elements, on Enterprise or Advanced plans (help.fullstory.com/hc/en-us/articles/16786343352983-Conversion-Maps, checked 2026-08-12). FullSession links a funnel when creating or editing a heatmap and ranks every element, named or not.
Does FullSession have a conversion window for funnels?
No. FullSession funnels have no conversion window — no setting requires completion within a fixed time, and median time-to-convert is reported rather than enforced. Long consideration cycles still attribute back to the element clicked on day one, but you cannot restrict attribution to a strict 7-day window.

Roman Mohren is CEO of FullSession, a privacy-first UX analytics platform offering session replay, interactive heatmaps, conversion funnels, error insights, and in-app feedback. He directly leads Product, Sales, and Customer Success, owning the full customer journey from first touch to long-term outcomes. With 25+ years in B2B SaaS, spanning venture- and PE-backed startups, public software companies, and his own ventures, Roman has built and scaled revenue teams, designed go-to-market systems, and led organizations through every growth stage from first dollar to eight-figure ARR. He writes from hands-on operator experience about UX diagnosis, conversion optimization, user onboarding, and turning behavioral data into measurable business impact.