A survey is supposed to give you reliable and actionable opinions from your audience. However, response bias can be a huge roadblock to getting the most accurate results you need.
What is response bias and its different kinds? What happens when you use inaccurate responses? And how can you avoid response bias in your survey research methods?
In this article, we’re covering it all.
What is Survey Response Bias?
The common response bias definition is when participants provide answers that are systematically different from their true thoughts or feelings.
Many factors can contribute to response bias, such as how questions are asked, the environment in which the survey is taken, or the respondent’s personal biases, like wanting to appear in a positive light or misunderstanding what’s being asked.
Here’s a good example: Imagine a beverage company launches a new soft drink and then sends out a survey to find out what people think about it. The survey includes a question like, “On a scale of 1 to 10, how much did you enjoy our new soft drink?”
Now, suppose the survey is conducted at a promotional event where free samples of the drink are being given out. In that case, attendees might feel inclined to give higher ratings than they truly believe, either to be polite because they received something for free or because they think a positive response might lead to more freebies.
This leads to response bias in the survey results, showing a more favorable opinion of the new drink than the general public might actually have.
Types of Response Bias & Their Causes
Response bias can take many different forms. Here’s a breakdown of the 11 different types and their common causes:
1. Extreme Response Bias
Extreme response bias happens when people consistently choose the most extreme options on a survey, such as “strongly agree” or “strongly disagree,” regardless of their actual feelings. It’s as if every question prompts an all-or-nothing stance.
Some participants may turn to extreme responding if the question makes it seem like it is the “correct” one. Extreme response bias typically happens in Likert scales, where respondents are asked to answer from a range of Strongly Agree to Strongly Disagree (or something along those lines).
Example: In a customer feedback survey about a hotel stay, a guest rates all aspects either 1 or 10 on a 10-point scale despite their more nuanced experience. This all-or-nothing approach doesn’t accurately reflect their stay.
Possible Outcome: The hotel management might conclude that their services are either perfect or abysmal, which is not necessarily true. This can lead to misguided efforts to overhaul or maintain services that actually require more detailed adjustments.
2. Neutral Response Bias
With neutral response bias, respondents prefer sticking to the middle ground, often selecting “neutral” or “no opinion.” It’s like deciding not to decide, which can skew the data towards a falsely moderate viewpoint.
This type of bias can happen when the survey includes irrelevant or uninteresting questions. Respondents might not have any significant feelings or thoughts about the topic in question, which leads to them choosing a neutral response. Survey fatigue is also a common culprit.
Example: When asked about their satisfaction with a new software update, several users select “Neither satisfied nor dissatisfied” for every question because they haven’t fully explored the new features yet and prefer not to commit to a positive or negative judgment.
Possible Outcome: The software development team may interpret the high number of neutral responses as a general satisfaction with the update. The result? Missing out on critical feedback necessary for improvement or bug fixes.
3. Non-Response Bias
Non-response bias (sometimes called late response bias) is when the opinions of those who do not respond to the survey differ from those who do. If a specific group is less likely to answer, their absence can tilt the results in one direction or another.
Example: A survey about workplace culture is sent out, but primarily younger employees respond, while older employees tend not to participate. The results might skew towards the views and experiences of the younger demographic and miss the perspectives of the older workforce.
Possible Outcome: The company might implement policies or programs to improve workplace culture for younger employees. However, it might overlook the needs and concerns of older staff members and worsen the workplace environment for a significant portion of the workforce.
4. Acquiescence Bias
Also known as “yea-saying,” acquiesce bias happens when individuals agree with statements without truly considering their feelings. Some respondents may do this to avoid conflict or because they think that’s what the surveyor wants to hear.
Researchers may see acquiescence bias if they include leading survey questions that sound like they want a specific answer. It can also happen in situations where survey respondents feel like there is a potential for consequences if they choose negative answers, such as in job satisfaction surveys.
Example: In a survey asking about the effectiveness of a new company policy, some employees might agree with positive statements about the policy, even if they have reservations. They believe the agreement is expected or will be viewed more favorably.
Possible Outcome: The company continues to roll out similar policies because it believes they have broad employee support. What can happen is decreased morale and engagement among employees who feel their true opinions aren’t considered.
5. Dissent Bias
The opposite of acquiescence bias, “nay-saying,” is when people are inclined to disagree with survey items, regardless of their actual opinions. It’s a contrarian approach to survey responses and can happen when survey respondents simply want to get the survey over and done with.
Another possible reason is that they dislike the brand or the person asking them to answer the survey. Either way, it can significantly affect survey data.
Example: A political opinion survey might find respondents systematically disagreeing with statements supporting any government action, not because of reasoned opposition to each action but from a general distrust or disapproval of the government.
Possible Outcome: Policy-makers might conclude there’s widespread opposition to any government action. The survey data can potentially halt beneficial initiatives or spending resources to address dissatisfaction that isn’t as pervasive as it appears.
6. Voluntary Response Bias
Voluntary response bias can happen when individuals choose to respond to a survey out of a strong feeling about the subject. This means the responses are likely to be overly positive or negative, not representing the average view.
Plus, respondents with this kind of bias may not be able to give impartial answers.
Voluntary response bias typically occurs when researchers rely too much on their volunteer respondents. They miss out on a good chunk of data from a broader scope of people with unbiased opinions.
Example: A call for feedback on a public forum about a video game update might attract predominantly those who feel strongly about the changes. The survey then leaves out the more moderate or indifferent gamers, thus skewing the feedback.
Possible Outcome: The game developers might prioritize changes based on the vocal feedback of a passionate minority. The survey may alienate the silent majority of players who were satisfied with the update or had different concerns.
7. Demand Bias
Demand characteristics are a common field in psychology and psychiatric research. In the context of surveys, they translate to demand bias.
This type of response bias can happen when participants in a study or survey change their behavior or responses based on their perceptions of what the researchers want to see. In other words, they are too eager to please.
Demand bias is particularly common in psychological experiments or surveys where the purpose is apparent to the participants. As a result, respondents subconsciously or consciously change their answers to align with perceived expectations.
Example: In a study aimed at assessing the effectiveness of a new educational strategy, researchers inform participants that they are testing whether the strategy enhances learning outcomes. Knowing the study’s goal, participants might work harder or pay more attention than they normally would. They want to show that the strategy is effective, even if, under normal circumstances, its impact is next to nothing.
Possible Outcome: The study concludes that the new educational strategy significantly improves learning outcomes, which leads to its widespread adoption. However, once implemented on a larger scale without the controlled conditions of the study, it does not demonstrate the same level of effectiveness because the real-world application lacks the motivational factor of wanting to meet the researchers’ expectations.
8. Cognitive Bias
Cognitive biases involve errors in thinking that affect how questions are understood and answered. These can lead to misinterpretation or reliance on stereotypes, which may affect the accuracy of responses.
Example: When asked whether they prefer traditional books or eBooks, some might choose traditional books not because of a direct comparison of the formats but due to a nostalgic bias favoring their memories of physical books.
Possible Outcome: Publishers and bookstores might invest heavily in traditional book formats. They underestimate the market demand for eBooks based on a perception that doesn’t accurately reflect current reading habits.
9. Social Desirability Bias
Another common type of response bias is social desirability bias. Respondents might answer in a way that they believe will be viewed favorably by others, also known as a socially desirable response. Deep down, they want to appear as “socially correct” as possible.
There are many possible causes of social desirability bias. Sensitive questions are number one, such as those that ask about income, alcohol consumption, personal health, religion, and so on. Another potential cause is poor wording or leading questions.
Example: In a survey on exercise habits, respondents might overstate their weekly physical activity because they believe being active is socially approved and desirable, even if they aren’t exercising as much as they claim.
Possible Outcome: Health campaigns continue to target areas and demographics they believe are less active. As a result, they overlook or misidentify groups that actually engage in less physical activity but have reported otherwise.
10. Order Bias
The sequence of answer choices can influence responses. For example, people might favor the first option (primacy effect) or last (recency effect) simply due to their position.
Example: In a taste test survey asking participants to rank their favorite flavors of ice cream from a list, the options listed first and last are chosen more frequently than those buried in the middle, regardless of the actual preference.
Possible Outcome: The ice cream company might phase out or fail to promote flavors that were listed in the middle of the survey options. However, they can miss out on market opportunities for these flavors that didn’t receive a fair assessment.
11. Confirmation Bias
Lastly, we have a type of bias that can affect the researchers. When they evaluate survey responses, they might look for data or patterns that confirm their hypotheses or goals–either consciously or unconsciously.
This is called confirmation bias, and it is a common cause of inaccurate results and interpretations.
Example: Imagine a team of researchers conducting a survey to determine public opinion on renewable energy. The researchers strongly believe that the majority of the public supports the expansion of renewable energy initiatives. As they analyzed the survey responses, they paid more attention to and gave more weight to the responses that indicated strong support for renewable energy.
Possible Outcome: The researchers’ final report emphasizes a high level of public support for renewable energy. Policymakers and stakeholders might then allocate resources based on this skewed representation of public opinion.

What Happens When You Don’t Fix Survey Response Bias?
When survey response bias isn’t tackled, you’re essentially flying blind. What can happen with unresolved survey response biases?
First of all, you can end up with data that doesn’t truly reflect the opinions or behaviors of your target group. This means any conclusions drawn from the survey are likely not correct.
Secondly, decisions based on bad data are not going to end well. Whether it’s a business strategy, a new policy, or a research conclusion, if the foundation is off, the results won’t be effective.
Lastly, time, money, and effort can all be wasted if they’re directed by misleading information. This could involve investing in the wrong areas, developing products people don’t want, or implementing policies that don’t solve the intended problems.
How to Create Surveys That Avoid Response Bias
Creating surveys that dodge response bias involves careful planning and execution. Here are some strategies to help you get started:
- Know Your Audience: Understand who you’re surveying. Tailor the language, tone, and content of your survey to match their understanding and expectations.
- Survey Question Design is Key: Create your survey questions to be clear, concise, and neutral. Avoid leading or loaded questions that suggest a “correct” answer. Direct questions lead to direct answers.
- Balance Your Options: When providing response options, make sure they cover a broad and balanced range. This includes not only the extremes but also the middle ground, allowing respondents to express their opinions without feeling pushed to one side accurately.
- Offer Anonymity: Guaranteeing respondents’ anonymity can significantly reduce social desirability bias. People are more likely to be honest when they know their answers cannot be traced back to them.
- Randomize Answer Choices: If your survey platform allows, randomly select the order of questions and answer choices for each respondent. This tactic helps combat order bias by ensuring that no particular response is favored just because of its position.
- Include an “Out”: Always provide an option for respondents to select “Don’t know” or “Prefer not to say.” This prevents people from giving inaccurate answers just because they feel compelled to choose an option.
- Widen Your Audience: Include different segments of your target market to avoid voluntary response bias.
Use a No-Code Customer Feedback Tool to Avoid Survey Bias
FullSession gives you a host of customer feedback tools for conducting research or data collection. Whether you’re testing out a new product or getting to know your audience better, FullSession is your one-stop shop for market solutions.
FullSession Pricing Plans
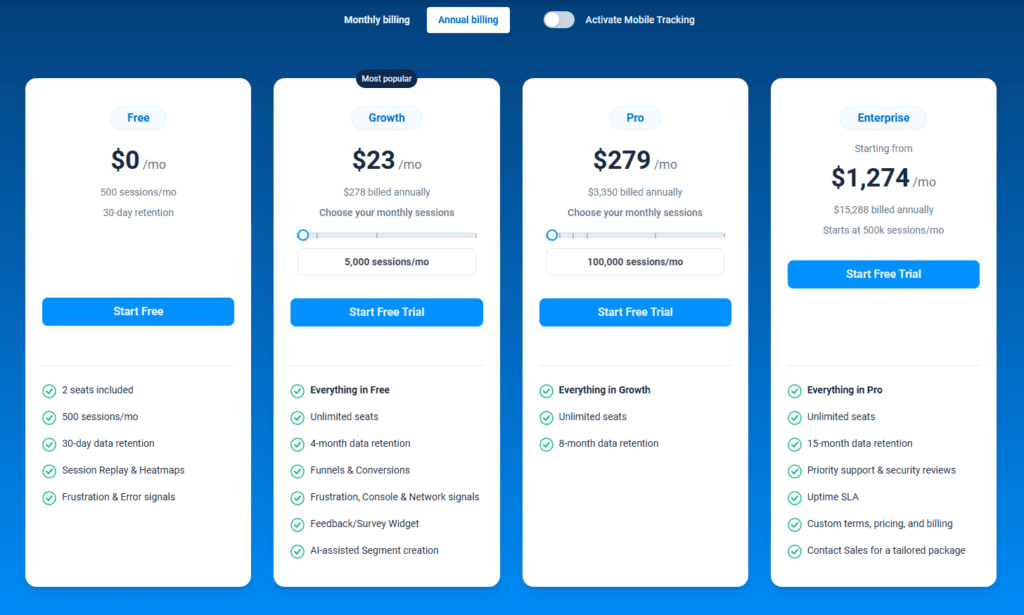
The FullSession platform offers a 14-day free trial. It provides two paid plans—Basic and Business. Here are more details on each plan.
- The Free plan is available at $0/month and lets you track up to 500 sessions per month with 30 days of data retention, making it ideal for testing core features like session replay, heatmaps, and frustration signals.
- The Growth Plan starts from $23/month (billed annually, $276/year) for 5,000 sessions/month – with flexible tiers up to 50,000 sessions/month. Includes 4 months of data retention plus advanced features like funnels & conversion analysis, feedback widgets, and AI-assisted segment creation.
- The Pro Plan starts from $279/month (billed annually, $3,350/year) for 100,000 sessions/month – with flexible tiers up to 750,000 sessions/month. It includes everything in the Growth plan, plus unlimited seats and 8-month data retention for larger teams that need deeper historical insights.
- The Enterprise plan starts from $1,274/month when billed annually ($15,288/year) and is designed for large-scale needs with 500,000+ sessions per month, 15 months of data retention, priority support, uptime SLA, security reviews, and fully customized pricing and terms.
Install Your First Website Survey Form Right Now
It takes less than 5 minutes to set up your first website or app feedback form, with FullSession, and it’s completely free!
FAQs About Survey Response Bias
Can you ever completely eliminate response bias?
While it’s tricky to eliminate completely, you can significantly reduce its impact with careful design and awareness.
How does anonymity help in reducing bias?
Anonymity reduces the fear of judgment, encourages honesty, and reduces the urge to give socially desirable responses.
Why is randomizing answer choices important?
It prevents patterns (like always choosing the first option) from skewing the results, ensuring each choice is equally likely to be selected.
Can offering incentives lead to response bias in surveys?
Yes, offering incentives can sometimes lead to response bias, as it might attract respondents who are more interested in the reward than providing honest answers. It’s important to balance the need to increase participation with the potential impact on data quality.
Mohamed oversees operations and finance at FullSession and has contributed to the company’s UX analytics knowledge base.