Author: Mohamed Sehwail
-
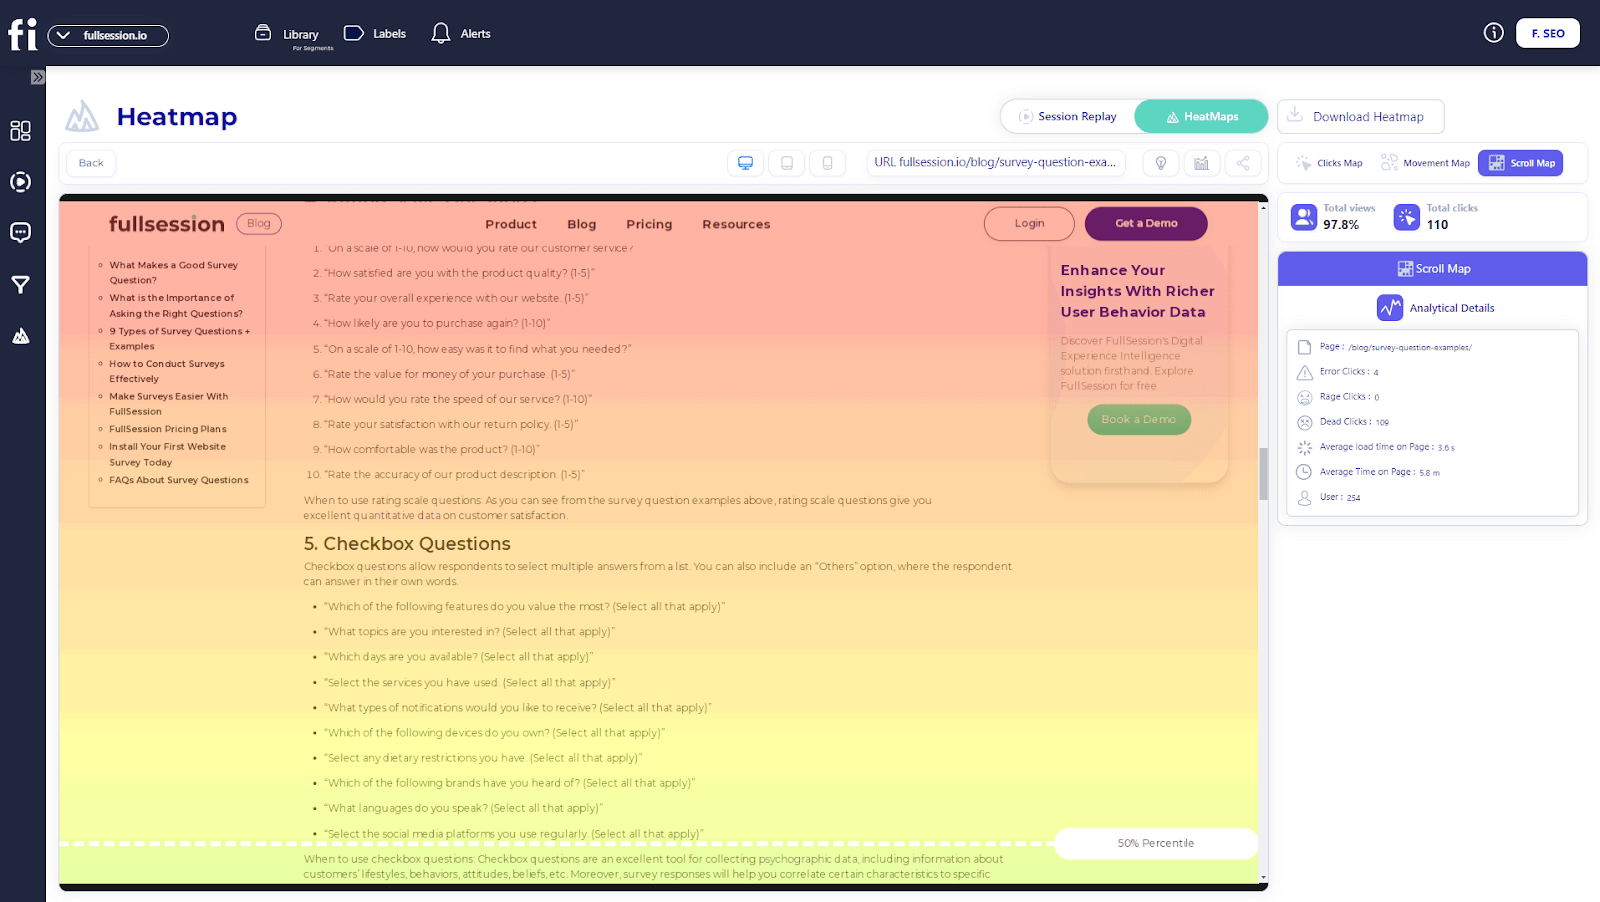
Scroll Maps: How to Use Them In 2025
Understanding user behavior is key to evaluating how customers interact with your website, web app, or landing page. You can gain valuable insights by analyzing activities like cart abandonment, button clicks, page navigation, and scrolling. Scroll maps help uncover visitor interactions, especially on crucial landing pages designed to drive sign-ups and guide customers through the…
-
![Website Tracking: How to Do It + 5 Tools [Free & Paid]](https://www.fullsession.io/wp-content/uploads/2022/11/unnamed-7.jpg)
Website Tracking: How to Do It + 5 Tools [Free & Paid]
Website visitor tracking is essential for optimizing your website and increasing conversions. It allows you to learn more about who visits your site, where they come from, what websites refer traffic to yours, and other important information. The best website visitor tracking software also helps you discover if people can find the information they need…
-
![Top 8 Session Recording And Replay Tools [Our 2025 Review]](https://www.fullsession.io/wp-content/uploads/2023/01/null-41.png)
Top 8 Session Recording And Replay Tools [Our 2025 Review]
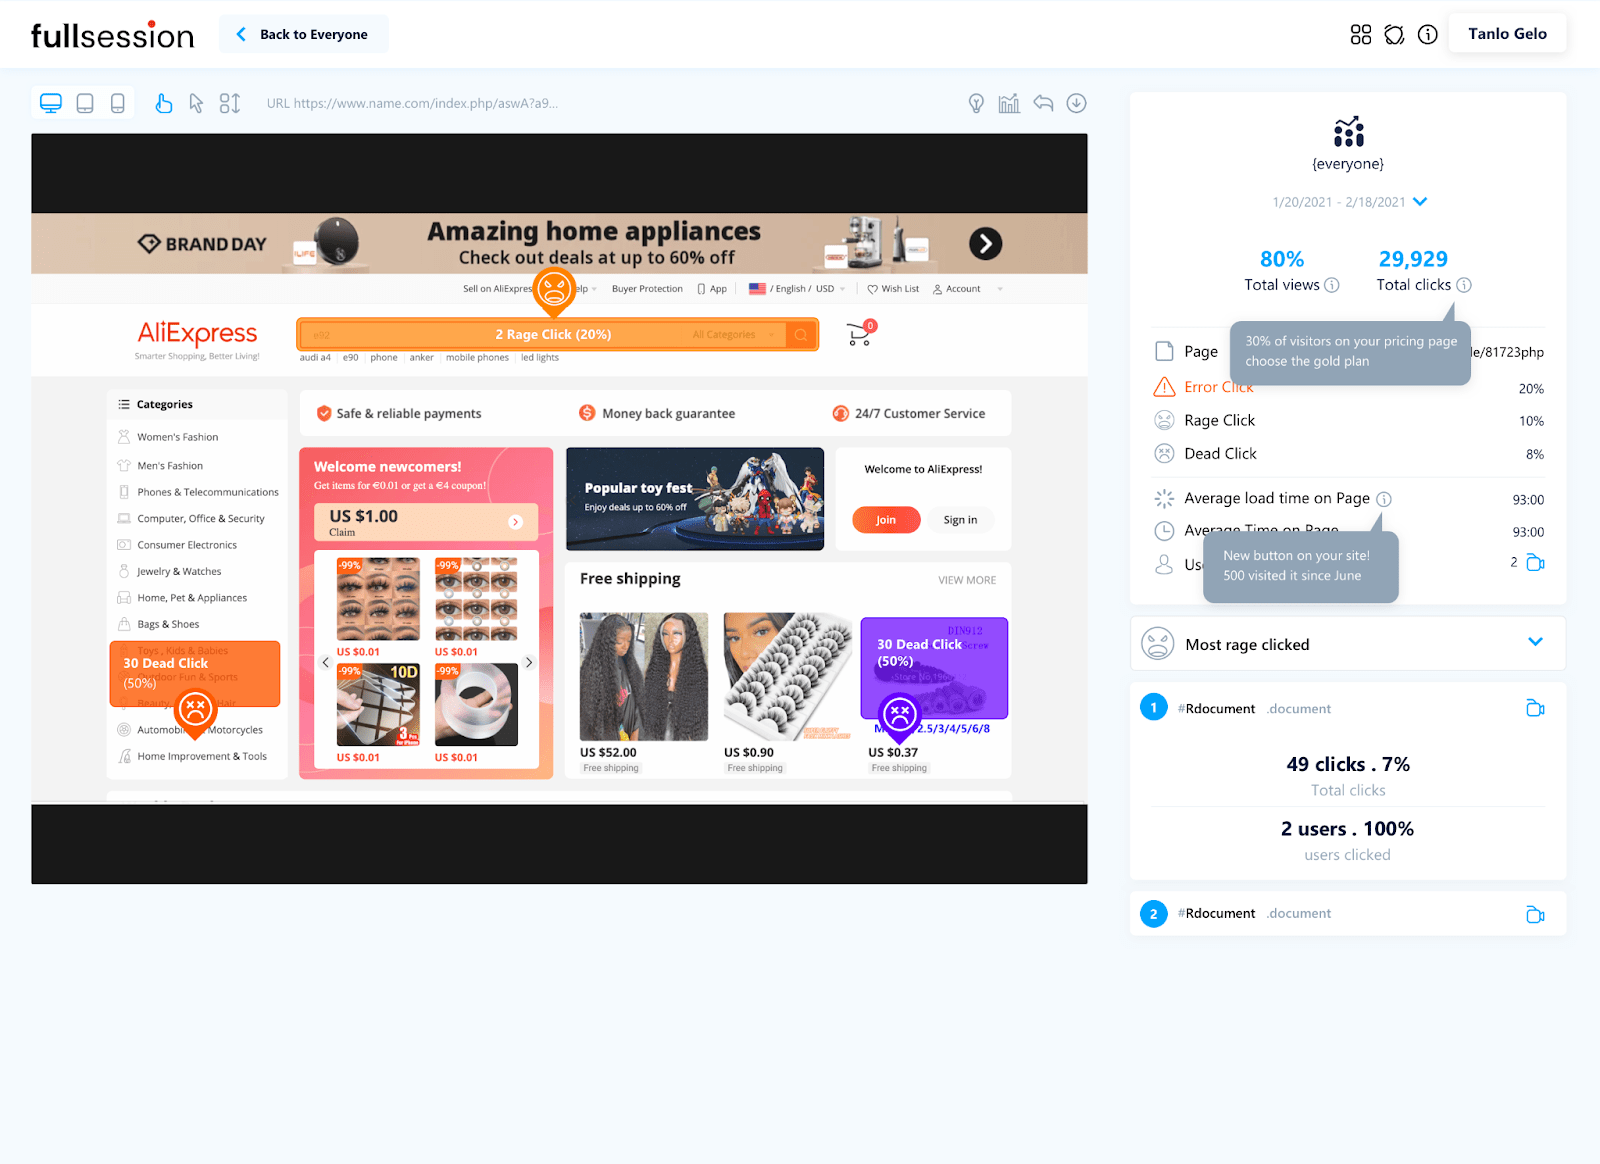
Session recording and replay tools are essential for user experience analysis. They help you understand how to optimize your website, web app, or landing page. Finding the right tools with relevant features can be quite challenging, given the abundance of user session recording and replay tools available on the market. Session recording and replay tools…
-
Customer Journey Tracking: How to Map Your Customer’s Path to Conversion
We all know that it’s essential to track website conversion rates, but what about monitoring customer journeys on your website? With a comprehensive customer journey map, you can identify potential obstacles and optimize your website accordingly. NEXT STEPS Apply this to your product Session Replay Heatmaps CRO for Product teams Start Free Trial See pricing…
-

How to Use Predictive Customer Analytics For Max Conversions
Business gurus always talk about the importance of collecting customer data. But aside from addressing current issues with the information you gather, what do you do with all that historical data? If you haven’t already, it’s time to introduce a predictive analytics process to your business operations. With a good breadth of customer data to…
-

The Definitive Guide to User Persona Research
Demographic and psychographic data come together to create the user persona: a snapshot of a subgroup of your existing user base. Products that resonate deeply with users start with understanding their thought processes. By mapping the common ground between your audience, you’ll forge an unshakeable connection that sparks loyal customers. Imagine creating products and services…
-

7 Top Customer Insight Software of 2025
Customer insights tools give businesses an almost effortless way to analyze customer interactions, gauge satisfaction, and derive actionable insights from all that data. However, there’s no one tool to accomplish everything that you need to do to optimize the customer journey. So, we’ve compiled the best customer insight software to deliver what customers expect from…
-

A Step-by-Step Guide to Customer Feedback Management
How you manage customer feedback will dictate how well you can meet customer expectations and increase their overall satisfaction. However, effective customer feedback management is more than just collecting data and responding to what your audience says. You need an effective customer feedback management system that will ultimately lead to better customer retention and satisfaction.…
-

The Power of Real-Time Customer Analytics
Customer behavior moves too fast for traditional analytics to be effective. These days, you need to analyze touchpoints in real-time to provide a satisfying experience across the board. While historical data can still be a huge help, real-time analytics help you analyze in the moment instead of waiting for changes that can hinder business success.…
-

5 Simple Steps of Customer Satisfaction Analysis
Unsatisfied customers don’t just mean you’re missing out on sales. They can also lead to negative feedback–and, therefore, a negative reputation–for your business. So, how do you turn dissatisfied customers into highly satisfied customers? And more importantly, how do you prevent a bad user experience in the first place? It all starts with customer satisfaction…