Author: Mohamed Sehwail
-

7 Best Practices For Giving Good Web Design Feedback
A new website design rarely gets approved without further tweaks and improvements. As a business owner, it’s natural to want a web design that checks all your boxes, resonates with your brand identity, and follows web design best practices. But how can you achieve this in the most efficient way possible? Working with a talented…
-

Questionnaire vs Survey: 4 Key Differences and Why They Matter
Surveys and questionnaires gather information from a specific group to meet a goal. In marketing, both are indispensable tools for gaining insights into customers’ behavior and opinions of a brand. However, surveys are questionnaires, but not all questionnaires are surveys. And no, we shouldn’t use these terms interchangeably. Learn the key differences between survey vs…
-
50 Close-Ended Questions Examples (+ Free Survey Guide)
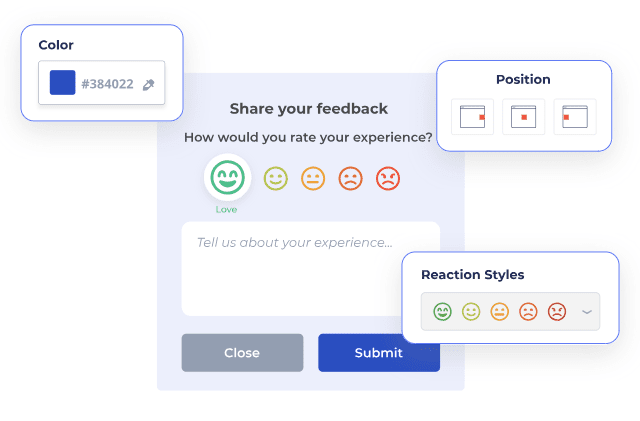
Do you need a Feedback / Survey tool for NPS, CSAT, etc.See the FullSession Feedback tool Close-ended questions allow you to create surveys that are easy to answer for respondents. In turn, it will be easier for you to collect quantitative data and conduct statistical analysis on any particular aspect you want to study. Unlike…
-
Best 12 Examples of Demographic Questions for Surveys
Utilizing demographic survey questions gives you a clear idea of who your customers are–more specifically, where they live, how old they are, what religion they follow, and so on. For most people, this information is a solid representation of one’s persona, even if it’s just a glimpse. However, good marketing teams only need that glimpse…
-
Best 11 Conversion Rate Optimization Tools You Need In 2025
So, you’ve driven a sizeable number of visitors to your website. They’re looking at your products, perusing your blog pages, and scrolling through your landing page. You might think that the hardest part is over, but unfortunately, you’re just now getting to it. A large number of visitors is meaningless if you can’t convert them…
-
17 SaaS Metrics You Need to Track (+ Formulas and Tips)
The international software-as-a-service (SaaS) industry grew to $237.48 billion in 2022 and is expected to reach over $900 billion by 2030. The market is supersaturated to the point that the competition is kicking the weakest links out before they can even gain traction. On the flip side, the SaaS companies sitting on top are perfecting…
-

Categorical Data: How to Use It For Website Conversions
Anyone who’s taken a statistics class is probably already familiar with qualitative and quantitative data. One includes numerical values and the other describes qualities or traits. One can be counted, and the other cannot, plain and simple. But wait, are we forgetting another type of data? Categorical data takes qualitative data and divides them into specific categories. It…
-
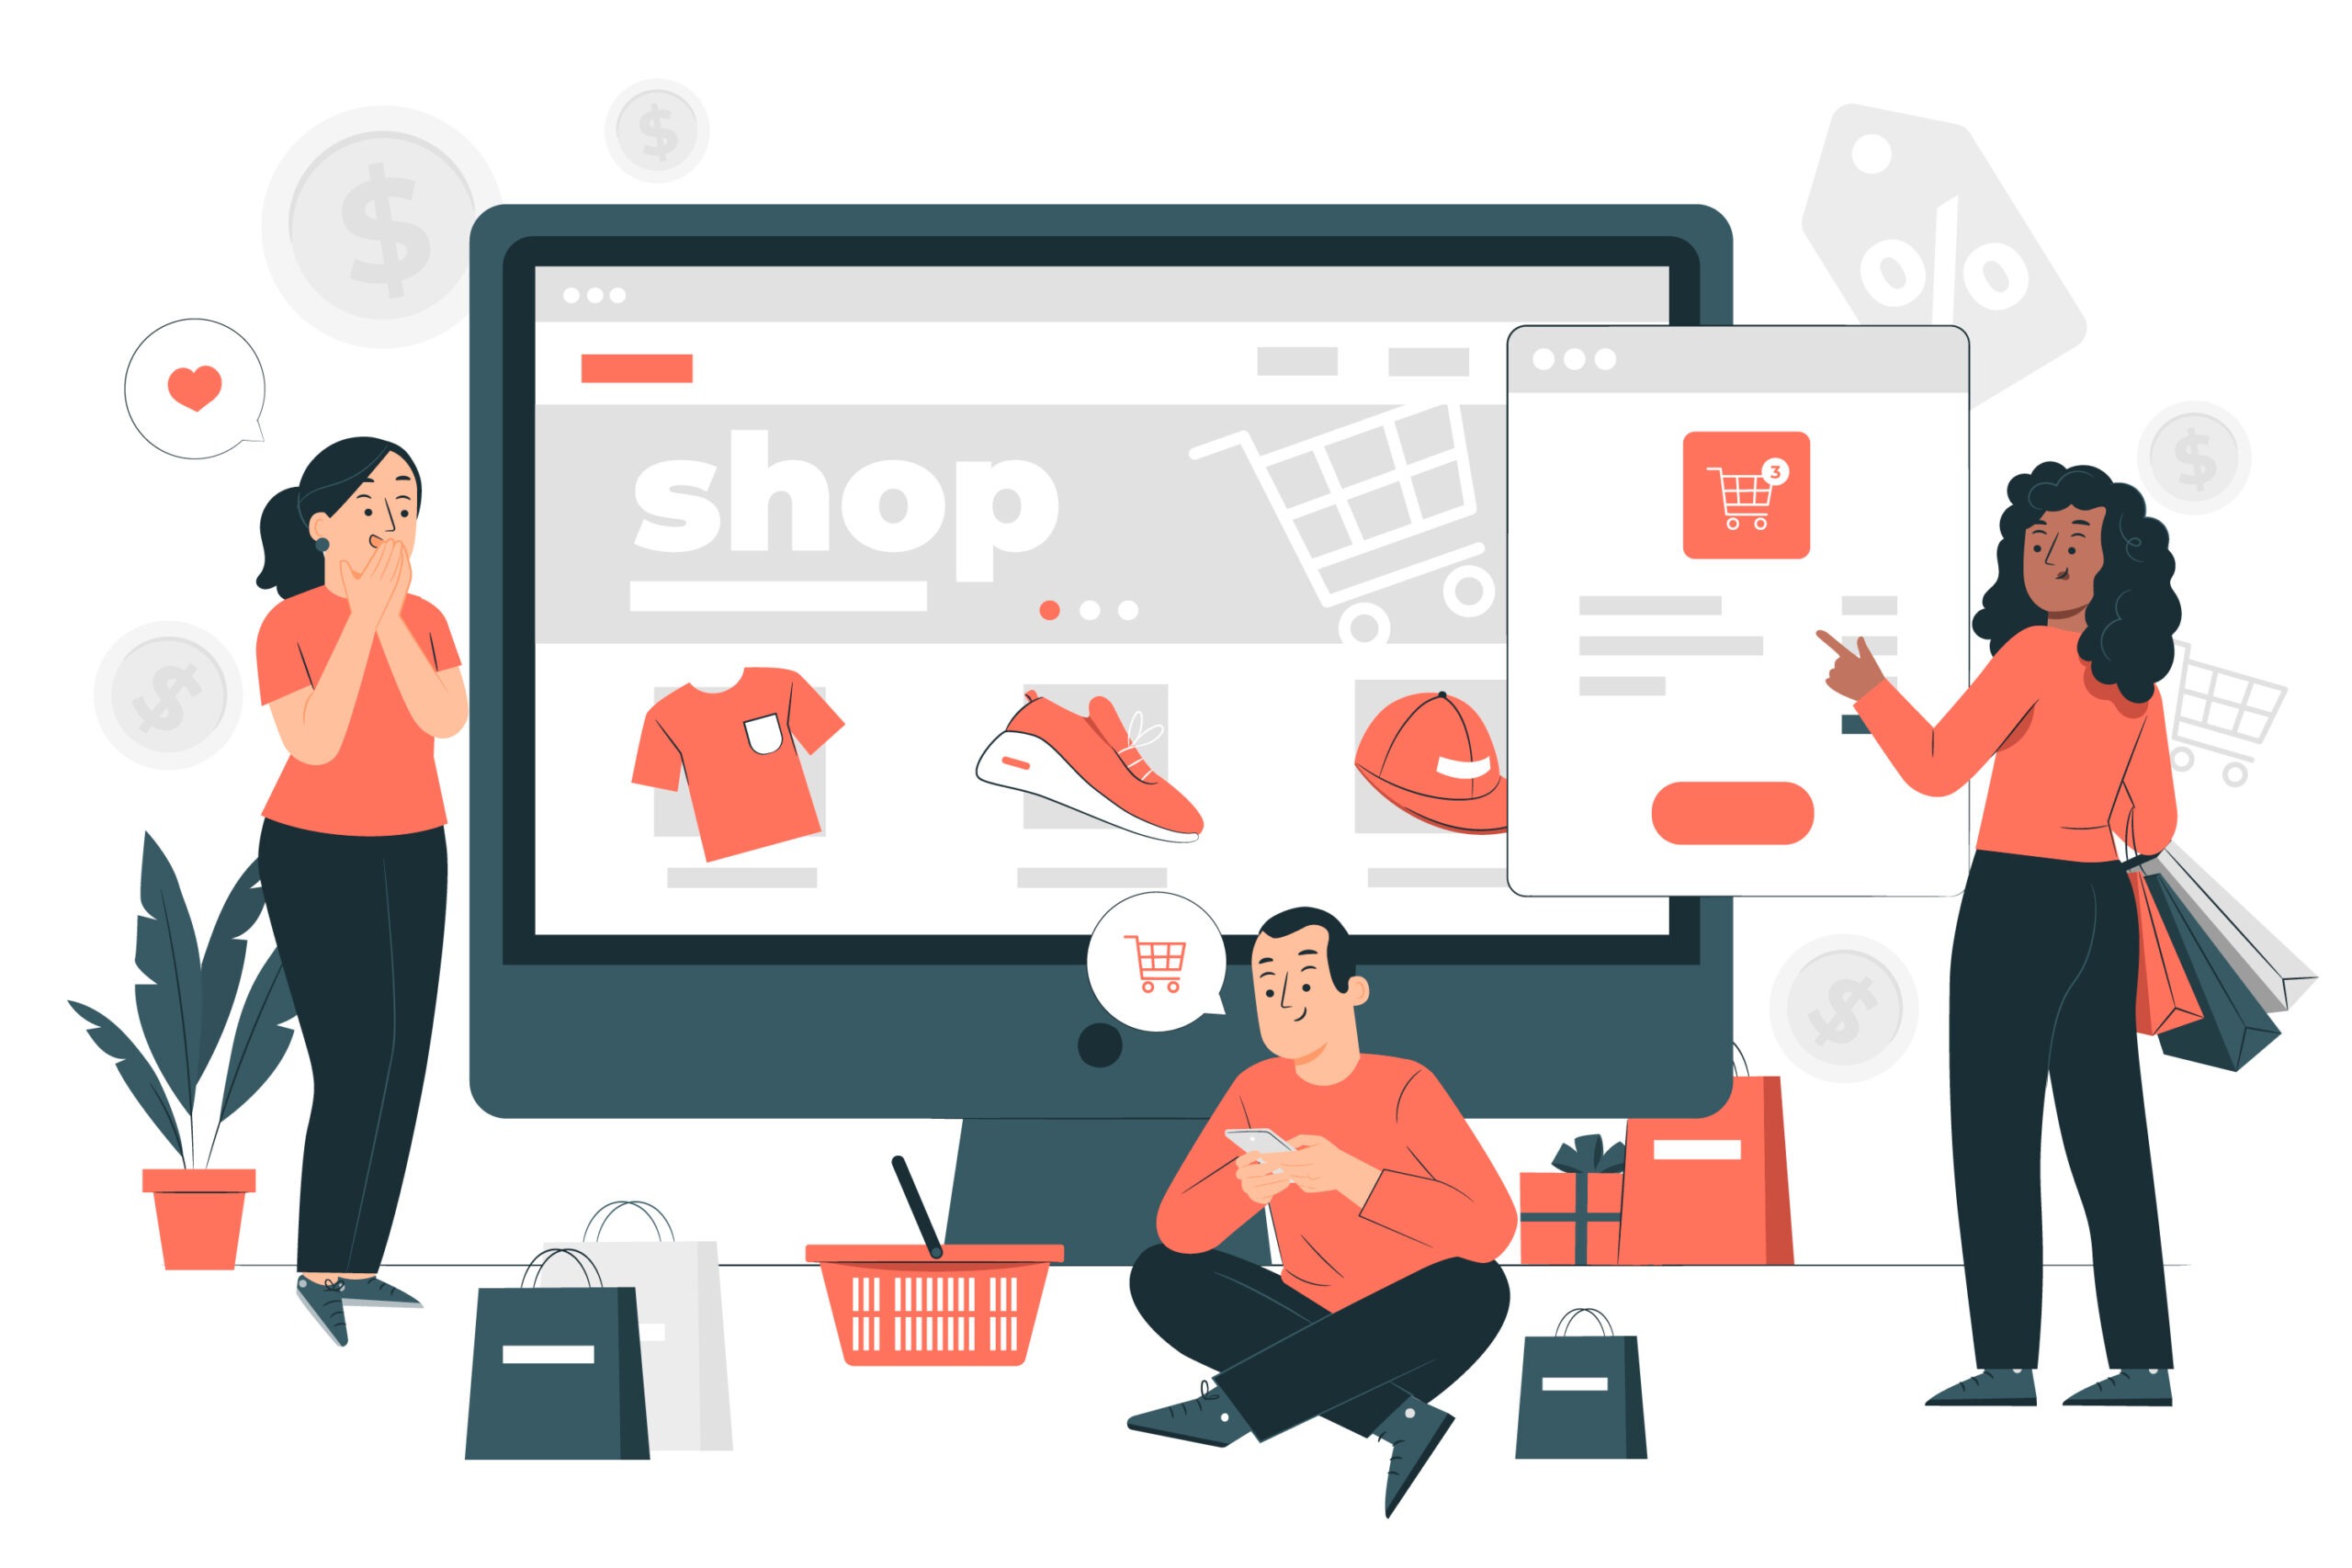
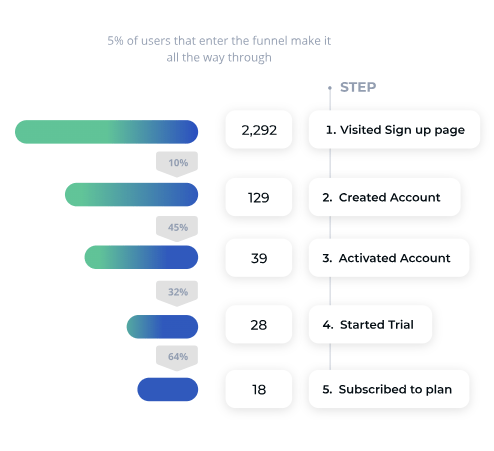
How to Build An Ecommerce Conversion Funnel That Works
No matter how good your product is, customers aren’t going to be lining up to buy it without an effective eCommerce conversion funnel. There are different stages of the buyer’s journey you need to strengthen if you want to maximize conversions. These make up the conversion funnel and, in eCommerce, it will be the driving…
-

What is Content Design? (+ 5 Step Checklist That We Use)
Graphic designers, content writers, copywriters, programmers, and web designers are all part of the standard roster for creating and running a website. However, a lot of people forget one crucial member of the dream team to tie it all together–the content designer. But what is content design? And how does it play into your business’ success? In…
-

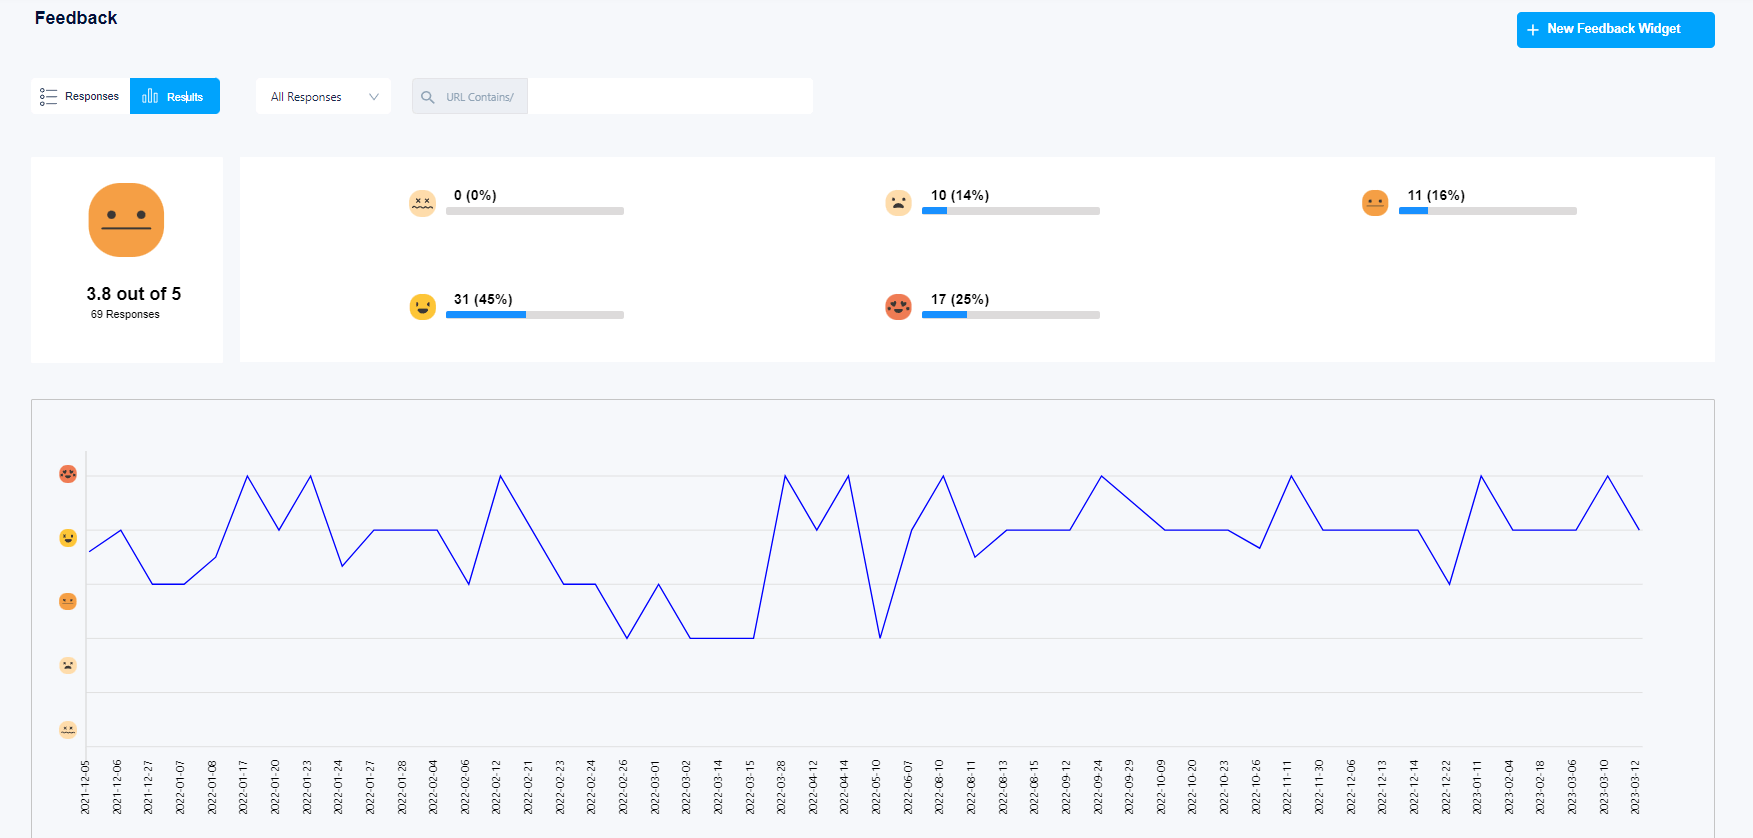
11 Customer Experience Metrics You Need to Track
You’ve perfected your branding, optimized your conversion funnel, and polished your website until it’s a shiny reflection of your brand’s mission, vision, and quality. Now what? The next logical step is to determine if your strategies are working, and one way to do that is to measure customer experience. Customer experience is the impression of…