
Most ecommerce stores convert under 3% of visitors, yet traffic budgets keep growing. Your site gets thousands of sessions monthly, but sales aren’t keeping pace. The gap between traffic investment and revenue return keeps widening.
A structured ecommerce CRO audit is the diagnostic process that separates guessing from fixing. It combines qualitative and quantitative data to pinpoint exactly where conversion leaks occur and how much revenue each one costs you. Think of it as user testing at scale: instead of assuming what breaks the experience, you watch real behavior and let the evidence direct your fixes.
Instead of random hero image changes or checkout copy tweaks, you get a systematic review of every conversion step, from analytics setup to checkout completion, with clear prioritization for what to fix first.
This guide covers data collection, quantitative analysis, qualitative research methods, and strategic prioritization. You’ll learn to combine funnel tracking with session replay evidence, audit critical pages systematically, and transform findings into revenue-generating improvements.
Key Takeaway
- Set up accurate funnel tracking before analyzing any conversion data
- Combine quantitative drop-off analysis with qualitative session replay evidence
- Audit product pages, checkout flow, and mobile performance systematically
- Prioritize fixes using impact, effort, and confidence scoring
- Build a quarterly audit cadence with weekly monitoring
FullSession provides the complete audit toolkit: funnel tracking shows where visitors drop off, session replay reveals why they abandon, and heatmaps uncover which elements drive or kill conversions.
Teams using this integrated approach find and fix the specific friction points that random optimization misses.
What Is an Ecommerce CRO Audit?
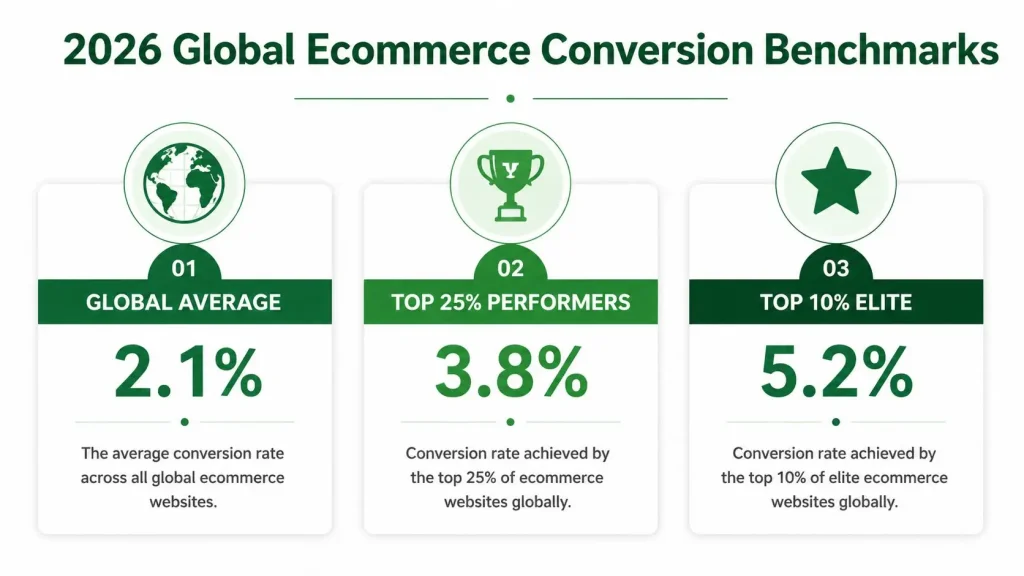
Image source: App Store Research
An ecommerce CRO audit is a structured review of every stage of the customer journey, combining quantitative funnel analysis with qualitative user behavior research to identify exactly where visitors drop off and why they abandon purchases.
The audit covers analytics setup verification, page-level conversion analysis, technical performance evaluation, and user behavior diagnosis. Unlike random optimization attempts, it provides a systematic methodology for finding and prioritizing the specific friction points that suppress revenue.
Run an ecommerce CRO audit quarterly, before major redesigns, after significant traffic changes, or when conversion rates decline month-over-month. Checkout conversion benchmarks help contextualize your audit findings against industry performance.
Why audits fail
Most conversion audits produce generic recommendations because teams skip the foundation work. Broken analytics tracking leads to decisions based on incomplete data.
Weak segmentation treats mobile checkout friction the same as desktop usability issues. Teams overreact to sitewide averages instead of isolating high-impact friction points.
Without a systematic prioritization framework, audit findings become scattered to-do lists that never get implemented.
Audit Metrics Defined
Sitewide conversion rate: Total orders divided by total sessions across all traffic sources and pages.
Cart-to-checkout rate: Sessions that reach checkout divided by sessions that add items to cart.
Checkout completion rate: Completed orders divided by sessions that begin the checkout process.
Step 1: Data Collection and Analytics Setup
Before you deep dive into funnel reports or session replays, confirm that all your tracking fires correctly. “Garbage in, garbage out” applies directly here. Broken GA4 events create false funnel analysis and lead to fixing the wrong things.
Many ecommerce brands make optimization decisions on broken GA4 data where events misfire, funnels are misconfigured, or key micro-conversions aren’t tracked. This leads to fixing the wrong friction points while missing actual revenue leaks.
Analytics audit checklist
- Verify GA4 ecommerce events fire correctly:
view_item,add_to_cart,begin_checkout, andpurchase - Check for duplicate sessions, missing page views, or unexplained traffic gaps in your funnel reports
- Confirm funnel step definitions match your actual customer journey stages
- Test ecommerce tracking on mobile devices and different browsers
- Validate that revenue attribution matches your actual order totals
Look for missing micro-conversion events, bounce rate anomalies above 70%, and sessions without corresponding page view events. These signal tracking problems skew conversion analysis.
Conversion funnel analysis in FullSession maps every step from the landing page to checkout completion, making it easy to confirm where actual drop-offs occur versus where tracking breaks result in false abandonment signals. The platform validates that funnel data matches real user behavior patterns.
Transform Your Conversion Audit Process With FullSession
Get the complete diagnostic toolkit to implement this audit framework effectively.
Step 2: Quantitative Analysis and Conversion Rates
Pull the hard numbers and compare them against industry standards for your product category. Without that benchmark context, your average conversion rates can look acceptable when they’re actually underperforming.
Remember: not everyone who visits converts, and that’s expected. But the gap between how many website visitors you attract and how many buy tells you exactly how much room you have to grow.
Segmented analysis reveals whether the problem is mobile performance, specific traffic sources, or particular product categories.
Quantitative audit process
- Review the sitewide conversion rate vs industry benchmarks for your product category
- Segment conversion rates by device (mobile vs. desktop), traffic source, and top landing pages
- Calculate average order value impact: identify sessions that convert but with lower AOV than expected
- Map the customer journey from landing page to purchase completion
- Identify pages with high exit rates, especially in the checkout process
Look for large mobile-to-desktop conversion rate gaps (mobile should not be less than 60% of desktop performance), specific pages with exit rates above 85%, and sessions that reach checkout but abandon before completion.
| Device | Benchmark Range | Top 20% Performance |
|---|---|---|
| Desktop | 2.2% – 3.1% | Above 3.5% |
| Mobile | 1.1% – 1.8% | Above 2.3% |
| Tablet | 1.8% – 2.4% | Above 2.8% |
According to Baymard Institute research, the global average cart abandonment rate is around 70%, but segmented analysis often reveals specific friction points affecting particular user groups disproportionately.
Conversion funnel analysis provides drop-off data per step with direct click-through to watch affected sessions, connecting quantitative loss points to qualitative behavior evidence for faster diagnosis.
Step 3: Qualitative Insights – Session Replay, Heatmaps, and Surveys
Qualitative data closes the “why” gap that numbers alone can’t answer. A single browsing session recording can reveal a mobile validation error, a confusing layout, or a CTA that blends into the background. Things that no analytics report shows on its own.
This is where UX analysis becomes essential: you’re not just counting drop-offs, you’re diagnosing the exact moment a user decides to leave.
Session replay analysis
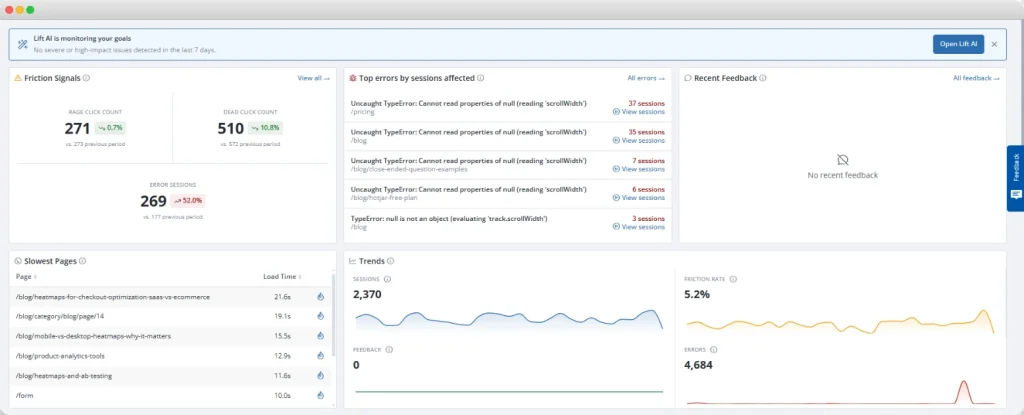
Session replay captures pixel-perfect recordings of real users navigating your store. Watch actual shopping sessions to identify friction patterns that analytics cannot detect: hesitation before CTAs, rage clicks on non-functional elements, or scroll behavior indicating confusion.
Focus on rage clicks (rapid repeated clicks indicating frustration), hesitation patterns before key CTAs, abandonment sequences on specific pages, and scroll depth on product pages. These signals reveal where many users encounter unexpected friction.
Session replay in FullSession captures replays with automatic frustration signal detection including rage clicks and dead clicks, then links sessions directly to funnel drop-off points for immediate context.
Heatmap analysis
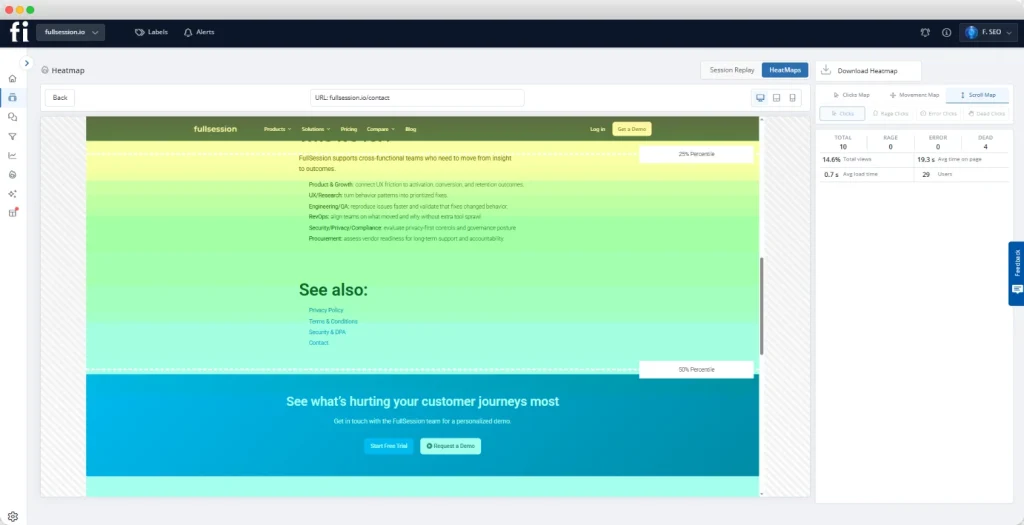
Click maps, scroll maps, and attention maps provide aggregate visual representations of visitor behavior across thousands of sessions. Heatmaps reveal patterns that individual session replay cannot: which elements consistently get ignored, where users scroll before abandoning, and whether CTAs are visible above the fold.
Analyze clicks on non-clickable elements (indicating user expectations), CTA visibility below scroll fold, elements users consistently ignore versus engage with, and attention patterns around key conversion elements like product images and add-to-cart buttons.
Interactive heatmaps in FullSession display click density, scroll depth, and attention across desktop and mobile devices without requiring separate tools or complex setup.
Feedback and survey insights
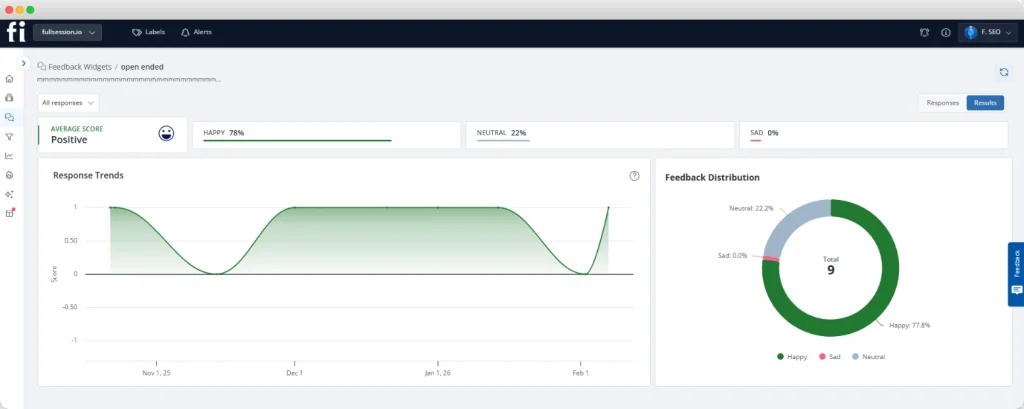
Customer interviews, on-site surveys, and in-page feedback widgets provide intent context that session replay cannot capture. Users may hesitate before purchasing due to unclear return policies, shipping cost concerns, or product information gaps that behavior analysis alone will not reveal.
Collect reasons for not purchasing, confusion about product information, unexpected shipping cost reactions, payment method preferences, and trust concerns about security or return policies.
Feedback tools in FullSession link in-page responses directly to session replays, so every piece of feedback includes behavioral context showing exactly what the user experienced before providing their response.
Start Your Free Trial With FullSession
See exactly where your visitors drop off and why with FullSession’s complete audit toolkit.
Step 4: Product Pages Audit
Product pages are where most ecommerce conversions are won or lost. High-quality images directly affect perceived value. A blurry or low-resolution photo signals a low-quality product, regardless of what the description says.
Fixing image presentation is one of the fastest ways to improve conversions without touching a single line of checkout code.
A product page converting at 1.2% versus 2.8% for similar products indicates specific friction: missing product information, unclear pricing, or weak social proof. These gaps compound throughout the entire funnel.
Product page audit checklist
- Assess image quality, quantity, and zoom functionality. Product images should load quickly and show key product details
- Check product descriptions for specificity and benefit clarity rather than generic feature lists
- Evaluate social proof elements: reviews, ratings, user-generated content, and trust badges
- Identify missing trust signals: return policy, shipping information, security badges
- Verify clear call-to-action visibility above the fold on both desktop and mobile
- Test add-to-cart functionality across different browsers and devices
Look for product images that are low-resolution or lack zoom capability, descriptions that list features without explaining benefits or use cases, missing or minimal reviews sections, and unclear add-to-cart CTAs that blend into page design.
Heatmaps show whether users reach and engage with the add-to-cart button, while session replay reveals hesitation patterns before purchase decisions, indicating specific elements that create doubt or confusion.
Step 5: Category Pages and Product Discovery
Most users arrive at particular pages within your category structure rather than landing directly on a product, and must self-sort to find their target item. Poor discovery leads to high bounce rates before products are even viewed.
Category page performance directly affects product page traffic. If users cannot filter effectively or product cards lack key information, they bounce before reaching product detail pages where conversions occur.
Category page optimization audit
- Test filter and sort functionality on both desktop and mobile devices
- Check category-to-product click-through rates to identify underperforming product cards
- Assess whether faceted navigation reduces friction or creates confusion
- Verify product cards include essential information: price, ratings, availability, and key features
- Test loading speed when filters are applied, or sort order changes
Look for patterns where users land on category pages and leave without clicking any products, filters that break or load slowly on mobile devices, and product cards missing critical information like price, ratings, or availability status.
Session replay on category pages shows scrolling patterns, filter interactions, and product selection behavior, while interactive heatmaps reveal which products consistently attract clicks and which are ignored despite prominent placement.
Step 6: Homepage and Landing Pages

Image source: Pexels
Your homepage and top landing pages are the front door of your ecommerce site. Hero images and above-the-fold content determine whether visitors stay or bounce immediately. Poor value proposition or slow loading elements waste traffic spend and suppress overall conversion rates.
Landing page performance affects all downstream conversion metrics. A homepage with 65% bounce rate forces the remaining 35% of traffic to convert at higher rates to maintain overall conversion targets, creating unnecessary pressure on product pages and checkout.
Landing page audit priorities
- Evaluate hero image relevance to search intent and loading speed across devices
- Check headline clarity versus value proposition. Does it immediately communicate what you sell and why it matters?
- Verify primary CTA prominence and positioning above the fold
- Assess whether social proof, trust badges, or customer testimonials are visible above the fold
- Test page load speed, especially for hero images and critical above-the-fold elements
Look for hero images that load slowly or appear irrelevant to the search intent that brought users to the page, missing or weak CTAs that do not stand out visually, and the absence of trust signals above the fold that would encourage continued engagement.
Interactive heatmaps reveal whether visitors scroll past the hero section and which CTAs generate clicks, while session replay shows drop-off patterns on landing pages segmented by specific traffic sources, revealing whether different campaigns require different landing page approaches.
Step 7: Cart Abandonment and Checkout Audit
This step diagnoses friction in the cart and checkout flow, where most recoverable revenue is lost. Not every visitor who adds to cart intends to complete checkout, but many who abandon do so because of friction you can remove.
Usability testing on your checkout flow, especially across mobile devices, often shows form field issues, unclear error states, and unexpected costs that kill conversions at the final step.
Cart page audit
Cart abandonment often occurs before users even reach checkout. The cart page must communicate the total cost clearly and remove final hesitations about purchase completion.
- Audit shipping cost transparency. Unexpected costs are the primary abandonment trigger, according to Baymard research on reducing cart abandonment
- Check for trust badges and security signals prominently displayed on the cart page
- Evaluate guest checkout availability. Forced account creation causes significant abandonment
- Test cart functionality: quantity changes, item removal, and coupon code application
Checkout flow audit
The checkout process requires balancing information collection with friction minimization. Every additional field or step increases abandonment risk, but insufficient information creates completion errors.
- Count form elements and eliminate unnecessary fields. Prioritize essential information only
- Audit payment options to ensure preferred payment methods are available
- Test error states: address validation failures, credit card errors, and promo code problems
- Verify mobile checkout functionality, especially form field usability and button accessibility
- Check checkout progress indicators and exit intent prevention
Error tracking and alerts catch JavaScript errors and failed interactions in the checkout flow automatically, while session replay of checkout sessions shows exactly where users stall, rage-click, or abandon, providing specific evidence for checkout recovery optimization.
Transform Your Checkout Process With FullSession
Identify and fix the specific checkout friction points that cost you revenue.
Step 8: Performance – Load Time and Technical Stability
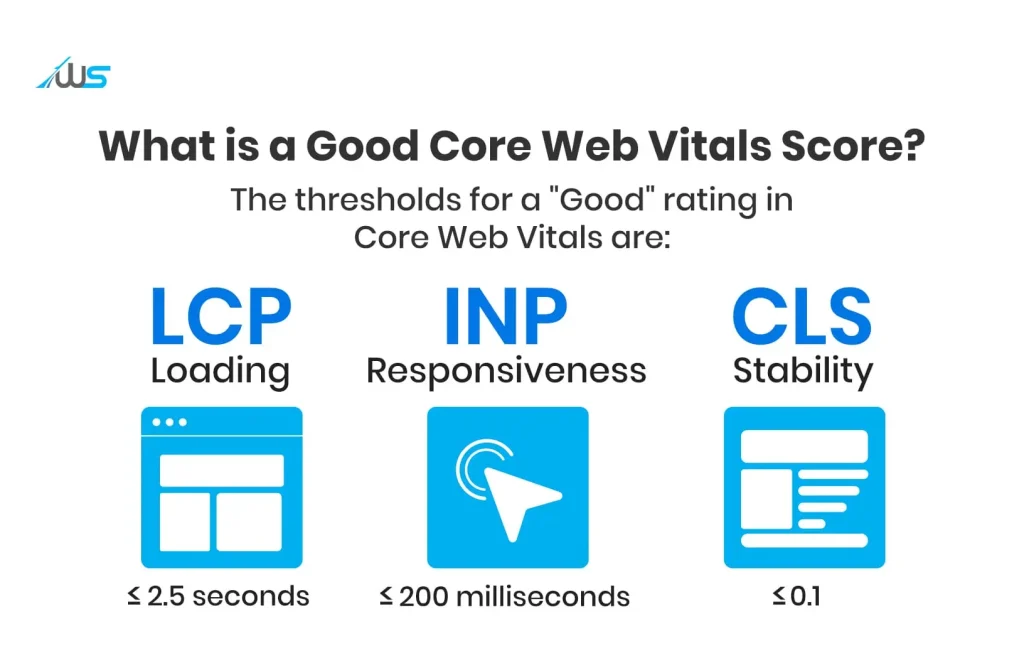
Image source: Webskitters
Technical performance directly affects whether users stay long enough to convert. Run Google PageSpeed Insights on every key page and pay close attention to your Core Web Vitals scores.
Cumulative layout shift, where page elements jump around as content loads, is a common culprit on product pages with heavy image assets. A quick win: compress images across your catalog before tackling more complex rendering or script issues.
Technical performance affects both user experience and search engine rankings, influencing both traffic quality and conversion potential. Mobile performance issues are particularly critical since mobile traffic often represents 50-70% of ecommerce sessions.
Technical audit priorities
- Run Google PageSpeed Insights on key pages: homepage, product pages, category pages, cart, and checkout
- Test mobile performance separately. Mobile connections and processing power create different optimization needs
- Identify uncompressed images, render-blocking scripts, and layout shift issues
- Check for broken forms, non-functional buttons, and JavaScript errors during checkout
- Test site functionality across different browsers and devices
Focus on pages with loading times above 3 seconds on mobile, layout shifts during page load where elements jump as images load, uncompressed product images, and render-blocking scripts that delay checkout page functionality.
Quick performance wins include compressing product images, implementing lazy loading for below-the-fold content, and eliminating render-blocking resources on critical conversion pages.
Error tracking and alerts show performance-related frustration signals automatically, while session replay shows sessions where slow loading correlates with abandonment, helping prioritize which performance optimizations provide the highest conversion impact.
Mobile-specific performance checkpoints
Mobile ecommerce friction patterns differ from desktop issues and require dedicated attention. Mobile checkout completion rates typically lag desktop performance due to form usability, touch interface problems, and connection variability.
- Test tap targets for adequate size and spacing, especially on checkout forms
- Check mobile form field behavior: auto-fill, validation messages, and input type optimization
- Audit mobile checkout flow for unnecessary horizontal scrolling or zoom requirements
- Test mobile-specific payment methods and ensure smooth integration
FullSession’s mobile session replay captures device-specific behavior patterns and interaction issues that desktop testing cannot identify, showing exactly how mobile users navigate checkout forms and where touch interface problems occur.
Step 9: Tests, Failed Tests, and Learnings
Review your A/B testing history to understand what worked, what failed, and why. Most ecommerce brands run tests but fail to build a learning repository. Failed tests provide valuable insights if interpreted correctly, while undocumented wins cannot be replicated or built upon.
Testing without systematic documentation leads to repeated mistakes and missed optimization opportunities. Teams often retest variations that previously failed or cannot explain why successful tests worked, limiting their ability to develop effective optimization strategies.
Testing audit methodology
- List all tests run in the past 12 months with clear hypothesis documentation
- Document the result, confidence level, and statistical significance for each test
- Identify patterns in failed tests: common threads like wrong audience segments, insufficient traffic, or inconclusive results misinterpreted as positive
- Review winning tests for replication opportunities across other pages or elements
- Assess testing methodology: sample sizes, duration, and external factor contamination
Look for tests launched without clear hypotheses, tests declared winners below statistical significance thresholds, no post-test documentation or follow-up validation, and repeated testing of similar variations without learning from previous results.
Conversion funnel analysis shows whether conversion rates actually changed after test implementations, while session replay lets you verify how test variants actually rendered for real users, catching implementation problems that skew test results.
Step 10: CRO Strategy, Prioritization, and Roadmap
Translate audit findings into a prioritized action plan rather than a scattered to-do list. Not all conversion blockers are equal. Teams with limited resources need a systematic scoring model to focus optimization efforts on fixes that deliver the highest revenue impact first.
Without clear prioritization, teams often optimize low-impact elements while high-revenue friction points remain unaddressed. The result is busy optimization work that fails to move overall conversion metrics meaningfully.
Impact scoring framework
Score each identified issue using three criteria: impact (revenue at stake), effort (development cost and time), and confidence (evidence strength). Build a 90-day roadmap prioritizing high-impact, low-effort opportunities first, followed by high-impact, high-effort projects with strong evidence.
| Priority | Impact | Effort | Confidence | Action |
|---|---|---|---|---|
| P0 | High | Low | High | Fix immediately |
| P1 | High | Medium | High | Schedule next sprint |
| P2 | Medium | Low | High | Quick wins batch |
| P3 | High | High | Medium | Requires validation |
| P4 | Low | Any | Any | Defer or test |
Focus first on issues affecting high-traffic pages with clear evidence of friction: checkout errors causing abandonment, mobile form problems preventing completion, or product page elements that consistently get ignored despite prominent placement.
FullSession’s Lift AI analyzes user behavior patterns to predict conversion impact and surface which issues to address first, reducing manual prioritization effort while improving accuracy of impact estimates. The platform connects behavior data to revenue potential, helping teams focus optimization resources on changes most likely to drive meaningful conversion improvements.
Check out these ecommerce conversion optimization strategies for broader context on systematic optimization approaches that complement audit findings.
Step 11: Measure, Report, and Iterate
Implementing the post-audit governance layer ensures optimization becomes continuous rather than a one-time event. Without a systematic reporting and review cadence, audit findings decay quickly, and teams drift back to random optimization guessing.
Establishing measurement protocols before implementing changes allows teams to validate impact and build on successful optimizations. Weekly monitoring catches new issues before they compound, while quarterly full audits ensure systematic review as traffic patterns and user behavior evolve.
Ongoing audit cadence
- Set weekly conversion metrics review: key funnel step completion rates, top abandonment pages, and conversion rate trends
- Schedule quarterly full audits using this same methodology to catch new friction points and validate previous fixes
- Report changes in average order value, checkout completion rate, and sitewide conversion rate against pre-audit baselines
- Monitor for new error patterns, changing mobile behavior, and seasonal conversion variations
Conversion funnel analysis dashboards provide always-on visibility into conversion rates per step, while error tracking and alerts notify teams automatically when new technical issues emerge between scheduled audits, maintaining conversion performance without constant manual monitoring.
Repeatable Audit Checklist with FullSession
Use our comprehensive checklist covering all 11 audit steps, designed for quarterly implementation and systematic optimization. Each item connects to specific FullSession features that provide the evidence needed for accurate diagnosis and prioritization.
- Analytics setup: Verify Google Analytics (GA4) ecommerce events and use conversion funnel analysis to validate tracking accuracy
- Quantitative analysis: Review conversion rate benchmarks and segment performance by device, traffic source, and landing page
- Qualitative research: Watch session replay of high-exit pages and analyze interactive heatmaps for engagement patterns
- Product page audit: Check image quality, description clarity, social proof, and add-to-cart button visibility
- Category page review: Test filter functionality and product card completeness across devices
- Landing page evaluation: Assess hero image relevance, value proposition clarity, and CTA prominence
- Checkout audit: Use error tracking and alerts to identify form problems and abandonment patterns
- Performance check: Test page speed and test mobile session replay for device-specific issues
- Testing review: Document all tests with results and replicate successful patterns
- Prioritization: Use Lift AI to score issues by impact and build 90-day roadmap
- Monitoring setup: Establish weekly metrics review and quarterly audit schedule
This systematic approach ensures comprehensive coverage while connecting each audit step to specific diagnostic tools. Teams can implement the full framework quarterly or focus on specific sections when addressing targeted conversion problems.
Conclusion About Ecommerce CRO Audit
This 11-step ecommerce CRO audit framework provides a systematic approach to identifying and prioritizing conversion optimization opportunities. By combining quantitative funnel analysis with qualitative user behavior research, teams can diagnose specific friction points rather than guessing what might improve performance.
Ecommerce brands that implement structured audit processes consistently outperform those making random optimization attempts. The framework connects data setup, behavior analysis, performance evaluation, and systematic prioritization into a repeatable process that scales with business growth and evolving user expectations.
FullSession’s integrated platform supports every step of this audit methodology, from funnel tracking and session replay to heatmap analysis and error detection, providing the comprehensive diagnostic toolkit needed to transform audit findings into measurable conversion improvements.
Ready to Audit Your Ecommerce Conversion Rate With FullSession?
Start implementing this audit framework with FullSession’s complete diagnostic toolkit.
Frequently Asked Questions
Can a CRO be audited?
Yes. A CRO audit reviews the performance of your conversion rate optimization program itself, checking whether your testing methodology, data tracking, and prioritization process are sound. Beyond auditing individual pages, it validates whether your CRO strategy is producing consistent, measurable results over time.
What is a CRO in ecommerce?
CRO in ecommerce refers to conversion rate optimization, the practice of increasing the percentage of visitors to your online store who complete a desired action, usually a purchase. It combines quantitative analysis of funnel data with qualitative research including session replay, heatmaps, and surveys to identify and remove friction from the customer journey.
What is the ecommerce CRO checklist?
An ecommerce CRO checklist is a structured set of audit items covering analytics setup, product pages, category pages, homepage, checkout flow, site performance, and testing methodology. The goal is to systematically review every stage of the conversion funnel and identify specific conversion blockers to fix.
What does CRO audit mean?
A CRO audit (Conversion Rate Optimization audit) is a comprehensive review of your ecommerce website to identify why visitors are not converting into customers. It examines your data setup, user behavior, page design, checkout flow, and performance to produce a prioritized list of improvements that can boost conversions.

Roman Mohren is CEO of FullSession, a privacy-first UX analytics platform offering session replay, interactive heatmaps, conversion funnels, error insights, and in-app feedback. He directly leads Product, Sales, and Customer Success, owning the full customer journey from first touch to long-term outcomes. With 25+ years in B2B SaaS, spanning venture- and PE-backed startups, public software companies, and his own ventures, Roman has built and scaled revenue teams, designed go-to-market systems, and led organizations through every growth stage from first dollar to eight-figure ARR. He writes from hands-on operator experience about UX diagnosis, conversion optimization, user onboarding, and turning behavioral data into measurable business impact.