Author: Mohamed Sehwail
-

How to Create a User Engagement Strategy (9 Step Checklist)
An engaged user audience is the best type of audience you can have. They click on your links, interact with your content, sign up for your stuff, and–most importantly–make purchases. Not only do they directly benefit your brand, but their engagement also helps increase brand awareness to other potential customers. However, keeping users engaged is…
-
What Is A Conversion Funnel And Why Is It Important? (Full Guide)
In today’s competitive digital market, every click could lead to either a treasure trove or a dead end. If you want to stand out from the competition, understanding the map to success is crucial. But what exactly is that map? An effective conversion funnel is your secret weapon to crafting a customer journey that not only delights…
-
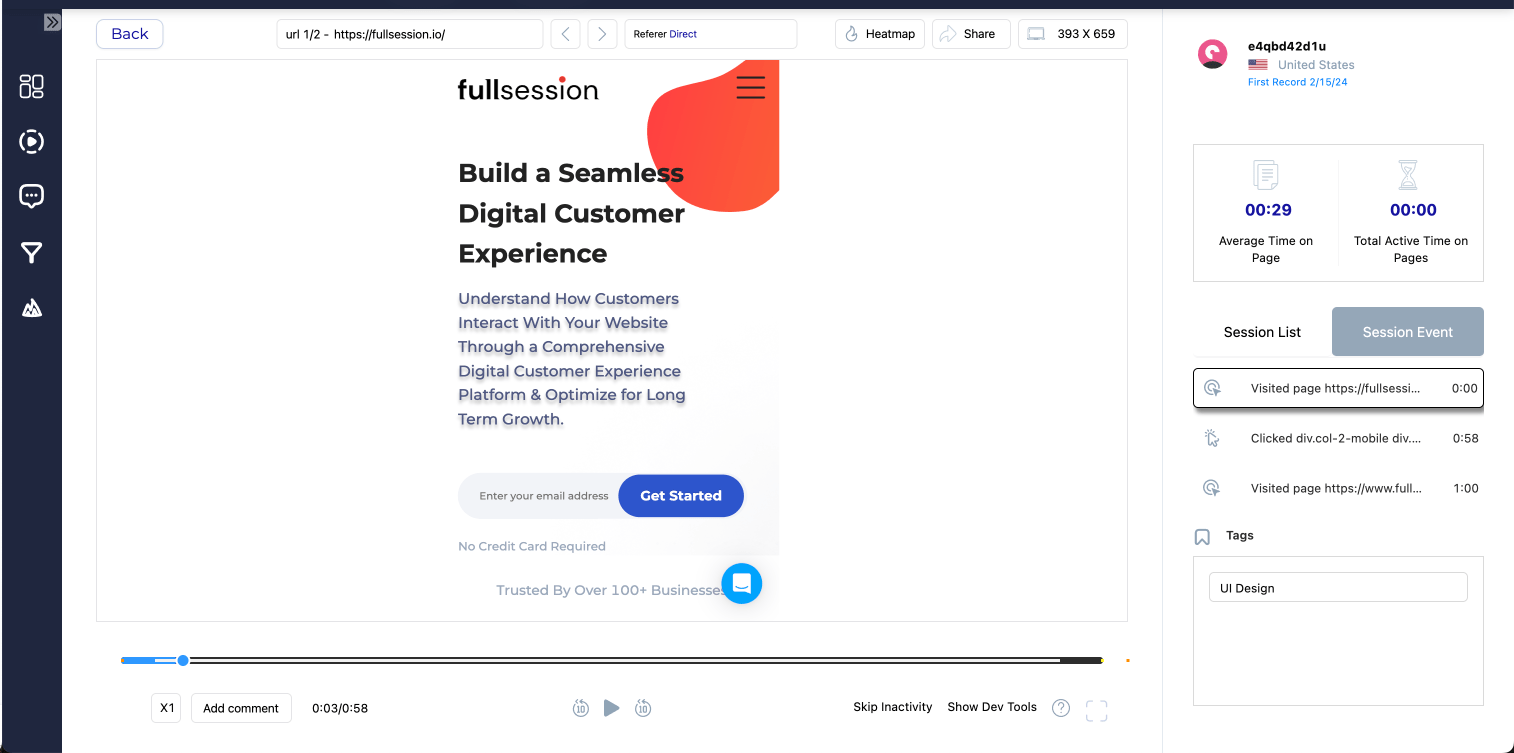
What Is Mobile Analytics? And How Can It Improve UX?
According to recent statistics, more than 55% of website traffic comes from mobile devices. That said, optimizing your website for mobile is just as important as perfecting your desktop interface. One way to do that is through mobile analytics. Understanding your mobile audience is a must to gain more insight into your website metrics. If your…
-

5 Psychographics Examples For Your Marketing Campaign
Do you know what motivates your customers to buy? Demographics provide valuable information that helps shape your ideal customer profile and learn more about your target audience. It tells you who your customer is through broad categories like age, location, and race. But while all this data is important, it doesn’t tell you why your…
-

Differences Between Exit Rate vs. Bounce Rate Explained
The success of your business hinges on more than just attracting visitors to your website. It’s about making them stay, engage, and convert. Two critical metrics that give insight into how well your website retains visitors are the bounce rate and exit rate. NEXT STEPS Apply this to your product Session Replay (see the why)…
-

Website Retention Rate: Definition, Role, And 5 Quick Tips
Are you struggling to keep users engaged on your website? Well, you’re not alone. With so much competition for online attention, retaining visitors can be a challenge. Did you know that improving website retention can increase user satisfaction and conversion rates? NEXT STEPS Apply this to your product Compare: FullSession vs FullStory Session Replay (see…
-

Quantitative Data: Definition, Pros and Cons & Analysis Techniques
Researchers rely on standardized quantitative data collection to ensure consistency and reliability, and most importantly, to allow for the objective analysis of data collected to inform conclusions and predictions. In this article, we will see which the the most popular data collection methods, see how to analyze the information we have gathered, and we will…
-

Qualitative Data: Definition and Ways to Collect It (+Use Cases)
Knowing everything about customers sometimes goes beyond numbers. That’s the point of qualitative data—it captures life’s rich narratives beyond mere numbers. Dive into this read to get savvy about how these vibrant details shape research in ways spreadsheets never could. In this article, we’ll also show you some real-world examples where this data collection method…
-

Qualitative Vs Quantitative Data (Differences, Pros And Cons)
Qualitative vs quantitative data. These two are the essence of data analysis, and for some, there is a clear winner. But don’t be too quick to judge. We’ll walk through what sets these two apart—and then dig into how they work in the real world. From capturing life’s complexities through qualitative means to crunching numbers…
-

Close-Ended Questions: Benefits, Use Cases, And Examples
Close-ended questions are the “essence” of each survey and poll, as they can bring the numbers and help you gain more data-based insights and eliminate all the guesswork. In this article, we’ll see what close-ended questions are, go through the main types and use cases, and finish up with some valuable examples that can help…