Author: Mohamed Sehwail
-
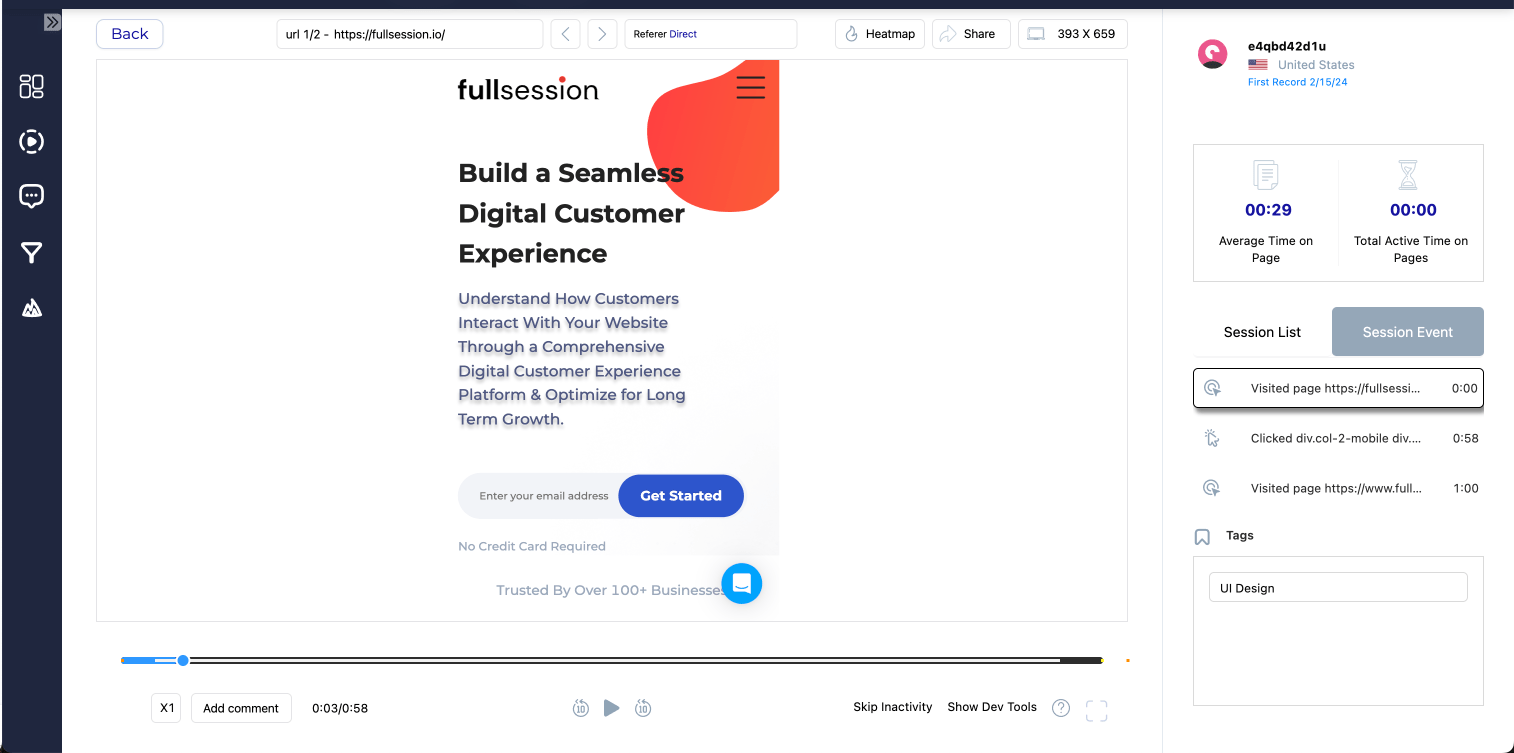
CRO for Mobile: Definition, Advantages, and Best Practices
Traffic share of mobile traffic for all types of businesses is increasing year by year, which comes as no surprise since we spend more than half our time on mobile instead of desktop. But what does this mean for businesses? Simply put, you’re missing out on a big chunk of your target market if you’re…
-

11 Types of Survey Response Bias & How to Resolve Them
A survey is supposed to give you reliable and actionable opinions from your audience. However, response bias can be a huge roadblock to getting the most accurate results you need. What is response bias and its different kinds? What happens when you use inaccurate responses? And how can you avoid response bias in your survey…
-

A Beginner’s Guide to Psychographic Segmentation
Psychographic segmentation tells you how you can connect with your audience groups and maximize your conversions. What motivates your customers to buy? What type of marketing campaigns are they most likely to respond to? What psychographic traits can make them hate or love your brand? Psychographic segmentation answers all these questions and more. In this…
-

Concept Testing: Everything You Need to Know
Whether you’re testing new products, pricing structures, or marketing ideas, you want to run it by the people whose feedback matters the most: your target audience. This is called concept testing. In this article, we’ll dive deep into the definition of concept testing, the benefits of concept testing, concept testing use cases, and how to…
-
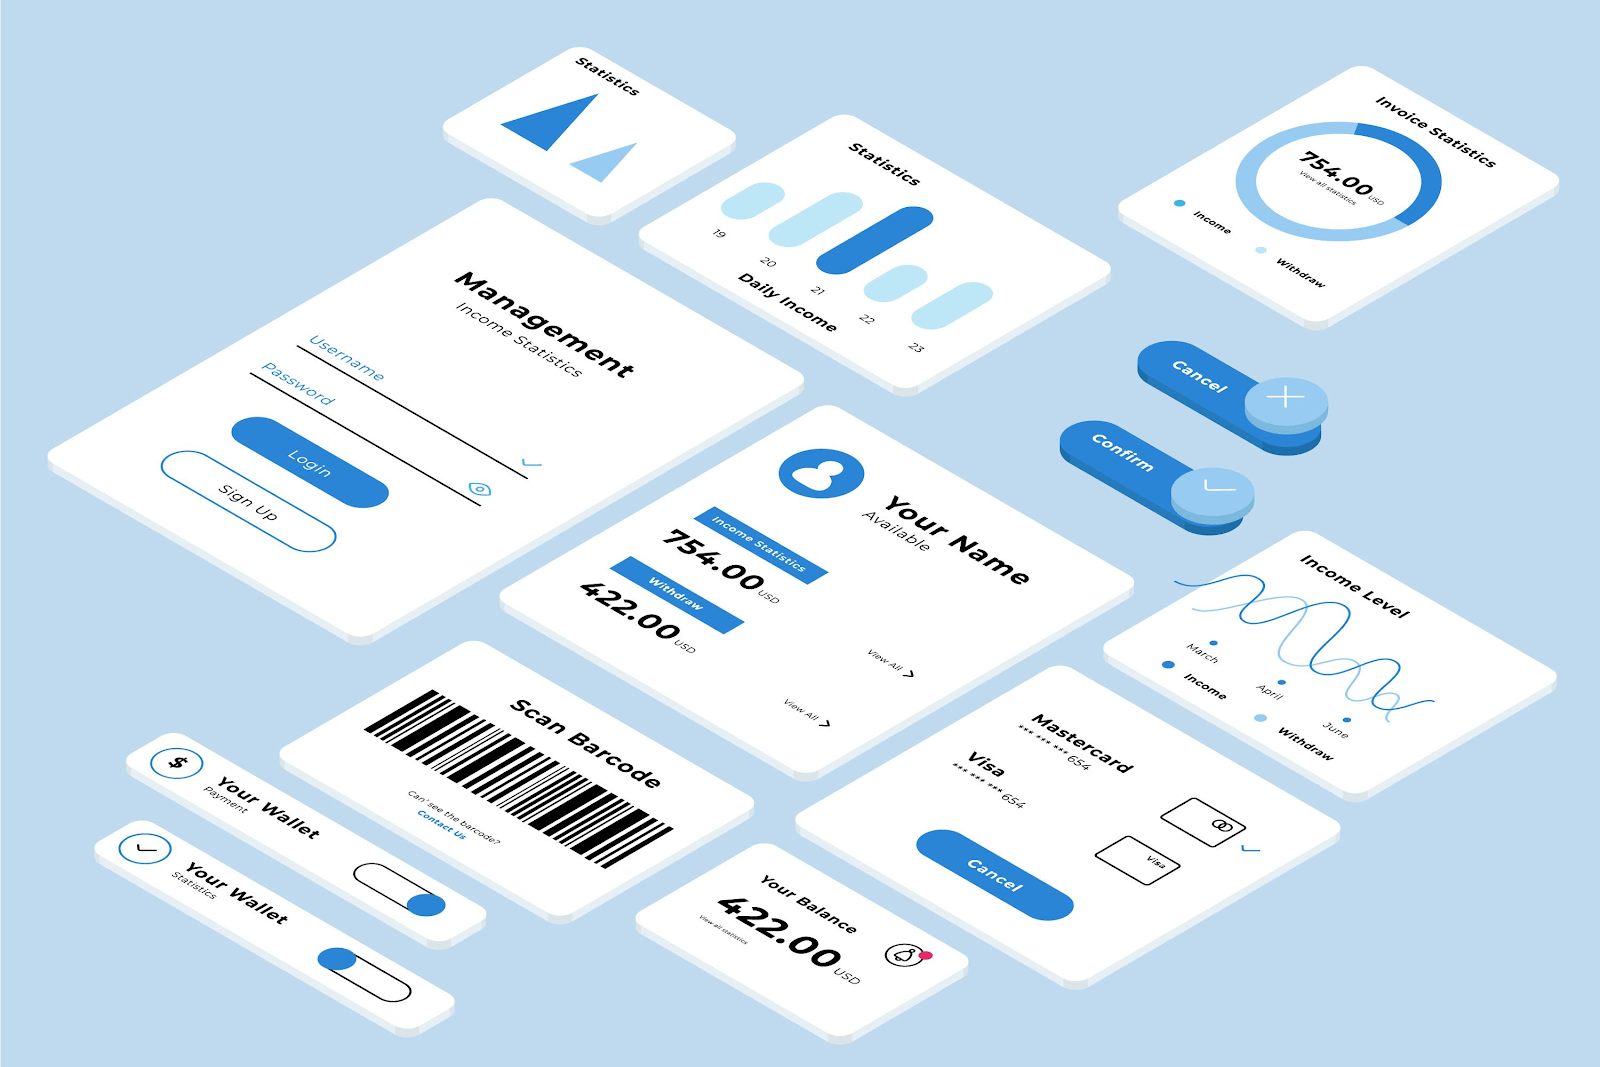
17 Best UI Design Tools of 2025
Maybe you’re creating a new website from scratch. Or perhaps re-launching an existing website with multiple improvements. Either way, you need user interface design tools to make sure your website is 1) aesthetically pleasing and 2) user-friendly. You don’t have to be a UI designer to know that this endeavor requires more than one tool.…
-

Marketing Analytics: What it Is, Why it Matters, and How to Start
Crafting top-notch marketing campaigns is just half of the work. At the end of the day, you still have to find out if those marketing activities worked as well as they should. Marketing analytics is the key to optimizing your campaigns through data-driven decisions. In this guide, we’ll do a deep dive into marketing analytics,…
-

How to Test Product Market Fit: The Ultimate Guide
Your product may be set to be the most revolutionary thing to grace your industry, but how do you know whether it will soar upon launch or crash and burn? This is where product market fit comes in, and all startups go through this process. In essence, product market fit is when your product serves…
-

Macro Conversion vs Micro Conversion: A Comprehensive Guide
Regardless of what your business is offering, the number of people who become successful conversions ultimately affects your bottom line and, in turn, your overall business health. As a business leader or marketing manager, your job is to find out what affects that number and figure out how to maximize it. Let’s start with the…
-

What is a UX Researcher: Everything You Need to Know
The user experience is how a person feels when interacting with a system, product, or service. Naturally, companies want that experience to be as positive as it can be, which is more likely to lead to conversions and, ultimately, a better bottom line. To do that, companies analyze the user experience and find the best…
-

8 Crucial Steps for a Successful Website Relaunch
Does your website look outdated? Is it getting harder and harder to generate leads? Or perhaps you want to make your website more mobile-friendly? Whatever the reason may be, a site overhaul requires a careful, step-by-step approach to be successful. NEXT STEPS Apply this to your product Session Replay Heatmaps CRO for Product teams Start…