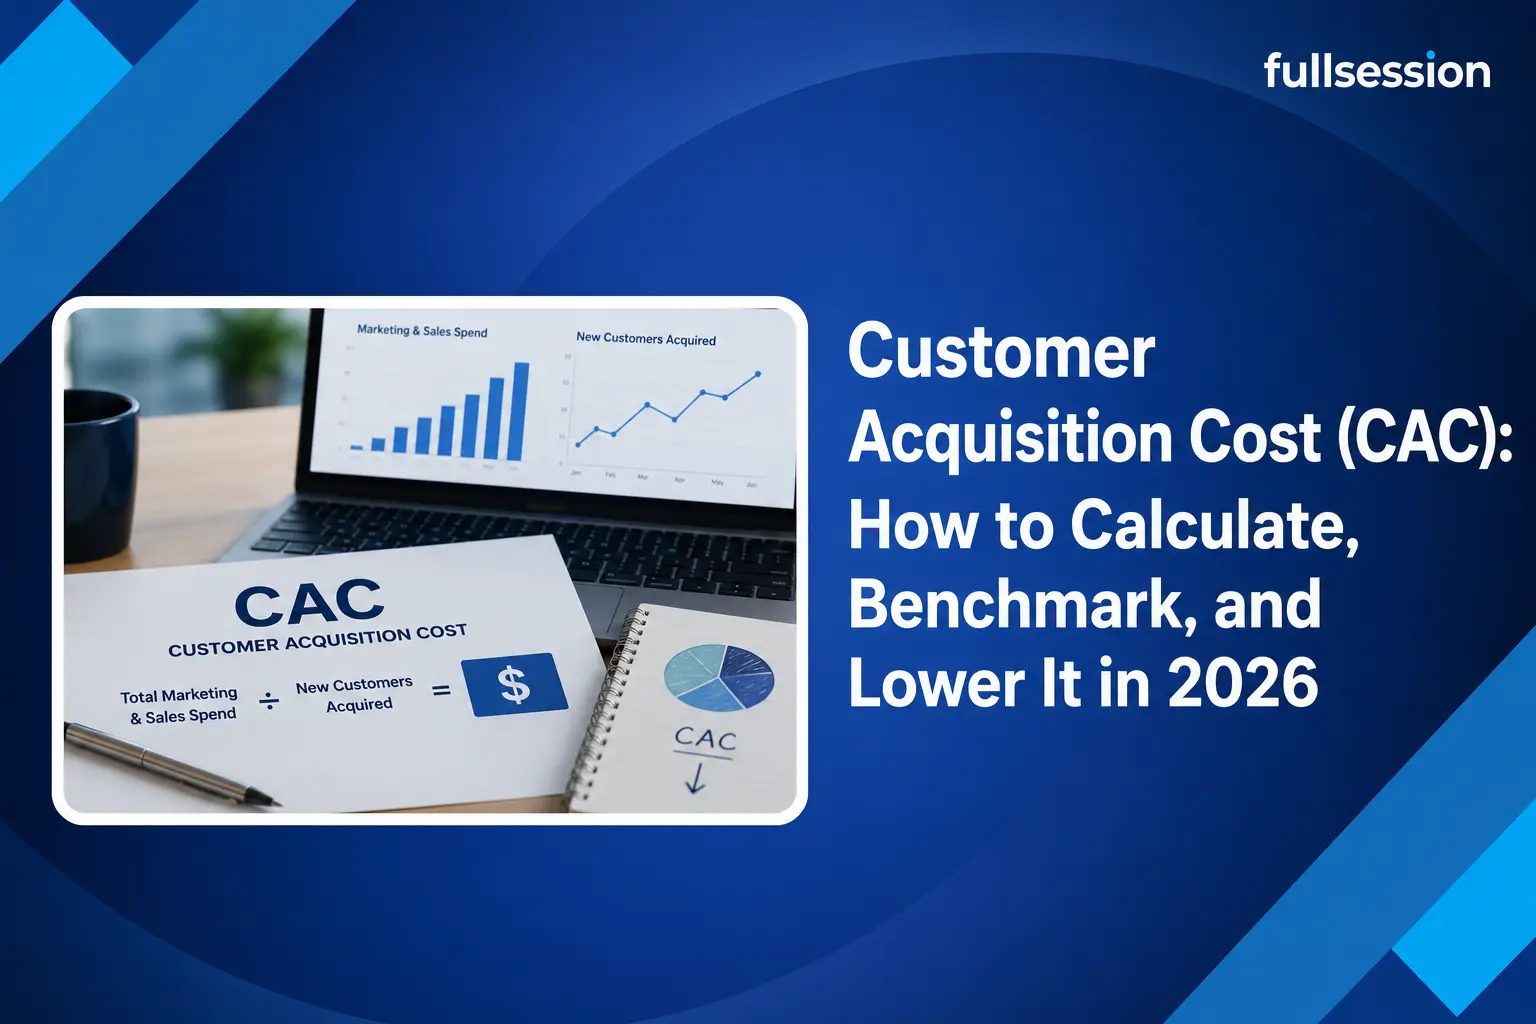

The quarterly review lands and the customer acquisition cost line is pointing the wrong way. Spend is up, the pipeline looks busy, and each new customer somehow costs more than the last. Someone asks the obvious question: where is the money going? The dashboard shows CAC climbing but not the reason, and that gap is where most acquisition budgets quietly bleed.
CAC is one of the few numbers that decides whether growth is a business or just an expensive habit. This guide covers what it really measures, how to calculate it without fooling yourself, current benchmarks by industry with sources, and the part most articles skip: why the CAC you report is often wrong, and how to see the on-site behavior that is inflating it.
QUICK TAKEAWAY
CAC is the total sales and marketing cost to win one customer. You set it when you spend, but you decide it on-site, through how much of the traffic you paid for actually converts. Cut the wasted spend hiding in funnel drop-off, form friction, and dead ends, and CAC falls without a bigger budget. Read it next to lifetime value, never alone.
What customer acquisition cost actually is
Customer acquisition cost is the total amount you spend on sales and marketing to acquire one new customer over a defined period. It is the price of growth, expressed per customer, and it is the counterweight to every optimistic revenue projection.
One quick clarification, because the term gets muddied. In accounting, “acquisition cost” can mean the fully loaded cost of buying an asset, a building, a machine, a company, which is capitalized on the balance sheet and then depreciated over its useful life. That is a different metric with a different purpose. When marketing, growth, and product teams talk about acquisition cost, they mean customer acquisition cost: the operating spend it takes to convince someone to become a customer. That is the version this guide is about, because it is the one you can influence week to week.
CAC matters for three reasons. It tells you whether a channel is profitable, it sets the pace you can afford to grow at, and it is half of the single most important efficiency ratio in any subscription or repeat-purchase business: lifetime value to CAC. A number this central deserves to be measured precisely, and most teams measure it loosely.
How to calculate CAC (and the versions that matter)
The core formula is simple:
CAC = total sales and marketing spend / new customers acquired in the same period
Spend 60,000 dollars in a quarter across ads, tools, salaries, and creative, win 200 new customers, and your CAC is 300 dollars. The arithmetic is not the hard part. The hard part is what you include and how you segment, because three different CAC numbers can come from the same quarter.
Fully loaded versus media-only. Media-only CAC counts just ad spend and flatters every channel. Fully loaded CAC adds the salaries of the people running acquisition, the software they use, agency fees, and content and creative production. Fully loaded is the honest number, and it is usually far higher than the one in your ad platform.
Blended versus paid. Blended CAC divides all acquisition spend by all new customers, including the ones who arrived through organic search, referrals, and word of mouth. Paid CAC isolates the customers who came from money you spent to reach them. Blended almost always looks better, because free channels subsidize the average. If you only watch blended CAC, a paid channel can run at a loss for months while the healthy blended figure hides it. Track both, and track paid CAC by channel so the loss has nowhere to hide.
This is also where organic pays off. First Page Sage’s 2026 benchmarks show organic CAC coming in lower than paid CAC in nearly every industry, which is why a strong customer acquisition funnel and good marketing analytics compound in a way that paid media never does. You rent paid traffic. You own organic.
CAC benchmarks: what good looks like in 2026
Benchmarks are a starting line, not a scoreboard. Your model, price point, and sales motion move the number more than any industry average. Still, it helps to know the neighborhood. The table below uses First Page Sage’s 2026 B2B analysis, which splits the blended figure into its organic and paid halves.
| Industry | Blended CAC | Organic CAC | Paid CAC |
|---|---|---|---|
| eCommerce | $86 | $87 | $81 |
| B2B SaaS | $239 | $205 | $341 |
| Cybersecurity | $387 | $345 | $512 |
| Software development | $720 | $680 | $841 |
| Manufacturing | $723 | $662 | $905 |
| Legal services | $749 | $584 | $1,245 |
| Financial services | $784 | $644 | $1,202 |
| Education | $1,143 | $862 | $1,985 |
The absolute number matters less than what sits next to it. CAC only tells you something when you read it against lifetime value. The widely used floor is an LTV to CAC ratio of 3 to 1: a customer should be worth at least three times what you paid to win them. Below that, you are buying revenue at a loss, or close to it. Far above it, you may be underinvesting and leaving growth unclaimed.
The second half of the picture is CAC payback period, or how many months of margin it takes to earn the acquisition cost back. The old rule of thumb is twelve months, though recent SaaS medians reported in Benchmarkit’s 2025 metrics sit well beyond that, which is one reason acquisition efficiency is under more scrutiny than it has been in years. For a fuller view of how these fit together, our guide to SaaS metrics maps CAC alongside the rest of the unit economics.

Why your reported CAC lies to you
Here is the uncomfortable truth behind the tidy CAC figure in your dashboard. That number is set the moment you spend, but the cost you actually pay per customer is decided later, on your own site, by how many of the visitors you paid for make it through to a conversion. Reported CAC assumes your funnel converts the way it is supposed to. Effective CAC is the real cost after your landing pages, forms, and checkout take their cut.
Ad platforms keep getting more expensive, so this gap keeps widening. WordStream’s 2025 benchmarks put the average Google Ads cost per click at 5.42 dollars, up from 4.66 dollars a year earlier, with costs rising across most industries. When traffic costs more, every conversion you lose on-site costs more too. The waste does not show up as a line item. It hides inside the funnel as drop-off, and inside sessions as friction.
Walk through the math. Say you buy 20,000 visitors at 3 dollars per click, which is 60,000 dollars. Your landing-page-to-paid conversion rate is 1.0 percent, so you win 200 customers, and CAC is 300 dollars. Now suppose a broken step in your signup flow, an error on mobile, a form field that rejects valid input, is quietly costing you conversions. Fix it, lift paid conversion from 1.0 percent to 1.4 percent, and the same 60,000 dollars now produces 280 customers. CAC falls to 214 dollars. That is a 29 percent cut in acquisition cost with zero extra media spend, purely from converting more of the traffic you already bought.
If your LTV is 900 dollars, that same fix moves your LTV to CAC ratio from a shaky 3 to 1 up past 4 to 1. Nothing changed about the market or the budget. You just stopped paying for visitors you were letting fall through the floor.
Find the leak: where paid traffic actually drops
To lower effective CAC you have to see where the traffic you paid for disappears, and then why. This is where a raw analytics number stops helping and observed behavior takes over. The loop has three moves.
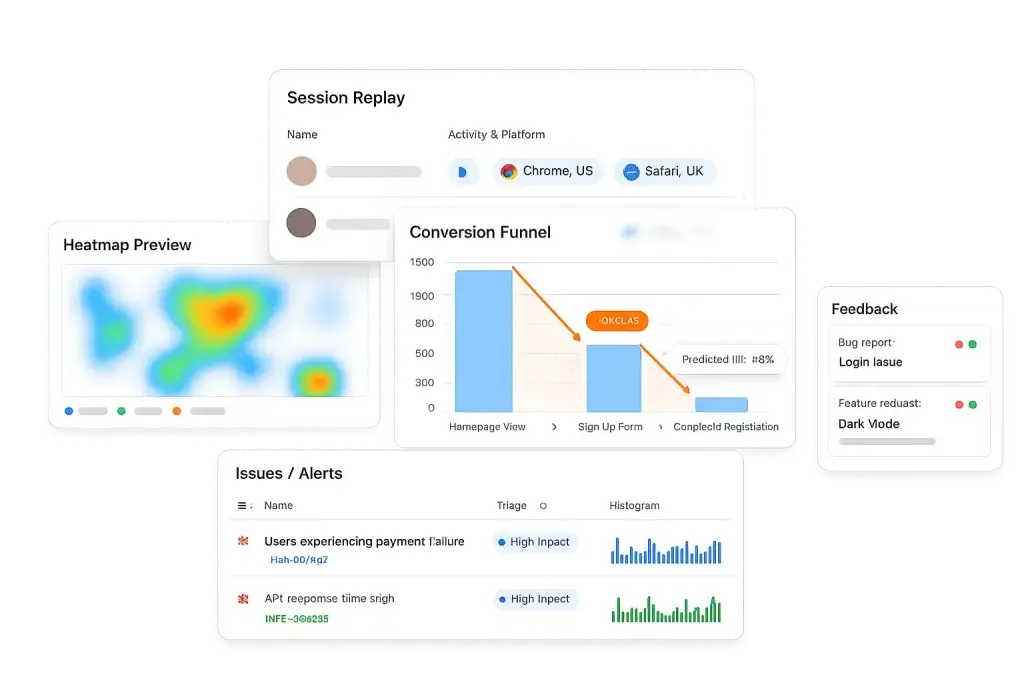
First, quantify the leak. A conversion funnel lays out each step from paid landing to activated customer and shows the exact stage where the biggest share of paid traffic falls out. That step is your biggest opportunity to cut CAC, because a small percentage recovered there flows straight through to a lower cost per customer. Our walkthrough of conversion funnel analysis covers how to build one that maps to spend.
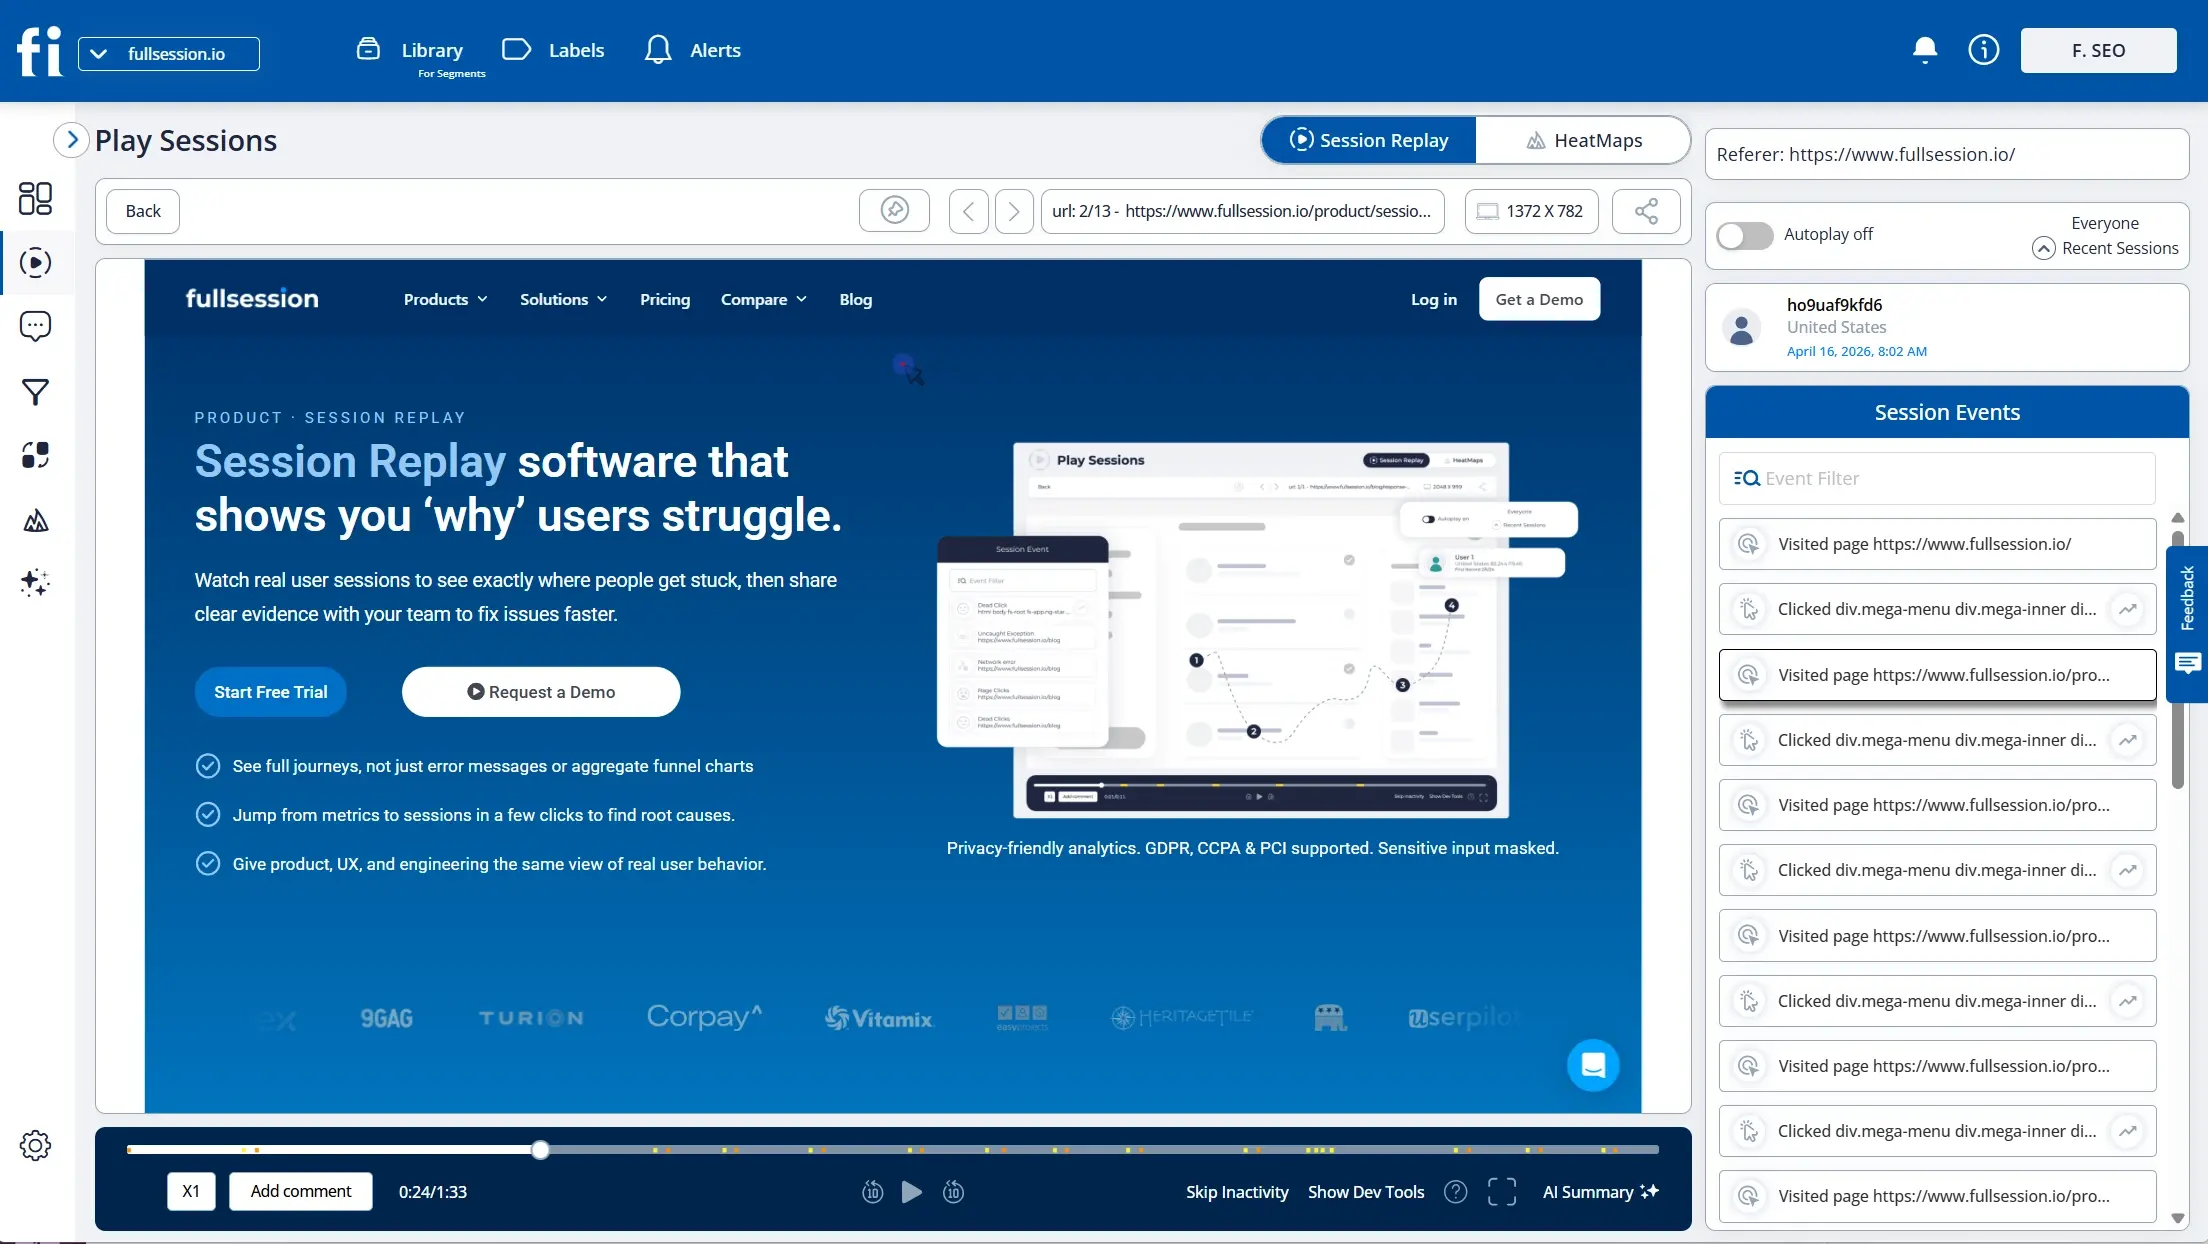
Second, see the cause. A funnel tells you where, not why. Open session replays of the users who dropped at that step and you will watch the reason happen: a confusing form, a price that surprises them, a button that does nothing, a mobile layout that hides the call to action. A cluster of rage clicks on a stuck control tells you people are trying and failing, which is expensive traffic bouncing off a fixable wall.
Third, confirm the scale. One replay is a story; a heatmap is the proof. It shows how many people hit the same friction point, so you can tell a rare edge case from a leak draining budget every day. Together these turn “CAC is up” into “the mobile checkout loses 18 percent of paid traffic at the payment step, here is the recording, here is the heatmap.” That is a fix you can prioritize and defend.
LOWER CAC ON THE TRAFFIC YOU ALREADY BUY
See exactly where paid visitors drop, and why
FullSession pairs conversion funnels, session replay, and heatmaps so a rising CAC leads straight to the on-site behavior behind it.
How to actually lower CAC
Once you can see the cause, the work sorts itself into a short list of moves that each push CAC down from a different direction.
Fix the highest-cost step first. Rank your funnel drops by how much paid traffic they cost, not by how easy they are to fix. FullSession’s Lift AI scores where friction is costing you the most conversions so you spend engineering time on the leak that moves CAC, not the one that is merely annoying.
Match the landing experience to the ad. Expensive clicks arrive with an expectation set by the ad. If the page does not deliver on it in the first few seconds, they leave and you paid for nothing. Replays of paid sessions show the mismatch faster than any bounce-rate chart. Teams focused here often start with the growth marketing workflow.
Ask the users who almost converted. Sometimes the funnel and the replay show the where and the how, but not the objection in the user’s head. In-page feedback at the moment of hesitation captures the “too expensive” or “I could not tell if this integrates with my stack” that no behavioral signal spells out.
Lift retention to lower effective CAC. CAC does not live alone. Raise lifetime value and you can afford a higher CAC, or hold CAC flat and widen the margin. Better activation and retention mean each acquired customer is worth more, which loosens the whole constraint. This is why activation-focused teams pair acquisition work with the PLG activation motion. If you want to put a number on the return, our guide to measuring the ROI of UX improvements shows how to tie a conversion lift back to dollars.
The most expensive leak in ecommerce: the checkout
Nowhere is the gap between reported and effective CAC wider than at the online checkout. Baymard Institute’s ongoing research puts the average documented cart abandonment rate at 70.22 percent, which means roughly seven in ten shoppers who signaled real intent still leave before paying. Every one of them was acquired at full cost. The click was paid for, the interest was real, and the sale evaporated at the last step.
That makes checkout the single highest-return place to attack CAC in ecommerce. A funnel scoped to the cart and payment steps shows where abandonment concentrates, replay shows the surprise shipping cost or the coupon field that sends people hunting elsewhere, and a heatmap confirms whether the trust signals and payment options are even being seen. Recovering a few points of checkout completion drops effective CAC across every channel feeding that store at once. Teams working this problem tend to start with the checkout recovery workflow, and our piece on the funnel drop-off pattern goes deeper on the diagnosis.

Pull these threads together and CAC stops being a number you react to at the end of the quarter. You buy traffic, you watch where it leaks, you fix the step that costs the most, and you recover cost per customer from conversion instead of chasing it with more budget. The teams with the lowest CAC are rarely the ones spending the least. They are the ones wasting the least of what they spend.
Turn rising acquisition costs into recoverable conversions
Visualize, analyze, and act on real user behavior with FullSession. See where paid traffic drops, fix the step that costs the most, and lower CAC without a bigger budget. No credit card needed to start.
Customer acquisition cost: FAQ
What is customer acquisition cost (CAC)?
Customer acquisition cost is the total sales and marketing spend it takes to win one new customer over a set period. You calculate it by dividing that spend by the number of new customers acquired in the same window. It is different from the accounting idea of acquisition cost, which is the capitalized cost of buying an asset. CAC measures how efficiently you turn budget into customers, and it only makes sense when read next to customer lifetime value.
How do you calculate CAC?
CAC equals total sales and marketing costs divided by the number of new customers acquired in the same period. Fully loaded CAC adds salaries, ad spend, software, and creative costs, not just media. Spend 60,000 dollars in a quarter and win 200 customers, and your CAC is 300 dollars. Measure paid CAC and blended CAC separately, because a healthy blended number can hide one paid channel that is losing money.
What is a good CAC by industry?
It varies widely by business model. First Page Sage’s 2026 data puts blended B2B CAC near 86 dollars in ecommerce, 239 dollars in B2B SaaS, 720 dollars in software development, and over 1,100 dollars in education. Across almost every industry, organic CAC comes in lower than paid CAC, which is why on-site conversion and retention matter as much as media budgets. Compare against your own segment rather than a single universal figure.
What is a good LTV to CAC ratio?
The widely used floor is 3 to 1, meaning a customer should return at least three times what it cost to acquire them. Below that, growth burns cash faster than it builds value. Well above it, you may be underspending and leaving growth on the table. Pair the ratio with CAC payback period: the old rule of thumb is to recover CAC within 12 months, though recent SaaS medians sit well beyond that.
How can behavior analytics lower CAC?
Your reported CAC is set when you spend, but your effective CAC is decided on-site, by how many of the visitors you paid for actually convert. Behavior analytics finds the leak and shows the cause: a funnel report pinpoints the step where paid traffic drops, session replay shows why users hesitate or abandon, and heatmaps confirm how many people hit the same wall. Fixing those raises conversion on traffic you already bought, which lowers CAC without adding budget.

Roman Mohren is CEO of FullSession, a privacy-first UX analytics platform offering session replay, interactive heatmaps, conversion funnels, error insights, and in-app feedback. He directly leads Product, Sales, and Customer Success, owning the full customer journey from first touch to long-term outcomes. With 25+ years in B2B SaaS, spanning venture- and PE-backed startups, public software companies, and his own ventures, Roman has built and scaled revenue teams, designed go-to-market systems, and led organizations through every growth stage from first dollar to eight-figure ARR. He writes from hands-on operator experience about UX diagnosis, conversion optimization, user onboarding, and turning behavioral data into measurable business impact.