Your Lighthouse score looks great. Your synthetic tests pass. And yet, users are still complaining. That gap is exactly what the best real user monitoring tools are built to close.
Unlike synthetic monitoring, which simulates user interactions in controlled environments, RUM captures what happens when real users hit your site on their actual devices, across their real network conditions and geographic location.
A good RUM tool doesn’t stop at page speed.
It tracks core web vitals, surfaces JavaScript errors, records session replays, and gives your team the performance data to fix what actually hurts users.
The best real-user monitoring tools make it straightforward to track performance across devices, browsers, and regions in production, not just in lab tests.
This guide reviews 10 RUM tools with a comparison table, honest per-tool breakdowns, and a clear recommendation.
Already know FullSession is the right fit? Book a demo and skip straight to it
Key Takeaways
- FullSession is the best for behavioral RUM, purpose-built for product and UX teams. It combines session replay, heatmaps, funnels, in-app feedback, error monitoring, and Lift AI in a single transparent-pricing subscription
- New Relic Browser is best for engineering teams already on the New Relic stack who need frontend RUM data correlated with backend APM traces without adding a separate tool.
- Datadog RUM is the go-to for enterprise teams that need end-to-end visibility from the browser session to the infrastructure, though the steep learning curve and session-based pricing add up quickly at scale.
- Dynatrace suits large enterprises that want AI-driven root cause analysis across the full stack automatically, without manual investigation, but pricing requires a sales conversation.
- Sentry is the best choice for developer teams who need to link frontend errors and performance regressions directly to code and backend traces without switching tools.
- LogRocket works well for product and engineering teams that prioritize high-fidelity session recordings and AI-powered issue triage, though heatmaps and funnels are locked behind the Professional plan.
- Raygun is ideal for teams with frequent release cycles who need to know immediately when a deployment introduces slow page loads or new errors in real user sessions.
- RobotAlp is a better fit for SEO-focused teams than general RUM users, since its primary value is actionable Core Web Vitals guidance tied to Google search performance.
- OpenReplay is the only self-hosted option on this list, making it the default pick for teams with strict data sovereignty or compliance requirements that rule out third-party tools.
- SpeedCurve is best for larger organizations that want to benchmark website speed against competitors and build internal alignment around performance, backed by expert coaching.
If your team needs behavioral analytics, session replay, heatmaps, funnels, error monitoring, and AI prioritization without stitching together multiple subscriptions, no tool on this list covers that ground as cleanly as FullSession does at a price that’s publicly listed and accessible without a sales call.
Ready to see it in action?Book a demo, and we’ll walk through your specific use case.
What Is Real User Monitoring?
Real user monitoring (RUM) is software that captures performance and behavioral data from actual users as they interact with your site or web applications in production.
A lightweight JavaScript snippet records what real users experience: page load times, Core Web Vitals scores, JavaScript errors, network request timings, and user interactions.
Modern RUM tools go well beyond raw speed.
The best platforms capture individual user sessions, track user journeys across pages, find frontend performance issues tied to specific devices or browsers, and alert you when something breaks.
Some connect that frontend data to backend logs and infrastructure signals so you can trace a problem from the browser all the way down to a slow database query.
The result is real user data that reflects actual conditions. You get a complete picture that no lab test can replicate.
RUM vs Synthetic Monitoring: What’s the Difference?
Synthetic monitoring runs scripted tests from controlled environments on a fixed schedule. It’s useful for uptime monitoring and catching regressions before a release, but it can’t tell you how a real user on a 4G connection in Denver experienced your checkout page last Tuesday.
Real user monitoring captures that.
It reflects actual visitors across every combination of device, browser, network, and geographic location. Most mature teams run both: synthetic tests catch problems early, and RUM confirms what’s actually happening in production.
| Real User Monitoring | Synthetic Monitoring | |
| Data source | Actual visitors in production | Scripted bots in data centers |
| What it captures | Real world user experience across all conditions | Controlled, repeatable test scenarios |
| Best for | Diagnosing real friction, errors, and performance trends | Pre-release checks, uptime monitoring |
| Limitation | Requires real traffic to generate data | Misses edge cases from real user behavior |
10 Best Real User Monitoring Tools Compared
Here’s a quick overview to help you compare data before diving into each tool. G2 ratings are from verified user reviews. Pricing reflects publicly listed starting rates where available.
| Tool | Free Tier | Mobile RUM | Self-Hosted | Data Retention (starting tier) | Compliance | Starting Price |
| FullSession | Yes (500 sessions) | iOS + Android | No | 30 days free / 4 mo Growth | GDPR, CCPA, PCI DSS | Free plan available; Professional from $279/mo |
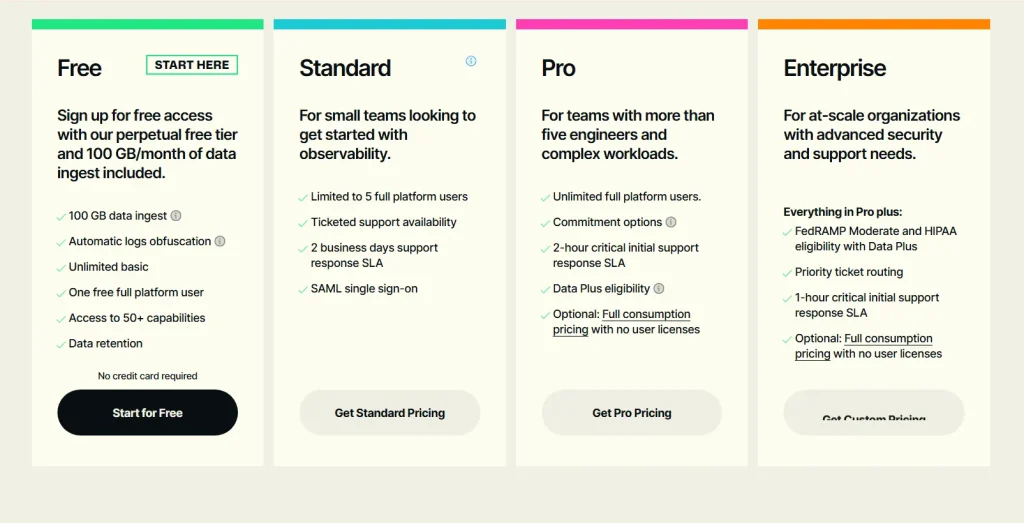
| New Relic Browser | Yes (100 GB telemetry) | Yes | No | 8 days standard | SOC 2, GDPR, HIPAA | $0.40/GB after free tier |
| Datadog RUM | No | iOS, Android, React Native | No | 15–30 days | SOC 2, GDPR, HIPAA, ISO 27001 | $1.50 / 1K sessions |
| Dynatrace | Trial only | Yes | Managed option | 35 days | SOC 2, GDPR, HIPAA, FedRAMP | $2.25 / 1K sessions |
| Sentry | Yes (5K errors) | Yes | Yes (self-hosted available) | 30–90 days | SOC 2, GDPR, HIPAA | $29/mo |
| LogRocket | Yes (1K sessions) | iOS + Android | Enterprise only | 1 month standard | SOC 2, GDPR, HIPAA | $99/mo |
| Raygun | 14-day trial | Yes | No | 30+ days | GDPR, HIPAA | $120/mo |
| RobotAlp | Trial only | Limited | No | Varies by credits | GDPR | $13.54/mo |
| OpenReplay | Yes (self-hosted) | iOS + Android | Yes (primary mode) | Configurable | Self-managed | $179/mo cloud |
| SpeedCurve | Trial only | Yes | No | 13 months | GDPR, SOC 2 | $90/mo |
How We Ranked These Tools
We evaluated each tool against six criteria that map to how teams actually use RUM in production:
- Data depth: Does it capture Core Web Vitals, JS errors, network requests, and user interactions, or just one slice?
- Workflow fit: How quickly can a non-engineer get from “something’s wrong” to a specific session, page, or fix?
- Integration with existing stacks: Does it correlate frontend data with backend APM, logs, or product analytics?
- Pricing transparency: Are tiers public, or does every answer require a sales call?
- Performance overhead: Does the SDK affect the metrics it’s supposed to measure?
- Privacy and compliance: GDPR, CCPA, PII masking, data residency, and self-hosting options.
G2 ratings are sourced from verified user reviews as of April 2026. Pricing reflects publicly listed starting rates at the time of writing; usage-based plans can vary significantly at scale.
The 10 Best Real User Monitoring Tools in 2026
Finding the right real user monitoring tool in 2026 means cutting through a crowded market of APM platforms, standalone session replay tools, and all-in-one behavioral analytics suites.
This breaks down the 10 best RUM tools so you can match the right platform to your team’s actual workflow.
1. FullSession
FullSession is an all-in-one platform, best for behavioral RUM, built for product, marketing, and engineering teams.
Unlike APM-first tools, it’s designed to answer not just where performance is slow, but where users interact with friction and what that friction costs you.
It combines session replay, interactive heatmaps, conversion funnels, in-app feedback, error and alert monitoring, and mobile session replay for iOS and Android in a single subscription.
Not ready to talk to sales?
Start a free trial and see the platform before you commit.
Best for
Product, UX, and e-Commerce teams that need to move from behavioral data to business decisions without juggling multiple tools.
Key features
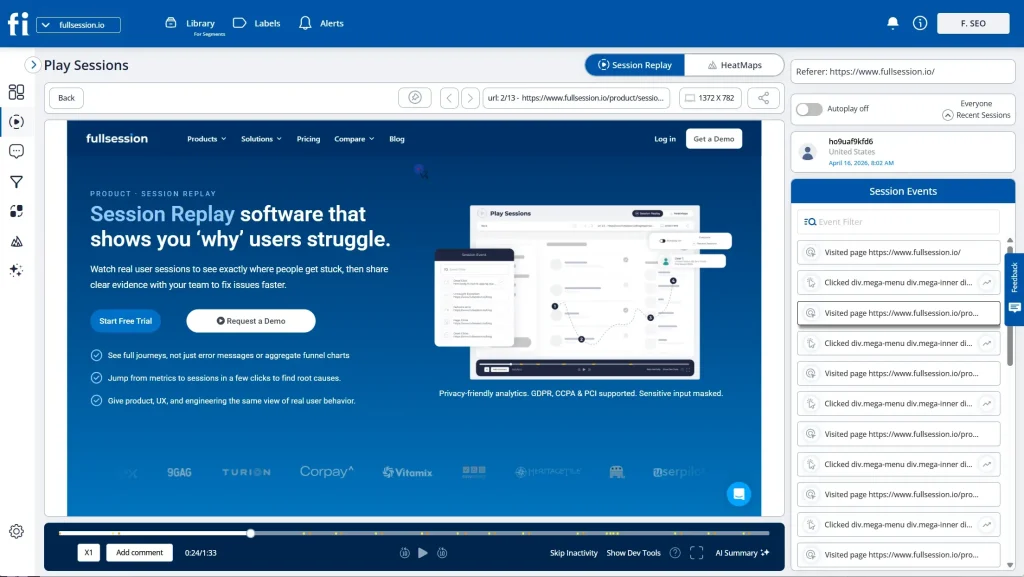
- Play Sessions interface gives instant access to individual user sessions with a timestamped events panel showing pages visited, elements clicked, and navigation path
- Interactive heatmaps visualize clicks, scroll depth, and attention across any page, linked directly to session replays for full context
- Lift AI scans behavioral data, ranks friction points by revenue impact, links each to the relevant session replays, and validates whether a fix worked after shipping
- Funnels and conversions measure drop-off at every step and find what’s blocking users from completing key actions
- Errors and alerts show rage clicks, broken flows, and JavaScript errors before they reach a support ticket
- In-app feedback collects user responses tied to specific sessions, so every piece of feedback has behavioral context behind it
- Mobile session replay for iOS and Android is included in the same platform, not sold separately
- SDK runs asynchronously on a separate thread, so your site’s Core Web Vitals stay untouched
Pricing
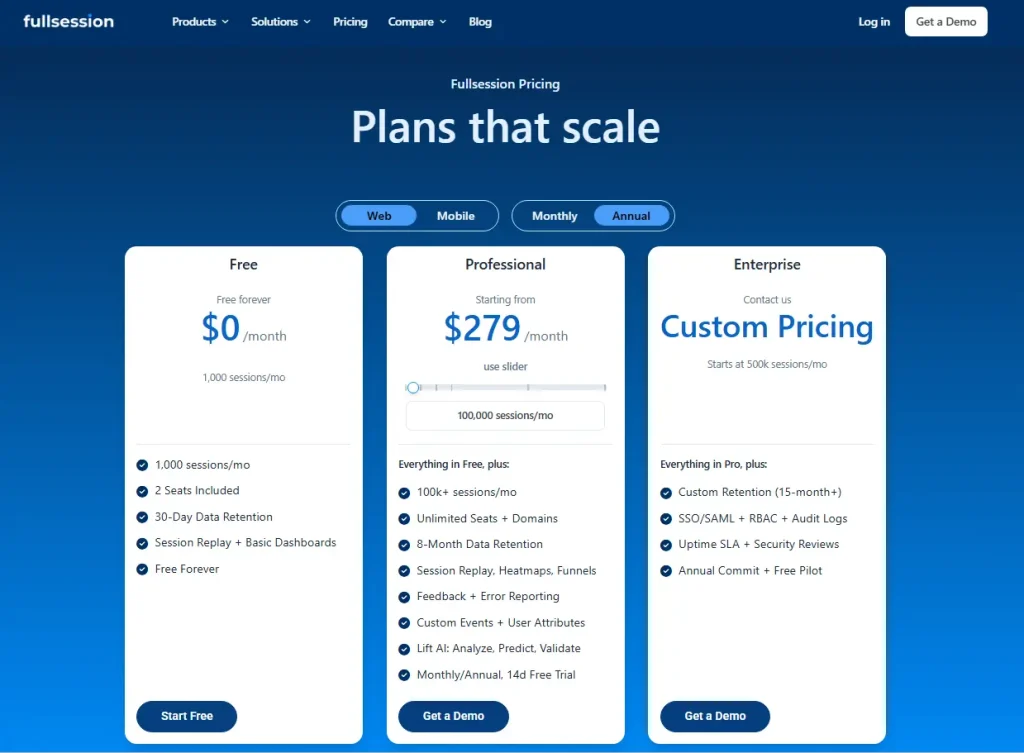
- Free plan: $0/month with 1,000 sessions/month, 2 seats included, 30-day data retention, session replay, and basic dashboards.
- Professional: Starts at $279/month with 100,000 sessions/month, unlimited seats and domains, 8-month data retention, session replay, heatmaps, funnels, feedback, error reporting, custom events, user attributes, and Lift AI.
- Enterprise: Custom pricing for teams starting at 500k sessions/month, with custom retention of 15+ months, SSO/SAML, RBAC, audit logs, uptime SLA, security reviews, annual commit, and a free pilot.
All plans include a 20% discount when billed annually.
All tiers are publicly listed on the pricing page.
Ready to see how FullSession handles your specific workflow?
2. New Relic Browser
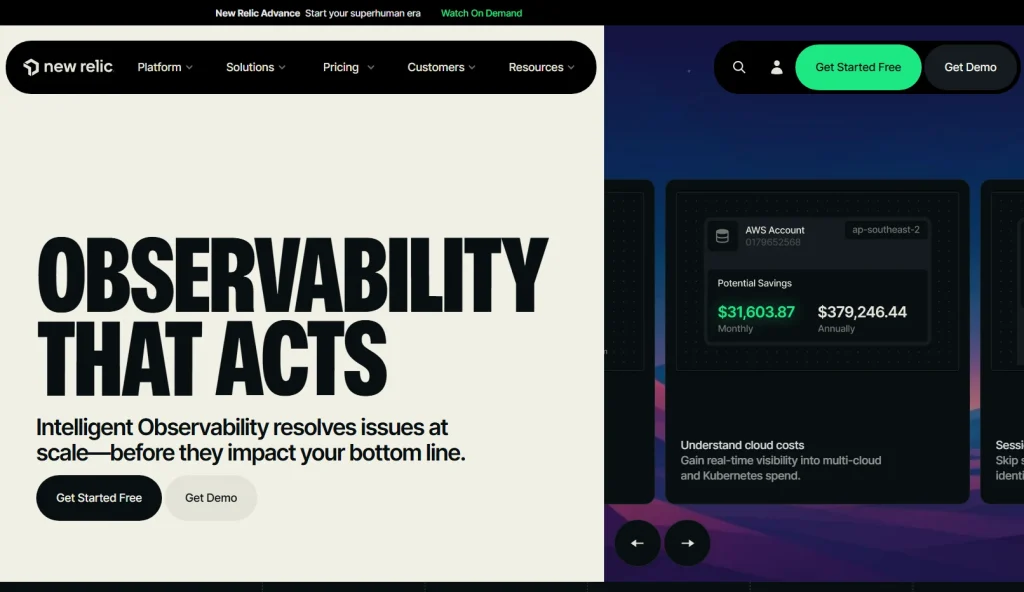
New Relic Browser correlates browser performance metrics with backend APM traces and infrastructure data, so engineering teams can trace a slow page load to the specific service or database query responsible.
Best for
Engineering teams already running New Relic for backend monitoring who want frontend RUM data in the same dashboard.
Key features
- Core Web Vitals tracking (LCP, CLS, INP) with segment filtering by browser, device, and geography
- JavaScript error tracking with stack traces tied to deployments and backend trace correlation
- Session replay and heatmaps available as an add-on, with configurable data masking for PII
- AJAX call monitoring with distributed tracing across the entire stack
Pricing
Free tier includes 100 GB/month of telemetry data, then $0.40/GB. Session replay is billed separately per replay. Pricing is not publicly available.
3. Datadog RUM
Datadog RUM is enterprise-grade digital experience monitoring built on a full-stack observability infrastructure.
What sets it apart from dedicated RUM tools is native integration with Datadog’s APM, log data, infrastructure monitoring, and synthetic tests, giving teams end-to-end visibility from the browser to the server.
The steep learning curve is real, but so is the depth.
Best for
Enterprise engineering teams that need to connect frontend user experience data with backend APM, logs, and infrastructure within a unified Datadog environment.
Key features
- Tracks core web vitals and page load times alongside custom metrics, with session replay as a separate add-on
- Full-stack correlation links frontend sessions to backend traces, log data, and infrastructure signals
- Mobile RUM for iOS, Android, and React Native, all managed in the same console
- Deployment tracking correlates error tracking and performance regressions with specific code releases
Pricing
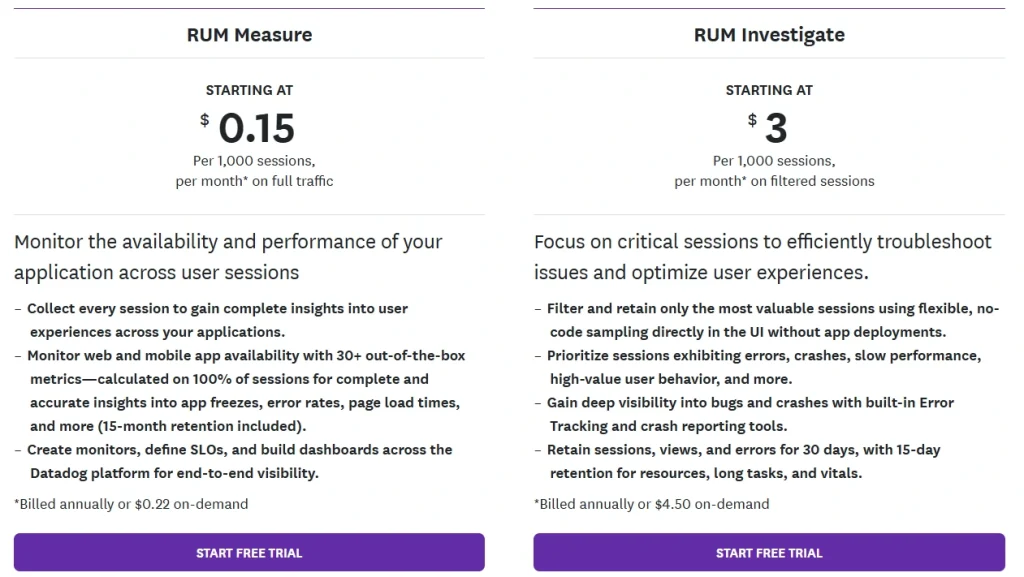
RUM from $1.50 per 1,000 sessions (billed annually).
Session replay is a separate add-on starting at $2.50 per 1,000 sessions per month.
No free tier. Costs can escalate quickly for high-traffic sites.
4. Dynatrace
Dynatrace is an AI-powered full-stack observability platform with enterprise RUM. Its Davis AI engine automatically shows root cause analysis across both the frontend and backend without requiring manual investigation.
In January 2026, Dynatrace added enhanced SPA support, soft navigation detection, and LLM-powered monitoring.
Best for
Large enterprise teams that need automatic AI-driven root cause analysis across the full technology stack, from browser interaction to database query.
Key features
- Core Web Vitals tracking including visual stability signals via cumulative layout shift, with SPA and soft navigation support
- Davis AI for automatic anomaly detection and problem correlation across frontend, backend, and infrastructure
- Grail data lakehouse links frontend RUM data with backend APM traces, transaction traces, logs, and security events
- Business performance monitoring connects performance degradation to revenue impact
Pricing
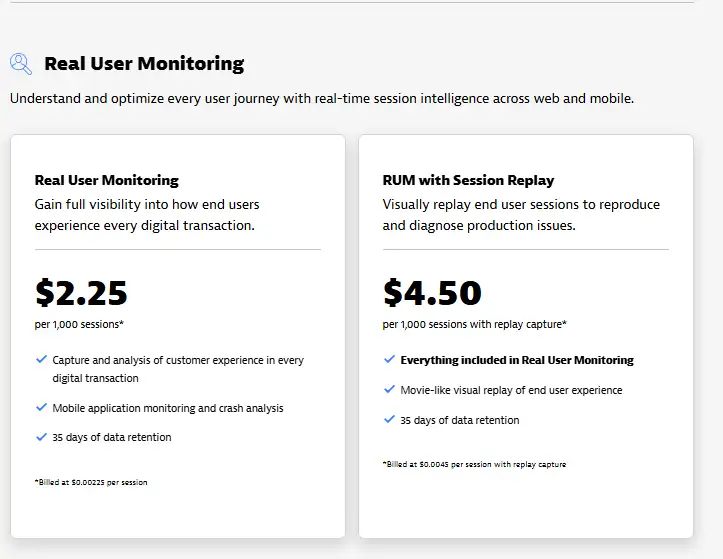
Dynatrace offers usage-based subscription, starting at $2.25 per 1,000 sessions per month.
Session replay billed separately and starts at $4.50 per replay capture.
Both plans include 35 days of data retention.
5. Sentry
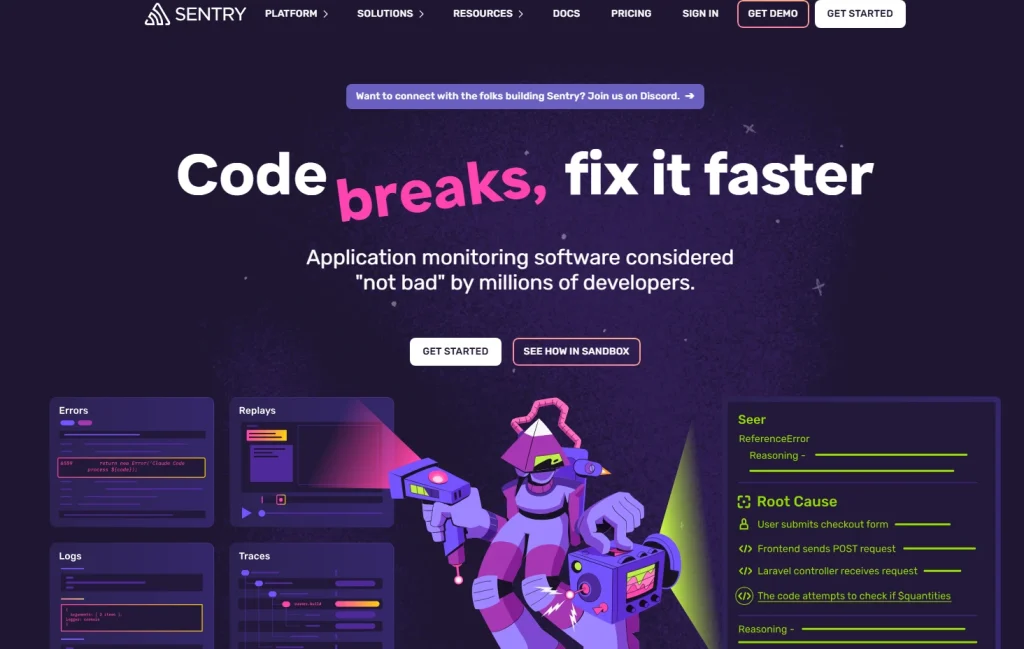
Sentry started as an error tracking platform and has expanded into performance monitoring with RUM and session replay. When a JavaScript error appears in production, Sentry links it to a stack trace, a source file, and a backend transaction trace so developers can debug without switching tools.
Best for
Developer and engineering teams who need to connect frontend errors and performance regressions directly to code, with full backend context.
Key features
- Core Web Vitals monitoring with performance score tracking and regression alerts
- JavaScript error tracking with stack traces, source map support, and transaction traces linking to backend services
- Session replay linked directly to error events, showing what the user experienced before a bug occurred
- A Free developer tier with performance monitoring and replay included in paid tiers
Pricing
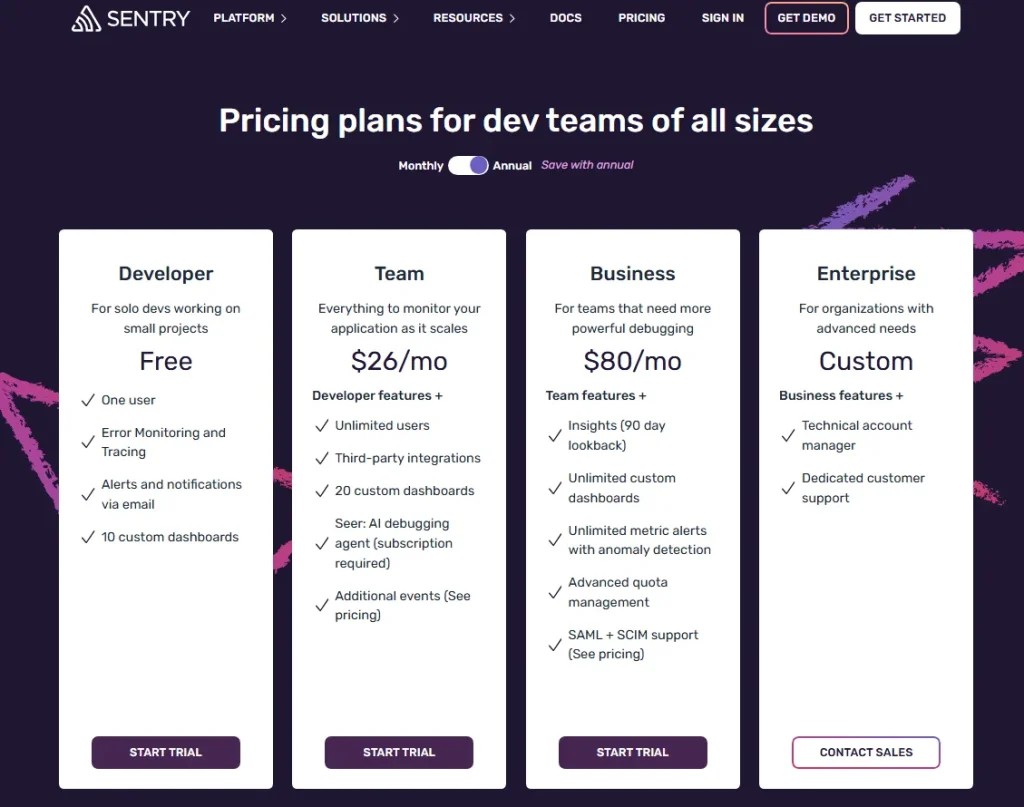
Free tier (5,000 errors/month). Team plan from $29/month.
6. LogRocket
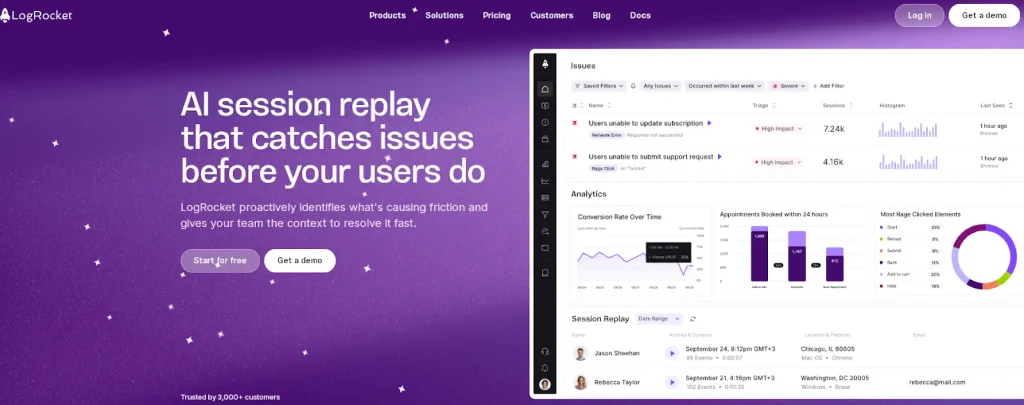
LogRocket is a session replay and frontend performance monitoring platform whose Galileo AI engine automatically identifies performance regressions and UX issues ranked by user impact. It’s strong for developer-heavy teams, though heatmaps and funnels are gated to the Professional plan.
Learn more about LogRocket competitors.
For a side-by-side breakdown, read FullSession vs LogRocket.
Best for
Product and engineering teams that need high-fidelity session recordings combined with AI-powered issue triage.
Key features
- Pixel-accurate session recordings with console logs, network requests, and Redux state captured alongside every replay
- Galileo AI surfaces performance insights and UX friction ranked by severity and user impact
- Core Web Vitals and page load time tracking with filtering capabilities for specific user segments
Pricing
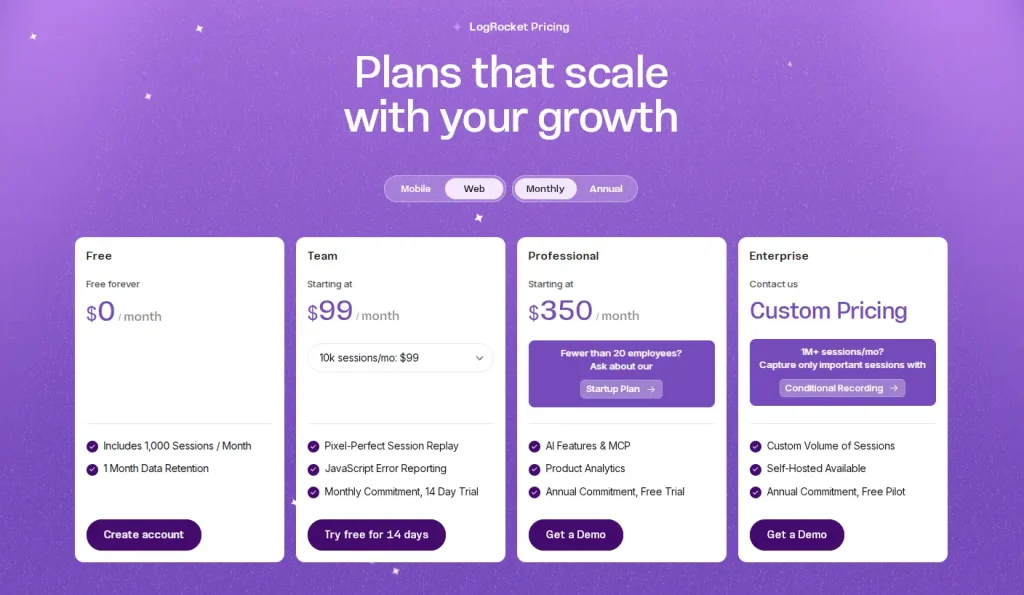
Free tier (1,000 sessions/month). Team from $99/month (10,000 sessions). Professional from $350/month.
See a full LogRocket pricing breakdown.
7. Raygun
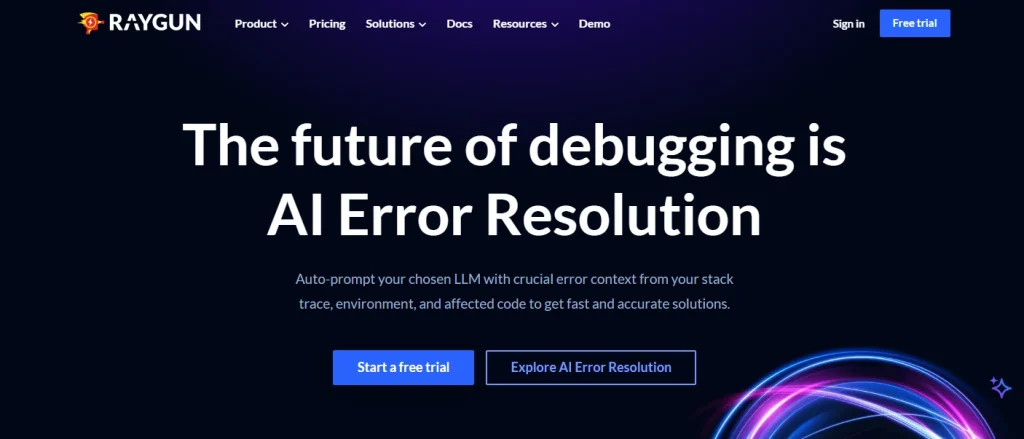
Raygun combines real-user monitoring, crash reporting and deployment-aware performance tracking. Its release monitoring flags performance regressions automatically after every deployment, so teams catch issues the moment a release ships rather than after user complaints accumulate.
Best for
Development teams with frequent release cycles who need immediate visibility into how a new deployment affects real user performance and error rates.
Key features
- Tracks core web vitals with filtering capabilities by geographic location, device, and browser
- Deployment tracking links performance trends to specific releases, flagging slow page loads and regressions immediately after a release ships
- Crash reporting and JavaScript error tracking for web and mobile, with actionable insights tied to affected sessions
- Real-time alerting on page load times, error rates, and user satisfaction thresholds
Pricing
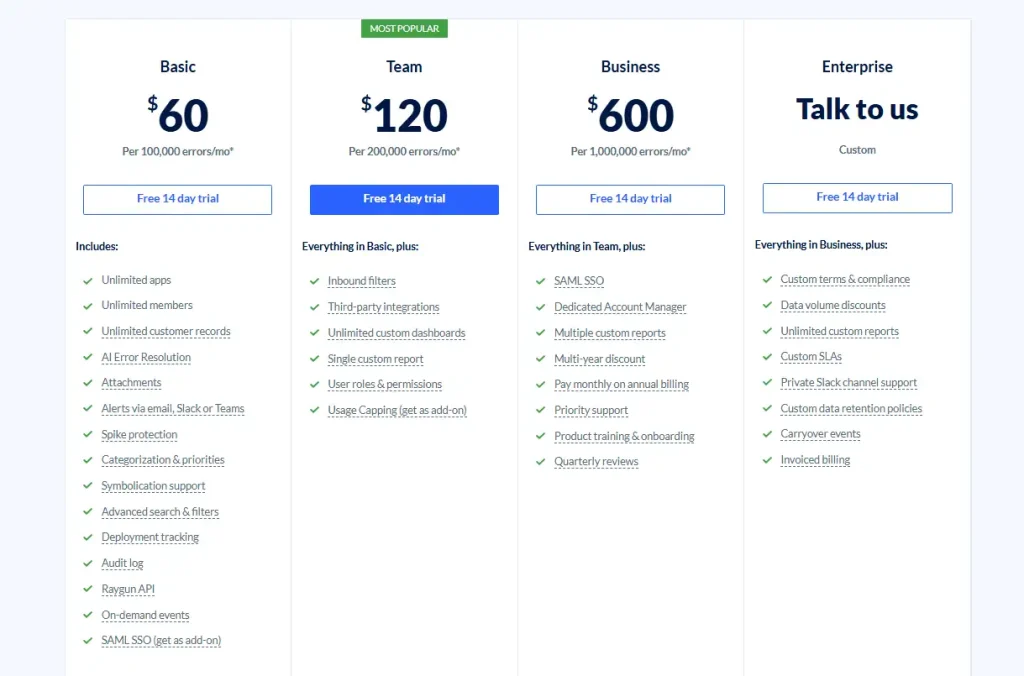
From $120/month for the Basic plan with 100,000 sessions/month. All plans include a 14-day trial.
8. RobotAlp
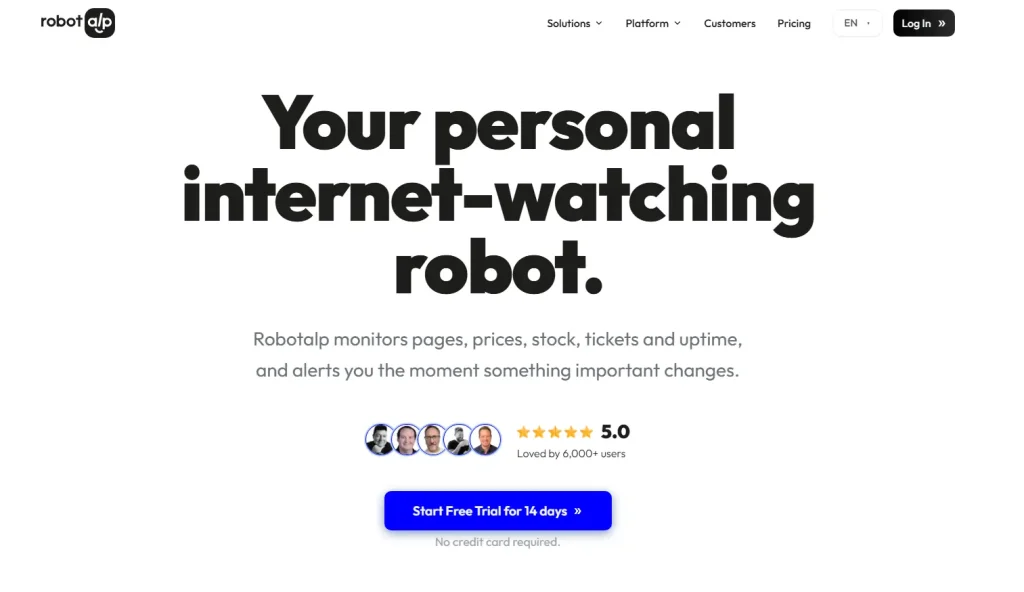
RobotAlp functions more like a Core Web Vitals advisor than a traditional RUM platform. It combines real user monitoring with actionable guidance on fixing LCP, cumulative layout shift, and INP issues.
It’s a good fit for teams whose primary reason to track website performance is Google search ranking rather than general performance debugging.
Best for
SEO-focused teams and agencies that need to monitor and improve Core Web Vitals scores as part of an ongoing search performance strategy.
Key features
- Real-time Core Web Vitals tracking with historical performance trends and regression alerts
- Actionable guidance on fixing cumulative layout shift, LCP delays, and INP issues, not just raw data
- Synthetic tests alongside real user data for a complete picture across controlled and production conditions
- Website speed benchmarking with threshold alerting and geographic segmentation
Pricing
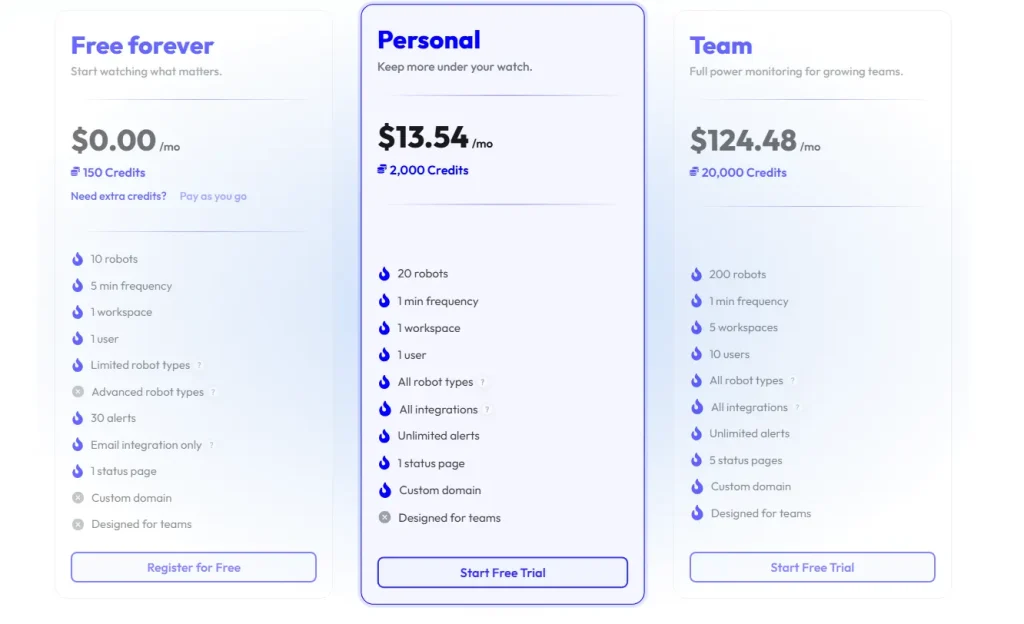
RobotAlp offers credit based pricing, starting at $13.54/month for 2,000 credits.
9. OpenReplay
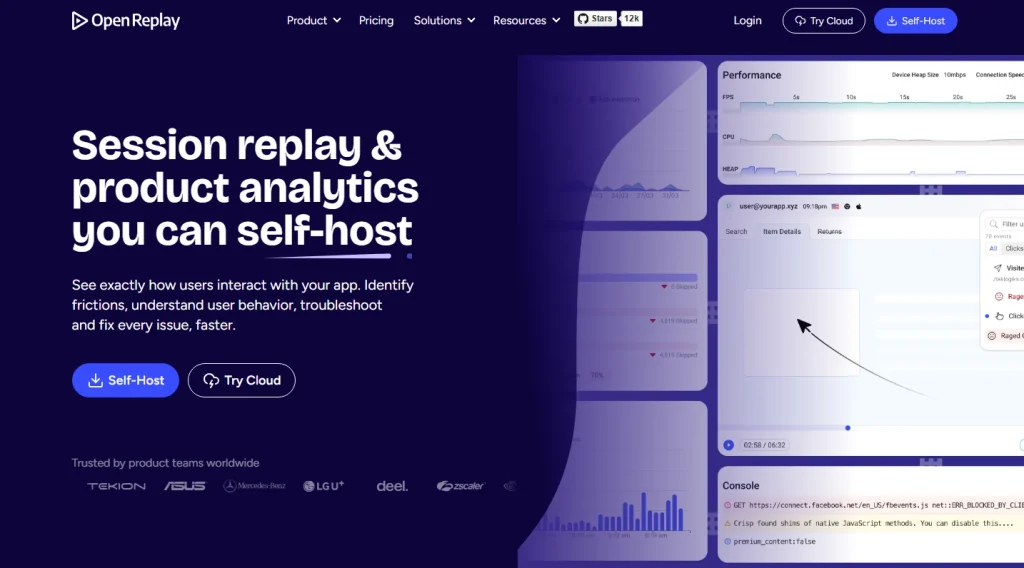
OpenReplay is the only open-source, self-hosted session replay and RUM platform on this list. It runs the entire stack on your own infrastructure, making it the default choice for organizations with strict data sovereignty requirements or compliance mandates.
Best for
Engineering teams at companies with strict data residency or compliance requirements who need full control over where user session data is stored.
Key features
- Full session replay with DOM reconstruction, console log capture, and network activity tracking
- Self-hosted deployment gives complete data sovereignty with no data sent to external servers
- Performance monitoring, including Core Web Vitals and custom metrics, alongside session recordings
- Cloud-hosted option available for teams that prefer SaaS without managing their own infrastructure
Pricing
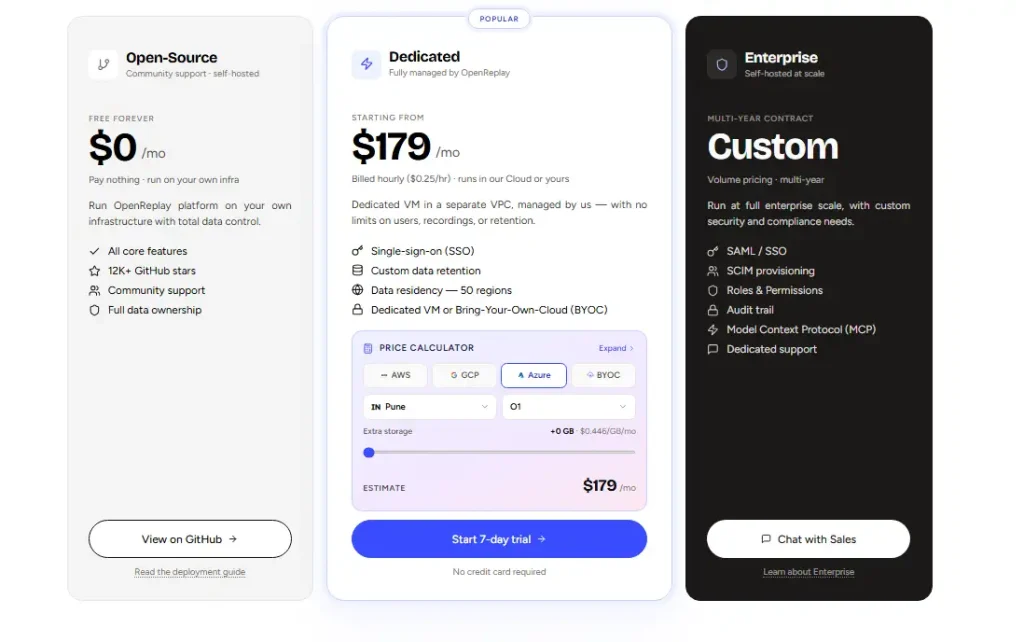
Free and open-source for self-hosted deployment.
Paid plans start from $179/month, billed hourly ($0.25/hr)
10. SpeedCurve
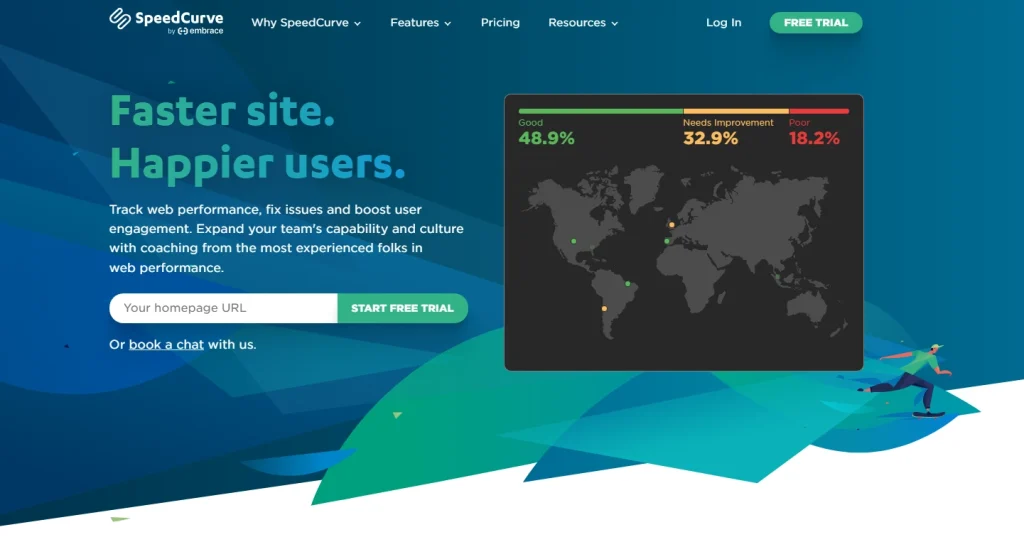
SpeedCurve combines real user monitoring with synthetic testing and competitive benchmarking, with a focus on building a performance culture rather than just surfacing data.
Performance experts work alongside the platform to help teams interpret RUM data, set budgets, and make the internal case for speed with non-technical stakeholders.
Best for
Performance-focused teams at larger organizations who need to benchmark website speed against specific competitors and build internal alignment around performance metrics.
Key features
- RUM tracking for Core Web Vitals and 100+ browser performance metrics with accessible visualizations
- Competitive benchmarking measures your site performance against specific competitor URLs in real time
- Synthetic monitoring with CI/CD integration, performance budgets, and pre-release regression detection
- Lighthouse scoring alongside real user sessions for a side-by-side lab vs. field data view
Pricing
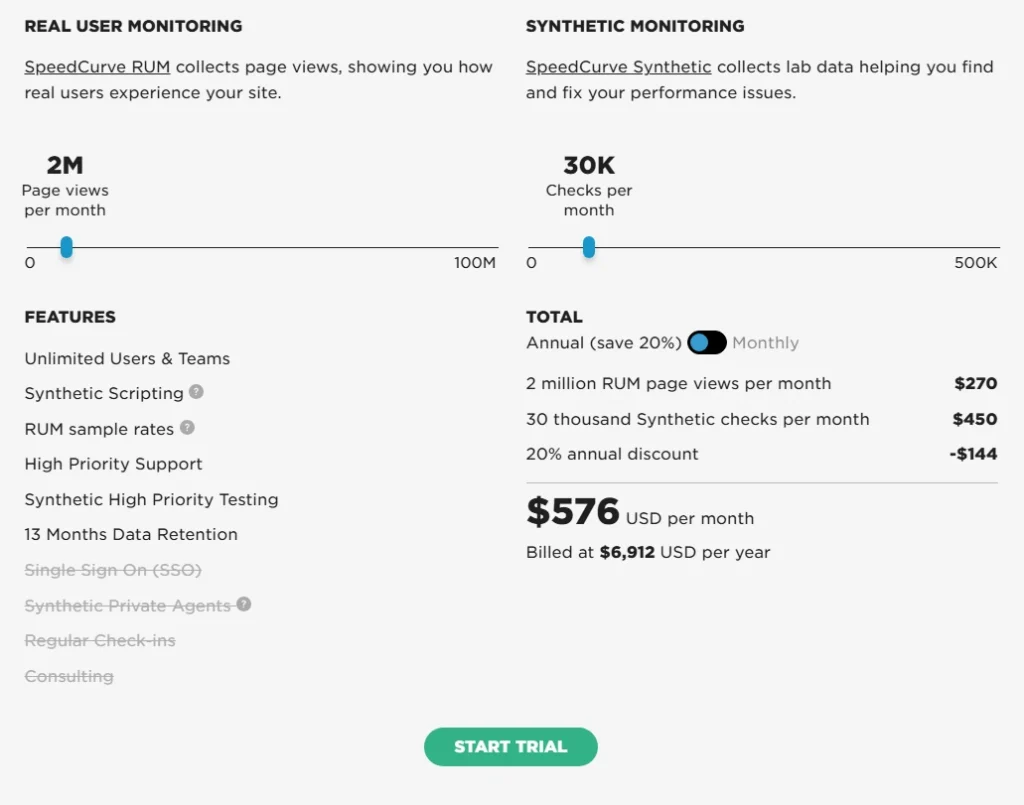
Premium tier based on monitored pages and data volume with monthly and annual billing.
Is FullSession the Best Real User Monitoring Tool?
There are strong tools in this category. Dynatrace is excellent for enterprise AIOps. Sentry is hard to beat for developer debugging. LogRocket is polished for session replay and issue triage.
But for teams that need to analyze data across behavioral signals, session replay, errors, and conversion funnels, all without managing multiple tools, FullSession stands out.
Everything in one subscription
Most teams cobble together three or four tools to cover what FullSession delivers as an all-in-one platform: session replay, interactive heatmaps, conversion funnels, error monitoring, in-app feedback, and mobile session replay.
Everything connects on the same dashboard from day one. No upgrades to unlock features you expected at signup.
Lift AI turns data into priorities
The gap between seeing a problem and knowing what to fix first is where most analytics tools fall short. Lift AI scans behavioral data, ranks friction points by expected revenue impact, and links each one directly to the session replays where the issue occurs.
When a fix ships, Lift AI validates whether it actually moved the needle. That’s a fundamentally different workflow from what most web analytics tools offer.
Accessible to the whole team
FullSession’s interface is clean enough for product managers, marketers, and customer success teams to get real user insights without pulling in engineering every time.
Filters, session search, and heatmap views deliver accurate insights in a few clicks, not a few hours of analysis.
Catch problems before users report them
Rage click detection and error alerts surface issues the moment they appear in real user sessions. Your team sees where actual visitors run into broken user actions and gets the context to fix them before a complaint is filed.
No performance penalty
FullSession’s SDK runs asynchronously on a separate thread, keeping your Core Web Vitals untouched. You get full behavioral coverage across web and mobile apps without the slowdown that heavier SDKs introduce.
That matters especially when using FullSession for checkout recovery, where even a small slowdown affects conversion rates.
Transparent pricing, no hidden tiers
The Growth plan starts at $23/month (billed annually) for 5,000 sessions, including heatmaps, funnels, feedback, and Lift AI. All tiers are publicly listed.
Most platforms charge separately for session replay, heatmaps, and error tracking. FullSession bundles everything at one transparent price.
Privacy and support built in
Sensitive form inputs are masked by default. GDPR, CCPA, and PCI DSS compliance come built in with no extra configuration. The Customer Success team responds personally and tracks integration requests. If a third-party integration is a blocker, raise it during your demo, and we’ll create it.
See how FullSession handles your specific use case. Book a demo.
Conclusion About the Best Real User Monitoring Tools
The right real user monitoring tool depends on your workflow, your tech environment, and what you need to measure.
- If you’re running a full enterprise observability stack, Datadog or Dynatrace fit cleanly.
- If error debugging is the daily priority, Sentry is a strong pick.
- If data sovereignty is non-negotiable, OpenReplay is the only self-hosted option worth evaluating.
For teams that want behavioral data, session replay, error detection, AI prioritization, and mobile RUM in a single platform with transparent pricing, FullSession is the clearest fit on this list.
The fastest way to know is to see it. Book a demo for a walkthrough of your specific workflow, or start a free trial with no credit card required.
FAQs About the Best Real User Monitoring Tools
Is RUM the same as APM?
No. APM (application performance monitoring) tracks backend services, databases, and infrastructure. RUM tracks what real users experience in the browser or mobile app: page load times, Core Web Vitals, JavaScript errors, and user interactions.
Most mature teams run both. Some platforms, like Datadog, Dynatrace, and New Relic, combine the two; others, like FullSession, Sentry, and LogRocket, focus on the frontend layer with optional backend hooks.
What is the alternative to Datadog real user monitoring?
The most common alternatives are FullSession, LogRocket, Sentry, and New Relic. FullSession is the top choice for teams who want behavioral analytics and performance monitoring without Datadog’s enterprise pricing or steep learning curve. For teams that need backend correlation at a lower cost, New Relic’s free tier is worth evaluating.
Which APM tool is best?
For full-stack APM, Datadog and Dynatrace lead the category. For teams whose primary need is frontend performance and behavioral analytics rather than full APM, FullSession delivers more targeted value at a lower price. The right answer depends on whether you need infrastructure-level visibility, user-level behavioral insight, or both.
What are the 5 types of monitoring?
The five core types are:
Infrastructure monitoring (servers, containers, cloud)
APM (backend services, transaction monitoring, latency)
Real user monitoring (RUM) (frontend behavior and performance data from actual users)
Synthetic monitoring (scripted tests in controlled environments)
Log data monitoring (collecting and analyzing log output from applications and systems)
What is the difference between RUM and synthetic monitoring?
RUM captures performance and behavioral data from actual users in production, reflecting what real visitors experience across their actual devices, browsers, and network conditions. Synthetic monitoring simulates user interactions from controlled environments on a schedule. RUM gives you ground truth on real-world user experience; synthetic gives you consistency and early warning.
How much does real user monitoring cost?
Pricing falls into three tiers. Behavioral RUM platforms like FullSession start around $23/month for small teams. Standalone session replay and developer-focused tools like Sentry and LogRocket sit between $29 and $99/month.
Enterprise observability suites like Datadog and Dynatrace are usage-based, typically $1.50–$2.25 per 1,000 sessions, with session replay billed separately. Most platforms offer a free tier or trial, so test before committing.

Roman Mohren is CEO of FullSession, a privacy-first UX analytics platform offering session replay, interactive heatmaps, conversion funnels, error insights, and in-app feedback. He directly leads Product, Sales, and Customer Success, owning the full customer journey from first touch to long-term outcomes. With 25+ years in B2B SaaS, spanning venture- and PE-backed startups, public software companies, and his own ventures, Roman has built and scaled revenue teams, designed go-to-market systems, and led organizations through every growth stage from first dollar to eight-figure ARR. He writes from hands-on operator experience about UX diagnosis, conversion optimization, user onboarding, and turning behavioral data into measurable business impact.